20131117 第7回valuation勉強会
TRANSCRIPT

Valuation in FED
2013/11/17(Sun) 1

自己紹介
• 名前
• 所属
• 勉強会に参加したきっかけ
2

3
Contents
• Part1 Foundations of Value
• Part2 Core Valuation Techniques
• Part3 Intrinsic Value and the Stock Market
• Part4 Managing for Value
• Part5 Advanced Valuations Issues
• Part6 Special Situations

Review of previous studied contents
4

5
Contents
• Part1 Foundations of Value
• Part2 Core Valuation Techniques
• Part3 Intrinsic Value and the Stock Market
• Part4 Managing for Value
• Part5 Advanced Valuations Issues
• Part6 Special Situations

What is value In the context of valua3on and
in your life ?
6

What is Value?
• Value is defining dimension of measurement in a market economy.
• Value is a particularly helpful measure of performance because it takes into account the long-term interests of all the stakeholders in a company,not just shareholders.
• Competition among value-focused companies also helps to ensure that capital,human capital,and natural resources are used efficiency across the economy,leading to higher living standards for everyone.
7
(P3)

Fundamental principles of corporate finance
Companies create value by investing capital to generate future cash flow at rate of return that exceed their cost of capital. (P17)
8

Two core principles of value creation
• The combination of growth and return on invested capital(ROIC) relative to its cost is what drives value. – Companies can sustain strong growth and high returns
on invested capital only if they have a well-defined competitive advantage.
• Conservation of value – Anything that doesn't increase cash flow doesn't create
value. – M・M theory
9
(P4)

10
Growth and ROIC:Drives of Value
Return on investment capital
Revenue growth
Cash flow
Cost of of Capital
Value

11
Contents
• Part1 Foundations of Value
• Part2 Core Valuation Techniques
• Part3 Intrinsic Value and the Stock Market
• Part4 Managing for Value
• Part5 Advanced Valuations Issues
• Part6 Special Situations

12
Part2 Core Valuation Techniques
6. Framework for Valuation 7. Reorganizing the Financial Statements 8. Analysand Performance and Competitive Position 9. Forecasting Performance 10. Estimating Continuing Value 11. Estimating the Cost of Capital 12. Moving from Enterprise Value to per Share 13. Calculating and Interpreting Results 14. Using Multiple

13
Framework for DCF-Based Valuation
EXHIBIT 6.1 Model Measure Discount factor Assessment
Enterprise discounted cash flow Free cash flow Weighted average
cost of capital Works best for projects, business units, and companies that manage their capital structure to a target level.
Discounted economic profit Economic profit Weighted average
cost of capital Explicity highlights when a company creates value.
Adjusted present value Free cash flow Unlevered cost of equity Highlights changing capital structure more
easily than WACC-based models.
Capital cash flow Capital cash flow Unlevered cost of equity
Compresses free cash flow correctly because capital structure is embedded within the cash flow.Best used when valuing financial institutions.
Equity cash flow Cash flow to equity Levered cost of
equity Difficult to implement correctly because capital structure is embedded within the cash flow. Best used when valuing financial institutions.
(P104)

14
Home Depot:Enterprise DCF
Forcaset year Free cash flow($ million)
Discount factor(@ 8.5%)
Present value of FCF
(& million)2009 5,909 0.922 5,448
2010 2,368 0.850 2,013
2011 1,921 0.784 1,506
2012 2,261 0.723 1,634
2013 2,854 0.666 1,9022014 3,074 0.614 1,889
2015 3,308 0.567 1,874
2016 3,544 0.522 1,852
2017 3,783 0.482 1,822
2018 4,022 0.444 1,787Continuing value 92,239 0.444 40,966Present value of cash flow 62,694
Midyear adjustment factor 1.041 Value of operations 65,291
Value of excess cash -Value of long-term investments 361Value of tax loss carry-forwards 112Enterprise value 65,764
Less:Value of debt (11,434)Less:Value of capitalized operating leases (8,298)Equity value 46,032
Number of shares outstanding(December 2008) 1.7 Equity value per share 27.1
Forecasting performance
Estimating Continuing Value

15
Enterprise valuation of a multibusiness company
Unit A Unit B Unit C Corporate center
Value of operations
Nonoperating assets
Enterprise Value
Value of debt
Equity Value
Exhibit6.3 P106
Value of operating units
200
30
560
125
200
225
520
40
360

16
Contents
• Part1 Foundations of Value
• Part2 Core Valuation Techniques
• Part3 Intrinsic Value and the Stock Market
• Part4 Managing for Value
• Part5 Advanced Valuations Issues
• Part6 Special Situations

Part3 Intrinsic Value and the Stock Market
15 Market value tracks return on invested capital and growth 16 Markets value substance, not form 17 Emotions and mispricing in the markets 18 Investors and managers in efficient markets
17

Research Findings
• Valuation levels for the stock market as a whole clearly reflect the underlying fundamental performance of companies in the real economy.
• Companies with higher ROIC and those with higher growth are valued more highly in the stock market.
• Over the long term(10 years and more), higher ROIC and growth also lead to higher total returns to shareholders(TSR) in the stock market.
• Whether increasing revenue growth or return on capital will create more value depends on the company’s performance.
18

Markets value substance, not form
• Managers can go to great lengths to achieve analysts’ expectations of EPS or to smooth earnings from quarter to quarter.
• Stock markets are perfectly capable of seeing the economic reality behind different forms of accounting information.
• Since investors value substance over form, managers need not worry about whether their share are spilt into smaller shares, traded in one or many developed stock markets, or included in a large stock market index.
19

Patterns in mispricing
• Individual company share price deviate significantly from the company’s fundamentals value only in rare circumstances.
• Market wide price deviations from fundamental valuations are even less frequent, although they may appear to be becoming more so.
• Price deviation from fundamentals are temporary(typically three years).
20

The implication of market efficiency for managers
• Managers should focus on driving return on ROIC and growth to create maximum value for shareholders.
• Managers need to understand their investor base, so they can communicate their company’s strategy for value creation effectively to different investor segments.
• Managers should not be distracted from their efforts to drive ROIC and growth by any short-term price volatility.
21

22
Contents
• Part1 Foundations of Value
• Part2 Core Valuation Techniques
• Part3 Intrinsic Value and the Stock Market
• Part4 Managing for Value
• Part5 Advanced Valuations Issues
• Part6 Special Situations

Part4 Managing for Value
• Chap19 Corporate Portfolio Strategy
• Chap20 Performance Management
• Chap21 Mergers and Acquisitions
• Chap22 Creating Value through Divestitures
• Chap23 Capital Structure
• Cahp24 Investor Communications
23

Constructing the portfolio
1. Determine the company’s current market value, and compare it with the company’s value as is.
2. Identify and value opportunities to improve operations internally. – By increasing margins, accelerating core revenue growth, and improving capital efficiency.
3. Evaluate whether some business should be divested.
4. Identify potential acquisitions or other initiatives to create new growth, and improving on value.
5. Estimate how the company’s value might be increased through changes in its capital structure or other financial strategy changes.
24

Constructing the portfolio
25 P420

Value Creation Tree
26
Exhibit20.1 Value creation tree
P431

Short term value drivers
• Short-term value drivers are the immediate drivers of historical ROIC and growth.
27
Sales productivity
Operating cost productivity
The drivers of recent sales growth, such as price and quantity sold, market share, the company’s ability to charge higher prices relative to peers, sales force productivity
Capital productivity
The drivers of unit costs, such as the component costs for building an automobile or delivering a package.
How well a company uses its working capital(inventories, receivables, and payables) and its property, plant , and equipment

Medium-term value drivers
• Medium-term value drivers look forward to indicate whether a company can maintain and improve its growth and ROIC.
28
Commercial health
Cost structure health
Whether the company can sustain or improve its current revenue growth. The company’s product pipeline, brand strength, customer satisfaction
Asset health
Company’s ability to manage its costs relative to competitors over three to five years.
How well a company maintains and develops its assets.

Long term strategic value drivers and Organizational health
• Long term strategic value drivers – The ability of an enterprise to sustain its current operating
activities and to identify and exploit new growth areas.
• Organizational health – Whether the company has the people, skills, and culture to
sustain and improvement
29

Value creation framework
• Acquisitions create value when the cash flows of combined companies are greater than they would have otherwise been.
30
Value Created for Acquirer= Value received – Priced Paid
Value Created for Acquirer= (Standard Alone value of target) +Value of performance improvements) −(Market Value of target+Acquisition premium)

Part4 Managing for Value
• Chap19 Corporate Portfolio Strategy
• Chap20 Performance Management
• Chap21 Mergers and Acquisitions
• Chap22 Creating Value through Divestitures
• Chap23 Capital Structure
• Cahp24 Investor Communications
31

Part4 Managing for Value
• Chap19 Corporate Portfolio Strategy
• Chap20 Performance Management
• Chap21 Mergers and Acquisitions
• Chap22 Creating Value through Divestitures
• Chap23 Capital Structure
• Cahp24 Investor Communications
32

パナソニック、プラズマ撤退を正式発表 プラズマテレビも販売終了
• パナソニックは10月31日、プラスマディスプレイパネル(PDP)生産からの撤退を正式発表した。12月に生産を終了し、来年3月末に生産拠点の事業活動を停止する。「事業環境の急激な変化と薄型ディスプレイ市場におけるPDP需要の減少などにより、事業継続は困難であると判断した」としている。
• 民生用プラズマテレビや電子黒板などPDP関連製品の販売は2013年度モデルで終了。今後は「民生用、業務用ともに各製品に適したディスプレイパネルを広く求め採用していく」という。
33 http://www.itmedia.co.jp/news/articles/1310/31/news116.html

三洋電機、デジカメ事業売却発表 来年3月に
• パナソニック子会社の三洋電機は21日、デジタルカメラ事業を国内投資ファンドのアドバンテッジパートナーズ(AP)に来年3月31日付で売却すると発表した。売却額は公表していない。三洋は自社ブランドを持たず、国内外大手にデジカメをOEM(相手先ブランドによる生産)供給する。一時は生産台数で世界首位だったが、市場縮小で損益が悪化していた。
• デジカメ子会社の三洋DIソリューションズ(大阪府大東市)の全株式と傘下のインドネシア工場を、APが出資する特別目的会社に売却する。三洋DIの約700人と、インドネシア工場の従業員約4000人の雇用は今後検討する。
• 三洋は1995年にデジカメ事業に参入し、OEM供給を始めた。「ザクティ」など自社ブランドも展開したが、主にオリンパスやニコンなどへのOEM供給で生産台数を伸ばした。99年には生産台数のシェアが3割を突破し、世界首位を握った。「デジカメ」の商標も三洋が持つ。
34
2012/12/22付 日経

Creating Value through divestitures
• What evidence is there that divestitures create value, and what drives that value creation?
• What is an effective approach to deciding on divestitures transactions?
• How should management choose the specific type of transaction for a divestiture?
35

Divestiture tend to occur in waves
36
1960s and 1970s
1980s
1990s
2000s
The conglomerate excesses
Many companies focused their portfolios. These divestitures were sales to companies or private buyout firms
The divestiture wave included more public owner ship transactions, such as spin-offs, carve- outs, and tracking stocks.
Public owner ship have become an established means for divesting business.

Exhibit 22 Divestiture volume vs M&A volume
37

Value creation from divestitures
• Because divestitures create value for corporations in the short term around the announcement, as well as over the longer term following the transaction, executives should focus on divestitures’ potential for creating value.
38

Evidence for value from divestitures
• A study of 370 private and public companies found significant positive excess returns around the announcement of different types of divestitures.
• 200 large U.S. companies over a 10 year period showed that companies with a passive portfolio approach(those did not sell business or only sold poor businesses under pressure) underperformed companies with an active portfolio approach.
• The best performers systematically divested as well as acquired companies.
39

Why divestitures create value?
• Divesting a business unit creates value when other owners believe the unit is worth more under their ownership than the sellers believe the business worth to themselves.
• Chapter19 introduced “best owner principle”. Business units can be worth more in another ownership structure because the current structure may impose costs on the parent and/ or business unit.
• Divestitures also may create value by taking advantage of information asymmetry.
– Certain executive may recognize early on that upcoming technological changes or a shift in consumer behavior will change the potential value of particular activities, so they decide to exit through a divestiture before others start to recognize these trend.
40

Cost to the parents and unit depressed exit price
41
Cost to the parents
Cost to the units
Depressed exit price
Stable units may remove the impetus to innovate, when this impetus might be a critical driver of success for other, small businesses in the portfolio.
All companies evolve through a life cycle, from start-up through expansion to maturity, and different skills an capability are needed to manage the business well at different moments in the cycle.
Companies that hold on to seriously underperforming business too long risk bringing down the value of the entire corporation.

Why executives shy away from divestitures
• Although an active portfolio approach recognize the value to be created from divestitures, most executives seem to shy away from an active approach.
• Almost 60% of the companies had executed two or fewer divestitures over the 10-year period.
• Many managers dislike divestitures because these transactions dilute corporate earnings. However, if another party is willing to pay more for the subsidiary than the value the parent company expects to extract, the divestiture will create and should be pursued.
42

Earnings dilution through divestitures
43

Why executives shy away from divestitures
• It is perhaps not surprising that a change in corporate leadership seems to be one of the key triggers for divestiture.
• Among the 200 companies researched, about half of their major divestitures took place in companies when the chief executive officer was fairly new.
44

How to approach divestitures
• Synergies and shared assets, services, or systems
• Financing and fiscal changes
• Legal, contractual, or regulatory barriers
• Pricing and liquidity of the assets
45

Deciding on transaction type
46
Forms of divestiture
Private transactio
n
Private transaction
Public transactio
n
Joint venture
Tracking stock
Spilt off
IPO
Carve out
Spin off (or demerger)
Sales of part or all of a business to a strategic or financial investor
A combination of part or all of a business with other industry players, other companies in the value chain, or venture capitalists
A separate class of parent shares that is distributed to exiting shareholders of the parent company through a spin-off or sold to new shareholders through a carve out
An offer to existing shareholders of the company to exchange their shares of the parent company for shares in the subsidiary
Sale of all shares of a subsidiary to new share holders in the stock market
Sale of part of the shares in a subsidiary to new shareholders in the stock market
Distribution of all shares in a subsidiary to existing shareholders of the parent company

Spin off
• Full separation maximize the strategic flexibility of the subsidiary, provides the greatest freedom to improve operations by sourcing from more competitive companies(instead of the former parent), and avoids conflicts of interest between the parent company and the business unit.
• Analysis of parent and subsidiary performance of a sample of spin-off transactions shows that the operating margin of a spun-off subsidiary improves by one-third on average during the three years after completion of the transaction.
• The positive performance of the subsidiaries is driven by focus-improving spin-off. Transactions that did not improve focus had mostly negative post transaction returns.
47

Exhibit 22.4 Long-term market performance of spin offs
48

Carve-outs
• Sometimes parent companies don’t want to give up control over a business unit. The reason could be a desire to maintain some synergies between parent and subsidiary or to shelter the subsidiary from market forces such as mergers and acquisitions.
• In our research, the majority of the carve-out entities did not last. Only 8% of the carve-out subsidiaries remained majority-controlled by the parents.
– The majority of the subsidiaries were spun off further, acquired, or merged with other players.
• The low market returns could have resulted from the subsidiary lacking the opportunity to maximize its potential under continued parent control, or the parent taking advantage of high market valuation levels at the time, without considering real ongoing benefits of full separation.
49
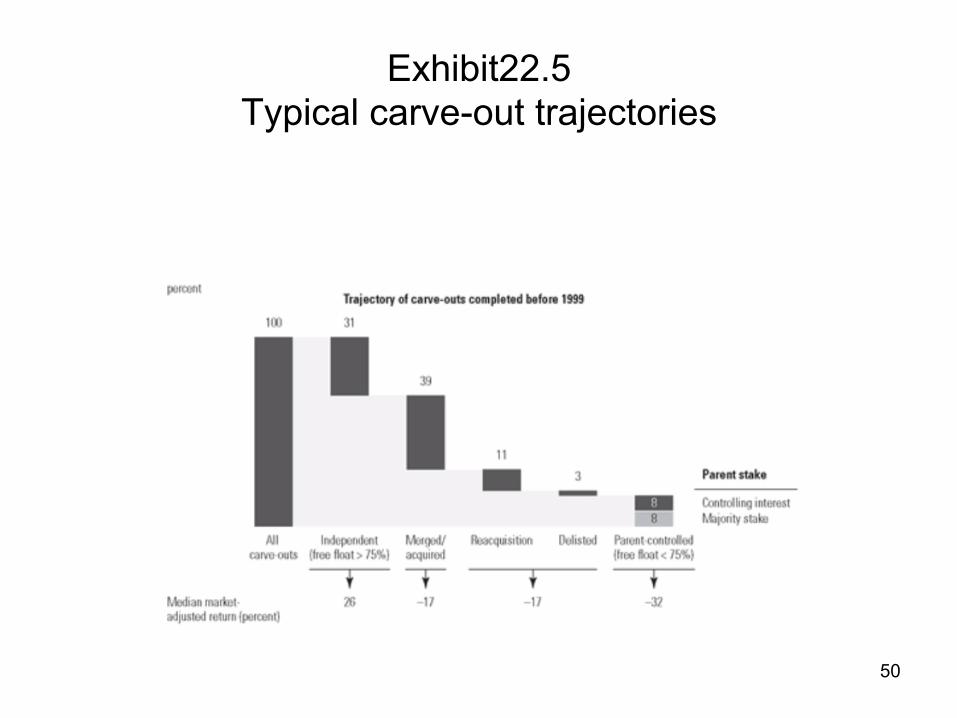
Exhibit22.5 Typical carve-out trajectories
50

Tracking stock
• Tracking stock offers a parent the advantage of maintaining control over a separated subsidiary, but it often complicates corporate governance.
• Tracking stock is used far less often than carve-out and spin-off transactions, implying that this form of ownership restructuring fails to bring the benefits executives are looking for.
51
Summary
• As business go through their life cycles, they pose new challenges to the structure of their parent corporation’s portfolio.
• Most corporations divest businesses only after resisting shareholder pressure. In delaying, they risk forgoing the potentially significant value they could create by taking an active approach to divestitures.
• Ideally, executives should an ongoing, proactive divestiture program to evaluate the corporate portfolio continually as its business evolve through their life cycles and the industry itself changes.
52

Variation in growth over product life cycle
53 Sustaining growth is difficult because most product markets have natural life cycles.
Exhibit5.4 (P90)

54
Exhibit 5.9 Unstable Growth for Industries (P96)
Top 5 industries 1967−1977
1. IT services 2. Software services 3. Broadcasting 4. Computers and peripherals 5. Paper Packaging
Top 5 industries 1997−2007 1. Integrated oil and gas 2. Health-care equipment 3. Energy equipment and services 4. Movies and entertainment

AT&T: Dynamics of ownership Restructuring
55

Part4 Managing for Value
• Chap19 Corporate Portfolio Strategy
• Chap20 Performance Management
• Chap21 Mergers and Acquisitions
• Chap22 Creating Value through Divestitures
• Chap23 Capital Structure
• Cahp24 Investor Communications
56
Capital structure
• Careful design and management of a company’s capital structure do more to prevent value destruction than to boost value creation.
• When managers make decisions about capital structure, they usually have much more to lose than to gain in terms of value.
• This chapter addresses the following topics in details. – The impact of capital structure on value creation for shareholders. – The role of credit ratings in capital structure decisions – Choosing the short-term steps to manage a capital structure – Establishing long-term capital structure targets – Creating value from financial engineeging
57

Trade offs in capital structure design
58
Tax savings
Reduction of corporate over
investment
Costs of business erosion and bankruptcy
The most obvious benefit of debt over equity is reduced taxes.
According to the free cash flow hypothesis, debt can help impose investment discipline on managers.
Higher levels of debt give rise to costs from business erosion.
Cost of investor conflicts
Higher leverage may cause additional loss of value as a result of conflicts of interesting among debt holders, shareholders, and managers, particularly through the measures that debt holders to take to protect their interests.

Impact of capital structure on value
59

Pecking-order theory
• One of the causes of pecking order is that investors interpret financing decisions by managers as signals of a company’s prospect.
– Investors will interpret an equity issue as a signal that management belives shares are overvalued.
• The signaling hypotheses underling the pecking order theory are more relevant to financial managers in selecting timing specific funding alternatives than for setting long-term capital structure targets.
60
Using internal funds
Issuing debt Issuing debt

Is there an optimal capital structure
• Leverage matters less than we think – The costs of business erosion and investor conflicts will become significant and
offset some of the tax savings. – The expected value of any tax savings will itself decline because of the growing
probability that the company will not capture these savings in the first place.
• High leverage levels are unsustainable and more likely to destroy shareholder value, due to a high probability of business erosion, investor conflicts, and ultimately bankruptcy.
61

Setting an effective capital structure
• Peer group comparison – By analyzing what capital structure most companies in the peer group
have, you obtain at least some understanding of what a reasonable capital structure could be.
• Credit rating analysis
• Cash flow analysis – Each company will face specific challenges arising from its particular investment
needs, dividend policy, and other considerations.
62

Credit ratings and capital structure
1. Ratings are useful summary indicator of capital structure health.
2. Rating largely determine the company’s access to the debt markets.
3. Credit ratings are nowadays important elements in the communication to shareholder.
63

Exhibit23.4 Corporate bond ratings and default probabilities
64

Drivers of credit ratings: Coverage and size
• Empirical evidence shows that credit ratings are primarily related to two financial indicators. – Size in terms of sales or market capitalization – Interest coverage in terms of EBITA, EBITDA or debt divided by
interest expense.
65

Exhibit23.5 interest coverage explaining credit rating
66

Credit spreads from credit ratings
• From a company’s credit rating, you can estimate the interest rate payable on its debt funding.
67

Leverage and solvency versus coverage
• A leverage ratio measures the company’s ability to cover its interest payments over a very long term.
• Coverage indicates how easily a company can service its debt in the near term.
• Colvency becomes more relevant in times of financial distress, when a company’s creditor use it as a rough measure of the available collateral.
68

Short-term steps to manage capital structure
• Empirical analyses have demonstrated that companies actively manage their capital structure and stay within certain leverage boundaries.
• When managing their capital structures, companies need to take account of the transaction costs and signaling effects associated with different adjustments.
• For listed companies, capital structure decisions are complicated by the fact that they send the capital markets signals about a company’s prospect.
– Signal effects, coming on top of any effect on intrinsic value made by a change in capital structure , may dampen but could also amplify that effect.
69

Raising additional funds
70
Cutting dividends
Issuing equity
Issuing debt
Companies are extremely reluctant to cut dividends to free up funding for new investments, because the stock market typically interprets such reductions as a signal of lower future cash flow.
・Issuing equity is likely to lead to a drop in share prices in the short term. ・Because investors assume that managers have superior insights into the company’s true business and financial outlook, they believe managers issue equity only if a company’s shares are overvalued in the stock market.
・investors interpret the issuance of new debt much more positively than equity offering. ・Because companies commit to fixed future interest payments that can be withheld only at considerable cost, investors see the issuance of debt as a strong signal that future cash flows will be sufficient.
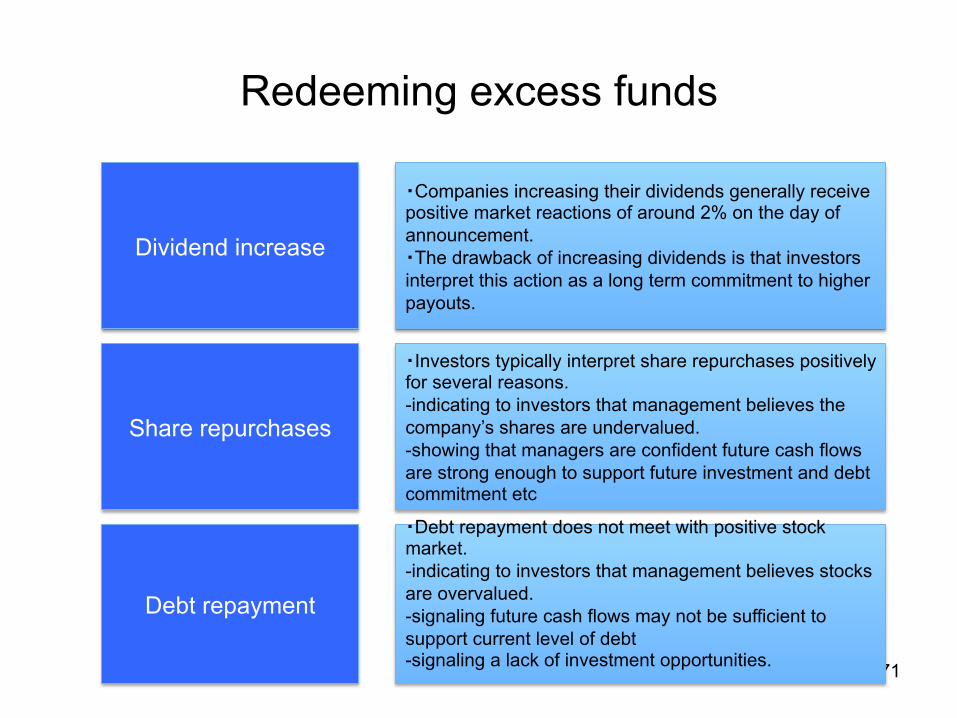
Redeeming excess funds
71
Dividend increase
Share repurchases
Debt repayment
・Companies increasing their dividends generally receive positive market reactions of around 2% on the day of announcement. ・The drawback of increasing dividends is that investors interpret this action as a long term commitment to higher payouts.
・Investors typically interpret share repurchases positively for several reasons. -indicating to investors that management believes the company’s shares are undervalued. -showing that managers are confident future cash flows are strong enough to support future investment and debt commitment etc
・Debt repayment does not meet with positive stock market. -indicating to investors that management believes stocks are overvalued. -signaling future cash flows may not be sufficient to support current level of debt -signaling a lack of investment opportunities.

Project funding surplus or deficit
• Estimate expected operating and investment cash flows
• Analyze exposure to business risks – Understand the uncertainty around the cash flow projections. The more cash
flows fluctuate across the business cycle, the more you should aim for a robust target capital structure.
• Scope potential for unexpected investment opportunities – A company can substantially outperform its competitors if it develops a
countercyclical strategic capital structure and maintains less debt than might otherwise be optimal.
• Project as-is financing surplus or deficit
72

Creating value from financial engineering
• Financial engineering – Managing a company’s capital structure for maximum
shareholder value with financial instruments beyond straight debt and equity
– Such as synthetic leasing , mezzanine finance, securitization, commodity-linked debt, commodity and currency derivatives, and balance sheet insurance.
73

Three basic tools of financial engineering
• Derivative instruments – With derivative instruments, such as forwards, swap, and
options, a company can transfer particular risks to third parties that can carry these risks at a lower cost.
• Off-balance-sheet financing – Operating leases, synthetic leases, securitization, and project
finance.
• Hybrid financing – Involving forms of funding that share some elements of both
equity and debt.
74

Part4 Managing for Value
• Chap19 Corporate Portfolio Strategy
• Chap20 Performance Management
• Chap21 Mergers and Acquisitions
• Chap22 Creating Value through Divestitures
• Chap23 Capital Structure
• Cahp24 Investor Communications
75

Investor communications
• The overriding objective of investor communications must be to align a company’s share price with management’s perspective on the intrinsic value of the company.
• While there are no formulas for achieving good investor communications, we find that companies can improve in several areas.
– Companies need to know whether there is a material discrepancy between their intrinsic value and their market value that their investor communications should aim to close.
– For companies to understand their investor base. – Many companies don’t tailor their communications to the investors who matter
most to their share price.
76

Intrinsic value vs Market value
• Senior executives often claim that the stock market undervalues or “doesn’t appreciate” their company.
• It should start with an estimate of the size of the gap, if any, between management’s view of the company’s intrinsic value and the stock market value.
• In practice, after some thoughtful analysis and probing, we typically find that no significant gap exists or that any gap can be explained by the company’s historical performance relative to shareholders’ expectations.
77

Understanding the investor base
• Shares of companies that have relatively high book value or earnings multiples are designated ”growth” stocks by agencies. Shares of companies outside this group are labeled “value” stocks by the investor community.
• Growth stocks do have higher ROICs than value stocks. The distributions across revenue growth levels are similar, whereas the distributions across ROIC levels are markedly different.
78

Revenue growth decay analysis
79 Growth decays very quickly;high is not sustainable for the typical company.
Exhibit5.10 (P97)

Non financial Companies:ROIC Decay Analysis
80 Companies'rates of ROIC generally remain fairly stable over time.
Exhibit4.8 (P77)

Understanding the investor base
• In chapter 18, we introduced an investor classification system based on differences among investors’ portfolio-building strategies, which offers a better understanding of which investors drive share prices.
• Companies should focus their investor communications on intrinsic investors.
81
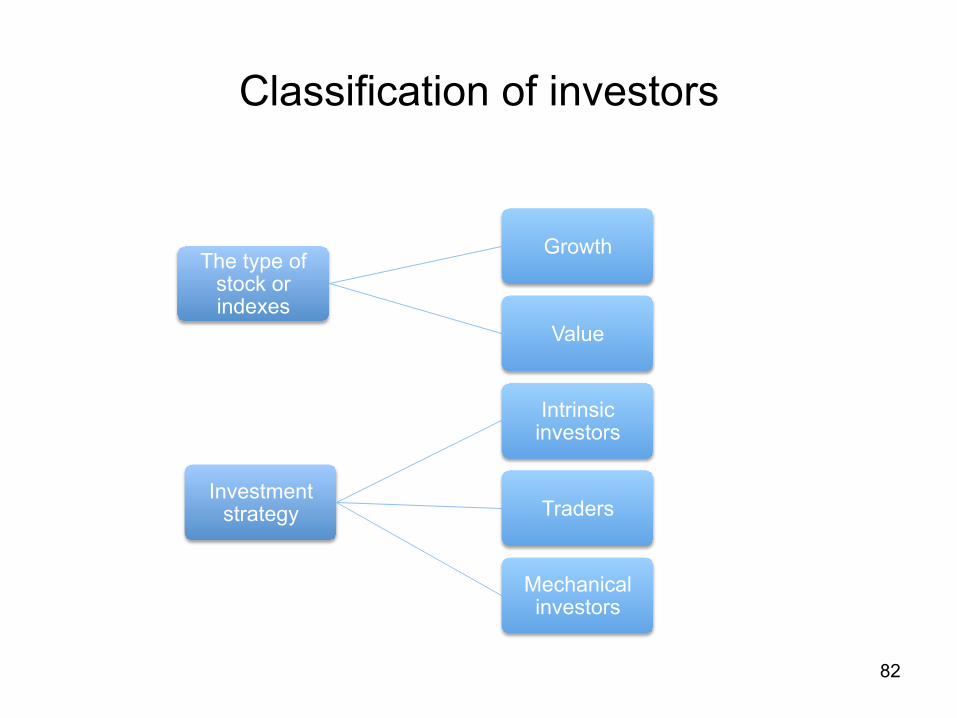
Classification of investors
82
The type of stock or indexes
Growth
Value
Investment strategy
Intrinsic investors
Traders
Mechanical investors

Classification by investment starategy
83
Intrinsic investors
Traders
・taking positions in companies only after undertaking rigorous due diligence of their inherent ability to create long term value. ・holding 20 to 25% of institutional U.S equity.
・seeking profits by betting on short term movements in share prices, typically based on announcements about the company or technical factors. ・holding 30 to 35% of institutional U.S equity.
Mechanical investors
・Making decisions based on strict criteria or rules. ・controlling 35 to 40% of institutional U.S equity.

Communicating to intrinsic investors
• Intrinsic investors are sophisticated: they want transparency about results, management’s candid assessment of the company’s performance, and insightful guidance about the company’s targets and strategies.
• Transparency – Legislation and accounting rules continually require more transparency. – A company’s competitors, customers, and suppliers already know more about
any business than its managers might expect.
• Guidance
– In the view of many companies’ executives, the ritual of issuing guidance on their likely earnings per share(EPS) in the next quarter or year is a necessary, if sometimes onerous, part of communicating with financial markets.
84

Exhibit24.6 Consumer packaged goods:
similar multiples for guiders and nonguiders
85