2013-2018 nursing home bed projections july 25 th, 2013 1
TRANSCRIPT
1
2013-2018
NURSING HOME BED PROJECTIONS
July 25th, 2013
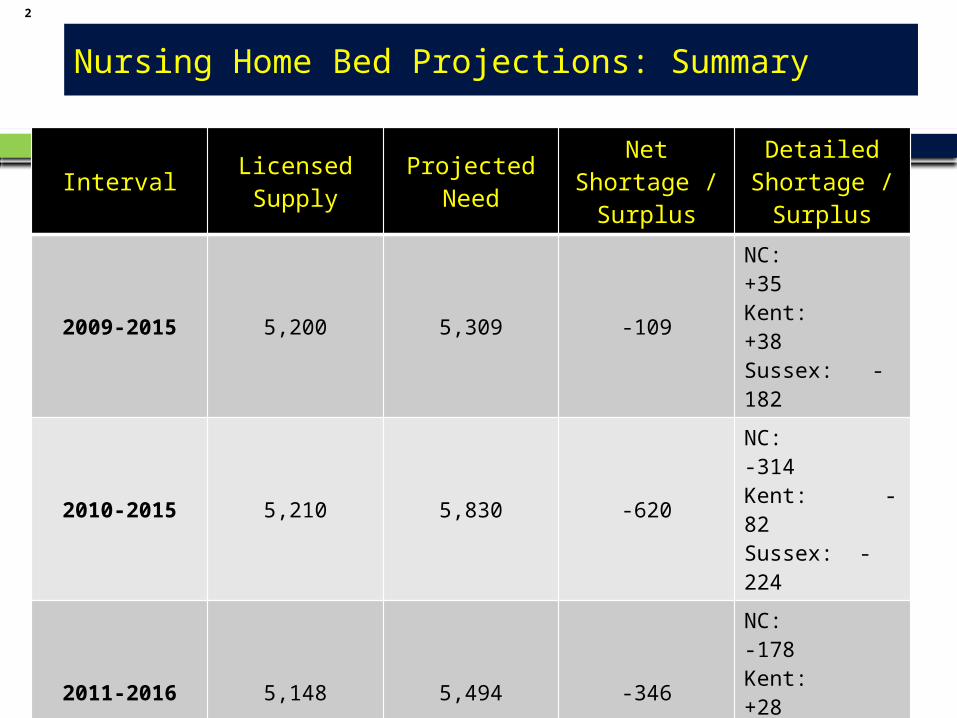
Nursing Home Bed Projections: Summary
Interval Licensed Supply Projected Need Net Shortage / Surplus
Detailed Shortage /
Surplus
2009-2015 5,200 5,309 -109NC: +35Kent: +38Sussex: -182
2010-2015 5,210 5,830 -620NC: -314Kent: -82Sussex: -224
2011-2016 5,148 5,494 -346NC: -178Kent: +28Sussex: -196
2012-2017 5,105 4,973 +132NC: +169Kent: -121Sussex: +84
2013-2018 5,081 5,520 -438NC: -217Kent: +55Sussex: -276
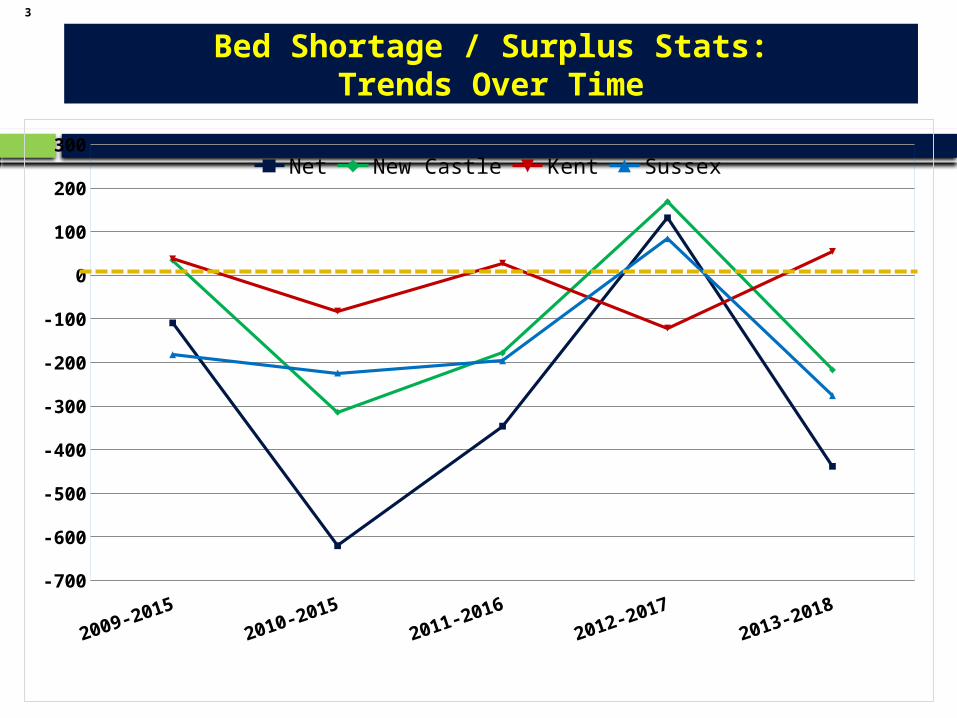
2009-20152010-2015
2011-20162012-2017
2013-2018-700
-600
-500
-400
-300
-200
-100
0
100
200
300Net New Castle Kent Sussex
Bed Shortage / Surplus Stats:Trends Over Time
4
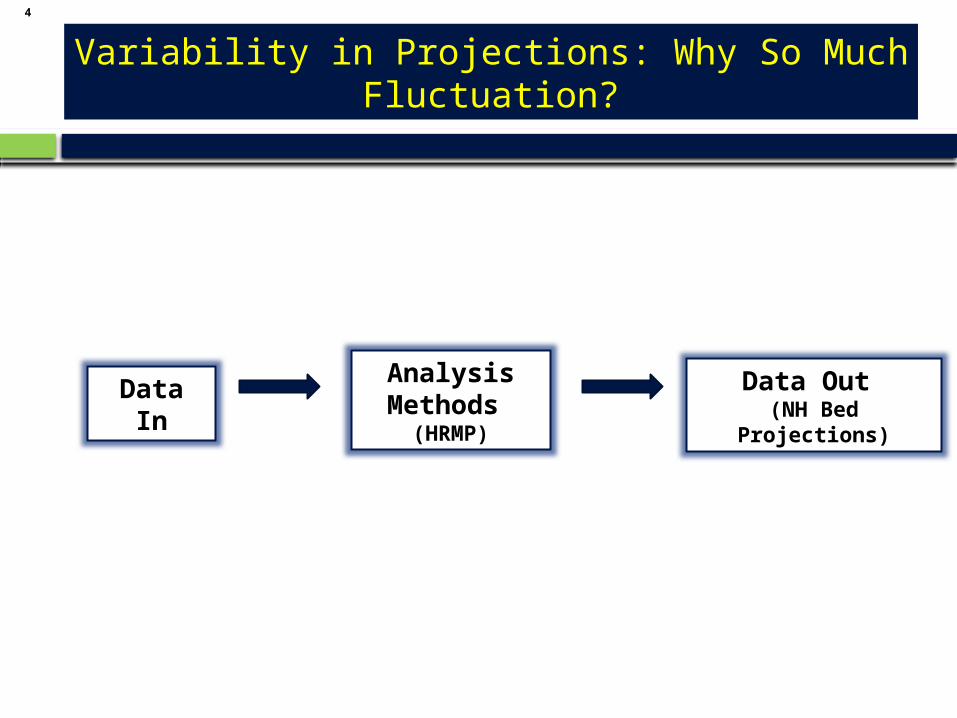
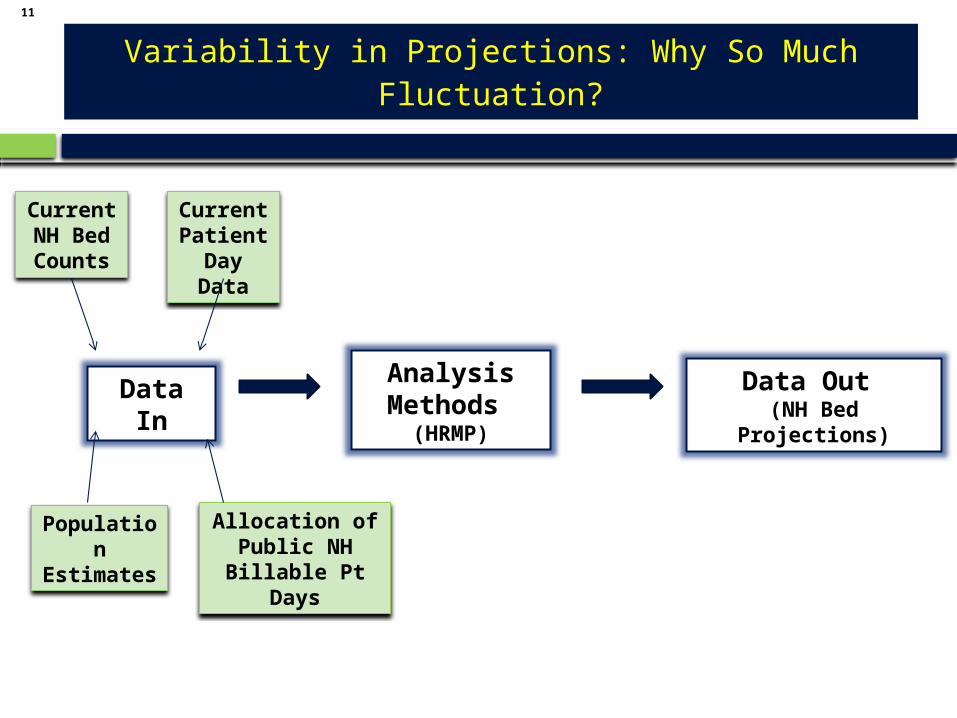
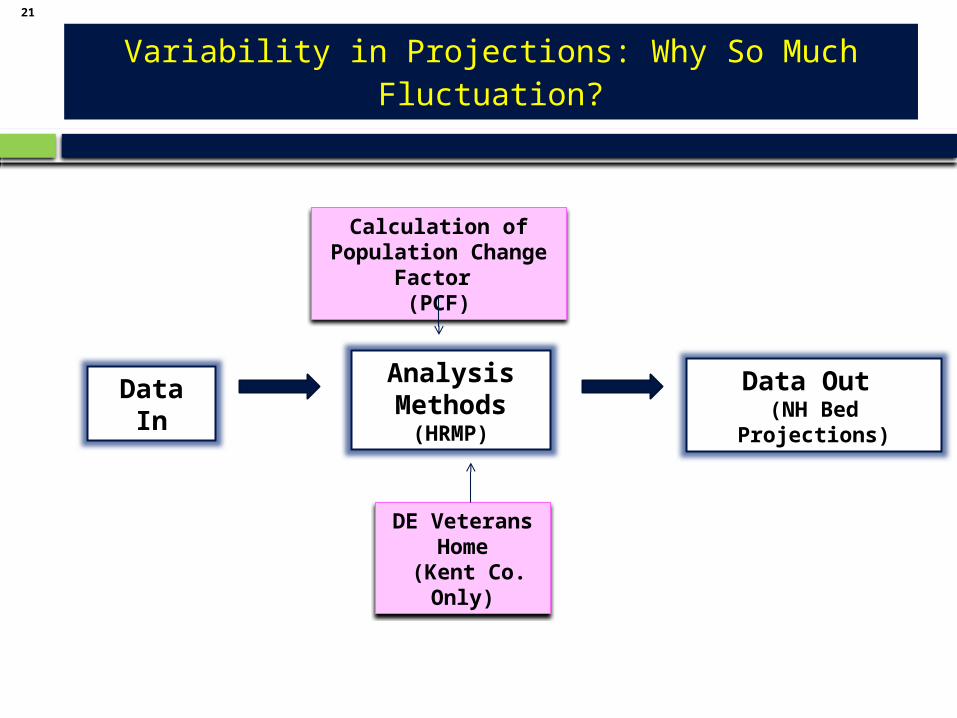
Variability in Projections: Why So Much Fluctuation?
Data In Analysis Methods
(HRMP)
Data Out (NH Bed Projections)

5
Variability in Projections: Why So Much Fluctuation?
Data In Analysis Methods
(HRMP)
Data Out (NH Bed Projections)
Population Estimates
Current Patient
Day Data
Current NH Bed Counts
Allocation of Public NH Billable Pt Days
Private Facilities PublicFacilitiesYear New Castle
CountyKent County Sussex
CountyTotal
PrivateAll Facilities
Homes Beds Homes Beds Homes Beds Homes Beds Homes Beds Homes Beds
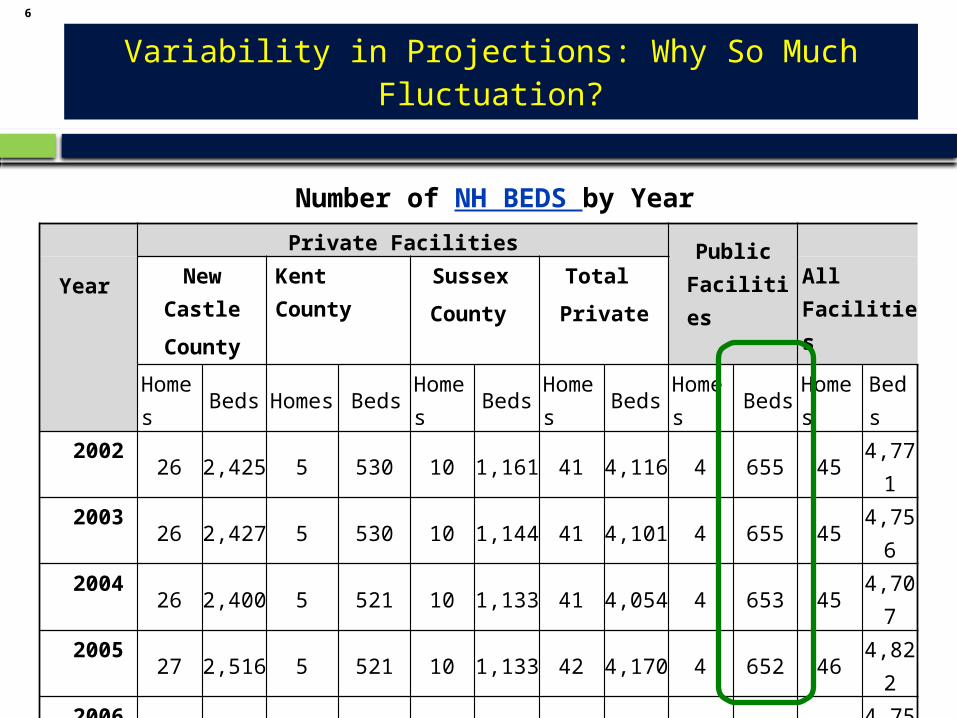
2002 26 2,425 5 530 10 1,161 41 4,116 4 655 45 4,7712003 26 2,427 5 530 10 1,144 41 4,101 4 655 45 4,7562004 26 2,400 5 521 10 1,133 41 4,054 4 653 45 4,7072005 27 2,516 5 521 10 1,133 42 4,170 4 652 46 4,8222006 26 2,427 5 530 10 1,144 41 4,101 4 655 45 4,7562007 27 2,523 6 642 10 1,143 43 4,308 4 626 47 4,9342008 26 2,498 6 642 12 1,323 44 4,463 4 626 48 5,0892009 26 2,519 6 642 11 1,234 43 4,395 4 626 47 5,0212010 26 2,519 6 642 11 1,234 43 4,395 3 591 46 4,9862011 26 2,519 6 642 11 1,234 43 4,395 3 591 46 4,9862012 27 2,569 6 672 11 1,264 44 4,505 3 576 47 5,081
Variability in Projections: Why So Much Fluctuation?
Number of NH BEDS by Year
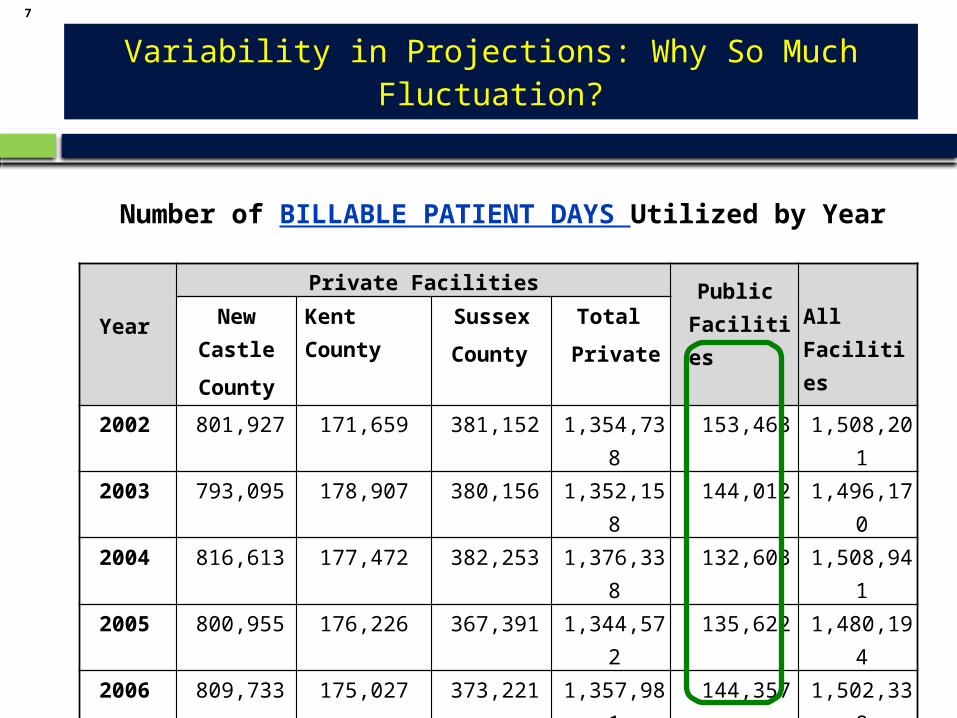
Number of BILLABLE PATIENT DAYS Utilized by Year
Private Facilities PublicFacilitiesYear New Castle
CountyKent County Sussex
CountyTotal
PrivateAll Facilities
2002 801,927 171,659 381,152 1,354,738 153,463 1,508,2012003 793,095 178,907 380,156 1,352,158 144,012 1,496,1702004 816,613 177,472 382,253 1,376,338 132,603 1,508,9412005 800,955 176,226 367,391 1,344,572 135,622 1,480,1942006 809,733 175,027 373,221 1,357,981 144,357 1,502,3382007 830,921 179,315 371,520 1,381,756 142,893 1,524,6492008 833,344 208,235 387,715 1,429,294 143,640 1,572,9342009 824,262 219,019 404,234 1,447,515 137,584 1,585,0992010 838,037 218,593 402,188 1,458,818 137,824 1,596,6422011 829,974 219,302 398,550 1,447,826 131,675 1,579,5012012 843,039 219,558 403,842 1,466,439 114,177 1,580,616
Variability in Projections: Why So Much Fluctuation?
Variability in Projections: Why So Much Fluctuation?
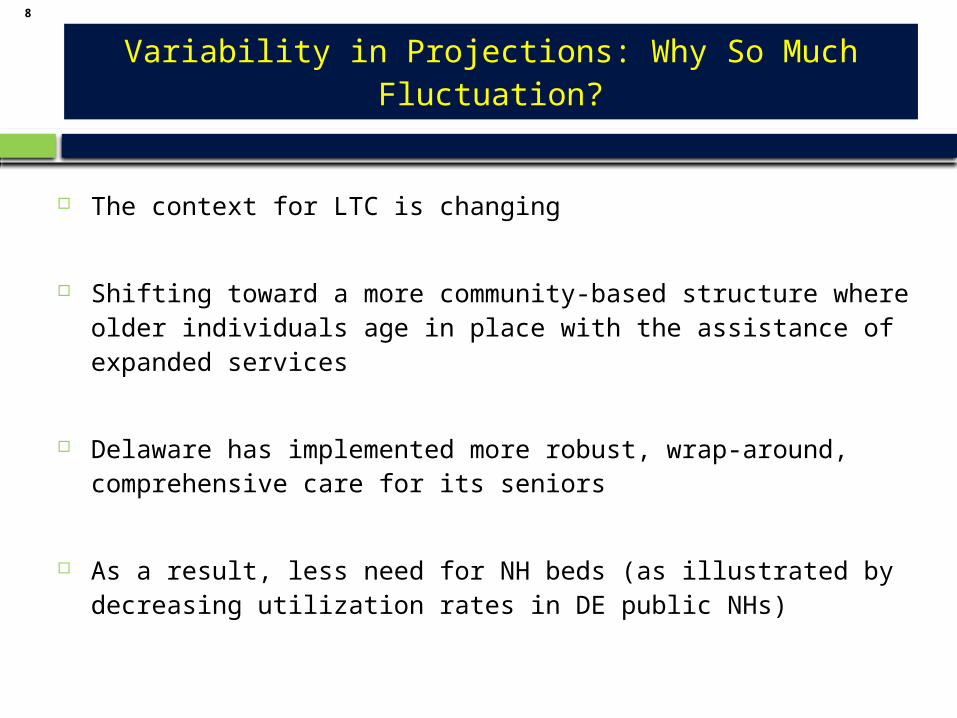
The context for LTC is changing
Shifting toward a more community-based structure where older individuals age in place with the assistance of expanded services
Delaware has implemented more robust, wrap-around, comprehensive care for its seniors
As a result, less need for NH beds (as illustrated by decreasing utilization rates in DE public NHs)
Variability in Projections: Why So Much Fluctuation?
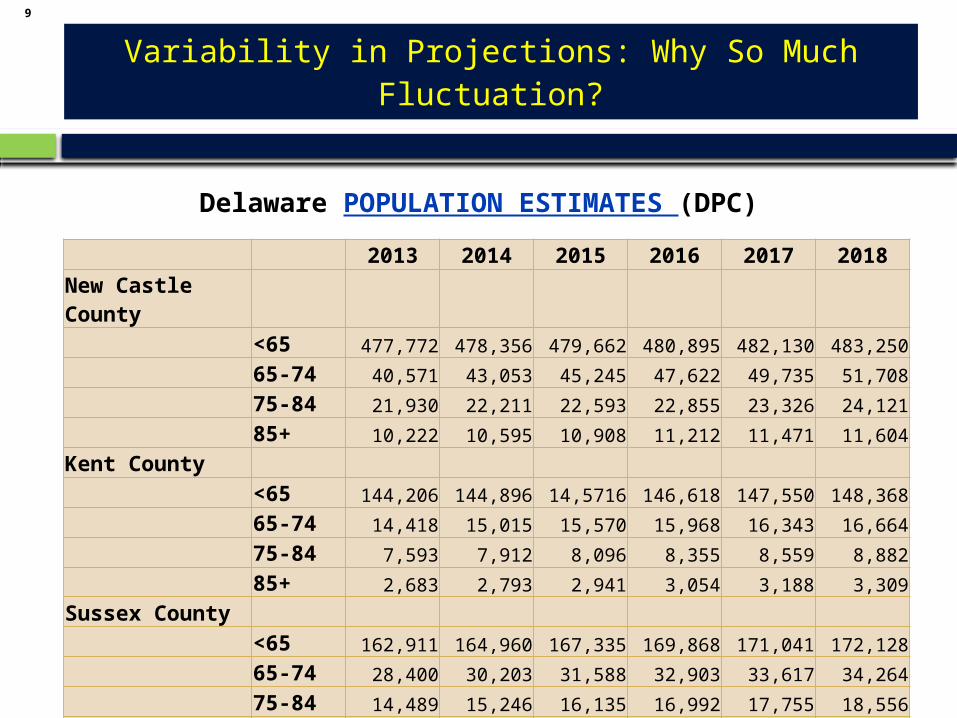
2013 2014 2015 2016 2017 2018New Castle County <65 477,772 478,356 479,662 480,895 482,130 483,250 65-74 40,571 43,053 45,245 47,622 49,735 51,708 75-84 21,930 22,211 22,593 22,855 23,326 24,121 85+ 10,222 10,595 10,908 11,212 11,471 11,604Kent County <65 144,206 144,896 14,5716 146,618 147,550 148,368 65-74 14,418 15,015 15,570 15,968 16,343 16,664 75-84 7,593 7,912 8,096 8,355 8,559 8,882 85+ 2,683 2,793 2,941 3,054 3,188 3,309Sussex County <65 162,911 164,960 167,335 169,868 171,041 172,128 65-74 28,400 30,203 31,588 32,903 33,617 34,264 75-84 14,489 15,246 16,135 16,992 17,755 18,556 85+ 5,043 5,497 5,902 6,294 6,630 6,992
Delaware POPULATION ESTIMATES (DPC)
Variability in Projections: Why So Much Fluctuation?
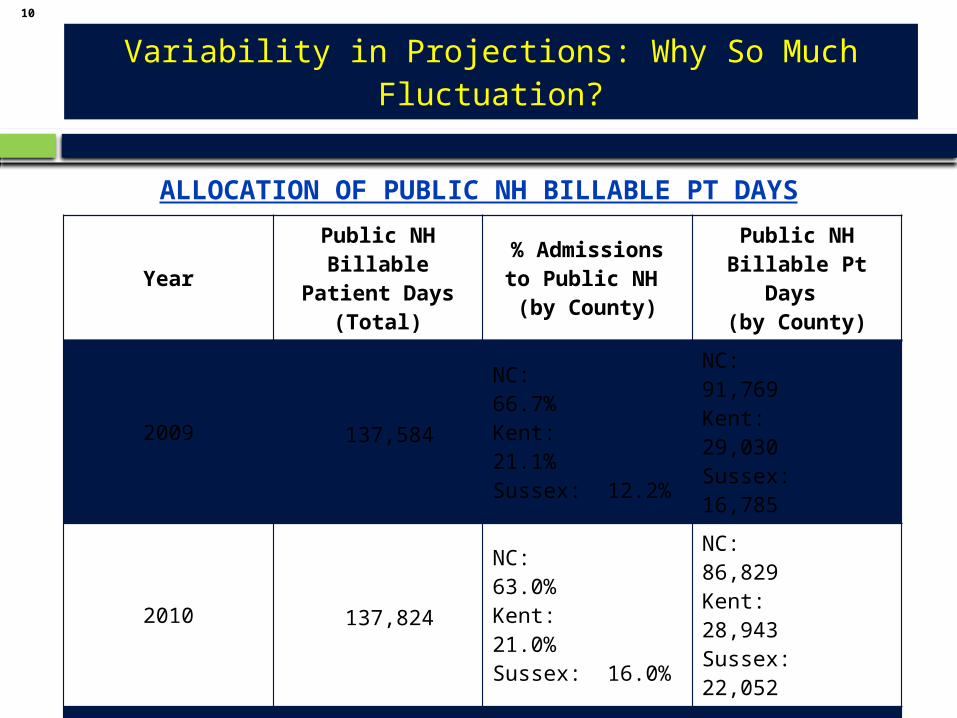
YearPublic NH Billable
Patient Days(Total)
% Admissions to Public NH
(by County)
Public NH Billable Pt Days
(by County)
2009 137,584NC: 66.7%Kent: 21.1%Sussex: 12.2%
NC: 91,769Kent: 29,030Sussex: 16,785
2010 137,824NC: 63.0%Kent: 21.0%Sussex: 16.0%
NC: 86,829Kent: 28,943Sussex: 22,052
2011 131,675NC: 60.0%Kent: 35.4%Sussex: 3.1%
NC: 79,005Kent: 46,613Sussex: 4,082
2012 114,177NC: 64.5%Kent: 22.6%Sussex: 13.0%
NC: 73,644Kent: 25,804Sussex: 14,843
ALLOCATION OF PUBLIC NH BILLABLE PT DAYS
Variability in Projections: Why So Much Fluctuation?
Data In Analysis Methods
(HRMP)
Data Out (NH Bed Projections)
Population Estimates
Current Patient
Day Data
Current NH Bed Counts
Allocation of Public NH Billable Pt Days
12
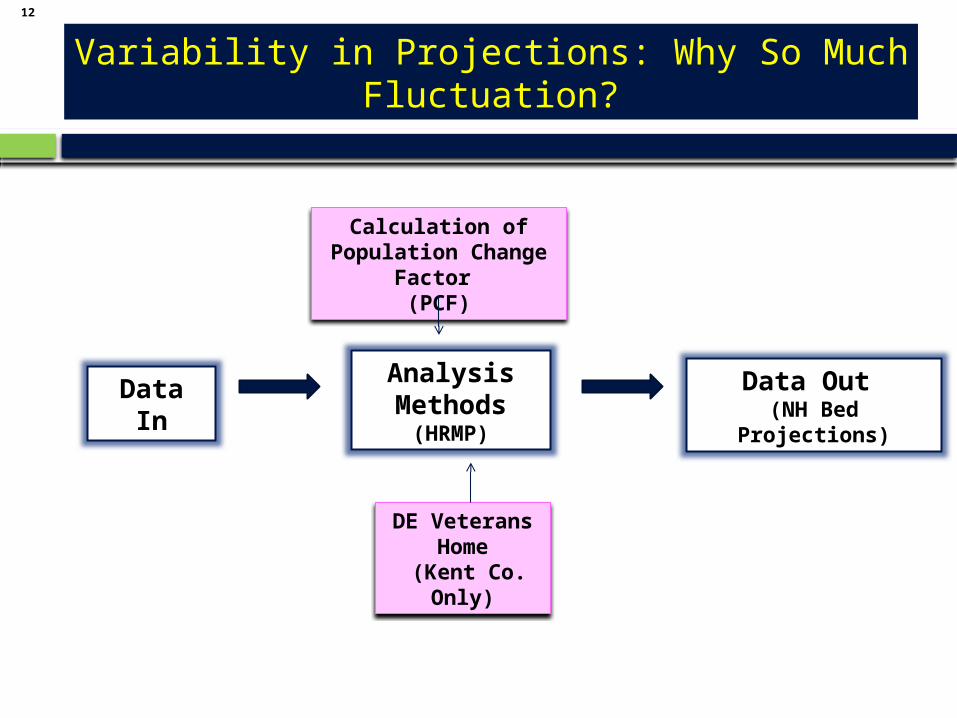
Variability in Projections: Why So Much Fluctuation?
Data In Analysis Methods
(HRMP)
Data Out (NH Bed Projections)
DE Veterans Home
(Kent Co. Only)
Calculation of Population Change Factor
(PCF)
13
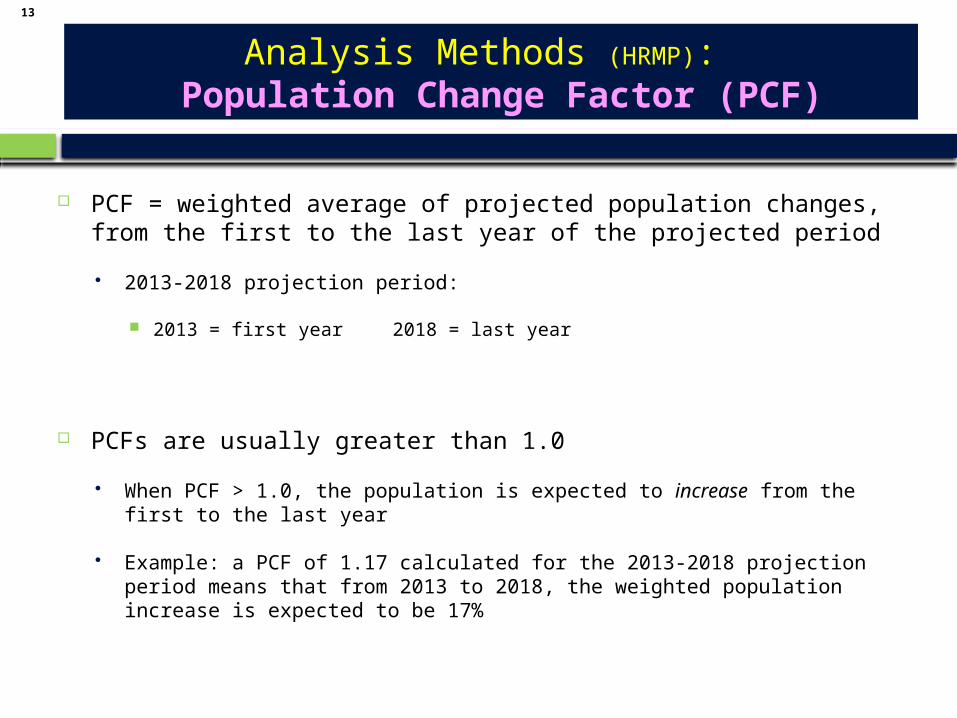
PCF = weighted average of projected population changes, from the first to the last year of the projected period
2013-2018 projection period:
2013 = first year 2018 = last year
PCFs are usually greater than 1.0
When PCF > 1.0, the population is expected to increase from the first to the last year
Example: a PCF of 1.17 calculated for the 2013-2018 projection period means that from 2013 to 2018, the weighted population increase is expected to be 17%
Analysis Methods (HRMP): Population Change Factor (PCF)
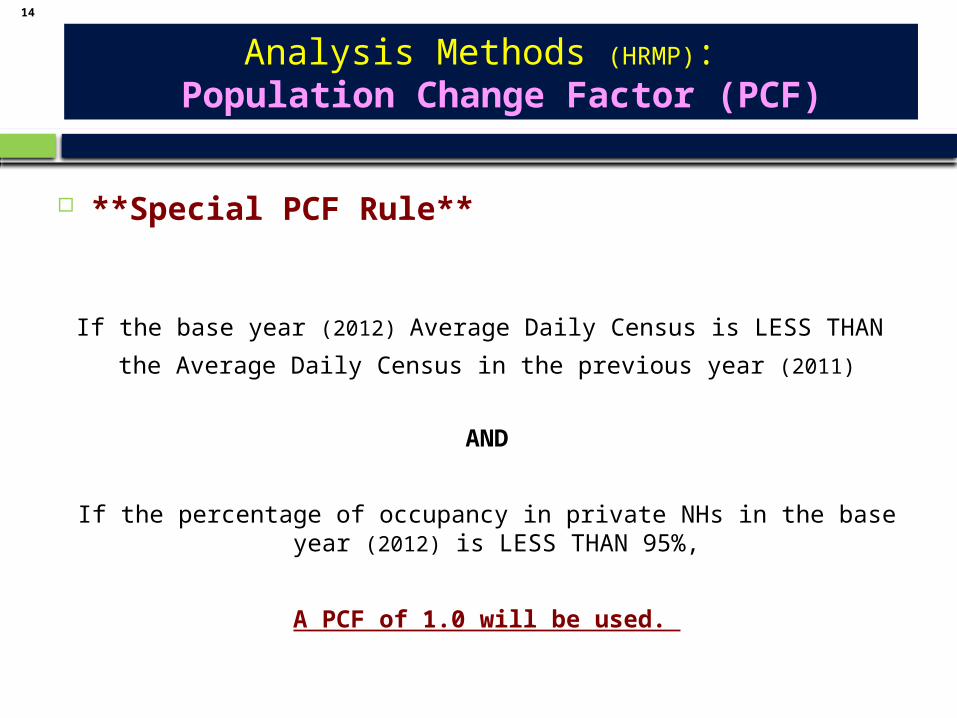
14
**Special PCF Rule**
If the base year (2012) Average Daily Census is LESS THAN
the Average Daily Census in the previous year (2011)
AND
If the percentage of occupancy in private NHs in the base year (2012) is LESS THAN 95%,
A PCF of 1.0 will be used.
Analysis Methods (HRMP): Population Change Factor (PCF)
15
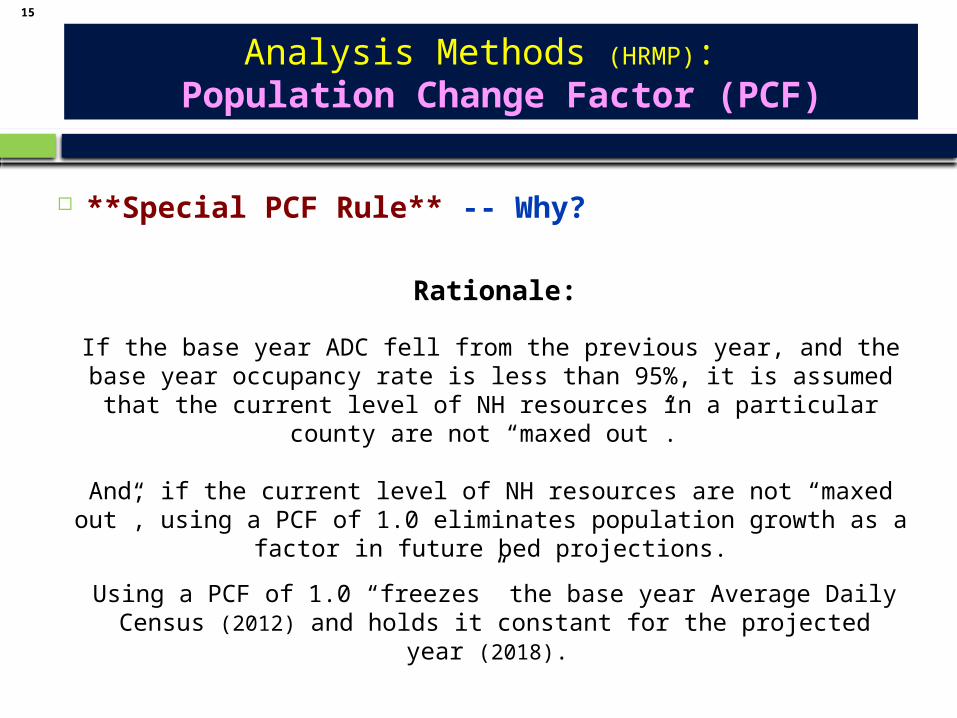
**Special PCF Rule** -- Why?
Rationale:
Analysis Methods (HRMP): Population Change Factor (PCF)
If the base year ADC fell from the previous year, and the base year occupancy rate is less than 95%, it is assumed that the current level of NH resources in a particular county are
not “maxed out”.
And, if the current level of NH resources are not “maxed out”, using a PCF of 1.0 eliminates population growth as a factor in future bed projections.
Using a PCF of 1.0 “freezes” the base year Average Daily Census (2012) and holds it constant for the projected year (2018).
Analysis Methods (HRMP): Population Change Factor (PCF)
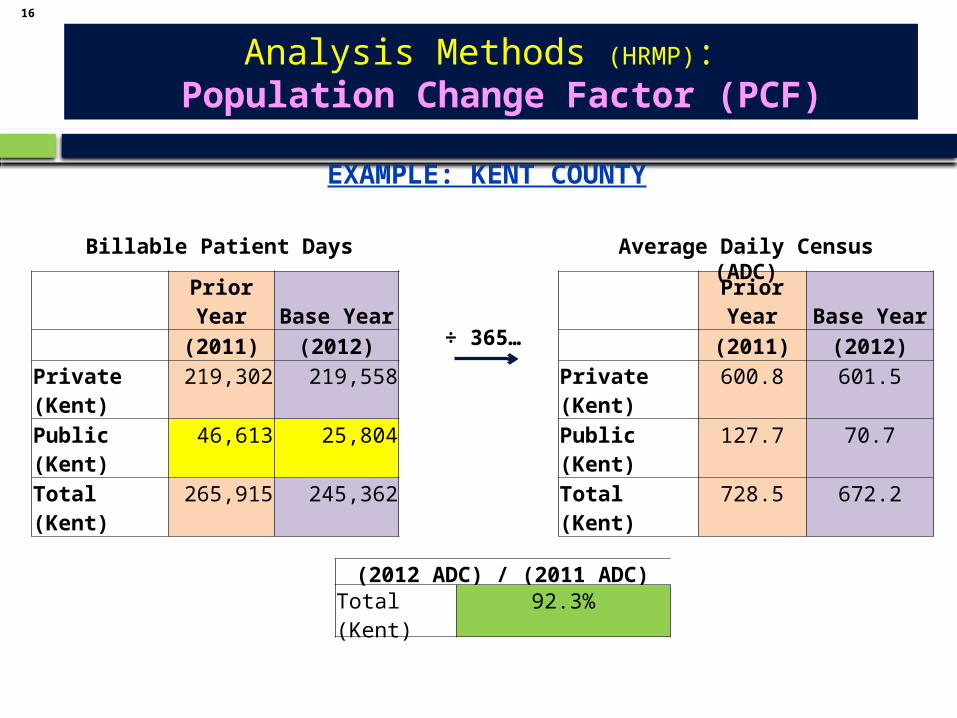
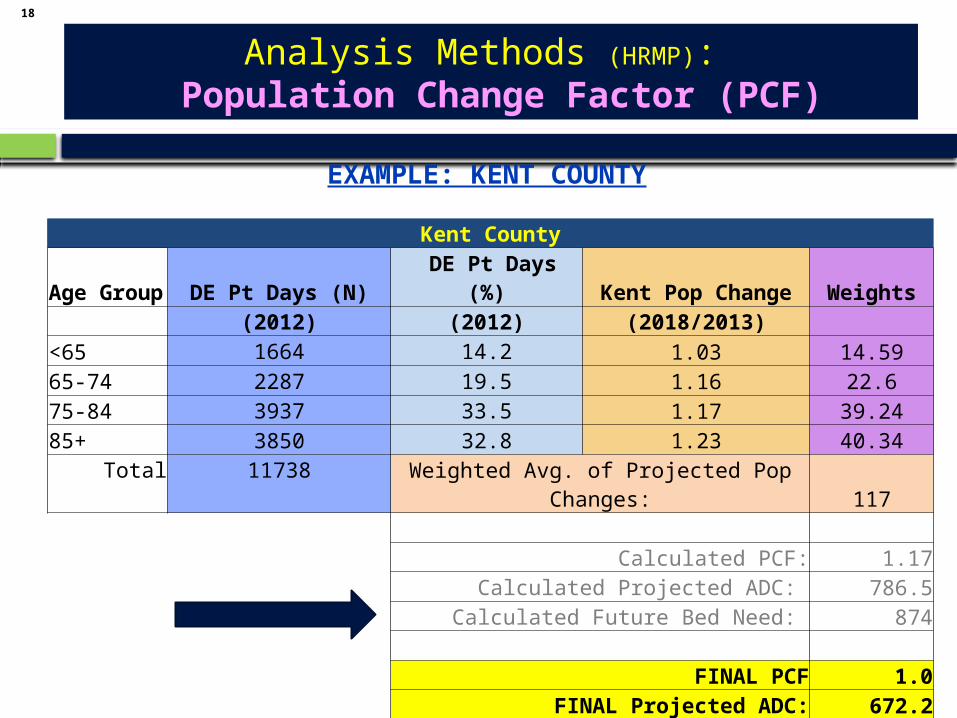
EXAMPLE: KENT COUNTY
Prior Year Base Year (2011) (2012)Private (Kent) 219,302 219,558Public (Kent) 46,613 25,804Total (Kent) 265,915 245,362
Prior Year Base Year (2011) (2012)Private (Kent) 600.8 601.5Public (Kent) 127.7 70.7Total (Kent) 728.5 672.2
÷ 365…
Billable Patient Days Average Daily Census (ADC)
(2012 ADC) / (2011 ADC)Total (Kent) 92.3%
Analysis Methods (HRMP): Population Change Factor (PCF)
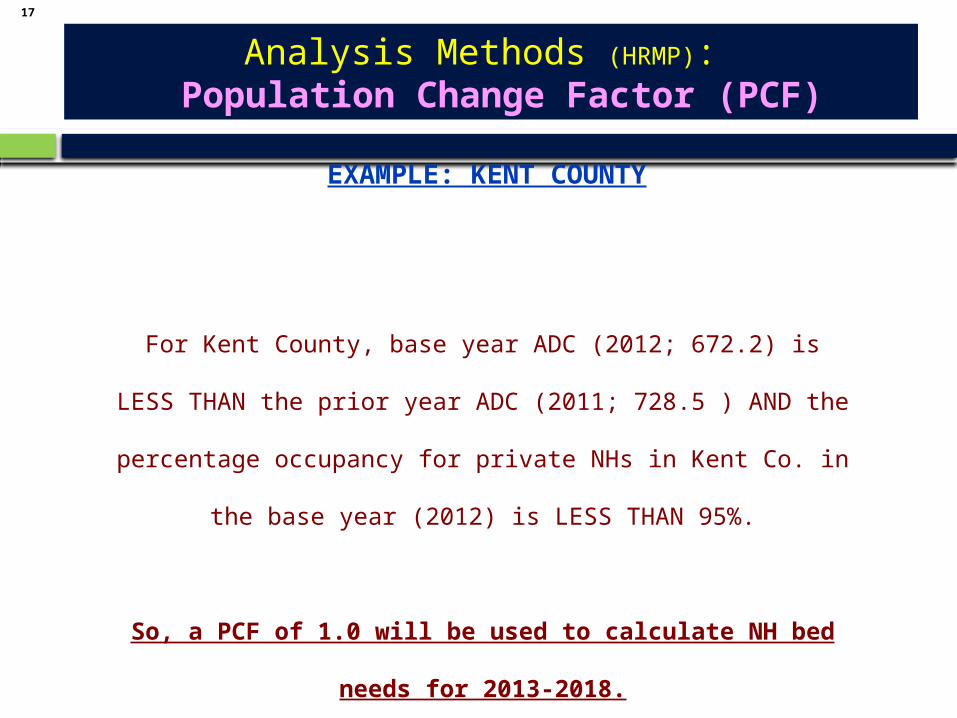
EXAMPLE: KENT COUNTY
For Kent County, base year ADC (2012; 672.2) is LESS THAN the prior year
ADC (2011; 728.5 ) AND the percentage occupancy for private NHs in Kent
Co. in the base year (2012) is LESS THAN 95%.
So, a PCF of 1.0 will be used to calculate NH bed needs for 2013-2018.
18
Analysis Methods (HRMP): Population Change Factor (PCF)
EXAMPLE: KENT COUNTY
Kent CountyAge Group DE Pt Days (N) DE Pt Days (%) Kent Pop Change Weights (2012) (2012) (2018/2013) <65 1664 14.2 1.03 14.5965-74 2287 19.5 1.16 22.675-84 3937 33.5 1.17 39.2485+ 3850 32.8 1.23 40.34
Total 11738 Weighted Avg. of Projected Pop Changes: 117
Calculated PCF: 1.17Calculated Projected ADC: 786.5
Calculated Future Bed Need: 874
FINAL PCF 1.0FINAL Projected ADC: 672.2
FINAL Calculated Future Bed Need: 747
19
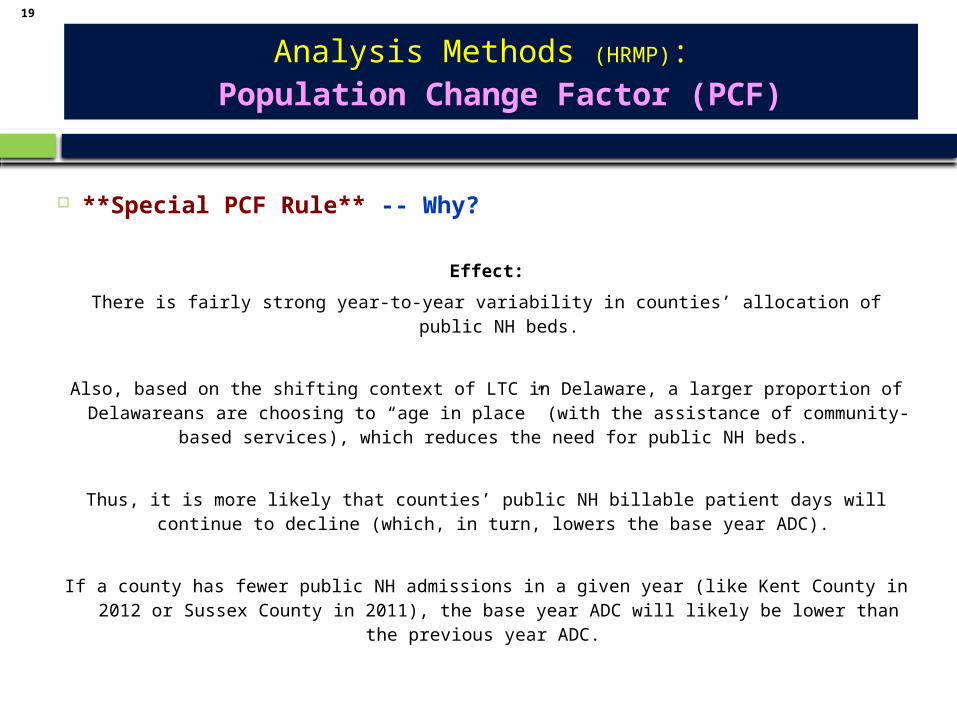
**Special PCF Rule** -- Why?
Effect:
There is fairly strong year-to-year variability in counties’ allocation of public NH beds.
Also, based on the shifting context of LTC in Delaware, a larger proportion of Delawareans are choosing to “age in place” (with the assistance of community-based services), which
reduces the need for public NH beds.
Thus, it is more likely that counties’ public NH billable patient days will continue to decline (which, in turn, lowers the base year ADC).
If a county has fewer public NH admissions in a given year (like Kent County in 2012 or Sussex County in 2011), the base year ADC will likely be lower than the previous year ADC.
Analysis Methods (HRMP): Population Change Factor (PCF)
20
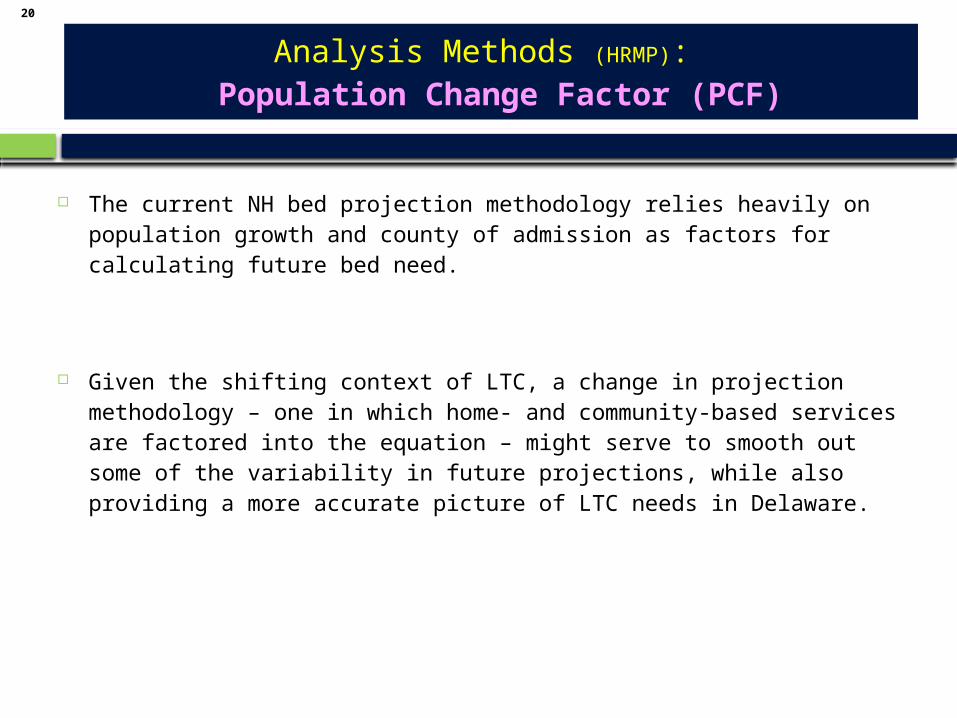
The current NH bed projection methodology relies heavily on population growth and county of admission as factors for calculating future bed need.
Given the shifting context of LTC, a change in projection methodology – one in which home- and community-based services are factored into the equation – might serve to smooth out some of the variability in future projections, while also providing a more accurate picture of LTC needs in Delaware.
Analysis Methods (HRMP): Population Change Factor (PCF)
21
Variability in Projections: Why So Much Fluctuation?
Data In Analysis Methods
(HRMP)
Data Out (NH Bed Projections)
DE Veterans Home
(Kent Co. Only)
Calculation of Population Change Factor
(PCF)
22
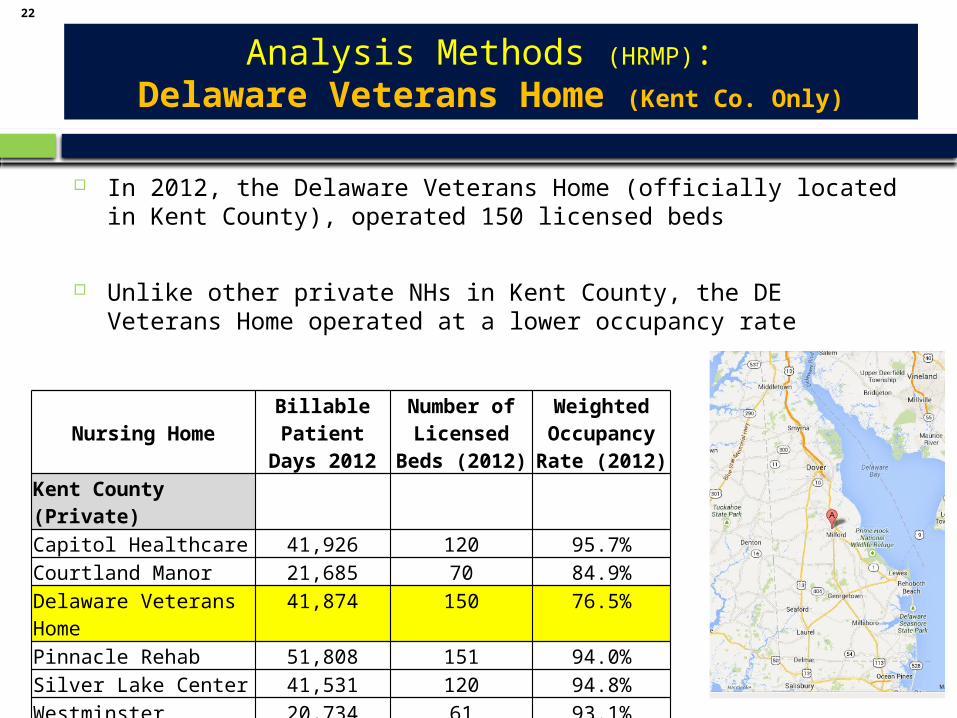
In 2012, the Delaware Veterans Home (officially located in Kent County), operated 150 licensed beds
Unlike other private NHs in Kent County, the DE Veterans Home operated at a lower occupancy rate
Analysis Methods (HRMP): Delaware Veterans Home (Kent Co. Only)
Nursing Home Billable Patient Days 2012
Number of Licensed Beds
(2012)
Weighted Occupancy Rate
(2012)Kent County (Private) Capitol Healthcare 41,926 120 95.7%Courtland Manor 21,685 70 84.9%Delaware Veterans Home 41,874 150 76.5%Pinnacle Rehab 51,808 151 94.0%Silver Lake Center 41,531 120 94.8%Westminster Village 20,734 61 93.1%Kent County (Private) 219,558 672 89.5%
23
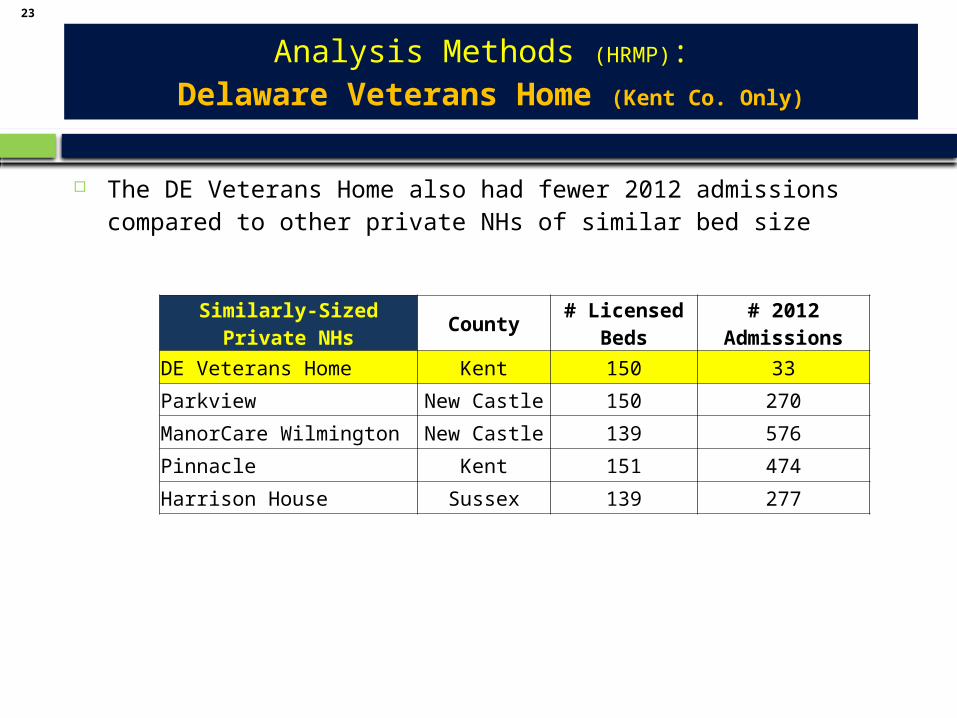
The DE Veterans Home also had fewer 2012 admissions compared to other private NHs of similar bed size
Analysis Methods (HRMP): Delaware Veterans Home (Kent Co. Only)
Similarly-Sized Private NHs County # Licensed Beds # 2012 Admissions
DE Veterans Home Kent 150 33
Parkview New Castle 150 270
ManorCare Wilmington New Castle 139 576
Pinnacle Kent 151 474
Harrison House Sussex 139 277
24
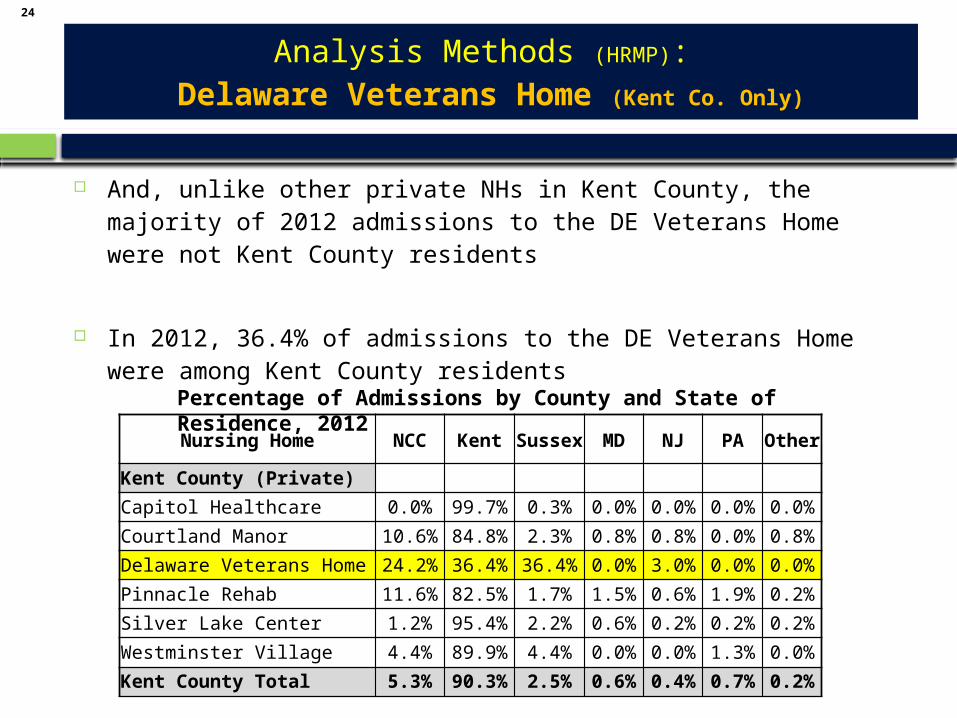
And, unlike other private NHs in Kent County, the majority of 2012 admissions to the DE Veterans Home were not Kent County residents
In 2012, 36.4% of admissions to the DE Veterans Home were among Kent County residents
Analysis Methods (HRMP): Delaware Veterans Home (Kent Co. Only)
Nursing Home NCC Kent Sussex MD NJ PA Other
Kent County (Private)
Capitol Healthcare 0.0% 99.7% 0.3% 0.0% 0.0% 0.0% 0.0%
Courtland Manor 10.6% 84.8% 2.3% 0.8% 0.8% 0.0% 0.8%
Delaware Veterans Home 24.2% 36.4% 36.4% 0.0% 3.0% 0.0% 0.0%
Pinnacle Rehab 11.6% 82.5% 1.7% 1.5% 0.6% 1.9% 0.2%
Silver Lake Center 1.2% 95.4% 2.2% 0.6% 0.2% 0.2% 0.2%
Westminster Village 4.4% 89.9% 4.4% 0.0% 0.0% 1.3% 0.0%
Kent County Total 5.3% 90.3% 2.5% 0.6% 0.4% 0.7% 0.2%
Percentage of Admissions by County and State of Residence, 2012
25
In summary, based on the current NH bed projection methods, the DE Veterans Home is categorized as a private NH in Kent County
Yet, it represents an “outlier” in terms of other Kent Co. private NHs
Despite differences in number of admissions, occupancy rates, and the proportion of Kent County residents admitted, all 150 beds from the DE Veterans Home are assigned to Kent County as available private NH beds
This inflates the picture of total private NH beds available to the general Kent County public and works to create a surplus bed scenario for the county
Analysis Methods (HRMP): Delaware Veterans Home (Kent Co. Only)
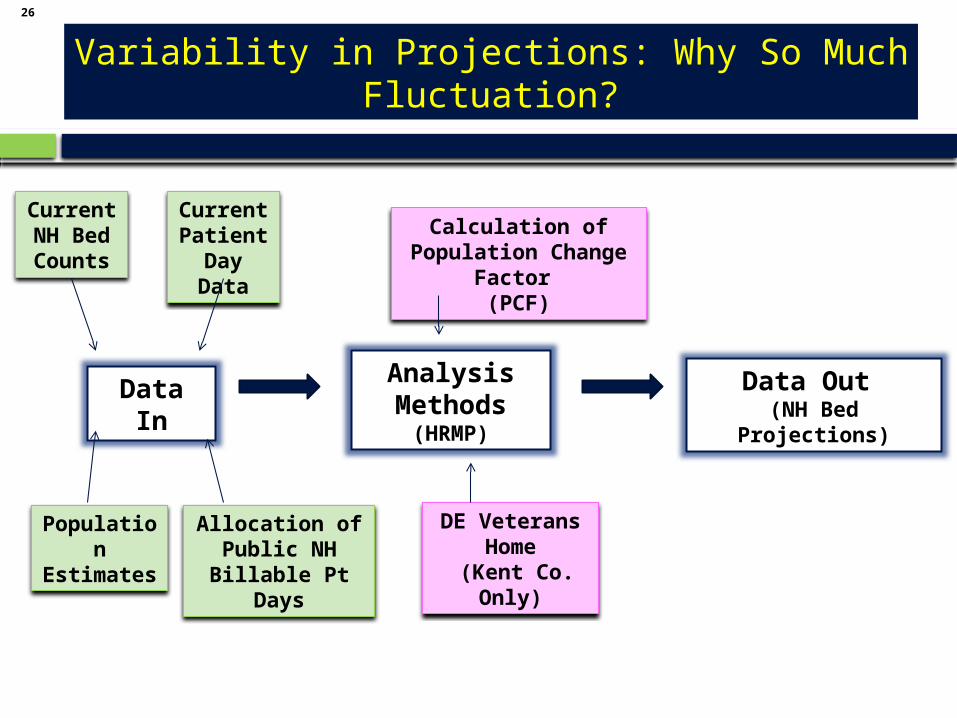
26
Variability in Projections: Why So Much Fluctuation?
Data In Analysis Methods
(HRMP)
Data Out (NH Bed Projections)
DE Veterans Home
(Kent Co. Only)
Calculation of Population Change Factor
(PCF)
Population Estimates
Current Patient
Day Data
Current NH Bed Counts
Allocation of Public NH Billable Pt Days

27
End