areaprofiler2 education twri 2013 population projections, what a difference a year makes! chris...
TRANSCRIPT
AreaProfiler2
• Education
TWRI 2013 population projections, what a difference a year
makes!
Chris StephensTWRI
November 2014
Population projections

AreaProfiler2
• The world population is projected, to be in the region of 11 billion by the end of the Century, up over 50% from today.
• The United Kingdom and England, in particular, may not be immune from the impact of this on our population numbers and consequently on the environment.
Source: Bradshaw, C.J.A. and Brook, B.W. (2014) Human population reduction is not a quick fix for environmental problems. Proceedings of the National Academy of Sciences (October 2014).
General Comments (1)
Population projections
AreaProfiler2
• England is almost certain to see significant population increase.
• For every 1% increase this represents a population growth of around 500,000.
• For every 2% increase this represents a new city the size of Birmingham.
General Comments (2)
Population projections
AreaProfiler2
• 1) Usually Resident Population.
• 2) Short-term Migrants.
• 3) A Population Estimate.
• 4) A Population Projection.
• 5) A Population Forecast.
Some Definitions
Population projections
AreaProfiler2
• We use the Co-hort survival method. • However, unlike ONS which, in their
projections, constrain the sum of the districts to the England total, TWRI starts with local authority, produces the projection and aggregates to the Region.
• We produce a variety of scenarios, including Natural Change, Internal migration only.
• We do use a variety of weightings.
Method used
Population projections
AreaProfiler2
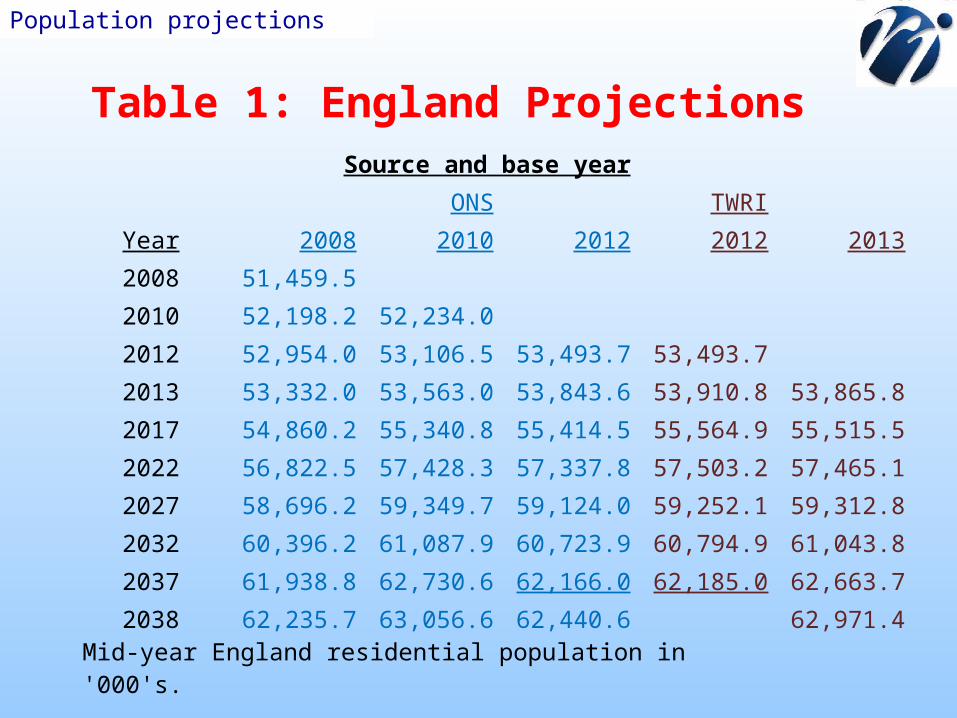
Table 1: England Projections
Population projections
Source and base year
ONS TWRI
Year 2008 2010 2012 2012 2013
2008 51,459.5
2010 52,198.2 52,234.0
2012 52,954.0 53,106.5 53,493.7 53,493.7
2013 53,332.0 53,563.0 53,843.6 53,910.8 53,865.8
2017 54,860.2 55,340.8 55,414.5 55,564.9 55,515.5
2022 56,822.5 57,428.3 57,337.8 57,503.2 57,465.1
2027 58,696.2 59,349.7 59,124.0 59,252.1 59,312.8
2032 60,396.2 61,087.9 60,723.9 60,794.9 61,043.8
2037 61,938.8 62,730.6 62,166.0 62,185.0 62,663.7
2038 62,235.7 63,056.6 62,440.6 62,971.4
Mid-year England residential population in '000's.
AreaProfiler2
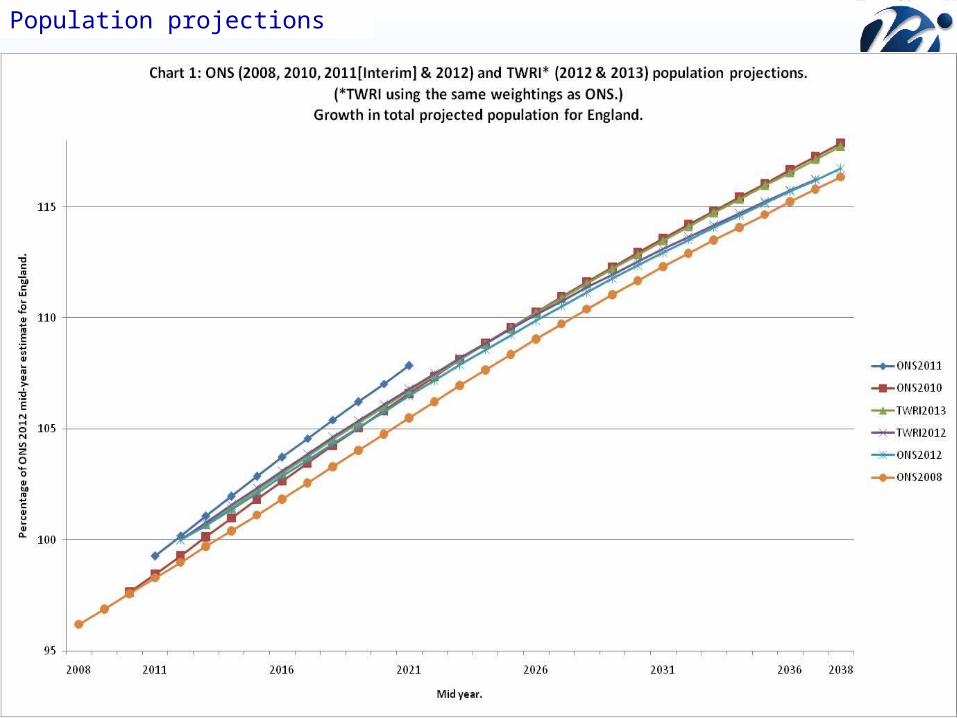
England Projections (2)
Population projections
AreaProfiler2
• Besides understanding natural change and migration patterns, one of the aims of this analysis is to decide how we should project forward from 2013, for the different change elements. For example, should we expect birth rates to go up, to go down or roughly be the same? Since we use the past to project our view of the future we need to look at the past data, presented in a meaningful sense.
TWRI: Projecting from 2013
Population projections

AreaProfiler2Population projections
AreaProfiler2Population projections
AreaProfiler2Population projections
AreaProfiler2Population projections

AreaProfiler2
Table 2: Comparison of ONS & TWRI results
Population projections
Area
Originator Projection Base Year
Projected Year
Source/Model Gateshead North East England
ONS 2012 - MYE 100 100 100
ONS 2012 2037 ONS 106 106 116
TWRI 2012 2037 Nat. Ch. 98 102 105
TWRI 2012 2037 Int. only 98 97 105
TWRI 2012 2037 All Mig. 103 115 118
TWRI 2013 2037 Nat. Ch. 98 99 106
TWRI 2013 2037 Int. only 96 96 105
TWRI 2013 2037 All Mig. 98 104 116
AreaProfiler2
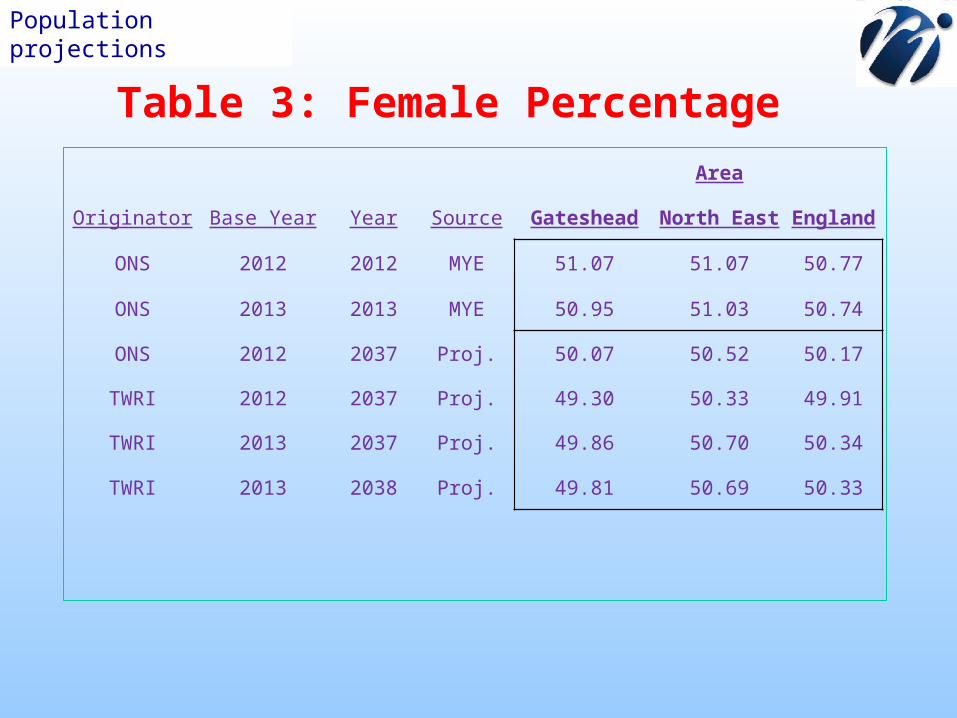
Table 3: Female Percentage
Population projections
Area
Originator Base Year Year Source Gateshead North East England
ONS 2012 2012 MYE 51.07 51.07 50.77
ONS 2013 2013 MYE 50.95 51.03 50.74
ONS 2012 2037 Proj. 50.07 50.52 50.17
TWRI 2012 2037 Proj. 49.30 50.33 49.91
TWRI 2013 2037 Proj. 49.86 50.70 50.34
TWRI 2013 2038 Proj. 49.81 50.69 50.33
AreaProfiler2
• We have used 2011 data, updated to 2013, to get projections, for England, North East districts and the North East to 2038.
• In principle, this can be done for any Region/Area in the Country.
• A year can make a big difference a) to the population projections for a Local Authority or Region and
• b) to England, it could mean an extra half a million.
Conclusions (1)
Population projections
AreaProfiler2
• Examining various scenarios helps to understand the underline patterns in births, deaths and migrations.
• It would improve understanding if a number of neighbouring authorities got together and requested analyses for their authorities; additionally it would be substantially cheaper overall.
Conclusions (2)
Population projections
AreaProfiler2
References
Population projections
1) All of the raw data, used in this presentation, can be found on the Office for National Statistics website.
2) “{i}” 28th. October 2014 page 22. [The newspaper “{i}” .]
3) Bradshaw, C.J.A. and Brook, B.W. (2014) Human population reduction is not a quick fix for environmental problems. Proceedings of the National Academy of Sciences (October 2014).

AreaProfiler2
TWRI Web Site:www.twri.org.uk
TWRI E-mail:[email protected]@twri.org.uk
Population projections