2012 new glasgow riverfront jubilee - events nova...
TRANSCRIPT
2012 New Glasgow Riverfront Jubilee
New Glasgow, Nova Scotia Economic Impact Assessment
December 2012
The following analysis provides the economic impact of the 2012 New Glasgow Riverfront
Jubilee, hosted in New Glasgow, Nova Scotia from Friday August 3 to Sunday August 5, 2012 as
generated by the Sport Tourism Economic Assessment Model – Professional Version.
2012 New Glasgow Riverfront Jubilee – Economic Impact Assessment
2
Economic Impact Assessment Funding Partner
The Canadian Sport Tourism Alliance wishes to acknowledge the financial support of Events
Nova Scotia in the completion of this study.
About Events Nova Scotia:
Events Nova Scotia is enhancing Nova Scotia’s ability to successfully bid for and host major events in the sporting, culture and entertainment sectors. Through a coordinated approach, Events Nova Scotia has a mandate to identify and attract new major events to the province of Nova Scotia. Events Nova Scotia will focus on attracting new events in the sporting, cultural and entertainment sectors. Along with attracting new events to the province Events Nova Scotia is also working to establish standards and baseline measures to consistently evaluate the economic return generated by major events, facilitate the sharing of industry best practices to bid for and host major events and market the province as a major event destination. For more information on Events Nova Scotia, please contact:
Events Nova Scotia PO Box 955
1800 Argyle Street, Suite 416 Halifax, NS, Canada B3J 2V9 www.eventsnovascotia.com
For more information about this report, please contact:
Tony Fisher, Canadian Sport Tourism Alliance, [email protected]
Katie Loney, Events Nova Scotia, [email protected]
2012 New Glasgow Riverfront Jubilee – Economic Impact Assessment
3
1.0 Background
The 17th edition of the New Glasgow Riverfront Jubilee ran from August 3 to 5, 2012. The
Jubilee prides itself on staging a genre-busting line-up at one of the lowest price points
available as well as putting the region’s up and providing a line-up featuring the regions up and
coming artists playing alongside big name acts. Consequently, the combination of the
distinctive setting featuring an outdoor amphitheater and great music acts attracts hundreds of
spectators from around the region to New Glasgow, which in turn generates a significant
economic impact for the community.
In measuring the economic impact of the New Glasgow Riverfront Jubilee, spectators at the
event were surveyed as to their origin, length of stay, and spending in New Glasgow, with the
survey methodology and results being the subject of the next section. The event organizers also
invested significantly in hosting the New Glasgow Riverfront Jubilee, as noted in Section 3.
Finally, section 4 reports the STEAM PRO1 results from the combined expenditures of the
spectators and the host society’s operational expenditures. The appendices include more
details about STEAM PRO, the economic impact assessment model used and a glossary of
terms.
1The Canadian Sport Tourism Alliance’s (CSTA’s) Sport Tourism Economic Assessment Model, Professional version (STEAM
PRO) was used to generate the economic impact estimates detailed in this report. STEAM PRO, which was developed in 2006,
is a model that has been designed to incorporate the results of primary data collected from event visitors and the budget /
capital expenditures of event organizers and others to prepare economic impact assessments. The model is based on the
Canadian Tourism Research Institute’s (CTRI - a branch of The Conference Board of Canada) TEAM model, which is the most
widely used tourism economic impact model in Canada. The results of STEAM PRO are fully consistent with the CSTA’s STEAM
model. A more detailed description of STEAM PRO is contained within Appendix 1.
2012 New Glasgow Riverfront Jubilee – Economic Impact Assessment
4
2.0 Methodology/ Survey Results
Information regarding the composition and spending of spectators at the 2012 New Glasgow
Riverfront Jubilee was collected through the administration of a face-to-face intercept survey.
The survey captured essential information to determine the origin of spectators attending the
event and the expenditures of out-of-town visitors to the New Glasgow region. The survey was
conducted using iPod Touch PDAs running Survey Analytic’s Survey Pocket software. A copy of
the survey instrument used can be found in Appendix 3.2
Survey Results
A total of 345 visitor parties were approached during the event with 259 parties agreeing to
participate (a rejection rate of 24%). Of this group, 64 parties had been previously surveyed
(19%), yielding a total of 198 valid surveys. The overall sample of valid surveys found that just
under two-thirds of those intercepted (64%) were from the New Glasgow and 71 visitor parties
representing 239 visitors were from outside of the region.3
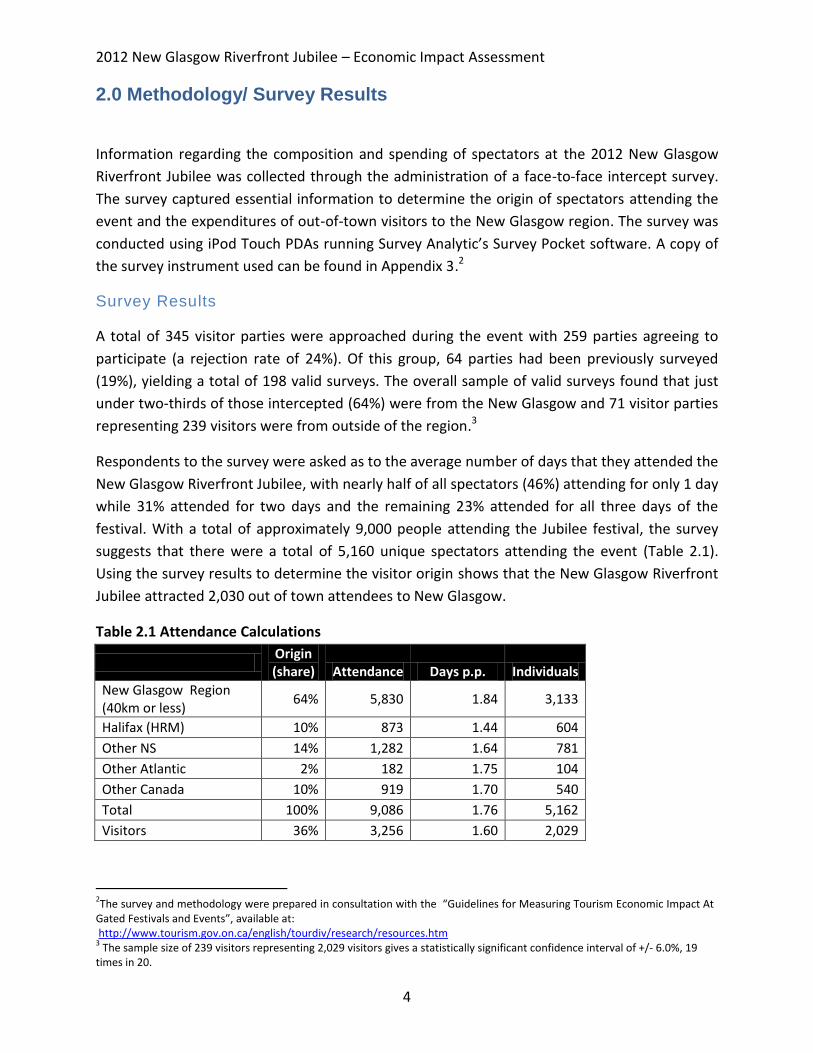
Respondents to the survey were asked as to the average number of days that they attended the
New Glasgow Riverfront Jubilee, with nearly half of all spectators (46%) attending for only 1 day
while 31% attended for two days and the remaining 23% attended for all three days of the
festival. With a total of approximately 9,000 people attending the Jubilee festival, the survey
suggests that there were a total of 5,160 unique spectators attending the event (Table 2.1).
Using the survey results to determine the visitor origin shows that the New Glasgow Riverfront
Jubilee attracted 2,030 out of town attendees to New Glasgow.
Table 2.1 Attendance Calculations
Origin (share) Attendance Days p.p. Individuals
New Glasgow Region (40km or less)
64% 5,830 1.84 3,133
Halifax (HRM) 10% 873 1.44 604
Other NS 14% 1,282 1.64 781
Other Atlantic 2% 182 1.75 104
Other Canada 10% 919 1.70 540
Total 100% 9,086 1.76 5,162
Visitors 36% 3,256 1.60 2,029
2The survey and methodology were prepared in consultation with the “Guidelines for Measuring Tourism Economic Impact At
Gated Festivals and Events”, available at: http://www.tourism.gov.on.ca/english/tourdiv/research/resources.htm 3 The sample size of 239 visitors representing 2,029 visitors gives a statistically significant confidence interval of +/- 6.0%, 19
times in 20.

2012 New Glasgow Riverfront Jubilee – Economic Impact Assessment
5
Visitor Spending
Out-of-town visitors were asked about their expenditures while in New Glasgow. For the
analysis, spectators were divided into three categories: those who made day trips to New
Glasgow; overnight visitors from Halifax and other parts of Nova Scotia, and overnight visitors
from elsewhere. The relatively low accommodation expenditures suggest that many
respondents made use of alternate forms of accommodation such as camping or staying with
friends and relatives in the area.
Table 2.2 Visitor Spending per Person
Sameday NS -
Overnight Atlantic - Overnight
Accommodation $0.00 $50.00 $36.25
Food & Beverage $17.80 $50.88 $59.47
Recreation & Entertainment $7.35 $21.66 $18.29
Merchandise $4.19 $9.29 $13.16
Shopping $4.94 $16.44 $13.55
Car Expenses $9.30 $27.19 $37.24
Taxi / Transit $0.58 $2.02 $1.05
Total $44.17 $177.47 $179.01
Combining the attendance estimates of Table 2.1 with the average spending per person from
Table 2.2 shows that visitors to the New Glasgow Riverfront Jubilee spent more than $256,000
in New Glasgow.
Table 2.3 Aggregate Visitor Spending
Sameday NS -
Overnight Other -
Overnight Total
Visitors 787 704 538 2,029
Accommodation $0 $35,197 $19,513 $54,710
Food & Beverage $14,009 $35,817 $32,013 $81,839
Recreation & Entertainment $5,789 $15,246 $9,845 $30,880
Merchandise $3,297 $6,542 $7,083 $16,922
Shopping $3,888 $11,570 $7,295 $22,752
Car Expenses $7,323 $19,140 $20,044 $46,508
Taxi / Transit $460 $1,419 $567 $2,446
Total $34,766 $124,931 $96,360 $256,057
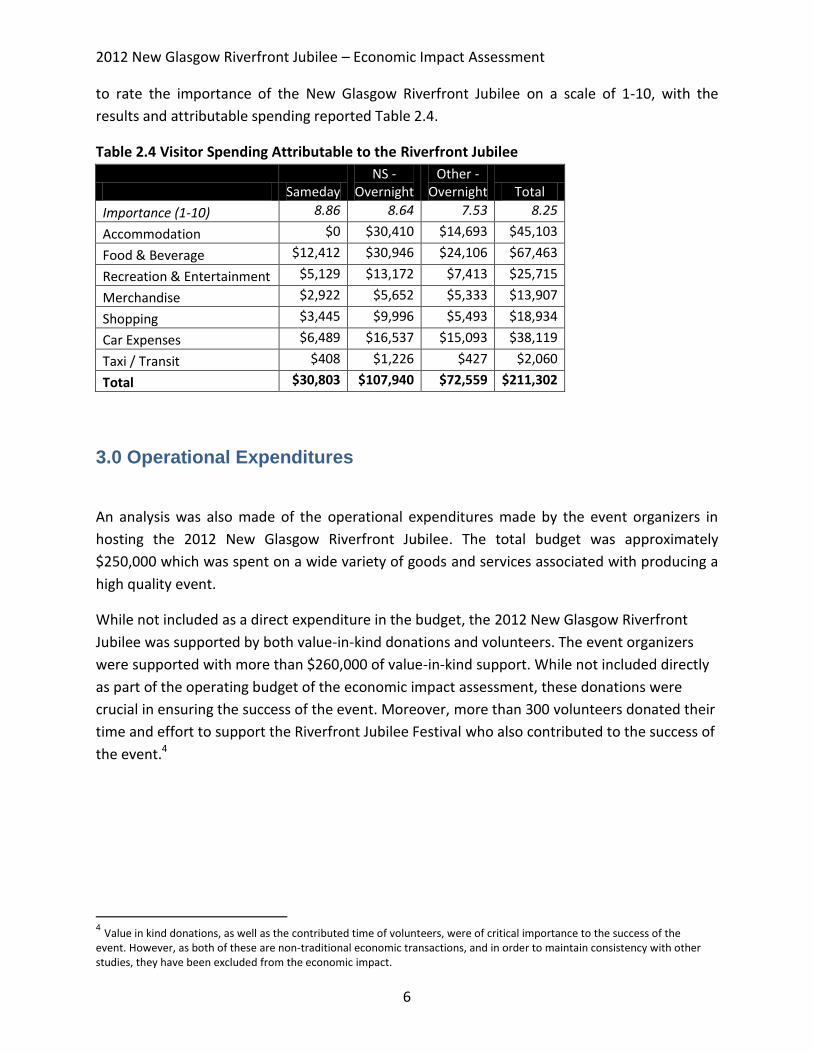
The final step is to incorporate the attribution factor, or the importance of the New Glasgow
Riverfront Jubilee in travellers’ decision to visit New Glasgow. Survey respondents were asked
2012 New Glasgow Riverfront Jubilee – Economic Impact Assessment
6
to rate the importance of the New Glasgow Riverfront Jubilee on a scale of 1-10, with the
results and attributable spending reported Table 2.4.
Table 2.4 Visitor Spending Attributable to the Riverfront Jubilee
Sameday NS -
Overnight Other -
Overnight Total
Importance (1-10) 8.86 8.64 7.53 8.25
Accommodation $0 $30,410 $14,693 $45,103
Food & Beverage $12,412 $30,946 $24,106 $67,463
Recreation & Entertainment $5,129 $13,172 $7,413 $25,715
Merchandise $2,922 $5,652 $5,333 $13,907
Shopping $3,445 $9,996 $5,493 $18,934
Car Expenses $6,489 $16,537 $15,093 $38,119
Taxi / Transit $408 $1,226 $427 $2,060
Total $30,803 $107,940 $72,559 $211,302
3.0 Operational Expenditures
An analysis was also made of the operational expenditures made by the event organizers in
hosting the 2012 New Glasgow Riverfront Jubilee. The total budget was approximately
$250,000 which was spent on a wide variety of goods and services associated with producing a
high quality event.
While not included as a direct expenditure in the budget, the 2012 New Glasgow Riverfront
Jubilee was supported by both value-in-kind donations and volunteers. The event organizers
were supported with more than $260,000 of value-in-kind support. While not included directly
as part of the operating budget of the economic impact assessment, these donations were
crucial in ensuring the success of the event. Moreover, more than 300 volunteers donated their
time and effort to support the Riverfront Jubilee Festival who also contributed to the success of
the event.4
4 Value in kind donations, as well as the contributed time of volunteers, were of critical importance to the success of the
event. However, as both of these are non-traditional economic transactions, and in order to maintain consistency with other studies, they have been excluded from the economic impact.
2012 New Glasgow Riverfront Jubilee – Economic Impact Assessment
7
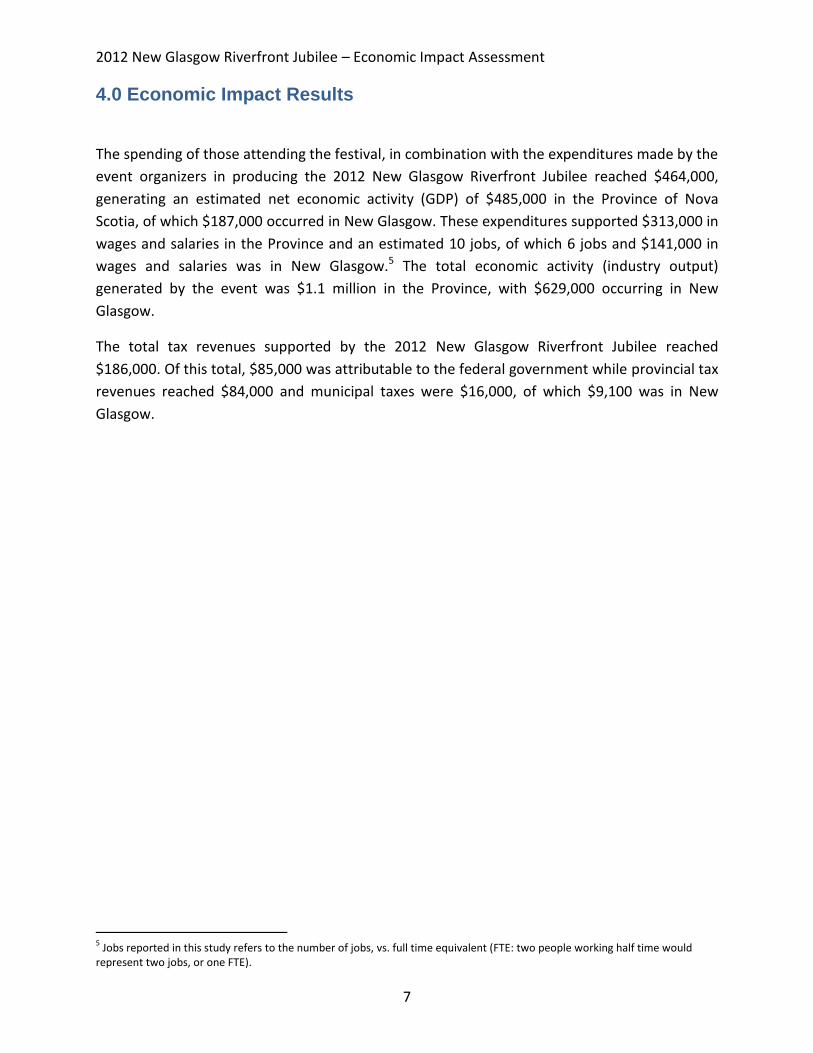
4.0 Economic Impact Results
The spending of those attending the festival, in combination with the expenditures made by the
event organizers in producing the 2012 New Glasgow Riverfront Jubilee reached $464,000,
generating an estimated net economic activity (GDP) of $485,000 in the Province of Nova
Scotia, of which $187,000 occurred in New Glasgow. These expenditures supported $313,000 in
wages and salaries in the Province and an estimated 10 jobs, of which 6 jobs and $141,000 in
wages and salaries was in New Glasgow.5 The total economic activity (industry output)
generated by the event was $1.1 million in the Province, with $629,000 occurring in New
Glasgow.
The total tax revenues supported by the 2012 New Glasgow Riverfront Jubilee reached
$186,000. Of this total, $85,000 was attributable to the federal government while provincial tax
revenues reached $84,000 and municipal taxes were $16,000, of which $9,100 was in New
Glasgow.
5 Jobs reported in this study refers to the number of jobs, vs. full time equivalent (FTE: two people working half time would
represent two jobs, or one FTE).
2012 New Glasgow Riverfront Jubilee – Economic Impact Assessment
8
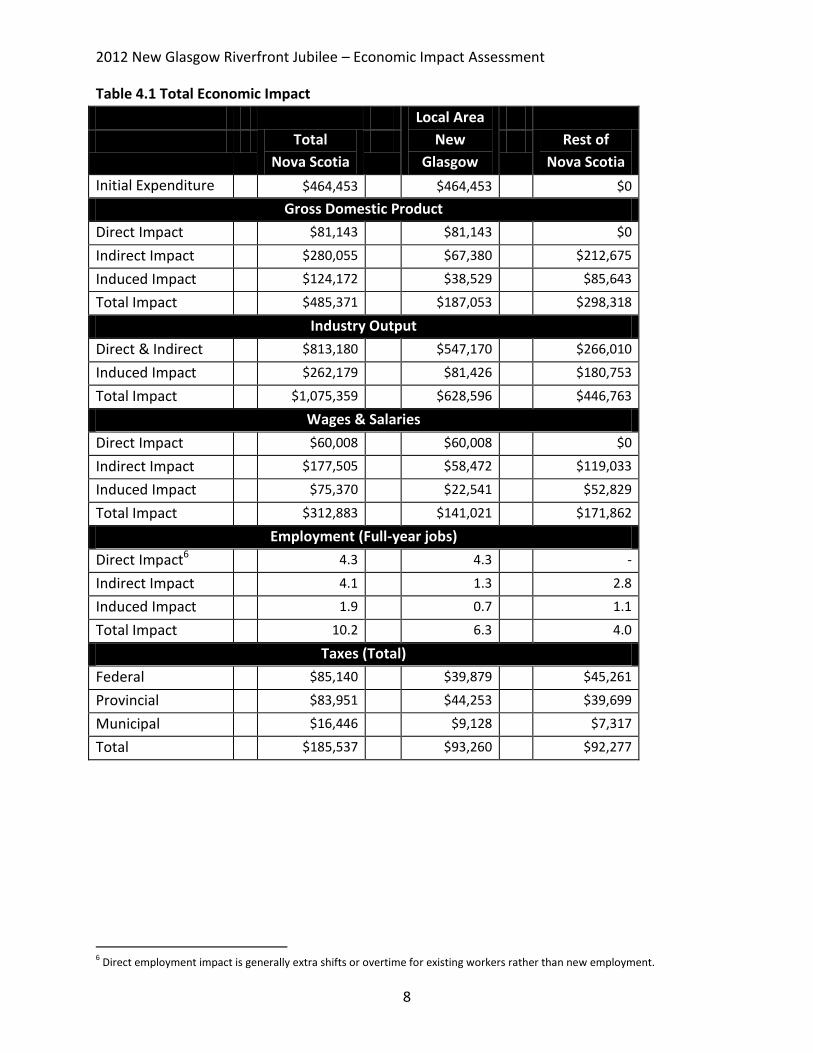
Table 4.1 Total Economic Impact
Total
Nova Scotia
Local Area
New
Glasgow
Rest of
Nova Scotia
Initial Expenditure $464,453 $464,453 $0
Gross Domestic Product
Direct Impact $81,143 $81,143 $0
Indirect Impact $280,055 $67,380 $212,675
Induced Impact $124,172 $38,529 $85,643
Total Impact $485,371 $187,053 $298,318
Industry Output
Direct & Indirect $813,180 $547,170 $266,010
Induced Impact $262,179 $81,426 $180,753
Total Impact $1,075,359 $628,596 $446,763
Wages & Salaries
Direct Impact $60,008 $60,008 $0
Indirect Impact $177,505 $58,472 $119,033
Induced Impact $75,370 $22,541 $52,829
Total Impact $312,883 $141,021 $171,862
Employment (Full-year jobs)
Direct Impact6 4.3 4.3 -
Indirect Impact 4.1 1.3 2.8
Induced Impact 1.9 0.7 1.1
Total Impact 10.2 6.3 4.0
Taxes (Total)
Federal $85,140 $39,879 $45,261
Provincial $83,951 $44,253 $39,699
Municipal $16,446 $9,128 $7,317
Total $185,537 $93,260 $92,277
6 Direct employment impact is generally extra shifts or overtime for existing workers rather than new employment.

2012 New Glasgow Riverfront Jubilee – Economic Impact Assessment
9
Appendix 1: Economic Impact Methodology – STEAM
Background
Briefly, the purpose of STEAM is to calculate both the provincial and regional economic impacts
of sport tourism. The economic impacts are calculated on the basis of capital and operating
expenditures on goods, services and employee salaries, and on the basis of tourist spending
within a designated tourism sector. The elements used to measure the economic impacts are
Gross Domestic Product (GDP), Employment, Taxes, Industry Output and Imports. STEAM
measures the direct, indirect & induced effects for each of these elements.
Technical Description of the Impact Methodology used by STEAM
STEAM and many other impact studies are based on input-output techniques. Input-output
models involve the use of coefficients that are based on economic or business linkages. These
linkages trace how tourist expenditures or business operations filter through the economy. In
turn, the coefficients applied are then used to quantify how tourism related activity in a
particular region generates employment, taxes, income, etc. The input-output approach
indicates not only the direct and indirect impact of tourism, but can also indicate the induced
effect resulting from the re-spending of wages and salaries generated.
All impacts generated by the model are given at the direct impact stage (i.e. the "front line"
businesses impacted by tourism expenditures), indirect impact stage (i.e. those industries which
supply commodities and/or services to the "front line" businesses) and the induced impact
stage (induced consumption attributable to the wages and salaries generated from both the
direct and indirect impact). In this sense, the model is closed with respect to wages. Imports are
also determined within the model, so the model is closed with respect to imports. Exports are
not endogenized (i.e. additional exports are not assumed with the induced impact) which
consequently generates more conservative impacts. Another assumption of the model, which
leads to more conservative impacts, is that not all commodities and/or services purchased are
assumed to have at least one stage of production within the province. This assumption is crucial
for souvenirs, gasoline and other commodities.
2012 New Glasgow Riverfront Jubilee – Economic Impact Assessment
10
Taxes and employment are key economic considerations. However, as these concepts fall
outside of the System of National Account Provincial input/output tables, their impacts must be
calculated separately. Current tax and employment data for each region is used to
econometrically estimate a series of coefficients and rates. These coefficients and/or rates are
then applied to measures determined within the input-output framework of the model, yielding
the final tax and employment figures.
Regional (Sub-Provincial) Impact Methodology
The method used to simulate intraprovincial commodity flows and ultimately regional impacts
follows directly from regional economic principles. The principle is referred to as the "gravity
model". Basically the "gravity model" states that the required commodity (& service) inputs will
be "recruited" in a manner that takes into consideration economies of scale (i.e. production
costs), transportation costs and the availability of specific industries. Economies of scale (i.e.
lower production costs) are positively correlated with input demand while greater
transportation costs are negatively correlated with input demand. Fulfilling that demand from
other provincial regions is contingent on the fact that the specific industry does actually exist.
An advantage of using the "gravity model" to simulate intraprovincial commodity flows is that
as the industrial composition of the labour force changes, or as new industries appear for the
first time in specific regions, the share of production between the various sub-provincial regions
also changes.
By following this principle of the gravity model, all sub-provincial regions of a province are
assigned a coefficient for their relative economies of scale in each industry (using the latest
industry labour force measures) as well as a coefficient to represent the transportation cost
involved to get each industry's output to the designated market. One variation on the "gravity
model" principle involves the estimation of "relative trade distances" by incorporating different
"weights" for different modes of transport. Once these coefficients are generated for all regions
and over all industries, a measure of sensitivity (mostly relative to price, but in the case of
service industries also to a "local preference criteria") is then applied to all commodities.
Another variation on the strict "gravity model" approach is that the measure of sensitivity is
adjusted by varying the distance exponent (which in the basic "gravity model" is 2) based on the
commodity or service required. The variation in distance exponents revolve, principally, around
two research hypotheses: (1) the greater the proportion of total shipments from the largest
producer (or shipper), the lower the exponent, and (2) the greater the proportion of total flow
which is local (intraregional), the higher the exponent.
2012 New Glasgow Riverfront Jubilee – Economic Impact Assessment
11
Appendix 2: Glossary of Terms Used by STEAM
Initial Expenditure - This figure indicates the amount of initial expenditures or revenue used in
the analysis. This heading indicates not only the total magnitude of the spending but also the
region in which it was spent (thus establishing the "impact" region).
Direct Impact - Relates ONLY to the impact on “front-line” businesses. These are businesses
that initially receive the operating revenue or tourist expenditures for the project under
analysis. From a business perspective, this impact is limited only to that particular business or
group of businesses involved. From a tourist spending perspective, this can include all
businesses such as hotels, restaurants, retail stores, transportation carriers, attraction facilities
and so forth.
Indirect Impact - Refers to the impacts resulting from all intermediate rounds of production in
the supply of goods and services to industry sectors identified in the direct impact phase. An
example of this would be the supply and production of bed sheets to a hotel.
Induced Impact - These impacts are generated as a result of spending by employees (in the
form of consumer spending) and businesses (in the form of investment) that benefited either
directly or indirectly from the initial expenditures under analysis. An example of induced
consumer spending would be the impacts generated by hotel employees on typical consumer
items such as groceries, shoes, cameras, etc. An example of induced business investment would
be the impacts generated by the spending of retained earnings, attributable to the
expenditures under analysis, on machinery and equipment.
Gross Domestic Product (GDP) - This figure represents the total value of production of goods
and services in the economy resulting from the initial expenditure under analysis (valued at
market prices).
NOTE: The multiplier (A), Total/Initial, represents the total (direct, indirect and induced) impact
on GDP for every dollar of direct GDP. This is a measure of the level of spin-off activity
generated as a result of a particular project. For instance if this multiplier is 1.5 then this implies
that for every dollar of GDP directly generated by “front-line” tourism businesses an additional
$0.50 of GDP is generated in spin-off activity (e.g. suppliers).
The multiplier (B), Total/$ Expenditure, represent the total (direct, indirect and induced) impact
on GDP for every dollar of expenditure (or revenue from a business perspective). This is a
measure of how effective project related expenditures translate into GDP for the province (or
region). Depending upon the level of expenditures, this multiplier ultimately determines the
overall level of net economic activity associated with the project. To take an example, if this
multiplier is 1.0, this means that for every dollar of expenditure, one dollar of total GDP is
2012 New Glasgow Riverfront Jubilee – Economic Impact Assessment
12
generated. The magnitude of this multiplier is influenced by the level of withdrawals, or
imports, necessary to sustain both production and final demand requirements. The less capable
a region or province is at fulfilling all necessary production and final demand requirements, all
things being equal, the lower the eventual economic impact will be.
GDP (at factor cost) - This figure represents the total value of production of goods and services
produced by industries resulting from the factors of production. The distinction to GDP (at
market prices) is that GDP (at factor cost) is less by the amount of indirect taxes plus subsidies.
Wages & Salaries - This figure represents the amount of wages and salaries generated by the
initial expenditure. This information is broken down by the direct, indirect and induced impacts.
Employment - Depending upon the selection of employment units (person-years or equivalent
full-year jobs) these figures represent the employment generated by the initial expenditure.
These figures distinguish between the direct, indirect and induced impact. “Equivalent Full-Year
Jobs”, if selected, include both part-time and full-time work in ratios consistent with the specific
industries.
NOTE: The multiplier (B) is analogous to Multiplier (B) described earlier with the exception
being that employment values are represented per $1,000,000 of spending rather than per
dollar of spending. This is done to alleviate the problem of comparing very small numbers that
would be generated using the traditional notion of a multiplier (i.e. employment per dollar of
initial expenditure).
Industry Output - These figures represent the direct & indirect and total impact (including
induced impacts) on industry output generated by the initial tourism expenditure. It should be
noted that the industry output measure represents the sum total of all economic activity that
has taken place and consequently involve double counting on the part of the intermediate
production phase. Since the Gross Domestic Product (GDP) figure includes only the net total of
all economic activity (i.e. considers only the value added), the industry output measure will
always exceed or at least equal the value of GDP.
Taxes - These figures represent the amount of taxes contributed to municipal, provincial and
federal levels of government relating to the project under analysis. This information is broken
down by the direct, indirect and induced impacts.
Imports - These figures indicate the direct, indirect and induced final demand and intermediate
production requirements for imports both outside the province and internationally.