2012 global energy drinks
DESCRIPTION
Zenith's 2012 market report on Global Energy Drinks (Preview)TRANSCRIPT
zenithinternational
specialist consultants to the food and drink industries worldwide
STRATEGY & MANAGEMENT MERGERS & ACQUISITIONS COMMERCIAL & MARKET OPERATIONS & TECHNICAL WATER & GEOTHERMAL ENVIRONMENT & CARBON PACKAGING & DISTRIBUTION
Zenith Report
Global Energy Drinks
2012

zenithinternational
specialist consultants to the food and drink industries worldwide © Zenith International Ltd 2012
Contents Global Overview Page 9-35
Global market commentary 10
Executive summary 10
Overview 12
Global Consumption Tables/Charts: 15
Global consumption, volume, 2007-2011 15
Global consumption, value, 2007-2011 15
Consumption by region, volume 2007-2011 16
Consumption by region, value, 2007-2011 16
Consumption change by region, volume, 2007-2011 17
Consumption change by region, value, 2007-2011 17
Consumption share by region, volume, 2007-2011 18
Consumption share by region, value, 2007-2011 18
Consumption per person by region, 2007-2011 19
Expenditure per person by region, 2007-2011 19
Consumption per person change by region, 2007-2011 20
Expenditure per person change by region, 2007-2011 20
Segmentation: energy drinks vs energy shots, volume, 2007-2011 21
Segmentation: branded vs private label activity, 2011 22
Segmentation: distribution by channels, 2011 22
Segmentation: packaging type, 2011 23
Segmentation: regular vs diet, 2011 23
Global consumption, volume, 2012-2016 24
Global consumption, value, 2012-2016 24
zenithinternational
specialist consultants to the food and drink industries worldwide © Zenith International Ltd 2012
Contents Global Overview
Global Consumption Tables/Charts:
Consumption by region, volume, 2012-2016 25
Consumption by region, value, 2012-2016 25
Consumption change by region, volume, 2012-2016 26
Consumption change by region, value, 2012-2016 26
Consumption share by region, volume, 2012-2016 27
Consumption share by region, value, 2012-2016 27
Consumption per person by region, 2012-2016 28
Expenditure per person by region, 2012-2016 28
Consumption per person change by region, 2012-2016 29
Expenditure per person change by region, 2012-2016 29
Consumption ranking (top 20 countries), volume, 2012-2016 30
Consumption ranking (top 20 countries), value, 2012-2016 31
Consumption per person ranking (top 20 countries), 2007-2016 32
Expenditure per person ranking (top 20 countries), 2007-2016 33
Segmentation: energy drinks vs energy shots, volume, 2012-2016 34
Top 10 company profiles 35

zenithinternational
specialist consultants to the food and drink industries worldwide © Zenith International Ltd 2012
Contents Regional Overviews (8)
Regional market commentary
Regional Consumption Tables/Charts:
Consumption by country, volume, 2007-2011
Consumption by country, value, 2007-2011
Consumption change by country, volume, 2007-2011
Consumption change by country, value, 2007-2011
Consumption per person by country, volume, 2007-2011
Expenditure per person by country, value, 2007-2011
Consumption per person change by country, 2007-2011
Expenditure per person change by country, 2007-2011
Segmentation: energy drinks vs energy shots, volume, 2007-2011
Segmentation: branded vs private label activity, 2011
Segmentation: packaging type, 2011
Segmentation: regular vs diet, 2011
Segmentation: distribution by channels, 2011
Consumption by country, volume, 2012-2016
Consumption by country, value, 2012-2016
Consumption change by country, volume, 2012-2016
Consumption change by country, value, 2012-2016
Consumption per person by country, 2012-2016
Expenditure per person by country, 2012-2016
Consumption per person change by country, 2012-2016
Expenditure per person change by country, 2012-2016
Segmentation: energy drinks vs energy shots, volume, 2012-2016

zenithinternational
specialist consultants to the food and drink industries worldwide © Zenith International Ltd 2012
Contents Country Profiles (57)
Country market commentary:
Market size
Energy shots overview
Leading companies
Brands and private label
Channels
Packaging
Ingredients and flavours
New product development
Consumer demographics
Industry developments
Energy drink forecasts
Energy shot forecasts
Country Tables/Charts:
Energy drinks volume and value, 2007-2011
Energy shots volume and value, 2007-2011
Share of energy drinks vs energy shots, volume, 2007-2011
Top 3-5 companies, volume, 2007-2011
Top 3-5 companies, value, 2007-2011
Top companies share, volume, 2011
Segmentation: branded vs private label activity, 2011
Segmentation: packaging type, 2011
Segmentation: regular vs diet, 2011
Segmentation: distribution by channels, 2011
Energy drinks volume and value, 2012-2016
Energy shots volume and value, 2012-2016
Share of energy drinks vs energy shots, volume, 2012-2016

zenithinternational
specialist consultants to the food and drink industries worldwide © Zenith International Ltd 2012
Contents Regional overviews and Country profiles include:
Africa
55-73 Algeria 74
Egypt 84
Morocco 94
South Africa 104
Tunisia 114
Asia Pacific
124-150 Cambodia 151
China 161
India 172
Indonesia 184
Japan 195
Singapore 206
Thailand 217
Vietnam 230
Australasia
240-258 Australia 259
New Zealand 271
East Europe
282-309 Bulgaria 310
Czech Republic 322
Estonia 333
Hungary 344
Latvia 355
Lithuania 365
Poland 375
Romania 390
Russia 402
Ukraine 416
Latin America
430-457 Argentina 458
Brazil 467
Chile 476
Colombia 485
Mexico 494
Paraguay 507
Peru 516
Uruguay 525
Venezuela 534

zenithinternational
specialist consultants to the food and drink industries worldwide © Zenith International Ltd 2012
Contents Regional overviews and Country profiles include:
Middle East
543-561 Iran 562
Israel 572
Kuwait 583
Saudi Arabia 593
Turkey 604
UAE 615
North America
625-644 Canada 645
USA 657
West Europe
670-698 Austria 699
Belgium 708
Denmark 719
Finland 733
France 747
Germany 761
Ireland 775
Italy 785
Netherlands 795
Norway 807
Portugal 821
Spain 831
Sweden 841
Switzerland 855
UK 865
.................................................
Appendix
Market definition 876
zenithinternational
specialist consultants to the food and drink industries worldwide © Zenith International Ltd 2012
Methodology Research note
In undertaking its research for this latest series of reports, Zenith has utilised its internal data library and global databases, alongside other third party sources. Throughout its ongoing research, Zenith also depends upon the goodwill and co-operation of operators active in the marketplace and, as such, achieves a high level of accuracy. Liability Whilst every effort has been made to ensure that the information presented in this document is accurate and that the opinions expressed are sound, Zenith International Ltd cannot be made liable for any errors or omissions or for any losses or consequential losses resulting from decisions based on its contents. Zenith International Ltd 7 Kingsmead Square Bath BA1 2AB United Kingdom t +44 (0) 1225 327900 f +44 (0) 1225 327901
www.zenithinternational.com

zenithinternational
specialist consultants to the food and drink industries worldwide © Zenith International Ltd 2012
Country energy drinks Market overview
Market size
Commentary
Energy shots
Commentary
Leading companies
Commentary
Brands and private label
Commentary
zenithinternational
specialist consultants to the food and drink industries worldwide © Zenith International Ltd 2012
Country energy drinks Market overview
Channels
Commentary
Packaging
Commentary
Ingredients and flavours
Commentary
New product development
Commentary

zenithinternational
specialist consultants to the food and drink industries worldwide © Zenith International Ltd 2012
Country energy drinks Market overview
Consumer demographics
Commentary
Industry developments
Commentary
Energy drink forecasts
Commentary
Energy shot forecasts
Commentary

zenithinternational
specialist consultants to the food and drink industries worldwide © Zenith International Ltd 2012
Country energy drinks Market volume and value 2007-11
2007 2008 2009 2010 2011e
Volume (mln litres) 0.310 0.460 0.530 0.907 0.974
% change +10.7 +48.4 +15.2 +71.1 +7.4
per capita consumption (litres) 0.0 0.0 0.0 0.0 0.0
Value (mln €) 1.5 2.9 3.1 6.6 7.2
% change +66.8 +95.0 +6.4 +115.2 +9.4
per capita expenditure (€) 0.0 0.1 0.1 0.2 0.2
Average value per litre (€) 4.8 6.3 5.8 7.3 7.4
Energy drinks volume and value, 2007-2011
0%
10%
20%
30%
40%
50%
60%
70%
80%
90%
100%
2007 2008 2009 2010 2011e
% share energy drinks vs shots
Energy shots
Energy drinks
2007 2008 2009 2010 2011e
Volume (mln litres) 0.0 0.0 0.0 0.013 0.016
% change - - - - +23.1
per capita consumption (litres) 0.0 0.0 0.0 0.0 0.0
Value (mln €) 0.0 0.0 0.0 0.1 0.2
% change - - - - +26.3
per capita expenditure (€) 0.0 0.0 0.0 0.0 0.0
Average value per litre (€) - - - 9.9 10.2
Energy shots volume and value, 2007-2011
zenithinternational
specialist consultants to the food and drink industries worldwide © Zenith International Ltd 2012
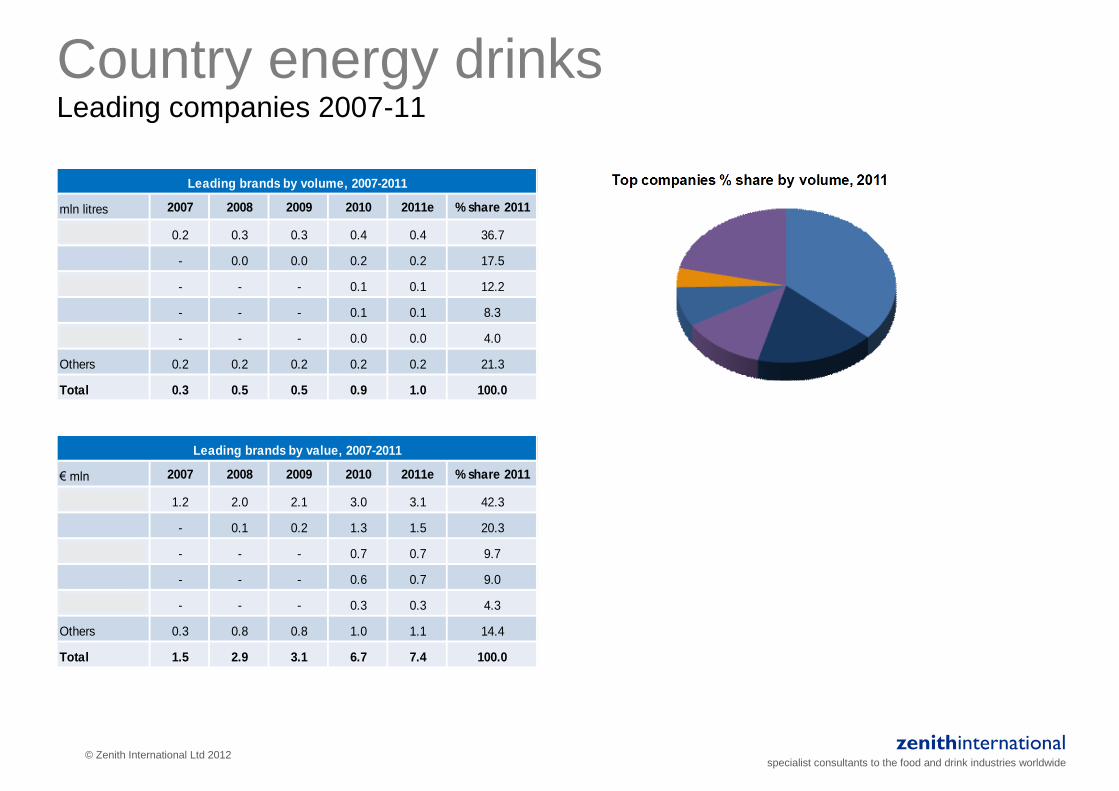
Country energy drinks Leading companies 2007-11
mln litres 2007 2008 2009 2010 2011e % share 2011
Red Bull 0.2 0.3 0.3 0.4 0.4 36.7
Burn - 0.0 0.0 0.2 0.2 17.5
Brune - - - 0.1 0.1 12.2
Power Horse - - - 0.1 0.1 8.3
Bison - - - 0.0 0.0 4.0
Others 0.2 0.2 0.2 0.2 0.2 21.3
Total 0.3 0.5 0.5 0.9 1.0 100.0
Leading brands by volume, 2007-2011
€ mln 2007 2008 2009 2010 2011e % share 2011
Red Bull 1.2 2.0 2.1 3.0 3.1 42.3
Burn - 0.1 0.2 1.3 1.5 20.3
Brune - - - 0.7 0.7 9.7
Power Horse - - - 0.6 0.7 9.0
Bison - - - 0.3 0.3 4.3
Others 0.3 0.8 0.8 1.0 1.1 14.4
Total 1.5 2.9 3.1 6.7 7.4 100.0
Leading brands by value, 2007-2011
zenithinternational
specialist consultants to the food and drink industries worldwide © Zenith International Ltd 2012
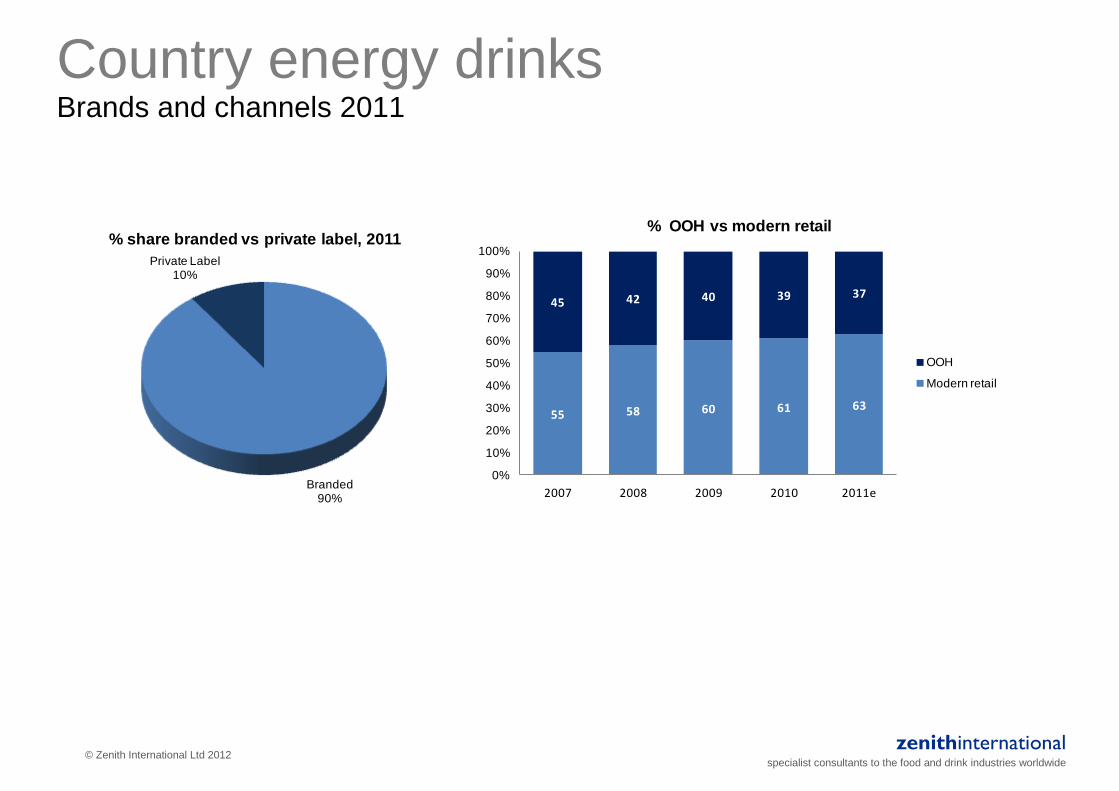
Country energy drinks Brands and channels 2011
55 58 60 61 63
45 42 40 39 37
0%
10%
20%
30%
40%
50%
60%
70%
80%
90%
100%
2007 2008 2009 2010 2011e
% OOH vs modern retail
OOH
Modern retail
Branded90%
Private Label10%
% share branded vs private label, 2011
zenithinternational
specialist consultants to the food and drink industries worldwide © Zenith International Ltd 2012
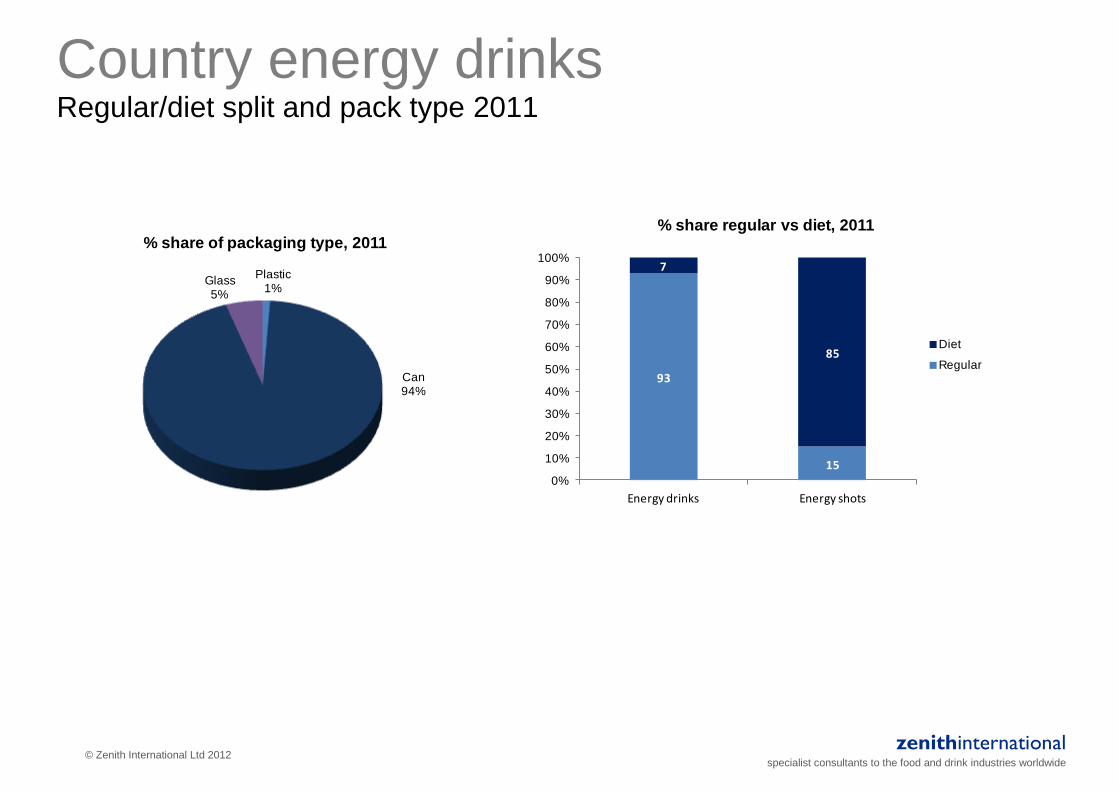
Country energy drinks Regular/diet split and pack type 2011
Plastic1%
Can94%
Glass5%
% share of packaging type, 2011
93
15
7
85
0%
10%
20%
30%
40%
50%
60%
70%
80%
90%
100%
Energy drinks Energy shots
% share regular vs diet, 2011
Diet
Regular

zenithinternational
specialist consultants to the food and drink industries worldwide © Zenith International Ltd 2012
Country energy drinks Forecasts 2012-16
2012f 2013f 2014f 2015f 2016f
Volume (mln litres) 1.0 1.1 1.2 1.3 1.4
% change +1.2 +9.0 +8.4 +11.2 +10.3
per capita consumption (litres) 0.0 0.0 0.0 0.0 0.0
Value (mln €) 7.3 8.0 8.6 9.6 10.6
% change +1.2 +9.0 +8.4 +11.2 +10.3
per capita expenditure (€) 0.2 0.2 0.2 0.3 0.3
Average value per litre (€) 7.4 7.4 7.4 7.4 7.4
Energy drinks volume and value, 2012-2016
0%
10%
20%
30%
40%
50%
60%
70%
80%
90%
100%
2012f 2013f 2014f 2015f 2016f
% share energy drinks vs shots
Energy shots
Energy drinks
2012f 2013f 2014f 2015f 2016f
Volume (mln litres) 0.0 0.0 0.0 0.0 0.0
% change -31.6 -66.2 - - -
per capita consumption (litres) 0.0 0.0 0.0 0.0 0.0
Value (mln €) 0.1 0.0 0.0 0.0 0.0
% change -31.6 -66.2 - - -
per capita expenditure (€) 0.0 0.0 0.0 0.0 0.0
Average value per litre (€) +10.2 +10.2 - - -
Energy shots volume and value, 2012-2016

zenithinternational
specialist consultants to the food and drink industries worldwide
STRATEGY & MANAGEMENT MERGERS & ACQUISITIONS COMMERCIAL & MARKET OPERATIONS & TECHNICAL WATER & GEOTHERMAL ENVIRONMENT & CARBON PACKAGING & DISTRIBUTION
For more detailed market data and analysis, please see the full list of our industry reports here or for a tailor made study specific to your requirements, please email [email protected], visit our website www.zenithinternational.com or telephone our head office on +44(0)1125 327 900. To subscribe to FREE daily industry news from Zenith International, please click here. Zenith also offers specific news services, including a bottled water newsletter, plus online data resources and continuous market monitoring. Zenith's associated company, Foodbev Media, also publishes several highly respected industry magazines. Our consulting activities are wide ranging. These include tailor made market studies, strategic advice, acquisitions and due diligence, business plans and cost modelling through to plant construction and operational efficiency, environmental audits and groundwater development. To discuss any of Zenith’s services, please telephone our head office on +44 (0)1225 327900 or visit www.zenithinternational.com.