2011 census bulletin #4 dwellings & structure type in
TRANSCRIPT

2011 Census Bulletin #4
Dwellings & Structure Type in Metro Vancouver
Regional Dwelling Count
According to the 2011 Census figures recently released by Statistics Canada, there were 891,340 occupied private dwellings in Metro Vancouver on May 10 2011.
Dwellings are distinct from households. Dwellings refer to the physical set of living quarters, whereas household characteristics pertain to the person or the group of persons who occupy a dwelling. The term “occupied private dwelling” refers to living quarters in which a person or a group of persons resides and by definition excludes vacant dwellings, commercial and institutional rooms.
The 2011 Census figure of 891,340 occupied private dwellings is an increase of 74,300 dwellings units over the 2006 Census. The region’s private housing stock grew by 9.8% since the 2006 Census, higher than the 8.4% (58,320 units) during the preceding five years (2001-2006).
Table 1: Occupied Private Dwellings in Metro Vancouver, 1996 - 2011
Source: Statistics Canada, Census Division
Ground Oriented and Apartment Dwelling Units
Census dwellings by structure type provide the best available proxy on the composition of Metro Vancouver’s current and historical housing stock. Statistics Canada classifies private dwellings into eight structural type categories. Due to historical definition changes among several categories, longer term housing trends are better represented by collapsing private dwellings into two distinct types; ground oriented1 and apartments2.
1 Ground Oriented units consist of the following structural types: single-detached, semi-detached, row house, apartment duplex (consisting of two separate households usually upper and lower in a detached dwelling, with one unit considered to be a secondary suite),other single attached housing and moveable dwellings (mobile homes). Apartment units consist of the structural types of apartments with fewer than five storeys (low-rise apartments) and apartments having five or more storeys (high-rise apartments).
YearNo. of Occupied
Private Dwellings
Absolute
Growth
Percentage
Increase
1966 271,956
1971 345,365 73,409 27.0%
1976 407,555 62,190 18.0%
1981 476,755 69,200 17.0%
1986 530,295 53,540 11.2%
1991 609,375 79,080 14.9%
1996 692,960 83,585 13.7%
2001 758,715 65,755 9.5%
2006 817,035 58,320 8.4%
2011 891,340 74,305 9.8%

Over the 2006-2011 period, Metro Vancouver added 38,430 ground oriented dwellings and 35,870 apartment units. In 2011 ground oriented dwellings accounted for 60% of the region’s housing stock, with the remaining 40% being apartments. For more than five decades, the region’s share of ground oriented dwellings has been dropping, declining from 85% in 1961 to 60% in 2011. Conversely, the share of apartments has risen from 15% to 40%. Table 2: Apartment and Ground Oriented Dwellings in Metro Vancouver, 1961 - 2011
In 2011 the Metro Vancouver municipalities with the greatest proportion of dwellings being apartments was New Westminster (68%), North Vancouver City (63%, and the City of Vancouver with 60% of occupied dwellings. The municipalities with the greatest proportion of ground oriented dwellings in 2011 were Langley Township (92%), Delta (86%) and Maple Ridge (84%).
Total# # % # %
1961 238,742 202,383 85% 36,359 15%
1971 345,825 244,825 71% 101,000 29%
1981 476,755 321,875 68% 154,880 32%
1991 609,405 401,180 66% 208,225 34%
2001 758,725 477,275 63% 281,450 37%
2011 891,340 533,500 60% 357,840 40%
Source: 1961, 1971, 1981, 1991, 2001 and 2011 Census of Canada
Occupied Private Dwellings By Structure
Ground Oriented ApartmentsYear
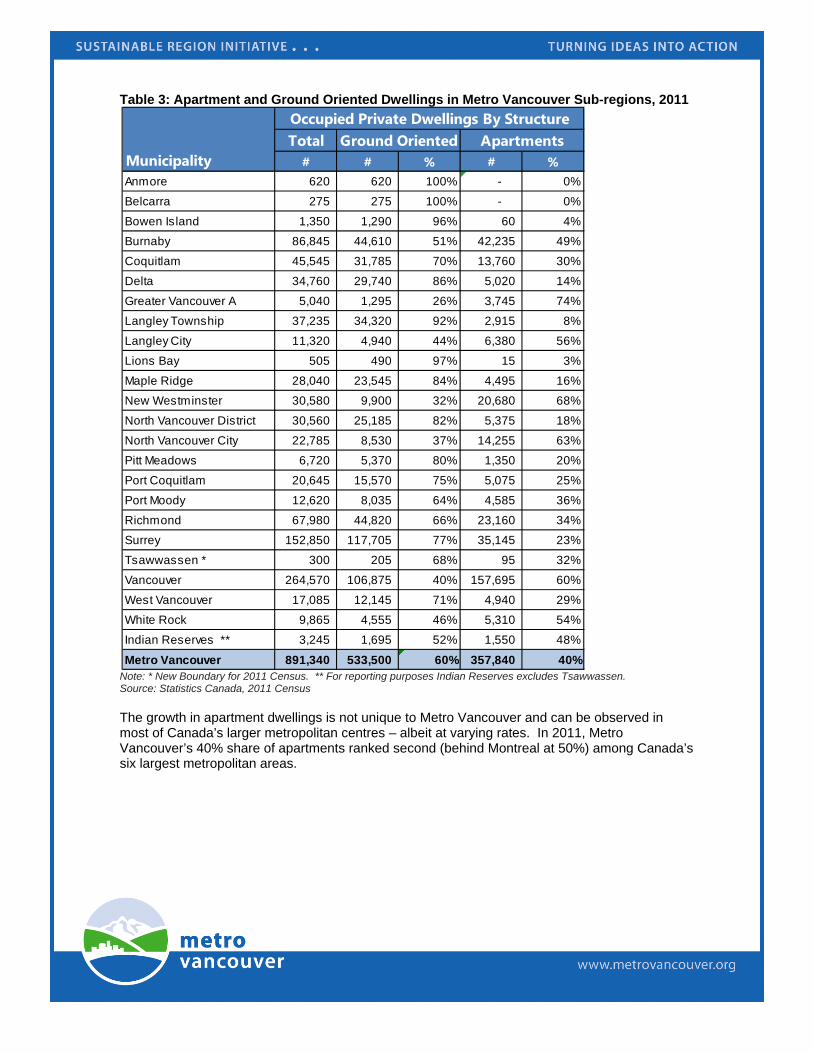
Table 3: Apartment and Ground Oriented Dwellings in Metro Vancouver Sub-regions, 2011
Note: * New Boundary for 2011 Census. ** For reporting purposes Indian Reserves excludes Tsawwassen. Source: Statistics Canada, 2011 Census The growth in apartment dwellings is not unique to Metro Vancouver and can be observed in most of Canada’s larger metropolitan centres – albeit at varying rates. In 2011, Metro Vancouver’s 40% share of apartments ranked second (behind Montreal at 50%) among Canada’s six largest metropolitan areas.
Total# # % # %
Anmore 620 620 100% - 0%
Belcarra 275 275 100% - 0%
Bowen Island 1,350 1,290 96% 60 4%
Burnaby 86,845 44,610 51% 42,235 49%
Coquitlam 45,545 31,785 70% 13,760 30%
Delta 34,760 29,740 86% 5,020 14%
Greater Vancouver A 5,040 1,295 26% 3,745 74%
Langley Township 37,235 34,320 92% 2,915 8%
Langley City 11,320 4,940 44% 6,380 56%
Lions Bay 505 490 97% 15 3%
Maple Ridge 28,040 23,545 84% 4,495 16%
New Westminster 30,580 9,900 32% 20,680 68%
North Vancouver District 30,560 25,185 82% 5,375 18%
North Vancouver City 22,785 8,530 37% 14,255 63%
Pitt Meadows 6,720 5,370 80% 1,350 20%
Port Coquitlam 20,645 15,570 75% 5,075 25%
Port Moody 12,620 8,035 64% 4,585 36%
Richmond 67,980 44,820 66% 23,160 34%
Surrey 152,850 117,705 77% 35,145 23%
Tsawwassen * 300 205 68% 95 32%
Vancouver 264,570 106,875 40% 157,695 60%
West Vancouver 17,085 12,145 71% 4,940 29%
White Rock 9,865 4,555 46% 5,310 54%
Indian Reserves ** 3,245 1,695 52% 1,550 48%
Metro Vancouver 891,340 533,500 60% 357,840 40%
MunicipalityGround Oriented Apartments
Occupied Private Dwellings By Structure

Table 4: Apartment and Ground Oriented Dwellings in Select CMAs, 2011
Interestingly, 2011 Census figures show Canada’s six largest metropolitan areas having distinctive housing shares across the various detailed structural type categories (Table 4). Calgary had the largest share of single detached houses at 61%. Metro Vancouver had the largest share of “Apartment, duplex” (which captures detached houses with secondary suites) at 14%. Ottawa had the largest share of row houses at 16%. Toronto had the largest share of high-rise apartments at 27%. And Montreal had the largest share of low-rise apartments at 41%.
Table 5: Dwelling Units by Structure Type in Select CMA’s
Note: Structure types “movable dwelling” and “other single attached dwelling” are not shown on the table, but are included in the total private dwelling figures.
Census
Metropolitan Total
Area # # % # %
Montreal 1,613,255 812,050 50% 801,205 50%
Metro Vancouver 891,340 533,500 60% 357,840 40%
Toronto 1,989,705 1,235,820 62% 753,885 38%
Ottawa 498,640 358,000 72% 140,640 28%
Edmonton 450,780 340,235 75% 110,545 25%
Calgary 464,005 368,835 79% 95,170 21%
Victoria 153,330 103,445 67% 49,885 33%
Fraser Valley (FVRD) 101,765 81,780 80% 19,985 20%
British Columbia 1,764,635 1,259,515 71% 505,120 29%
Canada 13,320,620 9,688,295 73% 3,632,325 27%
Source: 2011 Census of Canada
Occupied Private Dwellings By Structure
Ground Oriented Apartments
Metropolitan Total
Apartment -
five or more
storeys
Apartment
- fewer than
five storeys
Row
house
Semi-
detached
Apartment,
Duplex
Single-
detached
Toronto 1,989,705 27% 10% 9% 8% 4% 41%
Montréal 1,613,260 8% 41% 3% 5% 9% 33%
Vancouver CMA 498,640 15% 26% 9% 2% 14% 34%
Ottawa 498,640 14% 14% 16% 7% 3% 45%
Calgary 464,000 6% 14% 9% 6% 4% 61%
Edmonton 450,785 6% 19% 8% 5% 2% 59%
Victoria 153,330 6% 27% 6% 4% 14% 42%
Fraser Valley 101,775 1% 18% 9% 3% 11% 55%
British Columbia 1,764,640 8% 20% 7% 3% 10% 48%
Canada 13,320,615 9% 18% 6% 5% 5% 55%

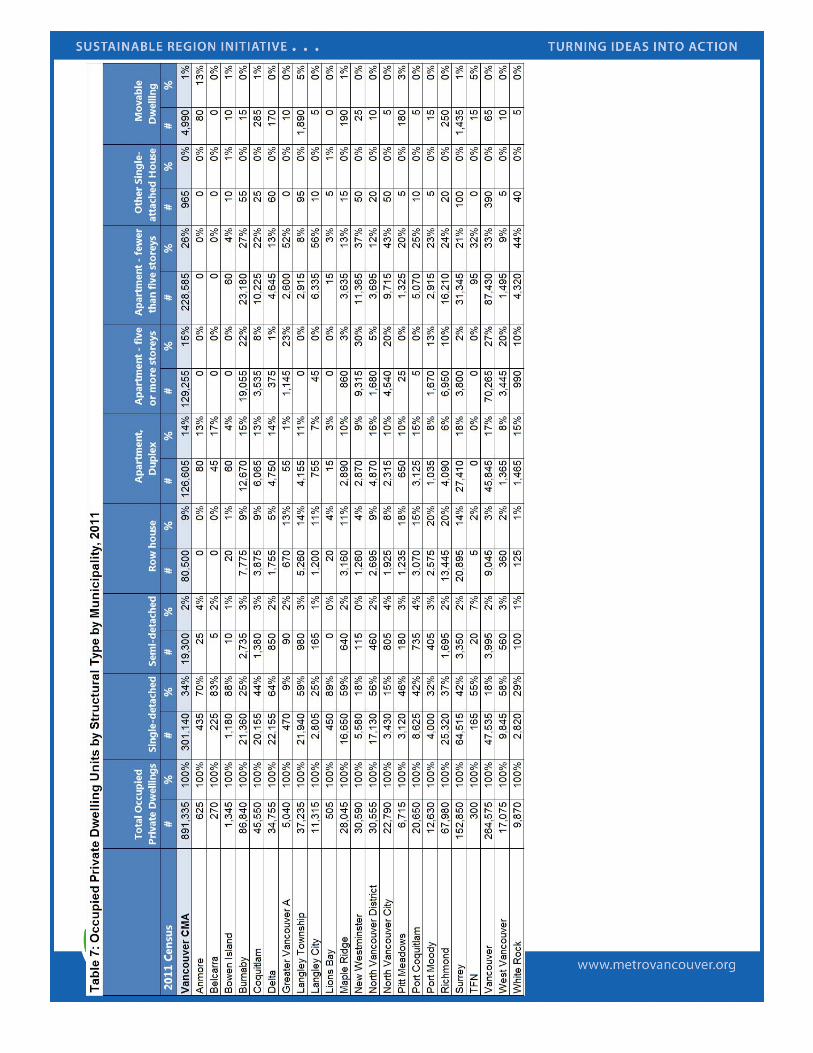
Within the dwelling type categories captured by the 2011 Census, the combined categories for apartments account for the largest share of dwelling type in the region, representing 40% of all occupied private dwellings (357,840 units). High-rise apartments (five or more storeys) account for 15% (129,255 units) of the total, while low-rise apartments account for 26% of total occupied dwelling units (228,585 units).
Table 6. Apartment & Ground Oriented Dwellings in Metro Vancouver Municipalities, 2011
The ground oriented housing forms are primarily single-detached houses, single-detached housing structure type is continuing to decline. Table 6 shows that over the past five years single-detached houses had just 17% of dwelling unit growth (12,820 units), as compared to 34% (25,610 units) for other ground-oriented dwellings and 48% (35,870 units) for apartments.
The five categories of dwelling types described as “Other Ground-Oriented Dwellings” are predominately “apartment, detached duplex” and “row house”. “Apartment, detached duplex” (which captures a detached house with a suite building form) has the highest proportion of total dwelling units, at 14% (126,605 units). Row housing accounts for 9% of the dwelling units (80,500 units). Municipal data is available in Table 7.
The continued shift towards apartment and higher density ground oriented dwellings is a reflection of demographic forces, housing affordability and lifestyle choices in the housing market. It is anticipated that this trend toward higher density housing forms will continue in Metro Vancouver.
Dwelling TypeSingle-detached house 288,320 35% 301,140 34% 12,820 4%
Semi-detached house 19,000 2% 19,300 2% 300 2%
Apartment, detached duplex* 114,235 14% 126,605 14% 12,370 11%
Row house 67,025 8% 80,500 9% 13,475 20%
Other single-attached house 1,125 0% 965 0% -160 -14%
Movable dwelling 5,365 1% 4,990 1% -375 -7%Subtotal, Other Ground-Oriented Dwellings 206,750 25% 232,360 26% 25,610 12%
Apartment, less than five storeys 217,700 27% 228,585 26% 10,885 5%
Apartment, five or more storeys 104,270 13% 129,255 15% 24,985 24%
Subtotal - Apartments 321,970 39% 357,840 40% 35,870 11%
Total - All Dwelling Types 817,035 100% 891,335 100% 74,300 9%
Change
2006 Census 2011 Census 2006 - 2011