2008 celapro 2008 technical report - cde.state.co.us english language acquisition assessment program...
TRANSCRIPT
Copyright © 2008 by the Colorado Department of Education.
Colorado English Language Acquisition Assessment
Program
2008 Technical Report
Submitted to the Colorado Department of Education
July 31, 2008

Developed and published under contract with Colorado Department of Education by CTB/McGraw-Hill LLC, a subsidiary of The McGraw-Hill Companies, Inc., 20 Ryan Ranch Road, Monterey, California 93940-5703. Copyright © 2008 by the Colorado Department of Education. Only State of Colorado educators and citizens may copy, download and/or print this document. Any other use or reproduction of this document, in whole or in part, requires written permission of the Colorado Department of Education and the publisher.

Colorado English Language Acquisition Assessment Program 2008 Technical Report ● 3
Copyright © 2008 by the Colorado Department of Education.
Table of Contents
OVERVIEW.......................................................................................................................................................................6
PART 1: STANDARDS ................................................................................................................................................8 ALIGNMENT STUDIES....................................................................................................................................................8
PART 2: TEST DEVELOPMENT ..............................................................................................................................11 ITEM REVIEW AND TEST FAIRNESS ...........................................................................................................................12 ITEM SELECTION .........................................................................................................................................................13 MINIMIZING TEST BIAS ...............................................................................................................................................13
PART 3: TESTED POPULATION.............................................................................................................................15
PART 4: TEST ADMINISTRATION..........................................................................................................................25 THE SPEAKING SUBTESTS.........................................................................................................................................25
Speak in Words....................................................................................................................................................25 Speak in Sentences ............................................................................................................................................26 Make Conversation .............................................................................................................................................26 Tell a Story ............................................................................................................................................................26
THE LISTENING SUBTESTS.........................................................................................................................................26 Listen for Information ..........................................................................................................................................26 Listen in the Classroom......................................................................................................................................26 Listen and Comprehend.....................................................................................................................................27
THE READING SUBTESTS...........................................................................................................................................27 Analyze Words .....................................................................................................................................................27 Read Words..........................................................................................................................................................28 Read for Understanding.....................................................................................................................................28
THE WRITING SUBTESTS............................................................................................................................................28 Use Conventions .................................................................................................................................................29 Write About ...........................................................................................................................................................29 Write Why..............................................................................................................................................................29 Write in Detail .......................................................................................................................................................29
TEACHER TRAINING ....................................................................................................................................................29 PART 5: SCORING ......................................................................................................................................................30
HANDSCORING PROCESS ..........................................................................................................................................31 Readers .................................................................................................................................................................31 Team Leaders ......................................................................................................................................................31 Scoring Supervisors............................................................................................................................................31 Anchor and Training Papers .............................................................................................................................32 Rater Training and Validation ...........................................................................................................................32
INTRA-RATER RELIABILITY.........................................................................................................................................32 INTER-RATER RELIABILITY .........................................................................................................................................32 SCORING AND TECHNOLOGY QUALITY CONTROL PROCEDURES..........................................................................35
PART 6: DATA ANALYSIS AND RESULTS .........................................................................................................36 IRT ITEM CALIBRATION..............................................................................................................................................36 EQUATING AND SCALING ...........................................................................................................................................37 RESULTS OF THE CALIBRATION AND EQUATING .....................................................................................................38 ITEM ANALYSIS............................................................................................................................................................39

Colorado English Language Acquisition Assessment Program 2008 Technical Report ● 4
Copyright © 2008 by the Colorado Department of Education.
Item Difficulty Statistics (p-values) ...................................................................................................................40 Item-Total Correlations.......................................................................................................................................41 Item Omit Rates...................................................................................................................................................42 Differential Item Functioning (DIF) Statistics .................................................................................................42
STUDENT PERFORMANCE ON THE 2008 CELAPRO ...............................................................................................47 PART 7: RELIABILITY AND VALIDITY EVIDENCE ...........................................................................................66
INTERNAL CONSISTENCY RELIABILITY......................................................................................................................66 STANDARD ERRORS OF MEASUREMENT..................................................................................................................68 CLASSIFICATION CONSISTENCY ................................................................................................................................69 VALIDITY EVIDENCE....................................................................................................................................................70
Content Validity....................................................................................................................................................71 Construct Validity.................................................................................................................................................71
PART 8. SPECIAL STUDIES....................................................................................................................................76
REFERENCES ..............................................................................................................................................................77
Appendices
APPENDIX A: Item Analysis Results
APPENDIX B: Comparison of CELApro 2007 and CELApro 2008 Anchor Parameters
APPENDIX C: TCC & SEM plots by Grade Span
APPENDIX D: Equating Results for Grade Spans
APPENDIX E: Raw-to-Scale Score Tables for Grade Spans
APPENDIX F: CELApro Standards
APPENDIX G: LAS Links Technical Manual
List of Figures
Figure 1. Mean Comprehension Scale Scores by Grade and Gender ......................................................52 Figure 2. Mean Listening Scale Scores by Grade and Gender .................................................................53 Figure 3. Mean Oral Scale Scores by Grade and Gender.........................................................................54 Figure 4. Mean Reading Scale Scores by Grade and Gender ..................................................................55 Figure 5. Mean Speaking Scale Scores by Grade and Gender.................................................................56 Figure 6. Mean Writing Scale Scores by Grade and Gender ....................................................................57 Figure 7. Mean Total Scale Scores by Grade and Gender........................................................................58 Figure 8. Percent of Students at or above the FEP Cut Score by Grade and Gender..............................59 Figure 9. Percent of Students Scoring at or above the Preliminary Cut Score..........................................64
List of Tables Table 1. Comparison of 2007 and 2008 CELApro Grade Spans.................................................................6 Table 2. Item Alignment Percentages by Grade Span ..............................................................................10 Table 3. 2008 CELApro Test Structure......................................................................................................12 Table 4. Examinee Counts by Grade and Gender.....................................................................................15
Colorado English Language Acquisition Assessment Program 2008 Technical Report ● 5
Copyright © 2008 by the Colorado Department of Education.
Table 5. Ethnicity by Grade Span ..............................................................................................................16 Table 6. Home Language (203 Languages Represented) ........................................................................17 Table 7. Speaking Accommodations by Grade..........................................................................................23 Table 8. Listening Accommodations by Grade ..........................................................................................23 Table 9. Reading Accommodations by Grade ...........................................................................................24 Table 10. Writing Accommodations by Grade ...........................................................................................24 Table 11. Estimated Administration Time and Administration Mode by Skill Area....................................25 Table 12. Number of Attendees at Pre-Administration Training Workshops .............................................29 Table 13. Inter-Rater Agreement for CELApro Writing Responses...........................................................34 Table 14. Stocking and Lord Parameter Correlations................................................................................38 Table 15. Mean P-Values by Grade Span and by Grade ..........................................................................41 Table 16. Average Item-Total Correlations by Grade Span and Grade ....................................................42 Table 17. Number of Items Exhibiting Differential Item Functioning..........................................................45 Table 18. 2008 CELApro Lowest and Highest Obtainable Scale Scores..................................................47 Table 19. 2008 Total Scale Score Means and Standard Deviations by Grade Span................................47 Table 20. 2007 and 2008 Total Scale Score Means and Standard Deviations by Grade .........................48 Table 21. CELApro Scale Score Means and Standard Deviations: Component Scales...........................49 Table 22. CELApro Scale Score Means and Standard Deviations by Grade and Gender .......................50 Table 23. Total Scale Score Means by Grade and Accommodations .......................................................60 Table 24. Component Scale Score Means by Grade and Accommodations ............................................61 Table 25. LAS Links and CELApro Cut Scores on Total Test ...................................................................62 Table 26. Percent of Students Scoring at or above Preliminary FEP Cut Score.......................................63 Table 27. Colorado FEP Proficiency Classification, 2007 vs 2008............................................................65 Table 28. Internal Consistency Reliability Coefficients by Grade Span and Grade...................................68 Table 29. Standard Errors of Measurement by Grade Span and Grade. ..................................................69 Table 30. Subkoviak Agreement Coefficient and Kappa for the Overall Test by Grade............................70 Table 31. CELApro Scale Score Correlations, Grade Span K–2...............................................................72 Table 32. CELApro Scale Score Correlations, Grade Span 3–5. ..............................................................73 Table 33. CELApro Scale Score Correlations, Grade Span 6–8. ..............................................................74 Table 34. CELApro Scale Score Correlations, Grade Span 9–12.............................................................75

Colorado English Language Acquisition Assessment Program 2008 Technical Report ● 6
Copyright © 2008 by the Colorado Department of Education.
Overview
The first administration of the Colorado English Language Acquisition Assessments (CELApro) occurred in Spring 2006. At that time, the assessments were identical to CTB’s LAS Links Form A, except for customized Colorado test book covers and answer sheets. LAS Links (Form A) continues to provide a solid foundation for all of the CELApro tests. The LAS links assessments were developed from a framework that reflects sound principles of second-language acquisition (Schmidt, 2001; Savignon, 1997, 1972; Bachman & Palmer, 1996; O’Malley & Valdez Pierce, 1996; Chamot & O’Malley, 1994; Bachman, 1990). Each LAS Links test consists of 4 separately scored sections (Reading, Writing, Listening, and Speaking). In addition to these four component scores, all of the Listening and Speaking items are combined to produce an Oral score, and selected Reading and Listening items are combined to yield a Comprehension score. Approximately 30,000 students participated in the field test, item analysis, and calibration of LAS Links Form A, which was calibrated and scaled using item-response theory and a common-item equating design to place all grade levels on a common scale and to ensure that skill area scores have the same meaning across forms, grades, and years. Details of the LAS Links test development, field test and standardization methods, and statistical properties are described in Appendix G (LAS Links Technical Manual).
The LAS Links tests are aligned to CTB/McGraw-Hill’s English Language Proficiency Assessment Standards (ELPAS), which were developed to include key standards from the national ESL and TESOL standards and from several state ESL standards. In order to match the Colorado standards, the LAS Links grade spans were modified and additional items added to the tests. There are 6 grade spans in CELApro: K, 1, 2, 3–5, 6–8, and 9–12. All levels have all four content areas. Last year’s K–2 grade span has now been broken up into three separate grade spans. Table 1 shows a comparison by grade spans.
Table 1. Comparison of LAS Links and CELApro Grade Spans
Grade Spans LAS Links
CELApro 2007
CELApro 2008
K K–1 1 K–2 2 2–3
4–5 3–5 3–5
6–8 6–8 6–8
9–12 9–12 9–12

Colorado English Language Acquisition Assessment Program 2008 Technical Report ● 7
Copyright © 2008 by the Colorado Department of Education.
K, 1, 2, and 3–5 are scannable books; the other grade spans have a reusable test book and a scannable answer book. The Speaking items and the Writing constructed response (CR) items appear only in the answer book for the upper two grade spans. For the first time in 2008, there are new (not previously field tested) items added in the CELApro tests that will contribute to the student score. These new items are in Listening and Writing for the three grade spans 3–5, 6–8 and 9–12. In the three grade spans, K, 1, and 2, the new items are in Listening, Reading, and Writing.
Colorado English Language Acquisition Assessment Program 2008 Technical Report ● 8
Copyright © 2008 by the Colorado Department of Education.
Part 1: Standards The Colorado English Language Acquisition Assessment (CELApro) is the language proficiency assessment used for classifying and monitoring the progress of Colorado English Language Learners (ELLs) in the acquisition of English. LAS Links Form A assessments form the core of the CELApro tests. The LAS Links Technical Manual, provided in Appendix G, describes the content rationale, LAS Links standards alignment, test development considerations, field test and standardization procedures, scale development, and psychometric properties including validity and reliability statistics. The CELApro assessment measures the competencies necessary for successful social and academic language use in four major modalities: Listening, Speaking, Reading, and Writing—along a continuum of five proficiency levels: Beginning, Early Intermediate, Intermediate, Proficient, and Advanced. The assessment takes into account the students’ maturation and cognitive skills by providing age appropriate tests covering four grade spans: K–2, 3–5, 6–8, and 9–12. A combination of item types—Constructed-Response (CR), and Selected-Response (SR) items—provide a variety of ways for students to demonstrate proficiency and to maintain reasonable testing times. Constructed-Response (CR) items assess the productive domains of Speaking and Writing, whereas the Selected-Response (SR) items assess the receptive domains of Listening, Reading, and Writing (grammar). The variety of item types ensures measurement of the full spectrum of possible tasks required for each language subskill and allows for the interpretation of the results in multiple ways.
Alignment Studies An important indicator of the validity of a standardized test is the degree of alignment (i.e., the match) between the state English language development (ELD) standards and the test content. In developing standardized tests, test items are written to cover as many standards as possible. Colorado has four general standards for English language learners (ELL), organized by modality (Listening, Speaking, Reading, and Writing) and applicable at all grade levels. The standards specify general skills in social and academic language:
• Standard 1: English Language Learners listen for information and understanding, using a variety of sources, for academic and social purposes.
• Standard 2: English Language Learners speak to convey information and
understanding, using a variety of sources, for academic and social purposes.
• Standard 3: English Language Learners read for information and understanding, using a variety of sources, for academic and social purposes.
• Standard 4: English Language Learners write to convey information and understanding,
using a variety of sources, for academic and social purposes.

Colorado English Language Acquisition Assessment Program 2008 Technical Report ● 9
Copyright © 2008 by the Colorado Department of Education.
In performing the alignment, the raters independently matched items to all possible alignable standards on the basis of direct, indirect, or partial alignment. The test item numbers were then entered into the cell of the matching standard. A detailed description of the standards, by grade and proficiency level, is provided in Appendix F. The final step of the alignment involved the calculation of an alignment percentage, i.e., the percentage of alignable standards that are covered by items in the CELApro test. The numbers of alignable standards having matched items from CELApro were divided by the total number of alignable standards, as shown in Table 2.
Alignment Analysis
In order to increase the alignment of CELApro to the Colorado ELD standards, test items were written to assess individual standards that were not already assessed by LAS Links items. CTB conducted an alignment which is the degree of match between the test and the standards. The degree of alignment was calculated by adding up the number of “assessable” standards for which test items are written. In performing an alignment, it is sometimes necessary to eliminate some standards because they cannot be easily assessed by a standardized test. For example, a standard may require an extended process outside of the test situation as in the steps for writing a research paper, or it may specify instructional strategies rather than student skills, or it may specify parameters outside of the testing situation, such as “participate in group discussions.” Thus, there are 397 Colorado ELD standards of which 104 are eliminated as non-assessable, 293 assessable standards are left. All 293 are assessed by at least one test item, making the alignment 100%. The pool of items for CELApro 2008 consisted of 500 LAS Links items and 516 newly written Colorado items. Both set of items have been rated and analyzed by a committee. With approval from the customer, CTB included 16 Colorado items in the 2008 CELApro test which increased the alignment from 96% to 100%. This alignment was reviewed by CTB and CDE at a meeting in April 2007. CTB then conducted a final review with a committee of English Language Acquisition experts finalizing the document as you see below. Table 2 shows a summary of results of the CELApro Alignment to the Colorado ELD standards. To calculate the alignment, standards were rated between Assessable and Non-assessable.

Colorado English Language Acquisition Assessment Program 2008 Technical Report ● 10
Copyright © 2008 by the Colorado Department of Education.
Table 2. Item Alignment Percentages by Grade Span
K–2 3–5 6–8 9–12
Total 100
Listening 14/14 100 15/15 100 14/14 100 15/15 100
Beginning 4/4 5/5 5/5 5/5
Intermediate 5/5 5/5 5/5 5/5
Advanced 5/5 5/5 4/4 5/5
Speaking 14/14 100 13/13 100 12/12 100 11/11 100
Beginning 4/4 4/4 5/5 4/4
Intermediate 5/5 4/4 4/4 4/4
Advanced 5/5 5/5 3/3 3/3
Reading 16/16 100 15/15 100 14/14 100 12/12 100
Beginning 5/5 4/4 3/3 3/3
Intermediate 7/7 6/6 5/5 5/5
Advanced 4/4 5/5 6/6 4/4
Writing 13/13 100 14/14 100 9/9 100 7/7 100
Beginning 2/2 4/4 3/3 2/2

Colorado English Language Acquisition Assessment Program 2008 Technical Report ● 11
Copyright © 2008 by the Colorado Department of Education.
Part 2: Test Development The 2008 CELApro tests consist of both LAS Links items and items owned by the Colorado Department of Education. For the two upper grade spans (Grades 6–8 and 9–12) the organization of the CELApro tests are identical to the corresponding LAS Links assessments. The reconfigured tests for the two lower grade spans (Grades K–2 and 3–5) were created using selected items from the LAS Links assessments for the appropriate grades. The lowest grade span was also broken out into separate tests for Kindergarten, Grade 1, and Grade 2. All K–2 students take the same Listening and Speaking items but some different Reading and Writing items. All of these items were written by writers with experience or training in the areas being tested. Before writing items, all writers went through extensive training and were instructed to:
• Study each standard to be assessed. • Decide what is important for the student to know and do to demonstrate mastery of the
standard. Avoid the trivial. • Write the item so that it focuses on the particular content or skill to be assessed. • Develop answer choices that relate logically to the stem and standard. The correct
response should be clear to students who have mastered the concept or skill. The distractors should be clearly wrong to students who have mastered the content or skill. Test items should not be “tricky” or contain information unfamiliar to most students.
• Provide documentation from source material (e.g., photocopies of encyclopedia entries and other reliable reference materials) to verify that all information included in the stimulus and item is correct. All factual statements in stimuli, stems, and correct responses must be checked against reliable sources. Distractors also should be verified as incorrect.
• Use appropriate subject matter. Refrain from explicit references to or descriptions of alcohol or drug abuse, sex, or vulgar language. Exercise caution when developing religious, political, social, or philosophical issues as subject matter. Individual beliefs should not influence content.
• Avoid using very controversial material. Large-scale (national, state, or district) assessments are administered to student populations with different experiences and beliefs.
• Verify that the item is free of content that could be offensive, insensitive, stereotypical, or that introduces other types of bias.
• Check that the content of the stimulus and/or the item is developmentally and age appropriate for the students being tested.
• Write a range of items representing all levels of proficiency in English within a specific standard.
The tests have been structured to comprehensively assess the four language skills of Speaking, Listening, Reading, and Writing. Comprehension is assessed using selected Listening and Reading items. A combination of constructed-response, dichotomous constructed-response (correct or incorrect), and multiple-choice items is used to provide diverse opportunities for students to demonstrate proficiency and to maintain reasonable testing times. Constructed-response items are used to assess the productive domains of Speaking and Writing, whereas the multiple-choice items are used to assess the receptive domains of Listening, Reading, and the Writing Use Conventions subtest. The structure of the 2008 CELApro is shown in Table 3.

Colorado English Language Acquisition Assessment Program 2008 Technical Report ● 12
Copyright © 2008 by the Colorado Department of Education.
Table 3. 2008 CELApro Test Structure
Item Review and Test Fairness All items are expected to be fair for all examinees. Various procedures are employed to review item bias. Once the items are developed, they must go through a series of content and bias reviews and analyses prior to being selected as part of the item pool. A content and bias review has two purposes: to ensure that the items are grade level appropriate and to ensure that any sensitivity issues are identified and addressed. Grade level appropriateness is evaluated by grade level teachers who possess the on-the-ground knowledge of how content is taught in the classroom. Sensitivity reviews ensure that items are free of offensive, disturbing, or inappropriate language or content.
Content Grade span Sub-Content Item Type Items Score
Points CR/DCR Items
Scored By Administration
Speak Words DCR 10 10 Sentences CR 5 15
Conversation CR 4 12 Speaking
20 items, 41 pts
4 grade spans: K–2, 3–5, 6–8, 9–12
Tell a Story CR 1 4
Local Test Administrator Individual
Listen for Information MC 10 10 Listen in the Classroom MC 6 6 Listening
20 items. 20 pts
4 grade spans: K–2, 3–5, 6–8, 9–12 Listen & Comprehend MC 4 4
Not Applicable Individual
Analyze Words MC 11 11 Read Words MC 10 10
K Only Understanding MC 10 10
Not Applicable Individual
Analyze Words MC 11 11 Read Words MC 10 10 1–2 Only
Understanding MC 15 15 Not Applicable Individual
Analyze Words MC 10 10 Read Words MC 10 10
Reading K=31 items, 31 pts 1–2=36 items, 36 pts 3–12=35 items.35pts
3 grade spans: 3–5, 6–8,
9–12 Understanding MC 15 15 Not Applicable Group
Conventions MC 20 20 Write About CR 2 6 K-1 Write Why CR 3 9
CTB Handscoring
Group (or Individual for K)
Conventions MC 20 20 Write About CR 2 6 Write Why CR 2 6
Writing K–1=25 items, 35pts 2–12=25 items,36pts
4 grade spans:
K–2, 3–5, 6–8, 9–12
Write in Detail CR 1 4
CTB Handscoring Group
MC 20 20 DCR 10 10
Oral 40 items, 61 pts
4 grade spans: K–2, 3–5, 6–8, 9–12
Listening & Speaking CR 10 31
Local Test Administrator N/A
K Listening & Reading MC 33 33 1–2 Listening & Reading MC 43 43 3–5 Listening & Reading MC 45 45
Comprehension K = 33 items, 33 pts
1–2 = 43 items, 43 pts 3–5 = 45 items, 45 pts 6–12=47 items, 47 pts 6–8 & 9–12 Listening & Reading MC 47 47
Not Applicable N/A

Colorado English Language Acquisition Assessment Program 2008 Technical Report ● 13
Copyright © 2008 by the Colorado Department of Education.
Content reviews and sensitivity and bias reviews were conducted on all operational items. The item review committees reviewed all operational items before the operational test administration.
Item Selection In selecting items for the reconfigured CELApro tests in Grades K–2 and 3–5, the primary criterion was to meet the content specifications represented by test blueprints, while at the same time maintaining the desired statistical properties of LAS Links. This involved an iterative process in which test characteristic curves and standard errors were examined after each preliminary item selection. Selections were revised as necessary in order to obtain an acceptable match to the statistical properties of the previous LAS Links assessments at each grade level.
Minimizing Test Bias The position of CTB/McGraw-Hill concerning test bias is based on two general propositions. First, students may differ in their background knowledge, cognitive and academic skills, language, attitudes, and values. To the degree that these differences are large, no one curriculum and no one set of instructional materials will be equally suitable for all. Therefore, no one test will be equally appropriate for all. Furthermore, it is difficult to specify what amount of difference can be called large and to determine how these differences will affect the outcome of a particular test.
Second, schools have been assigned the tasks of developing certain basic cognitive skills and supporting English language proficiency among all students. Therefore, there is a need for ELP tests that measure the common skills and bodies of knowledge that are common to English learners. The test publisher’s task is to develop assessments that measure English language proficiency without introducing extraneous or construct-irrelevant elements in the performances on which the measurement is based. If these tests require that students have cultural specific knowledge and skills not taught in school, differences in performance among students can occur because of differences in student background and out-of-school learning. Such tests are measuring different things for different groups and can be called biased (Camilli & Shepard, 1994; Green, 1975). In order to lessen this bias, CTB/McGraw-Hill strives to minimize the role of the extraneous elements, thereby increasing the number of students for whom the test is appropriate. Careful attention is taken in the test construction process to lessen the influence of these elements for large numbers of students. Unfortunately, in some cases these elements may continue to play a substantial role.
Four measures were taken to minimize bias in the LAS Links assessments. The first was based on the premise that careful editorial attention to validity was an essential step in keeping bias to a minimum. Bias can occur only if the test is measuring different things for different groups. If the test entails irrelevant skills or knowledge, however common, the possibility of bias is increased. Thus, careful attention was paid to content validity during the item-writing and item-selection process.
The second way bias was minimized was by following the McGraw-Hill guidelines designed to reduce or eliminate bias. Item writers were directed to the following published guidelines: Guidelines for Bias-Free Publishing (MacMillan/McGraw-Hill, 1993a) and Reflecting Diversity: Multicultural Guidelines for Educational Publishing Professionals (Macmillan/McGraw-Hill, 1993b). Developers reviewed LAS Links Assessment materials with these considerations in
Colorado English Language Acquisition Assessment Program 2008 Technical Report ● 14
Copyright © 2008 by the Colorado Department of Education.
mind. Such internal editorial reviews were conducted by at least four separate people: a content editor, who directly supervised the item writers; the project director; a style editor; and a proofreader. The final test built from the tryout materials was again reviewed by at least these same people.
In the third effort to minimize bias, educational community professionals who represent various ethnic groups reviewed all LAS Links tryout materials. They were asked to consider and comment on the appropriateness of language, subject matter, and representation of groups of people.
It is believed that these three procedures both improve the quality of an assessment and reduce item and test bias. However, current evidence suggests that expertise in this area is no substitute for data. Reviewers are often wrong about which items perform differently between specific subgroups of students, apparently because some of their ideas about how students will react to items may be inaccurate (Camilli & Shepard, 1994; Sandoval & Mille, 1979; Scheuneman, 1984). Thus, a fourth method for minimizing bias, an empirical approach, was also used to identify potential sources of item bias. For language tests, these are differential item functioning (DIF) studies, since criterion-related validities are essentially unobtainable for such tests. DIF studies include a systematic item analysis to determine if examinees with the same underlying level of ability have the same probability of getting the item correct. Items identified with DIF are then examined to determine if item performance differences between identifiable subgroups of the population are due to extraneous or construct-irrelevant information, making the items unfairly difficult. The inclusion of these items is minimized in the test development process. DIF studies have been routinely done for all major test batteries published by CTB/McGraw-Hill after 1970. Differential item functioning of the LAS Links assessment tryout items was assessed for students identified as males and females at each grade level in which the items were administered. In most cases, each item was administered at two grade spans.
Because LAS Links was built using item response theory, DIF analyses that capitalized on the information and item statistics provided by this theory were implemented. There are several IRT-based DIF procedures, including those that assess the equality of item parameters across groups (Lord, 1980), and those that assess area differences between item characteristic curves (Linn, Levine, Hastings, & Wardrop, 1981; Camilli & Shepard, 1994). However, these procedures require a minimum of 800 to 1000 cases in each group of comparison to produce reliable and consistent results. In contrast, the Linn-Harnisch procedure (Linn & Harnisch, 1981) utilizes the information provided by the three-parameter IRT model but requires fewer cases. This was the procedure used to complete the gender DIF studies for the LAS Links field test data.

Colorado English Language Acquisition Assessment Program 2008 Technical Report ● 15
Copyright © 2008 by the Colorado Department of Education.
Part 3: Tested Population
A total of 85,085 students participated in the 2008 CELApro testing. Students in kindergarten and first grade formed the largest groups of examinees (11,876 and 12,377, respectively), with numbers generally decreasing at successive grade levels. The number of male examinees was slightly greater than the number of females at each grade level. The examinee counts by grade and gender are shown in Table 4, below. Note that not all students completed all four of the CELApro content areas, so these numbers differ from those that appear in some of the subsequent tables within this report.
Table 4. Examinee Counts by Grade and Gender
Number of Examinees
Grade Females Males Not Specified
Total
Kindergarten 5743 6132 1 11876 1 6011 6366 0 12377 2 5368 5617 2 10987 3 4264 4788 1 9053 4 3791 3956 0 7747 5 3155 3467 1 6623 6 2493 2882 0 5375 7 2058 2604 0 4662 8 1823 2154 2 3979 9 1887 2268 0 4155
10 1577 1832 0 3409 11 1317 1397 0 2714 12 1023 1102 3 2128
Total 40510 44565 10 85085
Student ethnicity and home language is summarized by grade span in Tables 5 and 6.

Colorado English Language Acquisition Assessment Program 2008 Technical Report ● 16
Copyright © 2008 by the Colorado Department of Education.
Table 5. Ethnicity by Grade Span
Grade Span Grades K–2 Grades 3–5 Grades 6–8 Grades 9–12
Total Ethnicity
N % N % N % N % N %
American Indian/ Alaska Native 152 0.2 107 0.1 90 0.1 102 0.1 451 0.5
Asian/Pacific Islander 2447 2.9 1382 1.6 887 1.0 905 1.1 5621 6.6
Black 727 0.9 433 0.5 317 0.4 514 0.6 1991 2.3
Hispanic 30099 35.4 20636 24.3 12216 14.4 10336 12.2 73287 86.1
White 1813 2.1 865 1.0 506 0.6 545 0.6 3729 4.4
Not Specified 2 0.0 0 0 0.0 0.0 4 0.0 6 0.0
TOTAL 35240 41.4 23423 27.5 14016 16.5 12406 14.6 85085 100.0
Colorado English Language Acquisition Assessment Program 2008 Technical Report ● 17
Copyright © 2008 by the Colorado Department of Education.
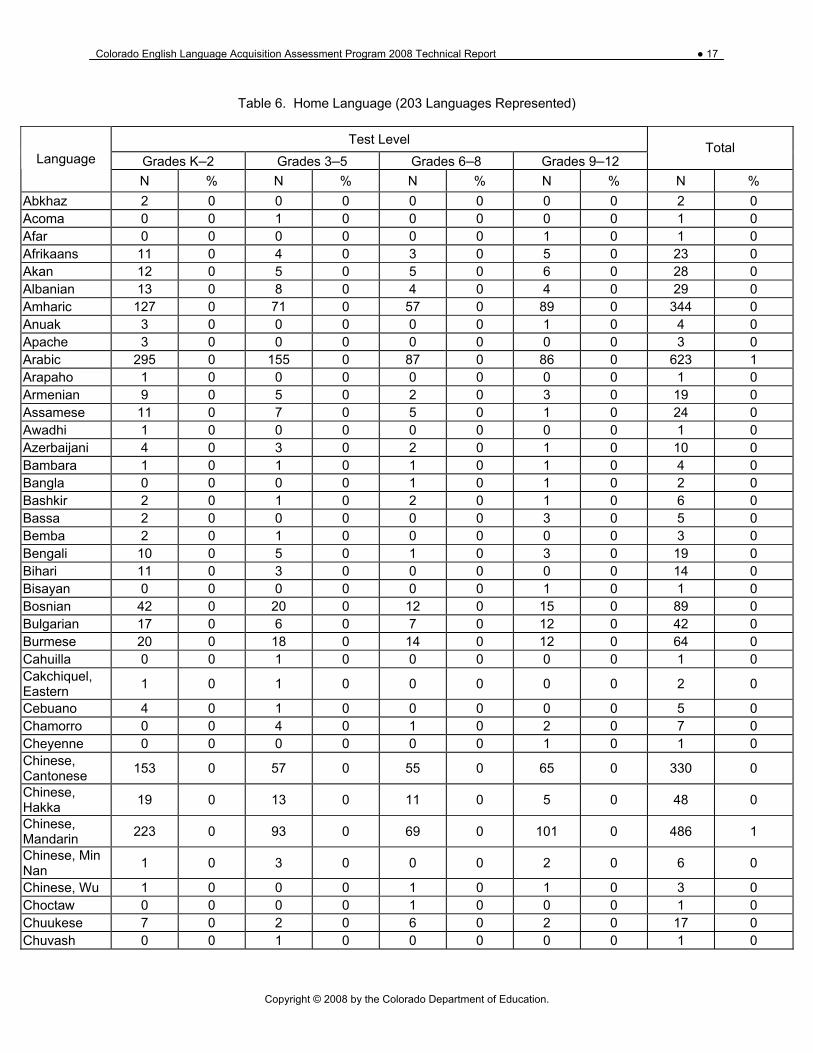
Table 6. Home Language (203 Languages Represented)
Test Level Grades K–2 Grades 3–5 Grades 6–8 Grades 9–12
Total Language
N % N % N % N % N % Abkhaz 2 0 0 0 0 0 0 0 2 0 Acoma 0 0 1 0 0 0 0 0 1 0 Afar 0 0 0 0 0 0 1 0 1 0 Afrikaans 11 0 4 0 3 0 5 0 23 0 Akan 12 0 5 0 5 0 6 0 28 0 Albanian 13 0 8 0 4 0 4 0 29 0 Amharic 127 0 71 0 57 0 89 0 344 0 Anuak 3 0 0 0 0 0 1 0 4 0 Apache 3 0 0 0 0 0 0 0 3 0 Arabic 295 0 155 0 87 0 86 0 623 1 Arapaho 1 0 0 0 0 0 0 0 1 0 Armenian 9 0 5 0 2 0 3 0 19 0 Assamese 11 0 7 0 5 0 1 0 24 0 Awadhi 1 0 0 0 0 0 0 0 1 0 Azerbaijani 4 0 3 0 2 0 1 0 10 0 Bambara 1 0 1 0 1 0 1 0 4 0 Bangla 0 0 0 0 1 0 1 0 2 0 Bashkir 2 0 1 0 2 0 1 0 6 0 Bassa 2 0 0 0 0 0 3 0 5 0 Bemba 2 0 1 0 0 0 0 0 3 0 Bengali 10 0 5 0 1 0 3 0 19 0 Bihari 11 0 3 0 0 0 0 0 14 0 Bisayan 0 0 0 0 0 0 1 0 1 0 Bosnian 42 0 20 0 12 0 15 0 89 0 Bulgarian 17 0 6 0 7 0 12 0 42 0 Burmese 20 0 18 0 14 0 12 0 64 0 Cahuilla 0 0 1 0 0 0 0 0 1 0 Cakchiquel, Eastern 1 0 1 0 0 0 0 0 2 0
Cebuano 4 0 1 0 0 0 0 0 5 0 Chamorro 0 0 4 0 1 0 2 0 7 0 Cheyenne 0 0 0 0 0 0 1 0 1 0 Chinese, Cantonese 153 0 57 0 55 0 65 0 330 0
Chinese, Hakka 19 0 13 0 11 0 5 0 48 0
Chinese, Mandarin 223 0 93 0 69 0 101 0 486 1
Chinese, Min Nan 1 0 3 0 0 0 2 0 6 0
Chinese, Wu 1 0 0 0 1 0 1 0 3 0 Choctaw 0 0 0 0 1 0 0 0 1 0 Chuukese 7 0 2 0 6 0 2 0 17 0 Chuvash 0 0 1 0 0 0 0 0 1 0

Colorado English Language Acquisition Assessment Program 2008 Technical Report ● 18
Copyright © 2008 by the Colorado Department of Education.
Test Level Grades K–2 Grades 3–5 Grades 6–8 Grades 9–12
Total Language
N % N % N % N % N % Cora 16 0 26 0 21 0 5 0 68 0 Cree 1 0 0 0 0 0 0 0 1 0 Creole 13 0 7 0 6 0 11 0 37 0 Croatian 3 0 2 0 3 0 3 0 11 0 Czech 12 0 9 0 3 0 3 0 27 0 Danish 5 0 3 0 1 0 4 0 13 0 Dari 4 0 5 0 3 0 5 0 17 0 Deccan 4 0 3 0 2 0 4 0 13 0 Dinka 13 0 3 0 4 0 2 0 22 0 Dutch 11 0 4 0 3 0 2 0 20 0 English 8 0 5 0 3 0 14 0 30 0 Eskimo 0 0 2 0 0 0 0 0 2 0 Estonian 1 0 0 0 0 0 1 0 2 0 Ewe 4 0 5 0 2 0 5 0 16 0 Fante 0 0 1 0 1 0 1 0 3 0 Faroese 0 0 0 0 1 0 4 0 5 0 Farsi, Eastern 46 0 20 0 15 0 12 0 93 0 Farsi, Western 53 0 14 0 2 0 16 0 85 0
Filip-Taga 2 0 1 0 1 0 2 0 6 0 Finnish 8 0 2 0 1 0 11 0 French 119 0 53 0 37 0 74 0 283 0 French Cree 2 0 1 0 0 0 0 0 3 0 Frisian 1 0 0 0 0 0 0 0 1 0 Fulani 4 0 1 0 1 0 1 0 7 0 Fulfulde, Nigerian 1 0 0 0 0 0 0 0 1 0
Ga 1 0 0 0 0 0 4 0 5 0 Gaelic 1 0 0 0 0 0 0 0 1 0 Ganda 1 0 1 0 0 0 0 0 2 0 Georgian 0 0 0 0 1 0 0 0 1 0 German 96 0 51 0 23 0 28 0 198 0 Grebo 0 0 0 0 0 0 3 0 3 0 Greek 5 0 2 0 4 0 4 0 15 0 Gujarati 13 0 6 0 0 0 1 0 20 0 Haitian, Creole French 2 0 0 0 0 0 0 0 2 0
Hausa 0 0 2 0 1 0 2 0 5 0 Hawaiian 0 0 0 0 2 0 0 0 2 0 Hebrew 8 0 10 0 9 0 7 0 34 0 Hindi 56 0 27 0 8 0 6 0 97 0 Hmong 196 0 120 0 98 0 100 0 514 1 Hopi 0 0 1 0 1 0 0 0 2 0 Hungarian 11 0 2 0 0 0 1 0 14 0 Ibo 2 0 1 0 0 0 1 0 4 0

Colorado English Language Acquisition Assessment Program 2008 Technical Report ● 19
Copyright © 2008 by the Colorado Department of Education.
Test Level Grades K–2 Grades 3–5 Grades 6–8 Grades 9–12
Total Language
N % N % N % N % N % Icelandic 1 0 2 0 0 0 1 0 4 0 Igbo 8 0 6 0 2 0 5 0 21 0 Ilocano 3 0 3 0 2 0 8 0 Indonesian 40 0 28 0 17 0 10 0 95 0 Italian 20 0 12 0 6 0 9 0 47 0 Japanese 76 0 27 0 12 0 11 0 126 0 Kanarese 1 0 1 0 0 0 0 0 2 0 Kanjobal 16 0 13 0 7 0 6 0 42 0 Kannada 4 0 2 0 0 0 0 0 6 0 Kawaiisu 0 0 0 0 2 0 0 0 2 0 Kazakh 0 0 1 0 0 0 0 0 1 0 Keres, Eastern 0 0 0 0 0 0 1 0 1 0
Keres, Western 1 0 0 0 0 0 0 0 1 0
Khmer 81 0 50 0 27 0 30 0 188 0 Kikuyu 0 0 1 0 1 0 0 0 2 0 Kinyarwanda 4 0 0 0 1 0 3 0 8 0 Kirundi 4 0 6 0 5 0 2 0 17 0 Konkani 1 0 0 0 0 0 0 0 1 0 Korean 313 0 221 0 132 0 148 0 814 1 Kosraen 2 0 0 0 0 0 0 0 2 0 Kpelle 3 0 2 0 0 0 0 0 5 0 Krahn 2 0 5 0 2 0 6 0 15 0 Krio 2 0 1 0 3 0 8 0 14 0 Kru 2 0 1 0 1 0 1 0 5 0 Kurdi/Kurdish Bandinani 18 0 11 0 7 0 2 0 38 0
Lakota 2 0 2 0 1 0 1 0 6 0 Lao 70 0 51 0 22 0 20 0 163 0 Latvian 2 0 0 0 0 0 0 0 2 0 Lebanese 5 0 2 0 0 0 0 0 7 0 Liberian English 3 0 2 0 3 0 5 0 13 0
Lingala 0 0 2 0 1 0 3 0 Lithuanian 7 0 7 0 6 0 3 0 23 0 Lombard 1 0 0 0 0 0 0 0 1 0 Luganda 4 0 0 0 1 0 4 0 9 0 Maay 19 0 8 0 5 0 1 0 33 0 Malay 1 0 0 0 1 0 0 0 2 0 Malayalam 13 0 3 0 3 0 3 0 22 0 Malinke 0 0 2 0 0 0 0 0 2 0 Mandinka 10 0 3 0 0 0 3 0 16 0 Marathi 9 0 1 0 0 0 0 0 10 0 Marshallese 13 0 14 0 4 0 5 0 36 0

Colorado English Language Acquisition Assessment Program 2008 Technical Report ● 20
Copyright © 2008 by the Colorado Department of Education.
Test Level Grades K–2 Grades 3–5 Grades 6–8 Grades 9–12
Total Language
N % N % N % N % N % Maya 3 0 0 0 0 0 1 0 4 0 Mende 0 0 1 0 0 0 1 0 2 0 Mongolian 30 0 32 0 29 0 25 0 116 0 Mono 1 0 0 0 0 0 0 0 1 0 Munukutuba 1 0 0 0 0 0 0 0 1 0 Navajo 66 0 49 0 39 0 64 0 218 0 Nepali 53 0 30 0 34 0 29 0 146 0 Newari 1 0 0 0 0 0 0 0 1 0 Norwegian 4 0 0 0 0 0 0 0 4 0 Nuer 1 0 0 0 2 0 1 0 4 0 Nyanja 0 0 0 0 2 0 0 0 2 0 Oriya 1 0 0 0 0 0 0 0 1 0 Oromo, West-Central 11 0 9 0 7 0 33 0 60 0
Palauan 2 0 1 0 1 0 2 0 6 0 Pampangan 2 0 0 0 0 0 0 0 2 0 Panjabi, Eastern 18 0 17 0 9 0 5 0 49 0
Panjabi, Western 3 0 0 0 0 0 1 0 4 0
Pashto, Central 4 0 2 0 3 0 1 0 10 0
Pashto, Northern 5 0 2 0 0 0 0 0 7 0
Pashto, Southern 1 0 0 0 0 0 0 0 1 0
Patois 3 0 0 0 1 0 0 0 4 0 Phonpeian 1 0 1 0 2 0 1 0 5 0 Polish 75 0 27 0 14 0 8 0 124 0 Portuguese 35 0 14 0 12 0 14 0 75 0 Pulaar 1 0 3 0 1 0 3 0 8 0 Quechua, Chachapoyas 1 0 0 0 0 0 0 0 1 0
Quiche, Central 0 0 0 0 2 0 1 0 3 0
Romanian 19 0 10 0 6 0 8 0 43 0 Russian 360 0 218 0 152 0 147 0 877 1 Rwanda 2 0 4 0 1 0 7 0 Samoan 5 0 8 0 3 0 2 0 18 0 Saraiki 0 0 0 0 1 0 0 0 1 0 Seminole 0 0 0 0 1 0 0 0 1 0 Serbian 11 0 2 0 2 0 0 0 15 0 Serbo-Croatian 10 0 17 0 11 0 9 0 47 0
Sesotho 1 0 0 0 0 0 0 0 1 0 Setswana 2 0 0 0 1 0 0 0 3 0 Shona 1 0 1 0 1 0 2 0 5 0

Colorado English Language Acquisition Assessment Program 2008 Technical Report ● 21
Copyright © 2008 by the Colorado Department of Education.
Test Level Grades K–2 Grades 3–5 Grades 6–8 Grades 9–12
Total Language
N % N % N % N % N % Shoshone 0 0 1 0 0 0 0 0 1 0 Sibo 0 0 1 0 0 0 0 0 1 0 Sindhi 1 0 0 0 0 0 0 0 1 0 Sinhala 0 0 0 0 1 0 1 0 2 0 Sioux 0 0 1 0 0 0 0 0 1 0 Slovak 3 0 2 0 1 0 0 0 6 0 Slovenian 1 0 0 0 1 0 3 0 5 0 Somali 113 0 88 0 63 0 90 0 354 0 Soninke 1 0 0 0 0 0 0 0 1 0 Spanish 30674 36 20828 24 12309 14 10432 12 74243 87 Spokane 1 0 0 0 0 0 0 0 1 0 Sundanese 1 0 0 0 1 0 2 0 4 0 Susu 1 0 1 0 1 0 2 0 5 0 Swahili 29 0 13 0 20 0 27 0 89 0 Swedish 14 0 5 0 2 0 6 0 27 0 Tagalog 78 0 51 0 38 0 41 0 208 0 Tahitian 1 0 0 0 0 0 0 0 1 0 Tajik 0 0 0 0 0 0 7 0 7 0 Tamil 28 0 5 0 0 0 3 0 36 0 Telugu 37 0 7 0 1 0 0 0 45 0 Thai 28 0 21 0 13 0 19 0 81 0 Tibetan 2 0 4 0 1 0 5 0 12 0 Tigrigna 34 0 24 0 20 0 30 0 108 0 Tiwa, Northern 1 0 0 0 0 0 0 0 1 0
Tonga 4 0 3 0 3 0 3 0 13 0 Tongan 1 0 0 0 0 0 0 0 1 0 Tonkawa 0 0 0 0 1 0 0 0 1 0 Trukese 0 0 1 0 1 0 2 0 Tsonga 0 0 0 0 1 0 1 0 2 0 Turkish 31 0 18 0 9 0 20 0 78 0 Turkmen 2 0 0 0 0 0 0 0 2 0 Twi 27 0 9 0 11 0 22 0 69 0 Ukrainian 37 0 34 0 20 0 20 0 111 0 Urdu 44 0 20 0 9 0 17 0 90 0 Ute 16 0 16 0 28 0 28 0 88 0 Uzbek 1 0 1 0 1 0 1 0 4 0 Vengo 3 0 1 0 1 0 1 0 6 0 Vietnamese 734 1 391 0 204 0 196 0 1525 2 Visayan 0 0 1 0 1 0 1 0 3 0 Welsh 1 0 0 0 0 0 0 0 1 0 Wolof 1 0 1 0 0 0 0 0 2 0 Yoruba 3 0 7 0 5 0 1 0 16 0 Zuni 1 0 0 0 0 0 0 0 1 0 Unknown 60 0 50 0 37 0 27 0 174 0

Colorado English Language Acquisition Assessment Program 2008 Technical Report ● 22
Copyright © 2008 by the Colorado Department of Education.
Test Level Grades K–2 Grades 3–5 Grades 6–8 Grades 9–12
Total Language
N % N % N % N % N % TOTAL 35240 41 23423 27 14016 16 12406 14 85085 100
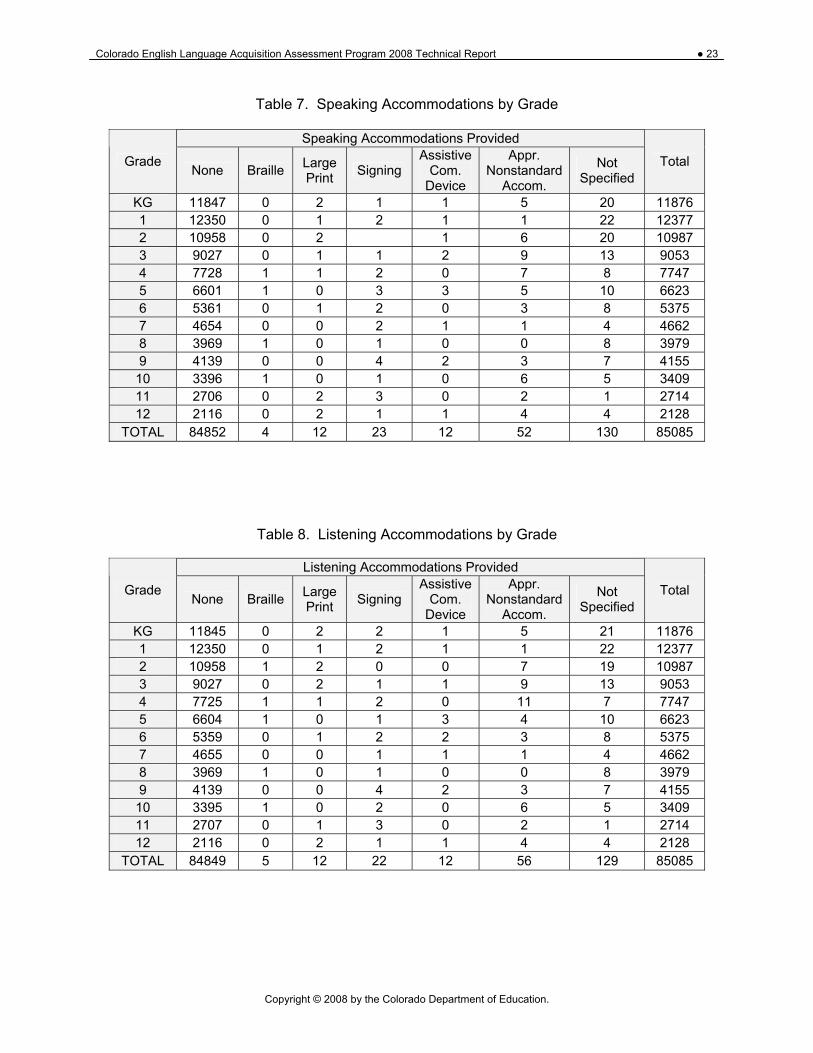
Because some students required accommodations in order to access the items, the following accommodations were available:
• Braille • Large Print • Use of a Scribe to Record Responses • Signing • Use of Assistive Communicative Devices • Oral Presentation
These accommodations are summarized, by content area and grade, in Tables 7 to 10.
Colorado English Language Acquisition Assessment Program 2008 Technical Report ● 23
Copyright © 2008 by the Colorado Department of Education.
Table 7. Speaking Accommodations by Grade
Speaking Accommodations Provided
Grade None Braille Large
Print Signing Assistive
Com. Device
Appr. Nonstandard
Accom.
Not Specified
Total
KG 11847 0 2 1 1 5 20 11876 1 12350 0 1 2 1 1 22 12377 2 10958 0 2 1 6 20 10987 3 9027 0 1 1 2 9 13 9053 4 7728 1 1 2 0 7 8 7747 5 6601 1 0 3 3 5 10 6623 6 5361 0 1 2 0 3 8 5375 7 4654 0 0 2 1 1 4 4662 8 3969 1 0 1 0 0 8 3979 9 4139 0 0 4 2 3 7 4155
10 3396 1 0 1 0 6 5 3409 11 2706 0 2 3 0 2 1 2714 12 2116 0 2 1 1 4 4 2128
TOTAL 84852 4 12 23 12 52 130 85085
Table 8. Listening Accommodations by Grade
Listening Accommodations Provided
Grade None Braille Large
Print Signing Assistive
Com. Device
Appr. Nonstandard
Accom.
Not Specified
Total
KG 11845 0 2 2 1 5 21 11876 1 12350 0 1 2 1 1 22 12377 2 10958 1 2 0 0 7 19 10987 3 9027 0 2 1 1 9 13 9053 4 7725 1 1 2 0 11 7 7747 5 6604 1 0 1 3 4 10 6623 6 5359 0 1 2 2 3 8 5375 7 4655 0 0 1 1 1 4 4662 8 3969 1 0 1 0 0 8 3979 9 4139 0 0 4 2 3 7 4155
10 3395 1 0 2 0 6 5 3409 11 2707 0 1 3 0 2 1 2714 12 2116 0 2 1 1 4 4 2128
TOTAL 84849 5 12 22 12 56 129 85085

Colorado English Language Acquisition Assessment Program 2008 Technical Report ● 24
Copyright © 2008 by the Colorado Department of Education.
Table 9. Reading Accommodations by Grade
Reading Accommodation Provided
Grade None Braille
version Large-print Scribe Signing
Assistive Com.
Device
Appr. Nonstandard
Accom.
Not Specified
Total
KG 11844 0 2 2 1 1 5 21 11876 1 12342 0 1 7 2 1 2 22 12377 2 10950 1 2 5 2 1 7 19 10987 3 9019 0 1 7 2 1 10 13 9053 4 7706 1 1 14 5 0 12 8 7747 5 6588 1 0 10 3 3 8 10 6623 6 5349 0 1 10 2 1 3 9 5375 7 4640 0 0 15 1 1 1 4 4662 8 3958 1 0 8 2 0 0 10 3979 9 4133 0 0 4 4 1 4 9 4155
10 3391 1 0 1 4 0 6 6 3409 11 2706 0 1 1 3 0 2 1 2714 12 2114 0 1 2 1 1 4 5 2128
TOTAL 84740 5 10 86 32 11 64 137 85085
Table 10. Writing Accommodations by Grade
Writing Accommodation Provided
Grade None Braille
version Large-print Scribe Signing
Assistive Com.
Device
Appr. Nonstandard
Accom.
Not Specified
Total
KG 11832 0 2 14 1 1 5 21 11876 1 12337 0 1 12 2 1 2 22 12377 2 10934 0 2 20 2 2 8 19 10987 3 8992 0 0 31 2 1 14 13 9053 4 7683 1 1 34 6 1 13 8 7747 5 6578 1 0 17 3 3 11 10 6623 6 5338 0 1 20 2 1 4 9 5375 7 4630 0 0 21 1 1 5 4 4662 8 3947 1 1 12 2 0 5 11 3979 9 4133 0 0 4 4 1 4 9 4155
10 3391 2 0 1 3 0 6 6 3409 11 2706 0 1 1 3 0 2 1 2714 12 2114 0 1 2 1 1 4 5 2128
TOTAL 84615 5 10 189 32 13 83 138 85085

Colorado English Language Acquisition Assessment Program 2008 Technical Report ● 25
Copyright © 2008 by the Colorado Department of Education.
Part 4: Test Administration
The Colorado English Language Assessment was first administered in Spring 2007. In 2008 the administration was moved to winter, and the CELApro was administered to 85,085 students in January and February 2008. This test consists of four separately administered sections assessing speaking, listening, reading, and writing proficiency.
The CELApro speaking section is individually administered. The Listening, Reading, and Writing sections may be group administered or individually administered, depending upon the needs of the particular examinees being tested.
CELApro test examiners must be proficient English speakers who are able to model clear pronunciation of English phonemes. For group-administered K–2 Reading and Writing sections, students must be grouped by grade. For all of the group-administered sections, students in Grades 3 and above may be grouped either by grade or by grade span. Examiners are also instructed to group students by English proficiency in different rooms or at different times if possible. All sections of the test are untimed in order to give students every opportunity to demonstrate their proficiency in English. The estimated administration times and administration modes are shown in Table 11, below. Actual times may vary.
Table 11. Estimated Administration Time and Administration Mode by Skill Area
Skill Area Estimated Administration Time(all tests are untimed) Administration Mode
Speaking 10 Minutes – All Grades Individual Listening 20 Minutes – All Grades Group or Individual
Reading 35 Minutes – Kindergarten 45 Minutes – Grades 1–12 Group or Individual
Writing 35 Minutes – Grades K-1 45 Minutes – Grades 2–12 Group or Individual
All test examiners, school assessment coordinators (SACs), and district assessment coordinators (DACs) were instructed in standardized test administration and scoring procedures prior to the test administration.
The Speaking Subtests The Speaking test is individually administered by a fluent English speaker who reads the test questions aloud while pointing to illustrations. All items are in constructed-response format, scored with performance-based rubrics that direct the attention of the rater (generally the examiner) to the student’s use of vocabulary, social and academic language, complex grammatically correct verbal expressions, and length of responses. The Speaking test takes approximately 10 minutes per student to administer and consists of four subtests as follows:
Speak in Words In Speak in Words, the examiner points to objects depicted in cue pictures and asks questions such as “What is this?” and “What is it used for?” Students respond with single words and short phrases to identify the objects and answer questions related to those objects. Student responses are scored as correct (C), incorrect (I), or no response (NR).

Colorado English Language Acquisition Assessment Program 2008 Technical Report ● 26
Copyright © 2008 by the Colorado Department of Education.
Speak in Sentences In Speak in Sentences, students respond in complete sentences to describe activities or actions. The examiner points to each cue picture and directs the student to respond to prompts such as “Tell me what is happening in the picture,” “Tell me exactly where the book is located,” and “Please give me clear directions on how to go from Place A to Place B.” Student responses are scored with a 0–3 rubric. Make Conversation Students also respond in complete sentences in Make Conversation. However, instead of describing pictures, students respond to the examiner’s prompts such as “Tell someone to do something,” “Ask someone for something,” “Describe how to do something,” or “Explain why we do something.” Student responses are scored with a 0–3 rubric. Tell a Story In Tell a Story, students produce multiple sentences explaining what is happening in a series of four pictures. The pictures illustrate a story with a beginning, middle, and end. Pointing to the series of four pictures, the examiner begins the story by reading a story starter to contextualize the pictures without giving away vocabulary or key content. Student responses are scored on a 0–4 rubric.
The Listening Subtests
The Listening test is administered to a group of students by a proficient English speaker who reads from the Examiner’s Guide and uses the audio CD. All Listening items are multiple-choice in format and measure general comprehension and inferential and critical thinking skills at a discourse level that integrates academic language. Students listen to classroom English to demonstrate language proficiency levels within each grade span. The Listening test takes approximately 20 minutes per group to administer and consists of three subtests: Listen for Information, Listen in the Classroom, and Listen and Comprehend.
Listen for Information In Listen for Information, students hear instructions typical of those provided by a classroom teacher. Instructions vary in length from one to three sentences and must be played from the audio CD. The examiner then asks students which of three answer choices restates the instructions they heard. Instructions and answers may contain idioms and different syntactical structures. Listen in the Classroom Listen in the Classroom assesses comprehension of academic language, where students hear two short exchanges typical of classroom discussions. The listening passages, questions, and text answer choices must be played from the audio CD. After listening, students respond to three questions about what they heard. Each question has three answer choices.

Colorado English Language Acquisition Assessment Program 2008 Technical Report ● 27
Copyright © 2008 by the Colorado Department of Education.
Grade Span Passage Length
K–2 50–60 words
3–5 60–90 words
6–8 60–100 words
9–12 90–130 words
Listen and Comprehend A longer listening passage included in Listen and Comprehend assesses comprehension of narratives. Questions ask about main ideas, details, inferences, and idioms. The listening passages, questions, and text answer choices must be played from the audio CD. Students are asked four questions about the passage. Each question has three answer choices.
Grade Span Passage Length Genre Percentage Fiction 83% K–2 150–200 words Non-Fiction 17% Fiction 50% 3–5 200–250 words Non-Fiction 50% Fiction 33% 6–8 200–250 words Non-Fiction 67% Fiction 33% 9–12 225–325 words Non-Fiction 67%
The Reading Subtests The Reading test is usually administered to a group by a fluent English speaker who reads from the Examiner’s Guide. All Reading items are multiple-choice in format. Some items evaluate phonemic awareness as the basis for recognizing words and developing vocabulary. In other items, students read literary and informational grade-appropriate texts to demonstrate sentence-level and discourse-level reading ability, as well as inferential skills. The Reading test takes approximately 35–45 minutes to administer and consists of three subtests:
Analyze Words In Analyze Words, students respond to discrete items in a variety of formats addressing four word-analysis tasks: identifying rhyming words, applying letter-sound relationships to read English words, applying letter-sound relationships to read English phonemes, and applying knowledge of morphemes and syntax to word meaning. Each question has three answer choices.

Colorado English Language Acquisition Assessment Program 2008 Technical Report ● 28
Copyright © 2008 by the Colorado Department of Education.
Read Words For Grades K–5, students demonstrate vocabulary by classifying words, selecting written words to match those spoken by the examiner, and matching pictures of objects to their written descriptions. In all other grade levels, students demonstrate vocabulary by choosing synonyms or antonyms of a given word and/or choosing words that correctly complete sentences. Additionally, students in Grades 6–12 are tested on idiomatic expressions. Each question has three answer choices. Read for Understanding Higher-level reading skills are evaluated in Read for Understanding, in which students respond to passages representing various literary genres (e.g., fiction, nonfiction, and poetry). Questions address three tasks: demonstrating reading comprehension, identifying important literary features of text, and applying learning strategies to interpretation. Students in Kindergarten read along as the examiner reads passages aloud; then students identify one of three picture choices that correspond with the reading passage. Students in Grades 1 and 2 read two additional passages independently. Students in upper grades read passages without assistance and select from four written answer choices.
Grade Span Passage Length Genre Percentage Fiction 100% K 50–100 words Non-Fiction 0% Fiction 100% 1-2 100–150 words Non-Fiction 0% Fiction 50% 3–5 175–275 words Non-Fiction 50% Fiction (Poetry) 50% 6–8 250–350 words Non-Fiction 50% Fiction (Poetry) 50% 9–12 250–450 words Non-Fiction 50%
The Writing Subtests The Writing test is usually administered to a group by a fluent English speaker who reads from the Examiner’s Guide. The test includes both multiple-choice and constructed-response items that assess both receptive and productive domains. In the first section, selected response items engage students to identify appropriate grammar, mechanics, and syntax, and in the second section, students respond to prompts in the form of phrases, sentences, and paragraphs.

Colorado English Language Acquisition Assessment Program 2008 Technical Report ● 29
Copyright © 2008 by the Colorado Department of Education.
Responses to constructed-response items are evaluated with performance-based rubrics (on a 0–3 or 0–4 scale depending on the item) that direct the rater’s attention to the student’s use of English grammar and the appropriate use of discourse. The test takes approximately 35–45 minutes to administer and consists of four subtests, except that students in Grades K–1 do not take Write in Detail.
Use Conventions Discrete point items in Use Conventions assess whether students can identify correct uses of grammar, capitalization, punctuation, and sentence structure. Each item has three answer choices. Write About In Write About, students in Grades K–1 write one sentence, and students in Grades 2–12 write two sentences to describe a picture. Responses are scored with a 0–3 rubric. Write Why In Write Why, students make a choice between two alternatives and write to explain the reason for the choice they make. In Grades K–1, students write one reason; in Grades 2–12, students write two reasons. Responses are scored with a 0–3 rubric. Write in Detail Prompts in Write in Detail elicit longer responses. Students in Grades 2 write to describe what is happening in a sequence of four pictures. Students in Grades 3–12 organize their ideas and write paragraphs or essays responding to a written prompt. Responses are scored with a 0–4 rubric. Students in Grades K–1 do not take Write in Detail.
Teacher Training
The Administration Training Workshops for 2008 were conducted in five locations in Colorado: Greeley, Grand Junction, Pueblo, Trinidad, and Denver. These locations were selected to cover the state’s training needs geographically as well as in terms of district size. A total of 507 participants attended the workshops. Table 12 shows the breakdown of attendees per workshop location.
Table 12. Number of Attendees at Pre-Administration Training Workshops
Location and Date Number of Attendants
Greeley 11/02/07 92 Grand Junction 11/08/07 70 Pueblo 11/12/07 166 Trinidad 11/14/07 21 Denver 11/16/07 158 Total attendees 507

Colorado English Language Acquisition Assessment Program 2008 Technical Report ● 30
Copyright © 2008 by the Colorado Department of Education.
Workshop Setup The environment of the Pre-Administration Workshop is friendly and facilitates small-group discussion. Participants’ seats were not assigned. CELApro was first followed by the CSAPA Administration Training. Training Materials Development The training materials were developed to reduce complexity, mirror the trainer’s script, and ensure clarity in the use of the Training Manual, Training Audio CD, and Video throughout the training. Following are the details of the purpose of each component.
Training Manual The CELApro Pre-Administration Training Manual consists of a table of contents that corresponds directly to the organization of the materials. This allows for easy navigation through the training manual. Navigation through the training materials is key when training a large number of participants, which in turn facilitates the learning process and helps participants gain the understanding needed to conduct their own trainings. Training Audio CD Another important part of the training materials is the coordination between the audio component and the training manual. Because the Speaking test is scored by Test Examiners during test administration, the audio component is critical for training. There is one CD that provides student sample responses for all grade spans. This format allows the trainer to facilitate inter-rater reliability and to give each participant the opportunity to score items in a range of grade spans. All samples were scored by CTB experts and teachers. Participants use Scoring Sheets as part of calibration exercises. The video used provides general descriptions of each subtest and practice test administrations for each scoring rubric.
Part 5: Scoring
The 2008 CELApro tests were scored and processed by CTB’s scoring team using the standardized methods and procedures previously developed for the LAS Links program. The CELApro scoring team consists of trained technical specialists who are responsible for coordinating all scoring and reporting activities related to the processing of CELApro test documents. Document preparation, interdepartmental coordination and communication, processing specifications, and problem resolution are performed by a designated Scoring Project Manager from this team. The scoring team works closely with all CTB departments to ensure successful scoring and reporting. CTB maintains a professional staff of specialized data processing technicians to lead the verification process and ensure the integrity of the student response data at both group and individual levels. Raw scoring and editing of scanned data is performed in a client/server system (WinScore), where a sophisticated system of edits are invoked to review the integrity of each batch scanned and to produce a list of error suspects. While the editors can view data from any document online, the error suspect list concentrates on the most likely problems based on pre-defined guidelines. This system reduces editing time and provides a high degree of quality

Colorado English Language Acquisition Assessment Program 2008 Technical Report ● 31
Copyright © 2008 by the Colorado Department of Education.
control. CTB continues to enhance the capability of editing software to simplify the detection and correction of errors. Online editing screens focus an editor on potential problems and then provide related information. The actual scanned documents are always available to the editor, and the software supports the review and correction of any field in the scanned record. Entry and verification of the necessary corrections are enhanced to ensure each error is actually corrected. As batches are extracted for scoring, a final edit is performed to ensure all requirements for scoring are met. This automated final edit flags a batch for further editing if any error is still detected. A batch containing errors cannot be extracted for reporting. This ensures a high level of accuracy of the scored data.
When the editing process is completed, documents are moved to a staging area to be prepared for retention. Bundles are caged, warehoused in a recoverable location, and retained for possible retrieval during the specified retention period. Once this period is over, documents are destroyed according to procedures that ensure security is maintained.
Handscoring Process For the CELApro assessments, CTB’s imaging handscoring system presents images of scanned test books to trained readers, who assign scores for constructed-response items. Scanned images are viewed on high quality 19″ workstation monitors. Images of each student’s responses are automatically routed to two or more readers when required, and images of specific subsets of test items are routed to designated groups of readers trained to score these items. CTB is committed to using the finest imaging equipment, software presentation system, data management system, and quality control to provide valid, reliable, cost-efficient scoring. Readers In order to work as a handscoring reader at CTB, one must possess and show evidence of either a BA or BS degree. The evaluator staff is comprised of individuals from many walks of life —from retired or current educators to engineers—all possessing BAs to PhDs. Many CTB readers also have a great deal of classroom teaching experience. Our reader pool includes editors, published authors, and a number of individuals with advanced degrees. The minimum qualification for all Scoring Center readers is a Bachelor’s degree. Team Leaders Scoring team leaders are selected on the basis of having demonstrated a high degree of scoring accuracy and consistency, often across multiple subjects and grades. They must also possess good interpersonal and leadership skills in order to be effective when training and counseling readers. The ratio of readers to team leaders is no more than 10 to 1. While it is possible to conduct handscoring with more readers per team leader, it has been CTB’s experience that inter-rater reliability and production goals are jeopardized unless a trained leader can frequently monitor all readers. Scoring Supervisors Scoring Supervisors are the core group at CTB scoring centers. They direct and organize the assessment process, and train team leaders and readers. Scoring Supervisors have extensive experience as Team Leaders prior to their qualification and selection. The Scoring Supervisors are subject area experts in the content(s) that they supervise and train.

Colorado English Language Acquisition Assessment Program 2008 Technical Report ● 32
Copyright © 2008 by the Colorado Department of Education.
Anchor and Training Papers Prior to the actual scoring, the CTB Scoring Center creates training materials. The process includes several presorting steps and subsequent iterative/consensus processes in order to achieve ever-increasing agreement and precision through a kind of “round robin” scoring, followed by discussion and selection. When all papers for a form are selected and assigned status as good anchors, training, qualifying, or check-set papers, they are consolidated into training formats. Scoring Guides (consisting of rubrics, anchors, and annotations) serve as a constant, setting the course for all subsequent training and scoring. Rater Training and Validation Validation is a critical task in the assessment training process. It is the final determinant in reader readiness. All readers, including team leaders, must achieve 80 percent exact agreement on the qualifying round following training. Those readers not validating on the first attempt receive further training prior to taking an additional qualifying round. Only those who successfully validate are qualified as readers and allowed to score tests. Team leaders are required to complete two validation rounds with 80 percent exact agreement in each round.
Intra-rater Reliability Throughout the course of the handscoring process, calibration sets of pre-scored papers (check-sets) are administered daily to the team leaders as well as to the readers, to monitor scoring accuracy and to maintain a consistent focus on the established rubric and guidelines. Imaging permits this monitoring without reader knowledge of when a check-set is administered. Readers whose check-set scores fall below the qualifying level are removed from live scoring and are given additional training and another qualifying (validation) round. Readers unable to qualify are dismissed. The “read-behind” is another valuable intra-rater reliability monitoring technique. On a daily basis, each team leader reads a random selection of each reader’s scored items. The scores are compared, and if they agree, the team leader is able to offer feedback, which enhances the reader’s confidence and ability to score quickly and accurately. However, if an individual is straying from the standard established in the training and validation samples, the aberrant scoring is detected, and the team leader is able to offer the guidance necessary to refocus the reader’s effort. Readers whose scoring is inconsistent are read behind more frequently by their team leaders. Thus, any scoring variation is corrected.
Inter-rater Reliability Intraclass correlation coefficients and weighted Kappa coefficients were calculated to measure reader agreement (Fleiss & Cohen, 1973) for each of the hand-scored CELApro items,1, 2 using scores assigned to all item responses that received second reads. The intraclass correlation coefficients were consistently high, ranging from .87 to .97, with 63 percent of the coefficients
1 If agreement is perfect, both the intraclass correlation coefficient and Kappa will be equal to +1. If agreement is at chance levels, then both coefficients will be equal to zero. 2 The intraclass correlation does not consider chance agreement between two raters, but the weighted Kappa does take into account chance agreement. Therefore, in general, weighted Kappa will have values equal to or smaller than the intraclass correlations.

Colorado English Language Acquisition Assessment Program 2008 Technical Report ● 33
Copyright © 2008 by the Colorado Department of Education.
greater than or equal to .90. The weighted Kappa values also were high3 for all items, indicating good agreement between the first and second readers. Inter-rater agreement statistics for all of the hand-scored items are shown in Table 13. The percentage of discrepant scores was 9% or less for all items in the upper three grade spans. Within the first grade span, the percentage of discrepant scores reached a maximum of 10%.
3 Kappa values between 0.40 and 0.74 represent good agreement beyond chance, and values below 0.40 indicate poor agreement.

Colorado English Language Acquisition Assessment Program 2008 Technical Report ● 34
Copyright © 2008 by the Colorado Department of Education.
Table 13. Inter-Rater Agreement for CELApro Writing Responses
Grade Span Item Max Score
% Perfect
Agreement
% Adjacent Scores
% Special Codes
% Discrepant (>1 point)
Intraclass Correlation
Wtd Kappa
21 3 36% 4% 49% 10% 0.92 0.84 22 3 34% 5% 53% 9% 0.93 0.86 23 3 39% 4% 50% 8% 0.95 0.90 24 3 38% 4% 50% 8% 0.94 0.89
K
25 3 36% 3% 52% 10% 0.94 0.87 21 3 67% 14% 15% 4% 0.93 0.86 22 3 66% 14% 16% 5% 0.94 0.88 23 3 64% 16% 15% 4% 0.94 0.88 24 3 63% 15% 16% 6% 0.93 0.87
1
25 3 62% 15% 16% 7% 0.93 0.85 21 3 58% 27% 7% 8% 0.88 0.76 22 3 62% 24% 7% 7% 0.88 0.76 23 3 63% 24% 6% 7% 0.89 0.79 24 3 58% 25% 6% 10% 0.88 0.75
K–2
2
25 4 50% 32% 9% 9% 0.89 0.78 22 3 71% 21% 4% 4% 0.89 0.78 23 3 76% 17% 4% 3% 0.91 0.82 24 3 64% 27% 5% 5% 0.88 0.76 25 3 63% 26% 6% 5% 0.88 0.76
3–5
26 4 51% 30% 10% 9% 0.87 0.75 21 3 76% 18% 5% 2% 0.91 0.81 22 3 80% 14% 5% 1% 0.92 0.85 23 3 71% 22% 5% 3% 0.90 0.80 24 3 68% 24% 5% 2% 0.89 0.78
6–8
25 4 48% 39% 7% 6% 0.87 0.73 21 3 74% 14% 13% 0% 0.96 0.92 22 3 74% 12% 13% 1% 0.97 0.93 23 3 66% 18% 13% 3% 0.94 0.88 24 3 67% 19% 13% 1% 0.94 0.88
9–12
25 4 59% 26% 14% 1% 0.95 0.89

Colorado English Language Acquisition Assessment Program 2008 Technical Report ● 35
Copyright © 2008 by the Colorado Department of Education.
Scoring and Technology Quality Control Procedures The Technology and Scoring Departments at CTB both have quality assurance sections specifically charged with reviewing scoring data and reports during all stages of the process. The Technology quality assurance team verifies the accuracy of all reporting programs before they become operational. The Scoring quality assurance team verifies the accuracy of report information during the scoring process. After all data are entered into the scoring system and all reporting programs are completed, a sample of reports are printed and submitted to the Scoring quality assurance group, which reviews the sample reports to verify the accuracy and correct presentation of all data.
Numerous quality assurance checks are in place throughout the scoring process to ensure the accuracy of reports. Prior to delivering any electronic files or hard-copy score reports, all reports undergo a final, extensive quality check, known as a “Red Team Review.” Red Teams are comprised of individuals from every CTB department coming together to form an interdisciplinary team. Samples of each type of report are printed from the active scoring system, and the Red Team carefully reviews these samples for accuracy and correct format. Student-level information is compared by hand with student rosters and other documentation. Reports are not sent out until all necessary corrections determined by the Red Team are resolved.

Colorado English Language Acquisition Assessment Program 2008 Technical Report ● 36
Copyright © 2008 by the Colorado Department of Education.
Part 6: Data Analysis and Results
This section of the technical report contains a description of the calibration and equating procedures and results, along with details of the classical item analysis and differential item functioning analysis that was conducted for each test. This section also includes a subsection describing student performance on the 2008 tests, along with comparisons of the 2008 and 2007 results.
IRT Item Calibration
The inclusion of new items across all grade spans would require recalibration and equating for operational scores. CTB’s Pardux software (Burket, 1991) was used to conduct calibration and equating by grade span (i.e., K–2, 3–5, 6–8, 9–12) for each of six content areas (Reading, Writing, Listening, Speaking, Oral, and Comprehension). For these calibrations items that were omitted by the student were treated as incorrect.
Student item responses on each of the CELApro assessments were calibrated using the three-parameter logistic (3PL) model to scale the selected response (SR) items, and the two-parameter partial credit (2PPC) model to scale the constructed response (CR) items. A brief explanation of the models is provided below.
The 3PL model (Lord & Novick, 1968; Lord, 1980) defines a selected-response item in terms of three item parameters: (a) item discrimination, (b) item difficulty or location, and (c) probability of a student with very low ability answering the item correctly (i.e., a guessing parameter). In this model, the probability that a student with scale score θ will respond correctly to item j is defined as
)](7.1exp[1)1(
)(jj
jjj ba
ccp
−−+−
+=θ
θ ,
where aj is the item discrimination, bj is the item difficulty, and
cj is the probability of a correct response by a very low ability student. The 2PPC model defines a constructed-response item in terms of item discrimination as well as location parameter for each score point. The 2PPC model is a special case of Bock’s (1972) nominal model. Bock’s model states that the probability of an examinee with ability θ having a score at the kth level of the jth item is
( ) ( ) ,
1
,...,1,exp
exp1 jm
iji
jkjjk mk
Z
ZkxPP
j==−==
∑=
θθ
where mj is the number of score levels, and
Z A Cjk jk jk= +θ ,

Colorado English Language Acquisition Assessment Program 2008 Technical Report ● 37
Copyright © 2008 by the Colorado Department of Education.
)1( −= kA jjk α , k = 1, 2,…mj , and
Cjk jii
k
= −=
−
∑γ0
1
, where γ j0 0= ,
where jkA is the discrimination parameter of the kth category of item j, jkC is the intercept parameter of the nonlinear response function associated with the kth category of item j, αj and γji are the parameters to be estimated from the data. For each item there are mj –1 independent γji parameters and one αj parameter; a total of mj independent item parameters are estimated. All of the 2008 CELApro assessments were recalibrated using the 3PL/2PPC models described above. Separate calibrations were conducted for Listening, Speaking, Reading, Writing, Comprehension, and Oral scales in each grade span.
Equating and Scaling The recalibrated tests were placed on the existing CELApro/LAS Links scale through a Stocking and Lord (1983) characteristic curve equating procedure. Last year’s operational item parameters were used as equating anchors in this procedure. The new M1 and M2 conversion parameters were computed as follows: M1New = A* M1Old
M2New = A* M2Old + B
where
M1New and M2New are the new transformation constants calculated to place the new field test items onto the LAS Links scale,
M1Old and M2Old are the transformation constants from the anchor set. The A and B values are derivatives of the input (initial) and estimated (final) values for the anchor set and are computed as follows:
Old
New
SDSDA =
)( Old
Old
NewNew Mean
SDSDMeanB −=
where SDNew is the standard deviation of anchor estimates in scale score metric, SDOld is the standard deviation of anchor input values in scale score metric,

Colorado English Language Acquisition Assessment Program 2008 Technical Report ● 38
Copyright © 2008 by the Colorado Department of Education.
MeanNew is the mean of anchor estimates in scale score metric, and MeanOld is the mean of anchor input in scale score metric. This equating procedure was performed for each of the grade spans K–2, 3–5, 6–8 and 9–12. Consequently, the equated results were used to create new raw-to-scale score tables for each of the six content areas (Reading, Writing, Listening, Speaking, Oral, and Comprehension). Because the total score is computed as the unweighted mean of the scale scores on Reading, Writing, Listening, and Speaking, no separate calibration, equating, scaling, or scoring table was required for the total score. The scoring tables for all grade spans are included in Appendix E.
Results of the Calibration and Equating
Tables B1 to B24 and Figures B1 to B48 in Appendix B show the alignment of the original and equated “a” parameters (using the log of a) and the alignment of the corresponding “b” parameters for Listening, Speaking, Reading, and Writing. In these figures, the original parameters are the 2007 CELApro item parameters, and the equated parameters are the new CELApro 2008 parameters. The 2008 CELApro parameters are very similar to the 2007 item parameters, suggesting that the tests are functioning consistently across different years and student populations, and across grade spans. Figures C1 to C12 in Appendix C show the CELApro test characteristic curves (TCCs) and the conditional standard errors of measurement (CSEMs) for each grade span and content domain. For a vertically scaled test such as the CELApro/LAS Links, we would expect to see a pattern in which the TCCs are arrayed in grade-level sequence from left to right (i.e., with tests increasing in difficulty as grade level increases). With the exception of the Speaking and Oral scales (where the TCCs are very close together), the TCCs show this expected pattern. The correlations between the equated and input anchor item parameters and p-values (P) are shown in Table 14. For selected-response scales, these represent the correlations of the a and b parameters. For constructed-response items, the correlations of item parameters represent the alpha and gamma correlations, respectively.
Table 14. Stocking and Lord Parameter Correlations
Grade Span K–2 P Discrimination Location
Speaking 1.00 0.97 0.93 Listening 0.99 0.79 0.89 Reading 1.00 0.70 0.99 Writing 0.97 0.76 0.99
Oral 1.00 0.86 1.00 Comprehension 1.00 0.86 0.97

Colorado English Language Acquisition Assessment Program 2008 Technical Report ● 39
Copyright © 2008 by the Colorado Department of Education.
Grade Span 3–5 P Discrimination Location
Speaking 1.00 0.94 0.95 Listening 1.00 0.90 0.97 Reading 0.99 0.90 0.95 Writing 0.98 0.92 1.00
Oral 1.00 0.97 1.00 Comprehension 1.00 0.92 0.95
Grade Span 6–8 P Discrimination Location
Speaking 0.84 0.46 0.52 Listening 0.95 0.80 0.88 Reading 0.95 0.80 0.88 Writing 0.91 0.63 0.98
Oral 0.92 0.81 0.96 Comprehension 0.98 0.72 0.96
Grade Span 9–12 P Discrimination Location
Speaking 0.96 0.83 0.85 Listening 0.93 0.69 0.78 Reading 0.91 0.68 0.82 Writing 0.96 0.78 1.00
Oral 0.95 0.93 0.98 Comprehension 0.96 0.72 0.92
For all contents and grade spans, the P-value correlations are all greater than .90. For each of the six content domains, Appendix D contains the test characteristic curves for the anchor item input parameters, the equated anchor item estimated parameters, and the equated total test. As shown in these plots, the total test and the anchor test are closely aligned to each other.
Item Analysis Classical item analysis statistics were computed for the 2008 CELApro administration for each content domain at each grade span. The tables in Appendix A present item-level descriptive statistics for each grade span and content domain. These tables contain the following information: item number, item type, item p-value, item correlation with the total test score, correlation between each item choice and the total test score, and percent omit. The p-value for an SR item represents the proportion of students who answered the item correctly. The p-value for a CR item represents the mean raw score for the item divided by the maximum possible score for that item.

Colorado English Language Acquisition Assessment Program 2008 Technical Report ● 40
Copyright © 2008 by the Colorado Department of Education.
The point biserial correlation between the item score and the total score on the test was also computed for each of the SR items. For each CR item, the Pearson product-moment correlation between the item score and the total score on the test was computed. For these correlations, the studied item was excluded from the computation of the total score so as not to inflate the correlation artificially. Item Difficulty Statistics (p-values) The statistics for individual items at each grade span are provided in the item analysis tables in Appendix A. In these tables, item difficulty is expressed in terms of p-values. For selected-response items, the p-value is the proportion of students answering the item correctly. For constructed-response items, the p-value is the mean item score expressed as a proportion of the total score points possible on that item. (i.e., each raw item score is divided by the maximum possible score on the item).
The statistics for individual items at each grade span are provided in the item analysis tables in Appendix A. The p-values in Appendix A are above .20 except for eight items in Kindergarten and one item in K–1 Reading, and most are in the desired difficulty range between .30 and .90.
The range of p-values varies by grade span and content domain. Across grade spans, the p-values range from .22 to .97 for Listening; .10 to .74 for Speaking; .17 to .99 for Reading; .08 to .93 for Writing; .22 to .99 for Comprehension; and .10 to .98 for Oral. Within grade spans, p-values range from .08 to .99 in Grade Span K–2; from .70 to .97 in Grade Span 3–5; from .24 to .93 in Grade Span 6–8; and from .34 to .92 in Grade Span 9–12.
Average item difficulty for each content area, grade, and grade span is summarized in Table 15, below. In this table, item difficulty is expressed in terms of p-values. For selected-response items, the p-value is the proportion of students answering the item correctly. For constructed- response items, the p-value is the mean item score expressed as a proportion of the total score points possible on that item. (i.e., each raw item score is divided by the maximum possible score on the item).

Colorado English Language Acquisition Assessment Program 2008 Technical Report ● 41
Copyright © 2008 by the Colorado Department of Education.
Table 15. Mean P-Values by Grade Span and by Grade
Grade Speaking Listening Reading Writing Oral Comprehension
Grade Span 1 0.66 0.67 0.65 0.45 0.66 0.65 K 0.50 0.48 0.50 0.22 0.49 0.50 1 0.69 0.70 0.63 0.47 0.69 0.64 2 0.78 0.83 0.79 0.65 0.81 0.79
Grade Span 2 0.78 0.69 0.64 0.73 0.74 0.67 3 0.73 0.63 0.55 0.66 0.68 0.59 4 0.79 0.70 0.65 0.75 0.74 0.67 5 0.83 0.75 0.73 0.80 0.79 0.74
Grade Span 3 0.77 0.77 0.65 0.74 0.77 0.71 6 0.76 0.75 0.61 0.73 0.76 0.68 7 0.78 0.77 0.65 0.74 0.77 0.71 8 0.78 0.78 0.68 0.76 0.78 0.74
Grade Span 4 0.79 0.75 0.63 0.75 0.77 0.69 9 0.76 0.72 0.58 0.73 0.74 0.64
10 0.80 0.75 0.63 0.75 0.77 0.69 11 0.80 0.76 0.65 0.76 0.78 0.71 12 0.81 0.76 0.66 0.75 0.79 0.72
Item-Total Correlations An important indicator of item quality is the correlation of scores on that item with scores on the total test. These item-total correlations (point biserial correlation coefficients) are summarized below in Table 16. To compute these correlations, the “total” score was defined as the total score on the specific content domain. To avoid artificially inflating the correlation coefficients, the contribution of the item in question was removed from the total when calculating each of the correlations. Thus, performance on each Listening item was correlated with the total Listening score minus the score on the item in question, performance on each Speaking item was correlated with the total Speaking score minus the score on the item in question, and so on for the Reading, Writing, Oral, and Comprehension scales.
Individual item-total correlations for each content area and grade span are provided in the item analysis tables in Appendix A. Across grades 1–12, item-total correlations for the Listening items range from .23 to .56. Item-total correlations for Speaking range from .27 to .84. For Reading, the correlations range from .14 to .56, and for Writing the correlations range from .06 to .76. Comprehension item-total correlations range from .14 to .57, and Oral item-total correlations range from .10 to .81. Item-total correlations for Kindergarten were slightly lower than the other grades. Item-total correlations for Listening items range from .02 to .53, from .34 to .84 for Speaking, from .07 to .45 for Reading, from .02 to .80 for Oral, from -.02 to .48 for Comprehension, and from .08 to .58 for Writing
The average (mean) item-total correlation coefficients for each content area, grade span and grade are shown in Table 16. The average item-total correlation coefficients ranged from 0.55 to 0.66 for Speaking, from .34 to .43 for Listening, .33 to .44 for Reading, .25 to .48 for Writing, .39 to .48 for Oral, and .32 to .41 for Comprehension.

Colorado English Language Acquisition Assessment Program 2008 Technical Report ● 42
Copyright © 2008 by the Colorado Department of Education.
Table 16. Average Item-Total Correlations by Grade Span and Grade
Item Omit Rates The item analysis tables in Appendix A also show the rate at which students omit items. Omit rates are often useful in determining whether testing times are sufficient, particularly if there is a high rate of items omitted at the end of a test section. In cases where speededness is not an issue, high item omit rates may often indicate ambiguity or extreme item difficulty.
Omit rates were generally low for students in grades 3 through 12. Omit rates for Grade Span 9–12 were below 5 percent for all of the content areas. For Grade Span 6–8, two Speaking items had omit rates between 5 and 6 percent, but omit rates were below 5 percent for all of the other items in all content areas. For Grade Span 3–5, two Reading items had omit rates of 13.29 percent and 20.31 percent, but omit rates were below 5 percent for all of the other items in all of the content areas. Omit rates were generally higher for Grade Span K–2. Omit rates were between 2.16 and 5.85 percent for all of the Listening items, with six items above 5 percent. For the Reading items, omit rates were above 5 percent for eleven items in Grades 1–2 and for all but three of the items administered to Kindergarten students. Speaking K–2 had five items above 5 percent. Highest omit rates were for the K–1 Writing items, with omit rates ranging from 2.27 percent to 22.05 percent, and with all but one item above 5 percent. However, omit rates for the Writing items were all below 5 percent for students in Grade 2.
Differential Item Functioning (DIF) Statistics In addition to the analyses that were conducted as part of the LAS Links development process, Linn-Harnisch (1981) gender DIF analyses were conducted on data from the Winter 2008
Grade Speaking Listening Reading Writing Oral Comprehension
Grade Span 1 0.61 0.39 0.35 0.38 0.44 0.34 K 0.64 0.36 0.33 0.25 0.44 0.32 1 0.62 0.41 0.34 0.42 0.46 0.33 2 0.58 0.40 0.38 0.48 0.43 0.35
Grade Span 2 0.56 0.35 0.42 0.47 0.39 0.36 3 0.56 0.34 0.4 0.46 0.39 0.33 4 0.55 0.36 0.43 0.48 0.40 0.37 5 0.56 0.36 0.44 0.48 0.40 0.38
Grade Span 3 0.61 0.41 0.41 0.44 0.45 0.39 6 0.57 0.38 0.39 0.43 0.42 0.36 7 0.62 0.41 0.41 0.44 0.46 0.40 8 0.63 0.43 0.42 0.44 0.48 0.41
Grade Span 4 0.64 0.42 0.41 0.47 0.47 0.40 9 0.66 0.41 0.39 0.48 0.48 0.39 10 0.64 0.41 0.41 0.48 0.47 0.40 11 0.64 0.42 0.41 0.47 0.48 0.41 12 0.61 0.41 0.42 0.46 0.45 0.41

Colorado English Language Acquisition Assessment Program 2008 Technical Report ● 43
Copyright © 2008 by the Colorado Department of Education.
CELApro administration. For the CELApro analyses, a separate IRT calibration and separate DIF analysis was conducted for each grade span and language domain (Listening, Speaking, Reading, Writing, Oral, and Comprehension). To calculate DIF for the CELApro assessments, the IRT parameters for each item (ai, bi, ci) and the trait or ability estimate (θi) for each examinee were estimated for the three-parameter logistic model:
( )[ ]iji
iiij ba
ccP
−−+−
+=θ7.1exp1
1,
where Pij is the probability that examinee j will pass item i. The total population is then divided into two groups by gender, and the members in each group are sorted into ten equal score categories (deciles) based upon their location on the scale score (θi) scale. The expected proportion correct for each group based on the model prediction is compared to the observed (actual) proportion correct obtained by the group. The proportion of examinees in decile g who are expected to answer item i correctly is:
ijgjg
ig Pn
P Σ=ε
1,
where ng is the number of examinees in decile g. The proportion of examinees expected to answer item i correctly (over all deciles) for a group (e.g., female) is:
gg
iggg
i
n
PnP
Σ
Σ
=
== 10
1
10
1 .
The corresponding observed proportion correct for examinees in a decile (Oig) is defined as the number of examinees in decile g who answered item i correctly divided by the total number of examinees in the decile (ng). That is,
g
ijgj
ig n
uO
Σ= ε ,
where uij is the dichotomous score for item i for examinee j.

Colorado English Language Acquisition Assessment Program 2008 Technical Report ● 44
Copyright © 2008 by the Colorado Department of Education.
The corresponding formula to compute the observed proportion answering each item correctly (over all deciles) for a complete gender group is given by:
gg
iggg
i
n
OnO
Σ
Σ
=
== 10
1
10
1 .
After the values are calculated for these variables, the difference between the observed proportion correct for a gender group and expected proportion correct can be computed. The decile group difference (Dig) for observed and expected proportion correctly answering item i in decile g is:
igigig POD −= ,
and the overall group difference (Di) between observed and expected proportion correct for item i in the complete group (over all deciles) is:
iii POD −= .
DIF is defined in terms of the decile group and total target subsample differences, the Di- (sum of the negative group differences) and Di+ (sum of the positive group differences) values, and the corresponding standardized difference (Zi) for the subsample (see Linn & Harnisch, 1981, p. 112). Items for which |Di| ≥0.10 and |Zi| ≥2.58 are flagged as DIF items. If Di is positive, the item favors the target subsample. If Di is negative, the item favors the standard sample.
These indices are indicators of the degree to which members of a gender group perform better or worse than expected on each item, based on the parameter estimates from all subsamples. Differences for decile groups provide an index for each of the ten regions on the scale score (θ) scale. The decile group difference (Dig) can be either positive or negative. Use of the decile group differences as well as the overall group difference allows one to detect items that give a large positive difference in one range of θ and a large negative difference in another range of θ, yet have a small overall difference A generalization of the Linn and Harnisch (1981) procedure was used to measure DIF for constructed-response items.
The results of the DIF analyses are shown in Table 17. Overall, very few items exhibited differential item functioning by gender or ethnicity. Across all grades and content areas, one item was flagged for DIF against males and no items were flagged for DIF against females. Across all grades and content areas, 10 items were flagged for DIF in favor of Black examinees, and 16 items were flagged for DIF against Black examinees.

Colorado English Language Acquisition Assessment Program 2008 Technical Report ● 45
Copyright © 2008 by the Colorado Department of Education.
Table 17. Number of Items Exhibiting Differential Item Functioning
Male Female Hispanic Black
Subject Grade Span For Against For Against For Against For Against
K–2 0 0 0 0 0 0 3 0
3–5 0 0 0 0 0 0 0 0
6–8 0 0 0 0 0 0 0 0 Listening
9–12 0 0 0 0 0 0 0 1
K–2 0 0 0 0 0 0 0 0
3–5 0 0 0 0 0 0 0 2
6–8 0 0 0 0 0 0 1 5 Speaking
9–12 0 0 0 0 0 0 4 5
K 0 0 0 0 0 0 0 0
3–5 0 0 0 0 0 0 0 0
6–8 0 0 0 0 0 0 1 0 Reading
9–12 0 0 0 0 0 0 1 2
K–2 0 0 0 0 0 0 0 0
3–5 0 0 0 0 0 0 0 0
6–8 0 0 0 0 0 0 0 0 Writing
9–12 0 0 0 0 0 0 0 1
K–2 0 0 0 0 0 0 3 0
3–5 0 0 0 0 0 0 1 0
6–8 0 0 0 0 0 0 3 2 Oral
9–12 0 0 0 0 0 0 4 4
K–2 0 0 0 0 0 0 3 0
3–5 0 0 0 0 0 0 0 0
6–8 0 0 0 0 0 0 0 0 Comprehension
9–12 0 0 0 0 0 0 1 4 The number of DIF items for black appeared consistent with last year’s results. This finding is expected given almost all of the CELApro 2008 items are the same as the CELApro 2007 except for very few new items added in CELApro 2008. As noted from last year’s DIF results (CTB/McGraw-Hill, 2007), the observed DIF for Black students may be a consequence of the fact that the representation of native language groups among Black students is very different from the distribution of languages in the total population. This difference could have potentially contributed to difference in test performance between groups.

Colorado English Language Acquisition Assessment Program 2008 Technical Report ● 46
Copyright © 2008 by the Colorado Department of Education.
All items flagged for DIF will be carefully reviewed by CTB’s content development experts to try to determine whether race, native language, or another characteristic might have caused the DIF. If that review suggests that the DIF statistics are likely to reflect racial bias rather than only meaningful language differences, the items will be replaced in revised future forms whenever suitable replacement items are available.

Colorado English Language Acquisition Assessment Program 2008 Technical Report ● 47
Copyright © 2008 by the Colorado Department of Education.
Student Performance on the 2008 CELApro This section of the report will summarize the performance of students on the 2008 CELApro. Results are presented for the total population and for various subgroups of interest. In addition, results will be compared with performance on the 2007 CELApro. To facilitate interpretation of the score distributions provided in this report, the lowest obtainable scale scores (LOSS) and the highest obtainable scale scores (HOSS) on the 2008 CELApro are provided in Table 18.
Table 18. 2008 CELApro Lowest and Highest Obtainable Scale Scores
Speaking Listening Reading Writing Comp (R+L)
Oral (L+S) Total
LOSS 300 300 240 200 270 280 260 Grade K HOSS 580 560 570 630 570 620 585 LOSS 300 300 240 200 270 280 260 Grade 1 HOSS 580 560 590 630 590 620 590 LOSS 300 300 240 200 270 280 260 Grade 2 HOSS 580 560 590 640 590 620 592 LOSS 310 310 300 270 320 290 297 Grades 3–5 HOSS 635 630 660 680 660 680 651 LOSS 325 360 380 300 360 310 341 Grades 6–8 HOSS 645 640 690 690 680 700 666 LOSS 330 370 390 310 380 320 350 Grades 9–12 HOSS 650 650 700 700 700 710 675
Note. LOSS = Lowest Obtainable Scale Score; HOSS = Highest Obtainable Scale Score. Table 19 shows the 2008 total scale score means and standard deviations by grade span, and Table 20 shows the results for each individual grade in 2007 and 2008.
Table 19. 2008 Total Scale Score Means and Standard Deviations by Grade Span.
N Mean SD Grade Span 1 32756 436.64 55.39 Grade Span 2 22862 516.19 43.74 Grade Span 3 13486 543.49 45.00 Grade Span 4 10750 543.37 45.10

Colorado English Language Acquisition Assessment Program 2008 Technical Report ● 48
Copyright © 2008 by the Colorado Department of Education.
Table 20. 2007 and 2008 Total Scale Score Means and Standard Deviations by Grade
2007 2008 N Mean SD N Mean SD
KG 10,063 376.52 39.17 10,198 383.48 37.65 1 11,479 434.86 42.45 11,844 441.78 40.94 2 9,826 478.22 41.09 10,714 481.55 37.97 3 9,094 495.02 43.22 8,845 498.14 39.93 4 7,647 515.89 41.65 7,573 519.72 41.55 5 6,745 531.61 43.31 6,444 536.80 41.05 6 5,307 530.51 42.75 5,189 537.22 41.64 7 4,730 538.45 45.95 4,485 544.78 46.06 8 4,204 541.26 46.83 3,812 550.50 46.97 9 4,121 531.74 48.36 3,701 535.31 45.20
10 3,333 538.85 48.52 2,963 545.56 44.18 11 2,360 543.72 46.21 2,344 548.88 44.88 12 1,811 543.08 43.69 1,742 549.35 44.29
The 2008 total scale scores were higher than the 2007 scores. The greatest increase in scores occurred in Kindergarten and Grade 8.
The 2008 performance on the six component scales of Speaking, Listening, Reading, Writing, Comprehension, and Oral Proficiency is summarized by grade and by grade span in Table 21 and by grade and gender in Table 22.

Colorado English Language Acquisition Assessment Program 2008 Technical Report ● 49
Copyright © 2008 by the Colorado Department of Education.
Table 21. CELApro Scale Score Means and Standard Deviations: Component Scales
Speaking Listening Reading Writing Comprehension Oral
N Mean SD N Mean SD N Mean SD N Mean SD N Mean SD N Mean SD Grade Span 1 34,728 480.44 47.11 34,395 459.33 47.96 34,337 405.71 66.60 33,106 392.31 99.43 34,139 437.29 54.73 34,225 471.93 43.90
KG 11,696 454.15 48.10 11,400 422.43 40.23 11,375 348.57 48.49 10,326 297.73 77.58 11,238 391.09 43.46 11,359 443.13 46.12 1 12,194 486.16 41.36 12,167 463.84 38.36 12,122 410.91 48.49 11,979 403.29 73.25 12,091 441.36 40.88 12,095 477.35 34.97 2 10,838 502.39 37.75 10,828 493.11 36.78 10,840 459.86 50.63 10,801 470.55 61.57 10,810 480.75 38.74 10,771 496.20 31.80
Grade Span 2 23,117 528.37 46.16 23,072 509.09 47.46 23,013 506.29 56.12 23,011 520.98 61.67 22,962 506.77 46.29 22,989 521.55 40.94
3 8,946 516.49 43.86 8,921 491.75 42.97 8,907 484.23 52.26 8,899 500.23 59.01 8,884 487.81 42.08 8,892 507.78 36.3 4 7,647 530.03 44.45 7,641 512.05 46.18 7,626 510.04 53.19 7,629 526.40 59.97 7,608 509.75 44.02 7,610 523.39 39.71 5 6,524 542.71 46.85 6,510 529.40 45.99 6,480 532.21 52.40 6,483 543.07 58.08 6,470 529.29 43.39 6,487 538.24 41.74
Grade Span 3 13,689 544.33 55.78 13,619 548.40 58.16 13,629 536.6 48.92 13,600 544.74 55.01 13,577 534.01 45.36 13,558 541.86 50.98
6 5,267 539.93 50.79 5,237 540.51 55.02 5,249 527.86 45.49 5,234 540.97 53.19 5,224 526.61 41.80 5,214 536.14 45.56 7 4,555 545.53 57.73 4,528 551.10 58.96 4,528 537.38 49.19 4,522 545.08 56.37 4,513 534.92 46.08 4,509 543.58 52.63 8 3,867 548.9 59.4 3,854 555.94 60.05 3,852 547.58 50.79 3,844 549.50 55.48 3,840 542.99 47.43 3,835 547.61 55.03
Grade Span 4 11,226 538.35 58.19 11,179 539.21 58.62 10,970 550.51 45.85 10,998 542.98 54.19 10,905 546.56 50.55 11,034 535.84 52.73
9 3,846 531.85 58.98 3,837 529.66 57.67 3,763 539.6 44.73 3,785 537.59 55.38 3,751 534.97 49.54 3,793 527.67 52.05 10 3,101 540.49 57.27 3,083 541.67 57.45 3,027 551.95 45.09 3,035 545.45 53.59 3,002 548.73 49.17 3,046 537.94 51.26 11 2,459 542.46 58.57 2,443 545.44 59.61 2,399 558.1 45.33 2,397 546.96 52.62 2,382 554.38 50.36 2,410 541.49 54.15 12 1,820 542.89 56.35 1,816 546.83 58.61 1,781 560.88 45.42 1,781 544.90 53.87 1,770 556.89 50.50 1,785 542.01 52.56

Colorado English Language Acquisition Assessment Program 2008 Technical Report ● 50
Copyright © 2008 by the Colorado Department of Education.
Table 22. CELApro Scale Score Means and Standard Deviations by Grade and Gender
Speaking Listening Reading Writing Oral Comprehension
N Mean SD N Mean SD N Mean SD N Mean SD N Mean SD N Mean SD F 5,667 453.70 50.40 5,518 423.85 40.57 5,514 349.81 48.71 5,023 301.73 78.57 5,501 442.80 48.34 5,446 392.53 43.95
KG M 6,028 454.56 45.83 5,881 421.10 39.87 5,860 347.40 48.26 5,302 293.93 76.45 5,857 443.44 43.93 5,791 389.74 42.96 F 5,926 487.92 42.10 5,911 465.69 37.61 5,893 413.94 47.54 5,821 410.40 71.64 5,879 478.78 35.69 5,880 443.68 39.89
1 M 6,268 484.50 40.58 6,256 462.09 38.97 6,229 408.04 49.20 6,158 396.58 74.11 6,216 476.00 34.23 6,211 439.16 41.69 F 5,288 503.34 38.75 5,283 493.82 36.35 5,291 462.15 49.14 5,277 476.56 59.69 5,254 497.04 32.17 5,275 482.26 37.49
2 M 5,548 501.47 36.74 5,543 492.43 37.15 5,547 457.69 51.92 5,522 464.80 62.78 5,515 495.39 31.37 5,533 479.32 39.84 F 4,216 516.14 44.33 4,203 489.70 41.46 4,201 486.79 50.81 4,192 507.73 57.42 4,188 506.75 36.01 4,187 488.40 41.34
3 M 4,729 516.79 43.44 4,717 493.56 44.19 4,705 481.92 53.41 4,706 493.54 59.61 4,703 508.70 36.54 4,696 487.27 42.72 F 3,748 529.33 44.76 3,751 510.23 45.45 3,749 512.50 53.41 3,747 533.79 59.24 3,735 522.12 39.66 3,741 510.52 43.65
4 M 3,899 530.70 44.15 3,890 513.80 46.81 3,877 507.66 52.86 3,882 519.27 59.81 3,875 524.62 39.72 3,867 509.01 44.37 F 3,114 543.18 47.51 3,102 528.14 44.74 3,090 536.34 50.13 3,092 551.08 55.01 3,094 538.12 41.39 3,085 531.09 41.54
5 M 3,409 542.27 46.24 3,407 530.54 47.08 3,389 528.46 54.13 3,390 535.79 59.83 3,392 538.35 42.08 3,384 527.64 44.96 F 2,456 538.08 51.91 2,437 542.88 55.47 2,441 531.82 44.03 2,435 547.42 51.18 2,431 535.89 46.81 2,432 529.32 41.63
6 M 2,811 541.55 49.74 2,800 538.44 54.55 2,808 524.43 46.47 2,799 535.35 54.26 2,783 536.35 44.44 2,792 524.25 41.80 F 2,018 542.28 59.60 2,010 551.67 60.60 2,008 539.55 47.90 2,008 549.80 57.45 2,000 541.60 55.40 2,003 535.94 46.48
7 M 2,537 548.12 56.07 2,518 550.65 57.63 2,520 535.64 50.13 2,514 541.31 55.22 2,509 545.16 50.26 2,510 534.11 45.74 F 1,776 546.52 58.96 1,775 560.05 61.02 1,771 550.81 48.64 1,769 554.57 54.70 1,764 547.55 55.57 1,765 546.08 46.67
8 M 2,089 550.88 59.72 2,077 552.38 58.99 2,079 544.81 52.41 2,073 545.16 55.81 2,069 547.62 54.59 2,073 540.35 47.93 F 1,743 525.17 55.51 1,746 528.70 56.78 1,713 539.45 44.65 1,721 539.62 55.46 1,726 523.36 50.26 1,711 534.33 49.18
9 M 2,103 537.39 61.17 2,091 530.47 58.40 2,050 539.72 44.80 2,064 535.91 55.27 2,067 531.26 53.25 2,040 535.51 49.84 F 1,430 534.87 55.49 1,425 543.33 57.60 1,405 553.18 43.54 1,409 549.12 54.05 1,405 535.71 50.60 1,395 549.85 47.81
10 M 1,671 545.31 58.35 1,658 540.24 57.30 1,622 550.89 46.37 1,626 542.27 53.00 1,641 539.84 51.76 1,607 547.76 50.31 F 1,193 536.08 57.78 1,184 546.72 59.33 1,165 559.29 45.10 1,164 549.24 53.62 1,173 538.17 55.19 1,157 555.40 50.15
11 M 1,266 548.47 58.70 1,259 544.23 59.88 1,234 556.97 45.54 1,233 544.80 51.58 1,237 544.64 52.97 1,225 553.43 50.55 F 882 534.84 54.97 878 545.96 58.21 860 561.39 46.85 862 546.25 55.34 868 536.99 52.79 853 557.32 51.01
12 M 938 550.46 56.62 935 547.74 59.02 919 560.52 44.05 919 543.63 52.46 917 546.75 51.93 915 556.59 50.05

Colorado English Language Acquisition Assessment Program 2008 Technical Report ● 51
Copyright © 2008 by the Colorado Department of Education.
Overall, female students tended to score somewhat higher than male students from Kindergarten through Grade 8, with males scoring somewhat higher than females in Grades 9 through 12. The greatest gender differences were observed in Speaking and Writing. Female students scored higher than male students on the Writing test at all grade levels. Differences in the mean Writing scores were most evident in the elementary school years where the female score advantage ranged from 10 points to more than 14 points, with smaller differences observed at higher grade levels. Male students, on the other hand, tended to score substantially higher than females on the Speaking test in Grades 9 through 12. The difference in mean Speaking scores was highest in Grade 11, where the mean score for male students was almost 18 points higher than the mean for female students. These results are displayed graphically in Figures 1 through 7.

Colorado English Language Acquisition Assessment Program 2008 Technical Report ● 52
Copyright © 2008 by the Colorado Department of Education.
Figure 1. Mean Comprehension Scale Scores by Grade and Gender

Colorado English Language Acquisition Assessment Program 2008 Technical Report ● 53
Copyright © 2008 by the Colorado Department of Education.
Figure 2. Mean Listening Scale Scores by Grade and Gender

Colorado English Language Acquisition Assessment Program 2008 Technical Report ● 54
Copyright © 2008 by the Colorado Department of Education.
Figure 3. Mean Oral Scale Scores by Grade and Gender

Colorado English Language Acquisition Assessment Program 2008 Technical Report ● 55
Copyright © 2008 by the Colorado Department of Education.
Figure 4. Mean Reading Scale Scores by Grade and Gender

Colorado English Language Acquisition Assessment Program 2008 Technical Report ● 56
Copyright © 2008 by the Colorado Department of Education.
Figure 5. Mean Speaking Scale Scores by Grade and Gender

Colorado English Language Acquisition Assessment Program 2008 Technical Report ● 57
Copyright © 2008 by the Colorado Department of Education.
Figure 6. Mean Writing Scale Scores by Grade and Gender

Colorado English Language Acquisition Assessment Program 2008 Technical Report ● 58
Copyright © 2008 by the Colorado Department of Education.
Figure 7. Mean Total Scale Scores by Grade and Gender
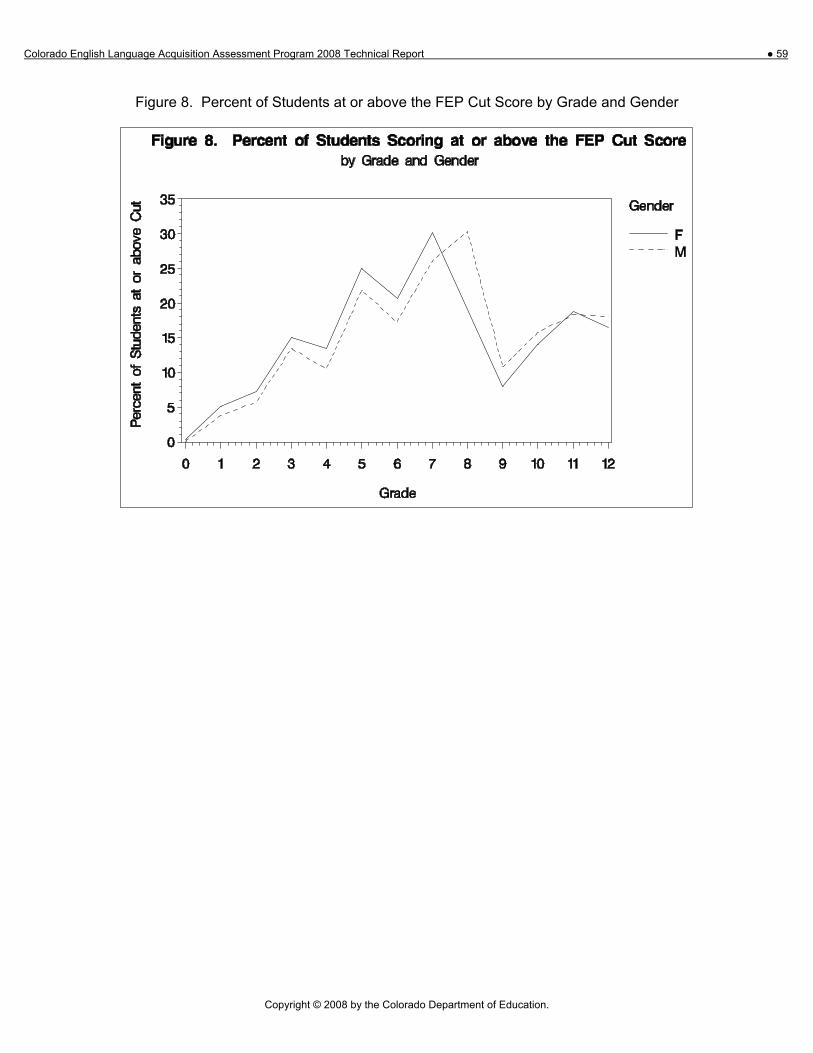
Colorado English Language Acquisition Assessment Program 2008 Technical Report ● 59
Copyright © 2008 by the Colorado Department of Education.
Figure 8. Percent of Students at or above the FEP Cut Score by Grade and Gender

Colorado English Language Acquisition Assessment Program 2008 Technical Report ● 60
Copyright © 2008 by the Colorado Department of Education.
The performance of students tested with and without accommodations is provided in Tables 23 and 24. Because the numbers of students receiving accommodations at each grade level are very small, all accommodations for a content domain are combined in these tables. A comparison of the means indicates that students receiving accommodations tended to obtain somewhat lower scores than students who did not require accommodations.
Table 23. Total Scale Score Means by Grade and Accommodations
Total Scale Score Without Accommodations With Accommodations Grade
N Mean SD N Mean SD K 10,180 383.50 37.63 18 370.94 46.51 1 11,829 441.83 40.91 15 403.67 48.68 2 10,684 481.68 37.82 30 435.27 59.45 3 8,799 498.31 39.82 46 466.59 47.44 4 7,526 519.90 41.46 47 489.68 46.61 5 6,411 536.96 41.00 33 505.73 39.31 6 5,163 537.29 41.59 26 522.88 49.81 7 4,460 545.05 45.88 25 497.04 53.27 8 3,795 550.75 46.74 17 494.41 63.63 9 3,693 535.40 45.14 8 491.75 55.71
10 2,953 545.50 44.19 10 564.50 38.04 11 2,339 549.00 44.79 5 495.40 60.39 12 1,734 549.48 44.13 8 520.75 69.20

Colorado English Language Acquisition Assessment Program 2008 Technical Report ● 61
Copyright © 2008 by the Colorado Department of Education.
Table 24. Component Scale Score Means by Grade and Accommodations
Speaking Scale Scores Listening Scale Scores
No Speaking Accommodations
With Speaking Accommodations
No Listening Accommodations
With Listening Accommodations Grade
N Mean SD N Mean SD N Mean SD N Mean SD K 11,688 454.18 48.08 8 409.50 53.86 11,392 422.45 40.22 8 389.88 47.18 1 12,190 486.17 41.36 4 465.25 55.63 12,163 463.85 38.35 4 438.00 67.35 2 10,829 502.42 37.71 9 463.22 69.16 10,818 493.16 36.68 10 440.00 81.11 3 8,935 516.49 43.83 11 514.45 65.10 8,910 491.77 42.97 11 472.64 38.27 4 7,637 530.02 44.44 10 538.00 58.10 7,628 512.07 46.13 13 500.77 72.25 5 6,513 542.76 46.82 11 513.18 57.74 6,502 529.43 45.97 8 502.13 54.87 6 5,262 539.93 50.79 5 542.40 49.86 5,231 540.50 55.00 6 545.67 76.40 7 4,551 545.52 57.74 4 559.25 47.20 4,525 551.11 58.98 3 542.67 18.56 8 3,865 548.9 59.42 2 547.00 11.31 3,852 555.96 60.05 2 520.00 29.70 9 3,839 531.98 58.82 7 458.71 99.00 3,831 529.76 57.64 6 467.17 49.07
10 3,094 540.43 57.26 7 568.29 59.88 3,075 541.52 57.36 8 600.50 68.64 11 2,454 542.54 58.56 5 502.60 57.50 2,439 545.52 59.52 4 495.25 102.6012 1,814 542.92 56.35 6 534.83 63.28 1,809 546.77 58.65 7 561.43 47.62
Reading Scale Scores Writing Scale Scores
No Reading Accommodations
With Reading Accommodations
No Writing Accommodations
With Writing Accommodations Grade
N Mean SD N Mean SD N Mean SD N Mean SD K 11,368 348.62 48.45 7 268.71 50.59 10,307 297.71 77.57 19 309.00 88.68 1 12,111 410.96 48.45 11 353.18 61.51 11,963 403.38 73.19 16 337.44 87.47 2 10,824 459.93 50.58 16 419.00 66.36 10,769 470.72 61.36 32 410.97 94.81 3 8,889 484.28 52.21 18 456.17 67.41 8,853 500.45 58.93 46 458.78 61.64 4 7,598 510.18 53.09 28 473.11 65.90 7,578 526.70 59.83 51 481.67 64.27 5 6,456 532.41 52.30 24 478.83 54.87 6,449 543.29 57.97 34 502.68 65.28 6 5,233 527.97 45.40 16 493.81 62.01 5,208 541.04 53.08 26 525.12 70.29 7 4,512 537.62 48.99 16 468.94 59.02 4,497 545.29 56.30 25 505.60 57.00 8 3,842 547.76 50.64 10 475.90 61.82 3,825 549.80 55.01 19 488.11 101.189 3,755 539.69 44.62 8 493.75 70.99 3,777 537.69 55.33 8 493.25 63.79
10 3,017 551.91 45.09 10 563.90 45.39 3,025 545.47 53.62 10 540.60 47.14 11 2,395 558.17 45.27 4 515.25 67.61 2,393 547.01 52.64 4 517.75 28.72 12 1,774 561.06 45.28 7 515.29 62.28 1,774 545.11 53.62 7 490.86 89.03

Colorado English Language Acquisition Assessment Program 2008 Technical Report ● 62
Copyright © 2008 by the Colorado Department of Education.
As discussed in detail in the 2007 CELApro Performance Summary and Technical Addendum, preliminary cut scores for the Colorado FEP category were set using the Spring 2007 CELApro data4. These preliminary cut scores are only one of the many pieces of information used to classify Colorado students as proficient. These preliminary cut scores are for each grade level in Table 25, along with the corresponding LAS Links cut scores.
Table 25. LAS Links and CELApro Cut Scores on Total Test
LAS Links Cut Scores
Grade Early
Intermediate Level 2
IntermediateLevel 3
ProficientLevel 4
Above ProficientLevel 5
Preliminary CELApro FEP
Cut Score
KG 389 425 468 515 503 1 394 433 471 521 508 2 436 470 501 546 534 3 438 475 511 553 539 4 452 490 525 578 564 5 453 492 528 579 566 6 465 498 537 586 573 7 465 499 538 587 574 8 467 501 539 587 575 9 469 508 547 602 588 10 471 508 549 603 589 11 472 510 551 604 590 12 473 511 553 606 592
The percentages of male and female students at each grade level who scored at or above the preliminary FEP cut score are shown below in Table 26 and Figure 8. From Kindergarten through Grade 8, the percentage of females scoring at or above the cut was greater than the percentage of males. However, this pattern is reversed in Grades 9 through 12, with male students outperforming females.
4 These preliminary cut scores will be replaced with new cut scores which will be established in a formal Bookmark standard-setting workshop in 2008.
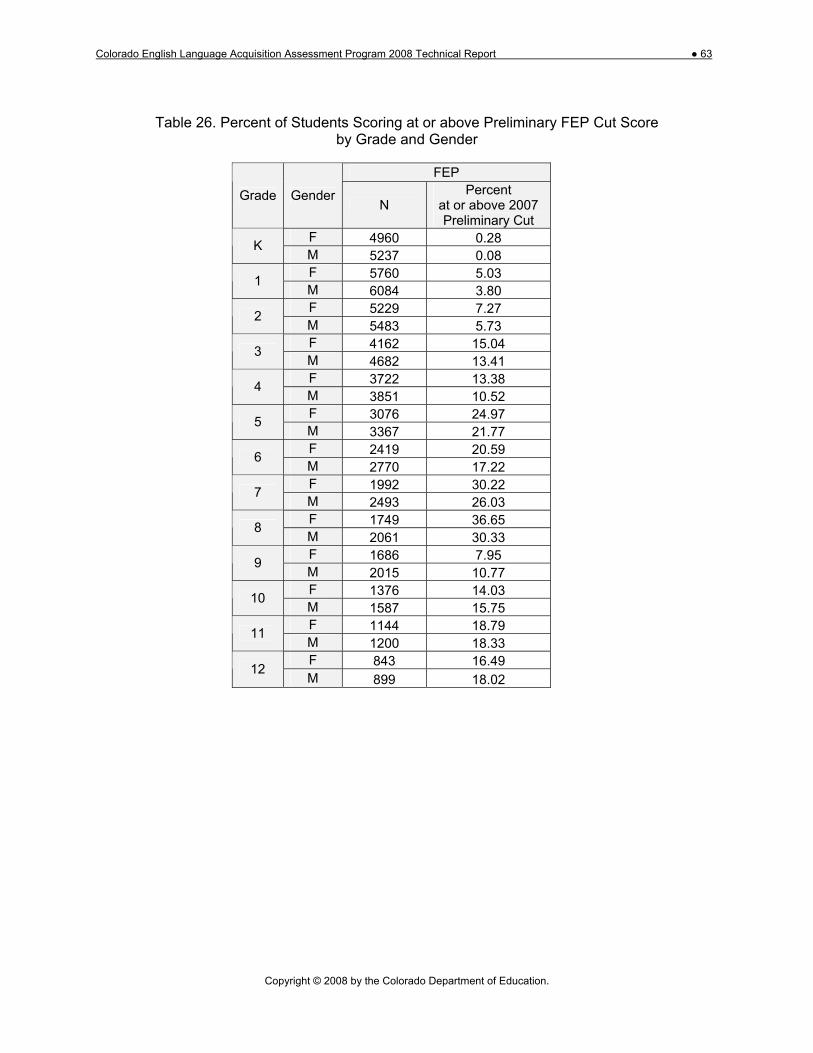
Colorado English Language Acquisition Assessment Program 2008 Technical Report ● 63
Copyright © 2008 by the Colorado Department of Education.
Table 26. Percent of Students Scoring at or above Preliminary FEP Cut Score
by Grade and Gender
FEP
Grade GenderN
Percent at or above 2007 Preliminary Cut
F 4960 0.28 K M 5237 0.08 F 5760 5.03 1 M 6084 3.80 F 5229 7.27 2 M 5483 5.73 F 4162 15.04 3 M 4682 13.41 F 3722 13.38 4 M 3851 10.52 F 3076 24.97 5 M 3367 21.77 F 2419 20.59 6 M 2770 17.22 F 1992 30.22 7 M 2493 26.03 F 1749 36.65 8 M 2061 30.33 F 1686 7.95 9 M 2015 10.77 F 1376 14.03 10 M 1587 15.75 F 1144 18.79 11 M 1200 18.33 F 843 16.49 12 M 899 18.02

Colorado English Language Acquisition Assessment Program 2008 Technical Report ● 64
Copyright © 2008 by the Colorado Department of Education.
Figure 9. Percent of Students Scoring at or above the Preliminary Cut Score by Grade and Gender
Although the profiles are quite jagged, there is a general upward trend in overall proficiency from Kindergarten through Grade 8 for both sexes. However, the proportion of students classified as proficient drops markedly in Grade 9. It should be noted that a drop in proficiency in Grade 9 was also apparent in the 2007 CELApro proficiency data, in the Colorado historical proficiency data from 2003 through 2005, as well as in the original LAS Links standardization data.
For comparative purposes, the percentage of students meeting the preliminary CELApro FEP cut score in 2007 and 2008 are shown in Table 27.

Colorado English Language Acquisition Assessment Program 2008 Technical Report ● 65
Copyright © 2008 by the Colorado Department of Education.
Table 27. Colorado FEP Proficiency Classification, 2007 vs 2008
2007 2008
Grade Total N % at or above
Cut Total N
% at or above
Cut
Difference (2008 minus 2007)
KG 10,063 0.29 10197 0.18 -0.11 1 11,479 3.39 11844 4.40 1.01 2 9,826 7.00 10712 6.49 -0.51 3 9,094 13.72 8844 14.19 0.47 4 7,647 9.59 7573 11.92 2.33 5 6,745 19.91 6443 23.29 3.38 6 5,307 11.98 5189 18.79 6.81 7 4,730 20.68 4485 27.89 7.21 8 4,204 22.48 3810 33.24 10.76 9 4,121 9.12 3701 9.48 0.36 10 3,333 12.42 2963 14.95 2.53 11 2,360 13.9 2344 18.56 4.66 12 1,811 11.32 1742 17.28 5.96

Colorado English Language Acquisition Assessment Program 2008 Technical Report ● 66
Copyright © 2008 by the Colorado Department of Education.
Part 7: Reliability and Validity Evidence Validity and reliability statistics were computed using the data from the Spring 2008 CELApro administration. Overall, these CELApro analyses yielded results that were consistent with the LAS Links standardization data. Test validation is an ongoing process of gathering evidence from many sources to evaluate the soundness of the desired score interpretation or use. This evidence is acquired from studies of the content of the test as well as from studies involving scores produced by the test. Additionally, reliability is a necessary element for validity. A test can not be valid if it is not also reliable. All test scores contain some measurement error. Test score reliability refers to the degree to which scores on a particular assessment are free of the kinds of measurement errors that introduce variability in a student’s scores. Thus, the reliability coefficient quantifies the expected consistency of student performance across multiple test forms or multiple testing occasions.
Internal Consistency Reliability
Total test reliability measures such as Cronbach’s coefficient alpha (1951) and standard error of measurement consider the consistency (reliability) of performance over all test questions in a given form, the results of which imply how well the questions measure the content domain and could continue to do so over repeated administrations. Total test reliability coefficients such as coefficient alpha may range from 0.00 to 1.00, where 1.00 refers to a perfectly consistent test.
The internal consistency reliability of the CELApro Speaking, Listening, Reading, Writing, Oral, and Comprehension scales was evaluated using Cronbach’s coefficient alpha, computed with the standard formula
C nn
ii
n
Xα
σ
σ=
−−
⎡
⎣
⎢⎢⎢⎢
⎤
⎦
⎥⎥⎥⎥
=∑
11
2
12 .
where
n = the number of items,
i2σ = the raw item variance, and
X2σ = the raw score variance for each scale.
Because the CELApro total scale score is a composite (the unweighted mean of the four component scale scores on Reading, Writing, Listening, and Speaking), the internal consistency
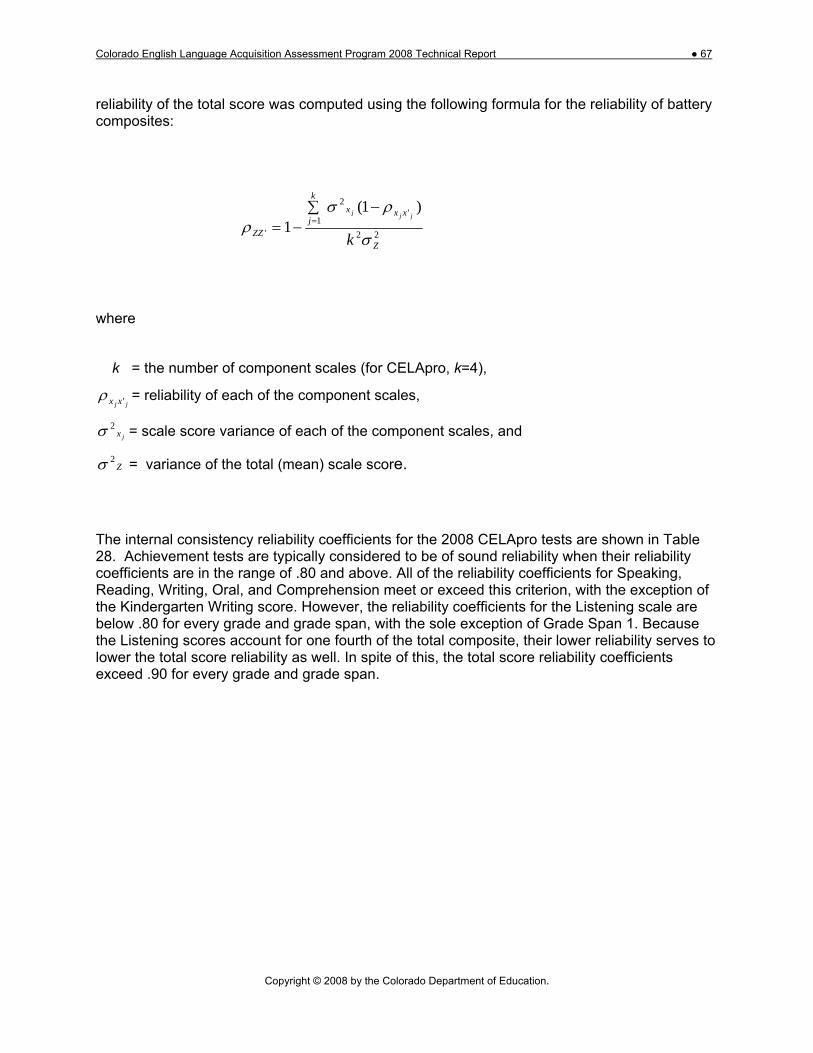
Colorado English Language Acquisition Assessment Program 2008 Technical Report ● 67
Copyright © 2008 by the Colorado Department of Education.
reliability of the total score was computed using the following formula for the reliability of battery composites:
22
'2
1'
)1(1
Z
xxxk
jZZ k
jjj
σ
ρσρ
−∑−= =
where
k = the number of component scales (for CELApro, k=4),
jj xx 'ρ = reliability of each of the component scales,
jx2σ = scale score variance of each of the component scales, and
Z2σ = variance of the total (mean) scale score.
The internal consistency reliability coefficients for the 2008 CELApro tests are shown in Table 28. Achievement tests are typically considered to be of sound reliability when their reliability coefficients are in the range of .80 and above. All of the reliability coefficients for Speaking, Reading, Writing, Oral, and Comprehension meet or exceed this criterion, with the exception of the Kindergarten Writing score. However, the reliability coefficients for the Listening scale are below .80 for every grade and grade span, with the sole exception of Grade Span 1. Because the Listening scores account for one fourth of the total composite, their lower reliability serves to lower the total score reliability as well. In spite of this, the total score reliability coefficients exceed .90 for every grade and grade span.

Colorado English Language Acquisition Assessment Program 2008 Technical Report ● 68
Copyright © 2008 by the Colorado Department of Education.
Table 28. Internal Consistency Reliability Coefficients by Grade Span and Grade.
Compre- hension Listening Oral Reading Speaking Writing Total
Score
Grade Span 1 0.91 0.85 0.94 0.90 0.93 0.91 0.96 K 0.84 0.75 0.92 0.83 0.93 0.84 0.92 1 0.85 0.78 0.92 0.83 0.92 0.87 0.94 2 0.86 0.74 0.90 0.85 0.90 0.88 0.94
Grade Span 2 0.87 0.70 0.89 0.88 0.89 0.88 0.94 3 0.83 0.64 0.88 0.85 0.89 0.86 0.93 4 0.86 0.68 0.88 0.87 0.88 0.87 0.94 5 0.87 0.68 0.88 0.88 0.89 0.87 0.94
Grade Span 3 0.88 0.75 0.92 0.85 0.92 0.84 0.94 6 0.86 0.72 0.90 0.83 0.90 0.83 0.93 7 0.89 0.76 0.92 0.86 0.93 0.85 0.94 8 0.89 0.78 0.93 0.86 0.93 0.85 0.95
Grade Span 4 0.89 0.78 0.93 0.85 0.93 0.87 0.95 9 0.88 0.77 0.93 0.83 0.94 0.87 0.95 10 0.89 0.77 0.93 0.85 0.93 0.87 0.95 11 0.89 0.78 0.93 0.85 0.93 0.86 0.95 12 0.89 0.77 0.92 0.86 0.92 0.86 0.95
Standard Errors of Measurement Another measure of reliability is a direct estimate of the degree of measurement error in students’ reported scores on a test. This second measure of reliability is called the standard error of measurement (SEM) and represents the number of score points about which a given score is expected to vary. The smaller the SEM, the smaller the variability and the higher the reliability. The SEM of the CELApro Speaking, Listening, Reading, Writing, Oral and Comprehension scales was computed with the standard formula
SEM=SD*sqrt * (1-alpha) where: SD = standard deviation of scale score alpha = reliability coefficients sqrt = square root

Colorado English Language Acquisition Assessment Program 2008 Technical Report ● 69
Copyright © 2008 by the Colorado Department of Education.
The SEMs for the Spring 2008 CELApro assessments are shown in Table 29.
Table 29. Standard Errors of Measurement by Grade Span and Grade.
Compre- hension Listening Oral Reading Speaking Writing Total
Score
Grade Span 1 16.06 18.33 10.81 20.69 12.04 29.63 10.57
K 17.28 20.13 12.88 20.2 12.48 30.68 10.92
1 15.73 17.9 9.87 19.9 11.68 26.5 9.86
2 14.62 18.85 9.96 19.57 11.89 21.57 9.17
Grade Span 2 16.53 26.1 13.64 19.46 15.27 21.54 10.48
3 17.36 25.91 12.65 20.56 14.63 21.73 10.55
4 16.37 26.08 13.66 19.16 15.15 21.24 10.39
5 15.78 26.02 14.33 18.49 15.73 21 10.33
Grade Span 3 15.56 28.84 14.49 18.78 15.73 22.01 10.94
6 15.44 29.15 14.13 18.58 15.69 22.01 10.97
7 15.51 28.7 14.46 18.63 15.64 22.18 10.92
8 15.56 28.14 14.66 18.98 15.69 21.67 10.8
Grade Span 4 16.59 27.74 14.13 17.64 15.16 19.65 10.3
9 16.96 27.54 13.58 18.17 14.71 19.59 10.27
10 16.29 27.63 13.91 17.46 15.03 19.59 10.24
11 16.34 27.84 14.7 17.4 15.71 19.76 10.35
12 16.45 27.89 14.94 17.2 15.86 19.81 10.36
Classification Consistency As further evidence about the reliability and validity of the proficiency levels, we reviewed the classification consistency of the placement of students into the FEP proficiency level, using the estimation methods described by Subkoviak (1988). Subkoviak (1988) provides tables from which approximate values of the Agreement Coefficient and Kappa can be obtained based on an estimation from a single administration of the test. In order to use Subkoviak’s tables, the cut score is expressed as a standard score (z) and the reliability of the test (alpha) is taken as the internal consistency estimate provided in this report.

Colorado English Language Acquisition Assessment Program 2008 Technical Report ● 70
Copyright © 2008 by the Colorado Department of Education.
Classification consistency was estimated for only one cut score at each grade level—the FEP cut point on the total score scale—because this was the only cut score that was used for decision making.
Table 30 shows the kappa coefficients and the agreement coefficients at each grade level for the Spring 2008 CELApro examinees. The agreement coefficients in this table indicate the consistency with which students would be classified above or below the preliminary FEP cut score that was established using the procedures discussed in a previous section of this report. Overall, these coefficients indicate consistent classification for 95 to 98 percent of students in Grades K–2 and for 87 to 93 percent of students in Grades 3–12.
The Kappa coefficients are more sensitive than the agreement coefficients to the contribution of test score reliability to classification consistency (Subkoviak, 1988). The Kappa coefficients for the 2008 CELApro administration are consistently high, ranging from .58 for Kindergarten students to .70 for students in Grades 5, 7, and 8.
Table 30. Subkoviak Agreement Coefficient and Kappa for the Overall Test by Grade
Grade FEP Cut Score
Scale Score Mean
Scale Score SD Z-Score Agreement
Coefficient Kappa
Coefficient
KG 503 383.48 37.65 3.16 0.98 0.58 1 508 441.78 40.94 1.61 0.96 0.62 2 534 481.55 37.97 1.37 0.95 0.64 3 539 498.14 39.93 1.01 0.91 0.68 4 564 519.72 41.55 1.05 0.92 0.67 5 566 536.80 41.05 0.70 0.89 0.70 6 573 537.22 41.64 0.85 0.90 0.68 7 574 544.78 46.06 0.62 0.88 0.70 8 575 550.50 46.97 0.51 0.87 0.70 9 588 535.31 45.20 1.15 0.93 0.66
10 589 545.56 44.18 0.97 0.91 0.68 11 590 548.88 44.88 0.90 0.90 0.68 12 592 549.35 44.29 0.95 0.91 0.68
Validity Evidence The purpose of test validation is to validate interpretations of the test scores for particular purposes or uses. Test validation is an ongoing process, beginning at initial conceptualization and continuing throughout the lifetime of an assessment. Every aspect of an assessment provides evidence in support of its validity (or evidence to the contrary), including design, content requirements, item development, and psychometric quality.
The LAS Links and CELApro tests were designed and developed to provide English language

Colorado English Language Acquisition Assessment Program 2008 Technical Report ● 71
Copyright © 2008 by the Colorado Department of Education.
proficiency scores that are valid for most types of educational decision making. The primary inferences from the test results include measurement of the proficiency of individual students relative to an international sample and relative program effectiveness based on the results of groups of students. Progress can be tracked over years and grades. The results can be used in a norm- and/or criterion-referenced manner to analyze the strengths and weaknesses of a student’s growth in each skill area, to plan for further instruction and curriculum development, and to report progress to parents. The results can also be used as one factor in making administrative decisions about program effectiveness, class grouping, needs assessment, and placement in ELD programs.
The LAS Links program was developed in accordance with the criteria for test development, administration, and use described in the Standards for Educational and Psychological Testing (1999) adopted by the American Educational Research Association (AERA), the American Psychological Association (APA), and the National Council on Measurement in Education (NCME).
Content Validity Content-related validity for language proficiency tests is evidenced by a correspondence between test content and instructional content. To ensure such correspondence, developers conducted a comprehensive curriculum review and met with educational experts to determine common educational goals and the knowledge and skills emphasized in curricula across the country. This information guided all phases of the design and development of the LAS Links suite of assessments.
As described in Part 1 of this report and summarized previously in Table 2, a study of the alignment of the CELApro assessments to the Colorado standards was also conducted, and a high level of agreement has been found. This alignment is expected to become even stronger as the CELApro assessments are further customized in future years.
Construct Validity Construct validity, what test scores mean and what kinds of inferences they support, was the central concept underlying the LAS Links test validation process. Evidence for construct validity is comprehensive and integrates evidence from both content- and criterion-related validity To establish meaningfulness, LAS Links should correlate highly with independent measures of achievement and cognitive ability. Convergent and discriminate validity evidence can also be established through a pattern of high correlations among scales that purport to measure domains that are known to be closely related and lower correlations among scales that purport to measure dissimilar domains. This kind of pattern provides evidence that the scales are actually measuring the constructs that they purport to measure. While we have no external measures available at present to correlate with the CELApro scale scores, the pattern of correlations within CELApro provides preliminary validity evidence. The intercorrelations among the CELApro scales for each grade and grade span are shown in Tables 31 through 34.
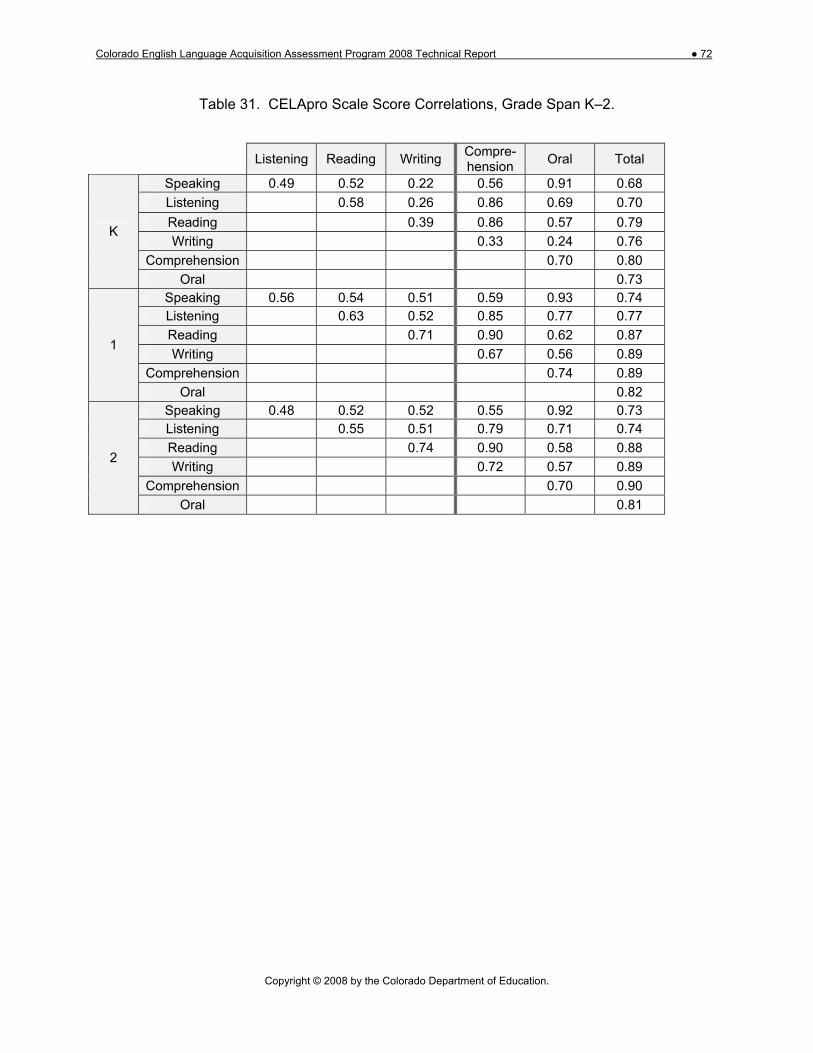
Colorado English Language Acquisition Assessment Program 2008 Technical Report ● 72
Copyright © 2008 by the Colorado Department of Education.
Table 31. CELApro Scale Score Correlations, Grade Span K–2.
Listening Reading Writing Compre- hension Oral Total
Speaking 0.49 0.52 0.22 0.56 0.91 0.68 Listening 0.58 0.26 0.86 0.69 0.70 Reading 0.39 0.86 0.57 0.79 Writing 0.33 0.24 0.76
Comprehension 0.70 0.80
K
Oral 0.73 Speaking 0.56 0.54 0.51 0.59 0.93 0.74 Listening 0.63 0.52 0.85 0.77 0.77 Reading 0.71 0.90 0.62 0.87 Writing 0.67 0.56 0.89
Comprehension 0.74 0.89
1
Oral 0.82 Speaking 0.48 0.52 0.52 0.55 0.92 0.73 Listening 0.55 0.51 0.79 0.71 0.74 Reading 0.74 0.90 0.58 0.88 Writing 0.72 0.57 0.89
Comprehension 0.70 0.90
2
Oral 0.81
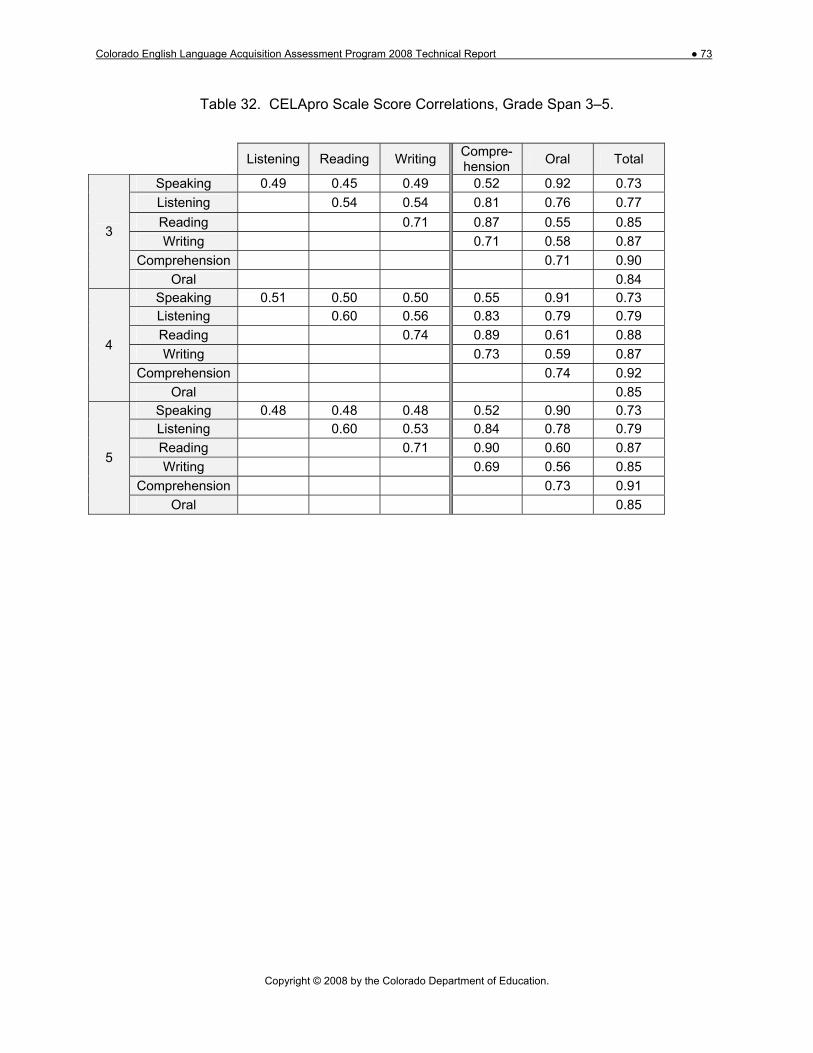
Colorado English Language Acquisition Assessment Program 2008 Technical Report ● 73
Copyright © 2008 by the Colorado Department of Education.
Table 32. CELApro Scale Score Correlations, Grade Span 3–5.
Listening Reading Writing Compre- hension Oral Total
Speaking 0.49 0.45 0.49 0.52 0.92 0.73 Listening 0.54 0.54 0.81 0.76 0.77 Reading 0.71 0.87 0.55 0.85 Writing 0.71 0.58 0.87
Comprehension 0.71 0.90
3
Oral 0.84 Speaking 0.51 0.50 0.50 0.55 0.91 0.73 Listening 0.60 0.56 0.83 0.79 0.79 Reading 0.74 0.89 0.61 0.88 Writing 0.73 0.59 0.87
Comprehension 0.74 0.92
4
Oral 0.85 Speaking 0.48 0.48 0.48 0.52 0.90 0.73 Listening 0.60 0.53 0.84 0.78 0.79 Reading 0.71 0.90 0.60 0.87 Writing 0.69 0.56 0.85
Comprehension 0.73 0.91
5
Oral 0.85

Colorado English Language Acquisition Assessment Program 2008 Technical Report ● 74
Copyright © 2008 by the Colorado Department of Education.
Table 33. CELApro Scale Score Correlations, Grade Span 6–8.
Listening Reading Writing Compre- hension Oral Total
Speaking 0.52 0.50 0.54 0.58 0.92 0.78 Listening 0.58 0.54 0.78 0.77 0.81 Reading 0.69 0.92 0.59 0.83 Writing 0.71 0.60 0.85
Comprehension 0.73 0.91
6
Oral 0.88 Speaking 0.57 0.53 0.57 0.61 0.93 0.80 Listening 0.62 0.60 0.81 0.79 0.84 Reading 0.71 0.92 0.61 0.84 Writing 0.74 0.63 0.86
Comprehension 0.75 0.92
7
Oral 0.89 Speaking 0.58 0.56 0.60 0.63 0.93 0.82 Listening 0.62 0.59 0.81 0.80 0.84 Reading 0.69 0.93 0.64 0.84 Writing 0.72 0.65 0.85
Comprehension 0.76 0.91
8
Oral 0.90

Colorado English Language Acquisition Assessment Program 2008 Technical Report ● 75
Copyright © 2008 by the Colorado Department of Education.
Table 34. CELApro Scale Score Correlations, Grade Span 9–12.
Listening Reading Writing Compre-
hension Oral Total
Speaking 0.57 0.55 0.62 0.62 0.90 0.82 Listening 0.66 0.62 0.85 0.83 0.85 Reading 0.69 0.92 0.66 0.84 Writing 0.73 0.69 0.87
Comprehension 0.79 0.91
9
Oral 0.92 Speaking 0.54 0.53 0.57 0.59 0.88 0.80 Listening 0.65 0.61 0.84 0.82 0.84 Reading 0.68 0.93 0.64 0.84 Writing 0.72 0.65 0.86
Comprehension 0.77 0.91
10
Oral 0.91 Speaking 0.56 0.52 0.57 0.58 0.88 0.80 Listening 0.68 0.61 0.85 0.83 0.86 Reading 0.68 0.93 0.65 0.84 Writing 0.70 0.64 0.85
Comprehension 0.76 0.91
11
Oral 0.91 Speaking 0.54 0.52 0.56 0.57 0.88 0.79 Listening 0.67 0.61 0.85 0.82 0.85 Reading 0.69 0.93 0.65 0.85 Writing 0.71 0.64 0.85
Comprehension 0.77 0.91
12
Oral 0.90 Overall, the pattern of correlations among the four content domains of Listening, Speaking, Reading, and Writing is similar to the pattern observed in the 2007 data, and is consistent with theoretical expectations for the CELApro language constructs. For example, the correlations support the distinction between the receptive language skills (Listening and Reading) and the productive language skills (Speaking and Writing). At all grade levels, the highest correlation with the Listening scale is the Reading scale. And at most grade levels above Grade 2, the highest correlation with the Speaking scale is the Writing scale. The failure to find a similar pattern in Kindergarten and Grade 1 is consistent with the less developed writing abilities at these lower grades.
Consistent with last year, the highest single correlation coefficient among the four domains at each grade level except Kindergarten is the correlation between the two orthographic domains of Reading and Writing.

Colorado English Language Acquisition Assessment Program 2008 Technical Report ● 76
Copyright © 2008 by the Colorado Department of Education.
Part 8. Special Studies
No special studies were conducted during the 2007–2008 testing year.

Colorado English Language Acquisition Assessment Program 2008 Technical Report ● 77
Copyright © 2008 by the Colorado Department of Education.
References
American Psychological Association, American Educational Research Association, & National
Council on Measurement in Education (1999). Standards for educational and psychological testing. Washington, D.C.: American Psychological Association.
Bachman, L. R. (1990). Fundamental considerations in language testing. Oxford, England:
Oxford University Press. Bachman, L. E, & Palmer, A.S. (1996). Language testing in practice. Oxford, England: Oxford
University Press.
Bock, R. D. (1972). Estimating item parameters and latent ability when responses are scored in two or more nominal categories. Psychometrika, 37, 29–51.
Bock, R. D., & Aitkin, M. (1981). Marginal maximum likelihood estimation of item parameters: An application of an EM algorithm. Psychometrika, 46, 443–459.
Burket, G. R. (2002). PARDUX [Computer program]. Monterey, CA: CTB/McGraw-Hill.
Camilli, G., & Shepard, L.A. (1994). Methods for identifying biased test items. Thousand Oaks: Sage.
Chamot, A. U., & O'Malley, J. M. (1994). The CALLA handbook. Reading, MA: Addison- Wesley.
Cronbach, L. J. (1951). Coefficient alpha and the internal structure of tests. Psychometrika, 16, 297–334.
CTB/McGraw-Hill. (2007). LAS Links Technical Manual. Monterey, CA: Author. Fleiss, J. L. & Cohen, J. (1973). The equivalence of weighted kappa and the intraclass
correlation coefficient as measures of reliability. Educational and Psychological Measurement, 33, 613–619.
Green, D. R. (1975). What does it mean to say a test is biased? Paper presented at American Educational Research Association, Washington, D.C.
Linn, R. L., & Harnisch, D. (1981). Interactions between item content and group membership in achievement test items. Journal of Educational Measurement, 18, 109–118.
Linn, R. L., Levine, M. V., Hastings, C. N., & Wardrop, J. L. (1981). Item bias in a test of reading comprehension. Applied Psychological Measurement, 5, 159–173.
Lord, F. M. (1980). Applications of item response theory to practical testing problems 71, 179–181. Hillsdale, NJ: Lawrence Erlbaum.
Lord, F. M., & Novick, M. R. (1968). Statistical theories of mental test scores. Reading, MA: Addison-Wesley.

Colorado English Language Acquisition Assessment Program 2008 Technical Report ● 78
Copyright © 2008 by the Colorado Department of Education.
MacMillan/McGraw-Hill (1993a). Guidelines for Bias-Free Publishing. New York: Author.
MacMillan/McGraw-Hill (1993b). Reflecting Diversity: Multicultural Guidelines for Educational Publishing Professionals. New York: Author.
O'Malley, J. M., & Valdez Pierce, L. (1996). Authentic assessment for English language learners: Practical approaches for teachers. Boston: Addison-Wesley.
Sandoval, J. H., & Mille, M. P. (1979, August). Accuracy of judgments of WISC-R item difficulty for minority groups. Paper presented at the annual meeting of the American Psychological Association, New York.
Savignon, S. (1972). Communicative competence: An experiment in foreign language teaching. Philadelphia: The Center for Curriculum Development.
Savignon, S. (1997). Communicative competence: Theory and classroom practice (2nd ed.).
New York: McGraw-Hill.
Scheuneman, J.D. (1984). A theoretical framework for the exploration of causes and effects of bias in testing. Educational Psychology, 19(4), 219–225.
Schmidt, R. (2001). Attention. In P. Robinson (Ed.), Cognition and second language instruction, 3–32. Cambridge, UK: Cambridge University Press.
Stocking, M.L. & Lord, F.M. (1983). Developing a common metric in item response theory. Applied Psychological Measurement, 7, 201–210.
Subkoviak, M. (1988). A practitioner’s guide to computation and interpretation of reliability indices for mastery tests. Journal of Educational Measurement, 25(1), 47–55.