2006-2009 strategic plan
DESCRIPTION
2006-2009 Strategic Plan. 3rd Annual Progress Report June 2009. 2006-2009 Strategic Plan. Five Goals I. Enhance the University’s Stature among its Peers II. Prepare Students for Leadership in the Knowledge Economy and Global Society - PowerPoint PPT PresentationTRANSCRIPT

2006-2009 Strategic Plan
3rd Annual Progress Report
June 2009
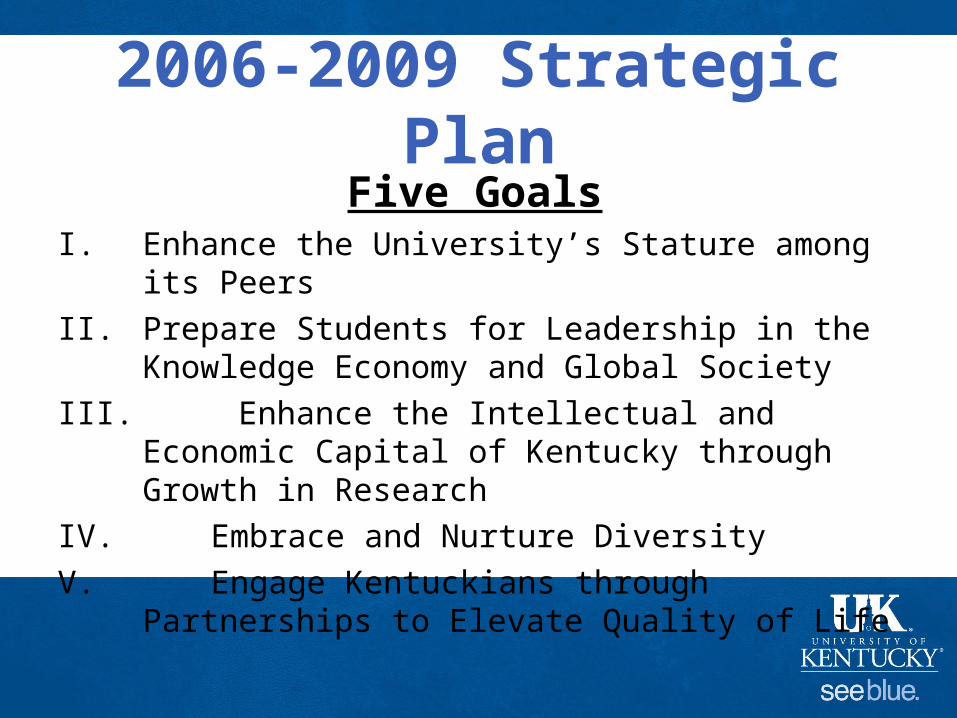
2006-2009 Strategic PlanFive Goals
I. Enhance the University’s Stature among its Peers
II. Prepare Students for Leadership in the Knowledge Economy and Global Society
III. Enhance the Intellectual and Economic Capital of Kentucky through Growth in Research
IV. Embrace and Nurture Diversity
V. Engage Kentuckians through Partnerships to Elevate Quality of Life
2006-2009 Strategic Plan
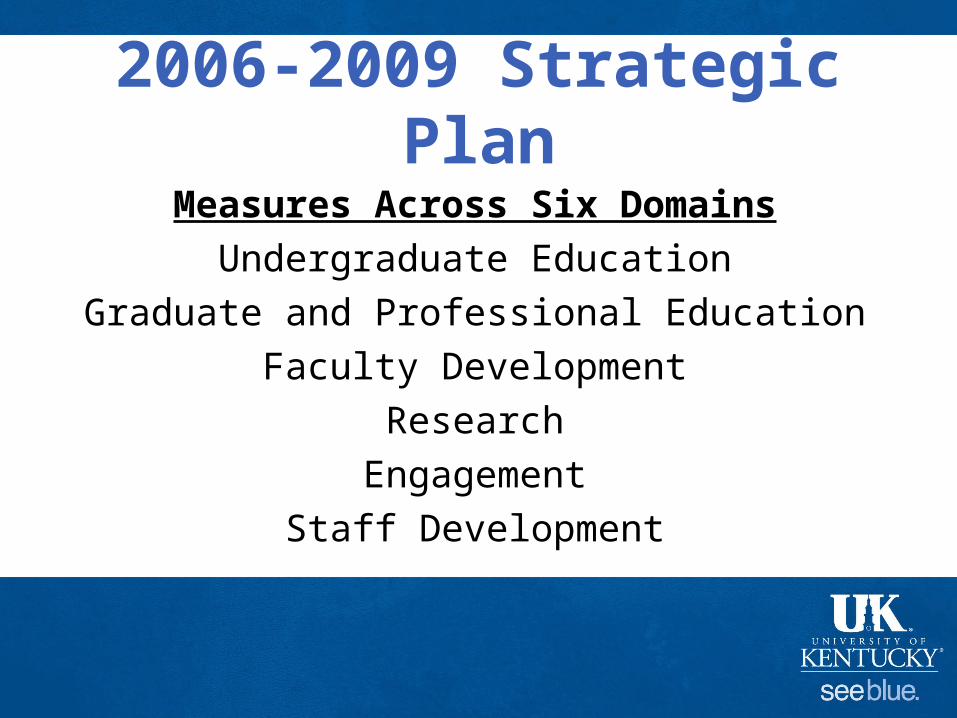
Measures Across Six Domains
Undergraduate Education
Graduate and Professional Education
Faculty Development
Research
Engagement
Staff Development
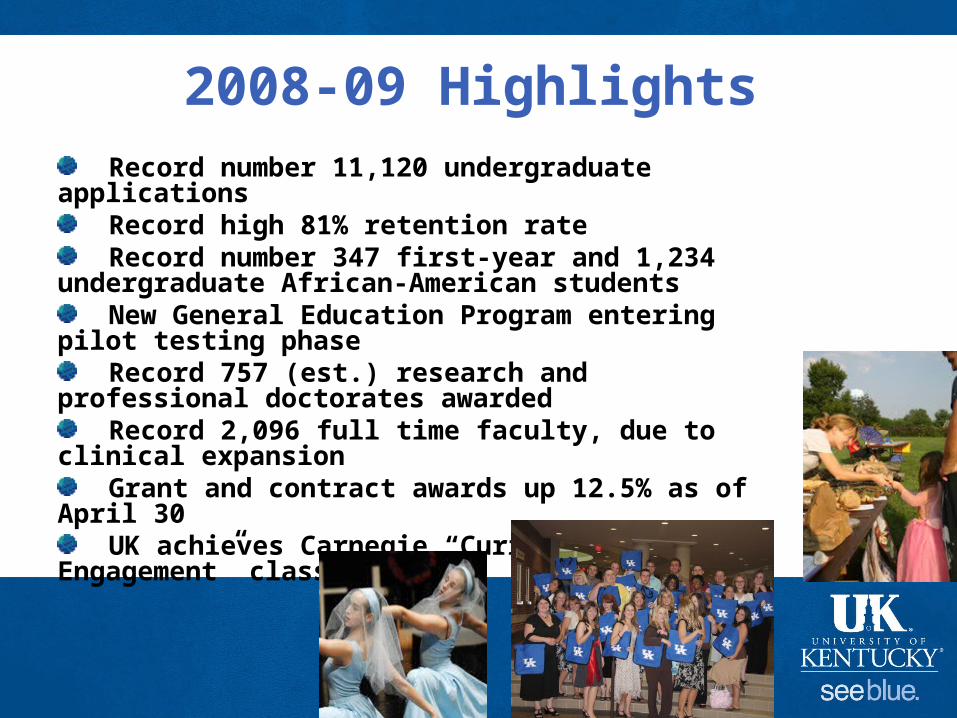
2008-09 Highlights Record number 11,120 undergraduate applications Record high 81% retention rate Record number 347 first-year and 1,234
undergraduate African-American students New General Education Program entering pilot
testing phase Record 757 (est.) research and professional
doctorates awarded Record 2,096 full time faculty, due to clinical
expansion Grant and contract awards up 12.5% as of April 30 UK achieves Carnegie “Curricular Engagement”
classification

Impact of Engagement ActivityMapped across the CommonwealthSee: http://uems1.uky.edu/Website/EMI2007/viewer.htm

Undergraduate EducationMeasures of Progress BASELINE Year 1 Year 2 Year 3 2009
Milestone
Progress*
ACT/SAT Middle 50% 21-27 21-27 22-27 Available fall 2009
22-28▲
High School GPA Middle 50% 3.2-3.9 3.2-3.9 3.2–3.9 Available fall 2009
3.3-3.9 Student to Faculty Ratio 17.6 to 1 17.9 to 1 17.4 to 1 17.8 to 1 17.2 to 1 Six-year Graduation Rate:
African American
All Students
46.2%
59.8%
45.0%
59.1%
50.3%
61.4%
47.6%
57.7%
47.5%
62.0%
Education Abroad Participants 450 (est.) 481 551 588 600
▲
*Legend Achieved▲ Progressing No Progress or Decline
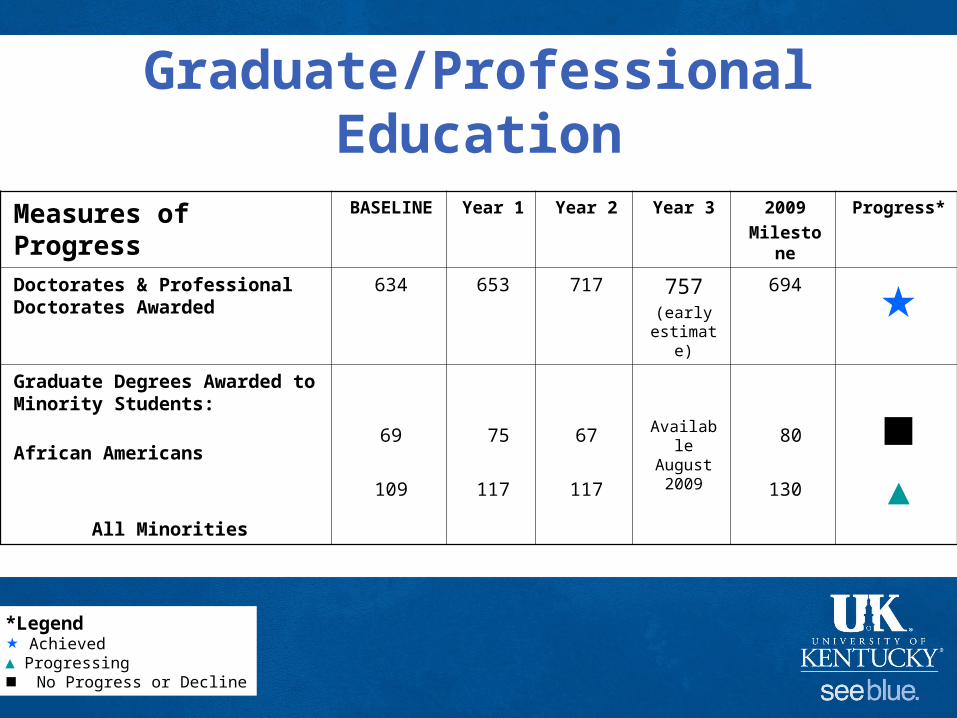
Graduate/Professional Education
Measures of Progress BASELINE Year 1 Year 2 Year 3 2009
Milestone
Progress*
Doctorates & Professional Doctorates Awarded
634 653 717 757(early
estimate)
694 Graduate Degrees Awarded to Minority Students:
African Americans
All Minorities
69
109
75
117
67
117
Available August 2009
80
130
▲
*Legend Achieved▲ Progressing No Progress or Decline
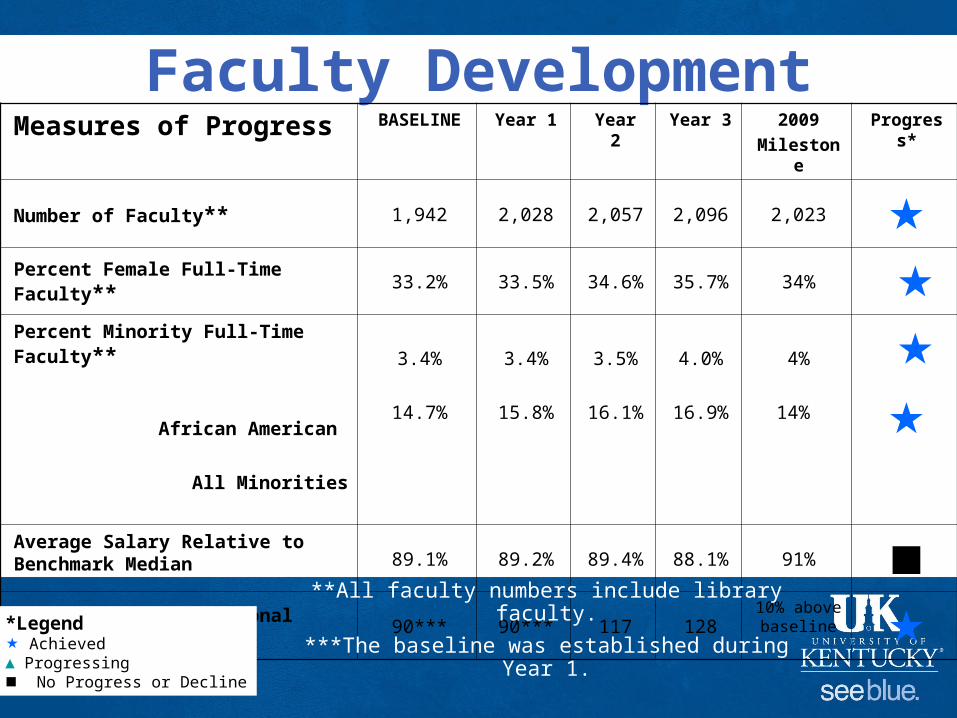
Faculty DevelopmentMeasures of Progress BASELINE Year 1 Year 2 Year 3 2009
Milestone
Progress*
Number of Faculty** 1,942 2,028 2,057 2,096 2,023 Percent Female Full-Time Faculty** 33.2% 33.5% 34.6% 35.7% 34% Percent Minority Full-Time Faculty**
African American
All Minorities
3.4%
14.7%
3.4%
15.8%
3.5%
16.1%
4.0%
16.9%
4%
14%
Average Salary Relative to Benchmark Median 89.1% 89.2% 89.4% 88.1% 91% National or International Awards 90*** 90*** 117 128
10% above baseline **All faculty numbers include library faculty.
***The baseline was established during Year 1.*Legend Achieved▲ Progressing No Progress or Decline
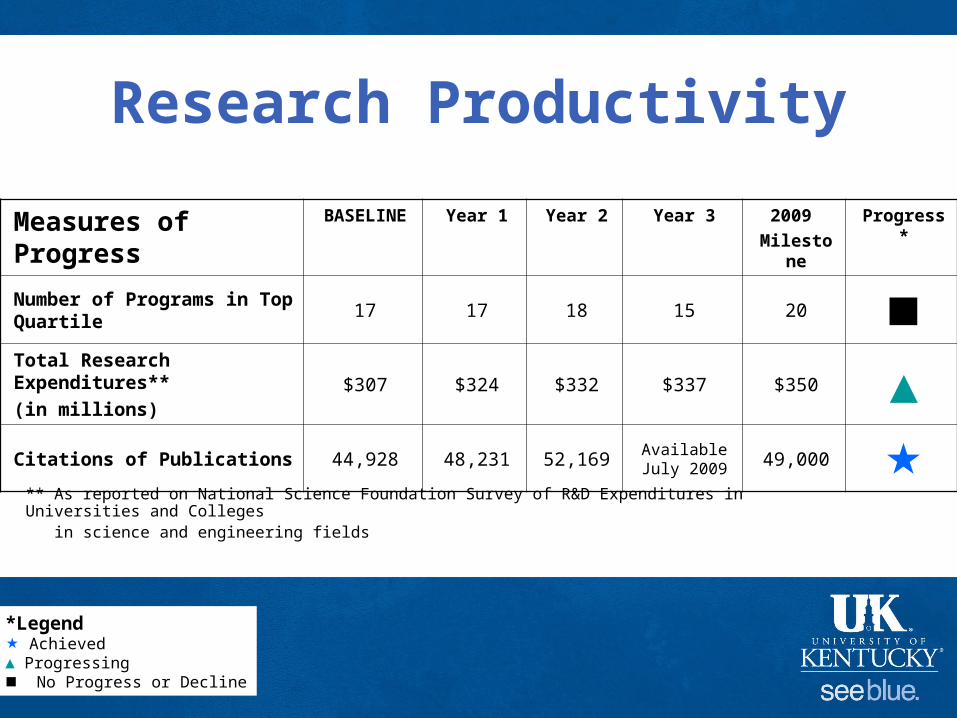
Research Productivity
Measures of Progress BASELINE Year 1 Year 2 Year 3 2009
Milestone
Progress*
Number of Programs in Top Quartile
17 17 18 15 20 Total Research Expenditures**
(in millions)$307 $324 $332 $337 $350 ▲
Citations of Publications 44,928 48,231 52,169Available July 2009 49,000
** As reported on National Science Foundation Survey of R&D Expenditures in Universities and Colleges in science and engineering fields
*Legend Achieved▲ Progressing No Progress or Decline
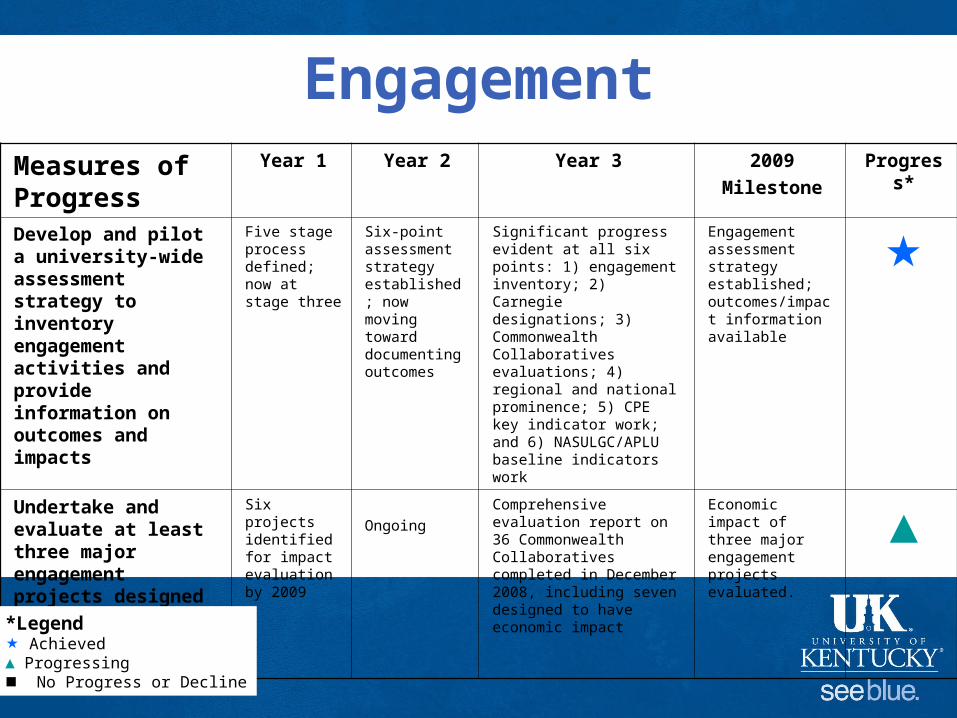
EngagementMeasures of Progress
Year 1 Year 2 Year 3 2009
Milestone
Progress*
Develop and pilot a university-wide assessment strategy to inventory engagement activities and provide information on outcomes and impacts
Five stage process defined; now at stage three
Six-point assessment strategy established; now moving toward documenting outcomes
Significant progress evident at all six points: 1) engagement inventory; 2) Carnegie designations; 3) Commonwealth Collaboratives evaluations; 4) regional and national prominence; 5) CPE key indicator work; and 6) NASULGC/APLU baseline indicators work
Engagement assessment strategy established; outcomes/impact information available
Undertake and evaluate at least three major engagement projects designed to have significant economic impact
Six projects identified for impact evaluation by 2009
Ongoing
Comprehensive evaluation report on 36 Commonwealth Collaboratives completed in December 2008, including seven designed to have economic impact
Economic impact of three major engagement projects evaluated.
▲
*Legend Achieved▲ Progressing No Progress or Decline

Staff DevelopmentMeasures of Progress
BASELINE Year 1 Year 2 Year 3
2009
Milestone Progress*
Complete compensation analysis and implement enhancement plan.
-- Compensation analysis completed
Staff salary adjustment plan implemented and partially completed
No new action taken due to fiscal constraints
Enhancement plan was implemented, but progress slowed due to fiscal constraints.
Percent Minority in Executive/Administrative/ Managerial positions:
African American
All Minorities
3.7%
5.3%
4.9%
6.8%
4.6%
6.7%
4.8%
7.2%
5%
6%
▲
*Legend Achieved▲ Progressing No Progress or Decline
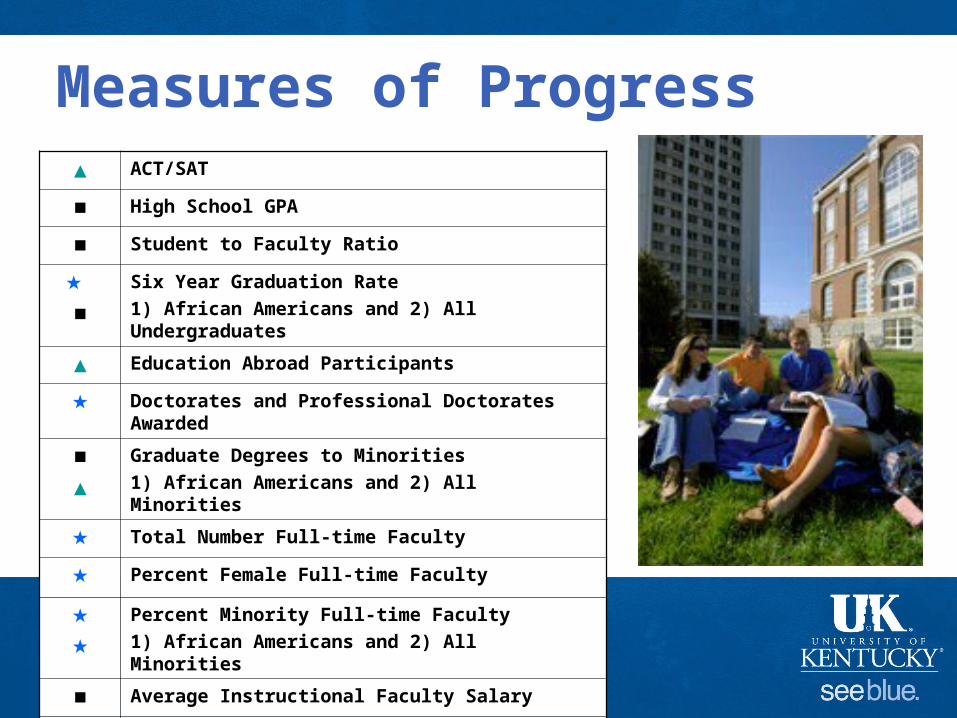
▲ ACT/SAT
■ High School GPA
■ Student to Faculty Ratio
■
Six Year Graduation Rate
1) African Americans and 2) All Undergraduates
▲ Education Abroad Participants
Doctorates and Professional Doctorates Awarded
■
▲
Graduate Degrees to Minorities
1) African Americans and 2) All Minorities
Total Number Full-time Faculty
Percent Female Full-time Faculty
Percent Minority Full-time Faculty
1) African Americans and 2) All Minorities
■ Average Instructional Faculty Salary
National or International Faculty Awards
Measures of Progress
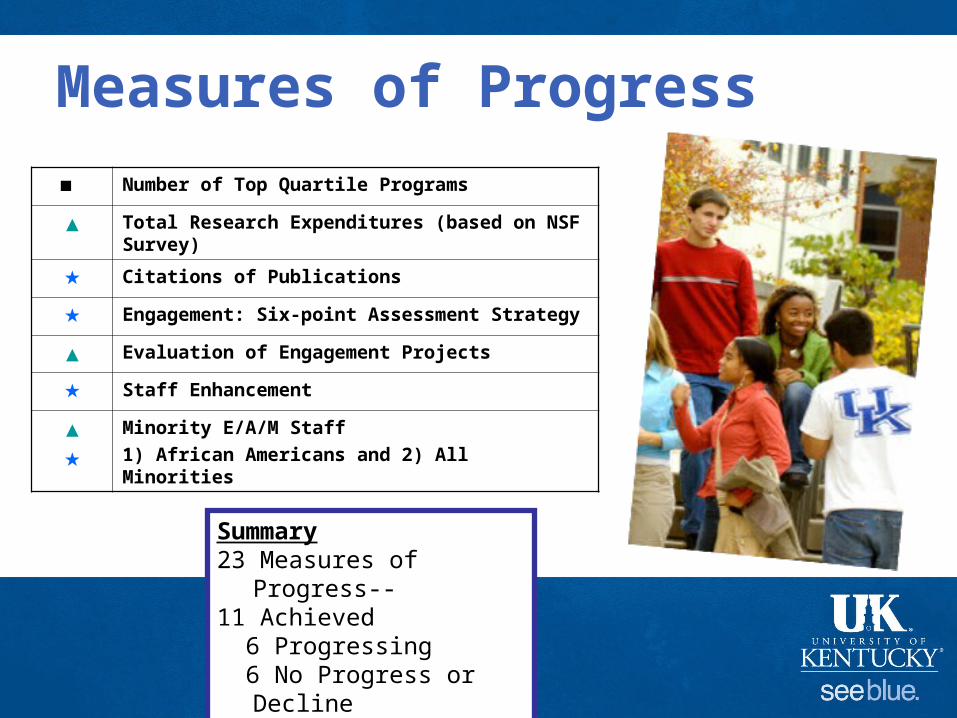
■ Number of Top Quartile Programs
▲ Total Research Expenditures (based on NSF Survey)
Citations of Publications
Engagement: Six-point Assessment Strategy
▲ Evaluation of Engagement Projects
Staff Enhancement
▲
Minority E/A/M Staff
1) African Americans and 2) All Minorities
Measures of Progress
Summary23 Measures of Progress--11 Achieved 6 Progressing 6 No Progress or Decline