2 shade coffee: update on a disappearing refuge for...
TRANSCRIPT

1
1
Shade coffee: update on a disappearing refuge for biodiversity 2
3
Shalene Jha1*, Christopher M. Bacon2, Stacy M. Philpott3, V. Ernesto Méndez 4, Peter 4
Läderach5, Robert A. Rice6 5
6
1Integrative Biology, 401 Biological Laboratories, University of Texas, Austin, TX, USA, 7
78712; Phone: 248-719-5766, Fax: 512-232-9529, Email: [email protected] 8
9
2Department of Environmental Studies and Sciences, Santa Clara University, 500 El Camino 10
Real, Santa Clara, California, USA, 95050-4901; Phone: Phone 408-551-3082; Email: 11
13
3Environmental Studies Department, University of California, Santa Cruz, 1156 High Street, 14
Santa Cruz, CA, USA, 95064; Phone: 831-459-1549; Email: [email protected] 15
16
4Agroecology and Rural Livelihoods Group (ARLG), Environmental Program and Plant and Soil 17
Science Dept., University of Vermont, The Bittersweet- 153 South Prospect St., Burlington, 18
Vermont, USA, 05401; Phone: 802-656-2539; Fax: 802-656-8015; Email: [email protected] 19
20
5International Center for Tropical Agriculture (CIAT), Residencial San Juan de Los Robles Casa 21
#303, Apartado Postal LM-172, Managua, Nicaragua; Phone: 505-2270-9965; Fax: 505-2270-22
9963; Email: [email protected] 23
24
6Smithsonian Migratory Bird Center, Smithsonian Institution, Washington, D.C., USA, 20008; 25
Phone: 202-633-4209; Fax: 202-673-0040; Email: [email protected] 26
27
28

2
In the past three decades, coffee cultivation has gained widespread attention for its critical role 29
in supporting local and global biodiversity. In this synthetic overview, we present newly 30
gathered data that summarize how global patterns in coffee distribution and shade vegetation 31
have changed and discuss implications for biodiversity, ecosystem services, and livelihoods. 32
While overall coffee area has decreased by 8% since 1990, coffee production and agricultural 33
intensification has increased in many places and shifted globally, with production expanding in 34
Asia while contracting in Africa. Ecosystem services such as pollination, pest-control, climate 35
regulation, and nutrient sequestration are generally higher in shaded coffee farms, yet many 36
coffee growing regions are removing shade trees from their management. While it is clear that 37
there are ecological and socio-economic benefits associated with shaded coffee, we expose the 38
many challenges and future research priorities needed to link sustainable coffee management 39
with sustainable livelihoods. 40
41
Keywords: agriculture, agroforestry, corridor, ecosystem services, tropical ecology 42
43
44
Across the world, more than 400 billion cups of coffee are consumed per year (Illy 2002). Coffee 45
is among the most valuable legally traded commodities from the developing world (FAO 2010), 46
engaging between 14 and 25 million families in production, and millions more in the processing, 47
roasting, and selling of coffee (Donald 2004). In the last two decades, the value of shade-grown 48
(hereafter ‘shade’) coffee farms for biodiversity conservation and ecosystem service provision 49
has gained widespread attention from the public and scientific communities (De Beenhouwera et 50
al. 2013, Jha et al. 2012, Perfecto et al. 1996, Tscharntke et al. 2011). In this short time span, 51

3
global coffee distribution patterns and local coffee management practices have exhibited 52
dramatic changes, with major implications for ecology and livelihoods. In this paper, we 53
investigate trends in global coffee distributions and cultivation practices, and we review the 54
potential impacts of these geographic and management changes on biodiversity, ecosystem 55
services, resilience to climate change, and sustainable livelihoods. 56
57
1. Shifting global production patterns and management practices 58
59
a. Past and current distribution of coffee 60
The two coffee species of commercial value, Coffea arabica and Coffea canephora (“robusta”), 61
both originate from Africa, with the former having generally preferred taste qualities and the 62
latter exhibiting higher yield and pest-resistance (ITC 2011, ICO 2013). C. arabica dominates 63
global coffee landscapes, accounting for 60% of all volume (ITC 2011). While coffee’s center of 64
origin lies in Ethiopia, major global dispersal of the bean occurred when Arab and European 65
traders introduced the beverage to Western Europe in the early 1500s (Ukers 1922). By the latter 66
half of the 1800s, coffee plantations of both C. arabica and C. canephora flourished throughout 67
the American tropics, and by the 1970s its cultivation dominated more than 8.8 million ha of 68
tropical landscapes. Between 1970 and 1990, global coffee area and average yields increased by 69
25% (8.8 to 11.1 million ha, and 433 to 543 kg/ha, respectively), and global production increased 70
by 58% (FAO 2010). Interestingly, although global area decreased to 10.2 million ha between 71
1990 and 2010 (the year with most recent comprehensive data), production still climbed 36%, 72
which provides evidence of overall intensification in several key countries (e.g. Brazil and 73
Colombia), coffee abandonment in others (e.g. Burundi and Kenya), as well as rapid expansion 74

4
of high-yielding coffee in new countries (e.g. Vietnam and Indonesia)(FAO 2010). Brazil, for 75
instance, saw a 112% jump in production with only a 12% increase in coffee area between 1996 76
and 2010, growth spurred by intensification that resultued in an 89% yield increase over that 77
period (FAO 2010), and recognition from coffee experts that production there has been highly 78
industrialized (Croce 2013, Izada 2013). Since the mid-1980’s, exports of “robusta” coffee have 79
increased by 92%, led by a number of Asian countries, with Vietnam being the prime example, 80
exhibiting hand-in-hand increases in both area and intensification (Guingato et al. 2008, ITC 81
2011). Robusta yields there soared from a historical average of 450 kg/ha prior to the 1950’s to 82
1558 kg/ha by 2004 (D’haeze et al. 2005), more than double the global yield average at the time, 83
revealing that a species shift alone does not explain yield increases. Given that coffee area 84
decreased globally by 9% between 1990 and 2010, whereas world production increased by 36%, 85
we posit that intensification is one of the major drivers of shifting coffee cultivation patterns. 86
A closer look reveals that the shift in production between 1990 and 2010 was regional, as 87
45% of all nations exhibiting decreases hailed from Africa, while Asian countries accounted for 88
35% of those with increased production (Fig. 1). When the first comprehensive studies of coffee 89
and biodiversity emerged in 1996, the top three producing countries were Brazil, Colombia, and 90
Indonesia. Currently, Brazil, Vietnam, and Indonesia top the list, accounting for 57% of the 8.2 91
million metric tons in 2010. In Vietnam alone, cultivated area increased by 731%, yields by 92
45%, and total production by 1102%, between 1990 and 2010 (Fig. 1). In contrast, the past 20 93
years reveal coffee area declines exceeding 20% in Ecuador, Colombia, Côte d’Ivoire, 94
Mozambique, Madagascar, Tanzania, and Rwanda (FAO 2010). 95
The contrasting and heterogeneous changes in global coffee cultivation result from 96
multiple factors, including region-specific economic development patterns, political conflict, 97

5
cultural practices, land values, wages, and labor. For example, deforestation accompanied 98
increases in coffee area in Vietnam, Indonesia, Nepal, and Panama (D’haeze et al. 2005, O’Brien 99
and Kinnaird 2003, FAO 2010). In contrast, in places where coffee area has declined, such as 100
Costa Rica and Ecuador, the expansion of high-yield agriculture has caused a decrease in coffee 101
prices, resulting in the abandonment of marginal agricultural lands (Aide and Grau 2004, FAO 102
2010), in combination with increased land prices due to urbanizaion. The result is an increase in 103
global production despite decreases in overall coffee area (Fig. 1). Higher land values due to ex-104
urbanization often displace coffee cultivation in places like Panama’s Boquete and Chiriquí 105
regions, Costa Rica, and Guatemala, areas now popular as retirement destinations (Zeltzer 2008). 106
In a number of countries, waves of political and social instability have reduced investment in 107
coffee cultivation (e.g., Rwanda, Nicaragua pre-1995, Colombia), only to have sustained global 108
prices post-2005 spur expansion in other countries (Rueda and Lambin 2013). In other regions, 109
the draw of better urban wages (e.g., Costa Rica) or displacement by other cash crops like cacao 110
(e.g., Côte d’Ivoire) has reduced the area of coffee production. 111
Despite variation in global coffee production, the majority of coffee is still produced by 112
smallholders managing fewer than 10 ha of coffee (reviewed in Jha et al. 2012), as documented 113
in Asia and Africa (e.g., Jena et al. 2012, Neilson 2008, respectively). Likewise, in Central 114
America, smallholders represent 85% of coffee producers but control only 18% of coffee 115
production lands (CEPAL 2002). In some coffee producing countries, such as Rwanda, coffee 116
farm sizes are so small that the majority of farms are measured by number of coffee trees instead 117
of hectares (e.g., 300 bushes) compared to many Mesoamerican smallholder farms, where stand 118
densities as high as 6700 coffee bushes per ha can be found (Méndez et al. 2007). These patterns 119
in farm size tend to shift depending on coffee prices and government incentives, as evidenced in 120

6
Latin America, where a decrease in the number of large estates and an increase in the number of 121
smallholder and micro-producers occurred directly after the 1999 coffee crisis, when coffee 122
prices dropped to century lows (Topik et al. 2010). In the Costa Rican coffee district of Agua 123
Buena, the proportion of farmland dedicated to coffee production diminished from 52% to 24% 124
between the years 2000 and 2009, while the proportion of pasture land increased from 31% to 125
50%, largely due to basement-level international coffee prices (Babbin 2010). This example 126
highlights the need for locally and regionally specific research into the social-ecological causes 127
and consequences of changing coffee production patterns. 128
129
130
2. Vegetation management 131
In addition to global and regional shifts in coffee cultivation, within-farm vegetation 132
management has changed dramatically across centuries of coffee production. Farm-level coffee 133
management involves distinctions in elevation, sun exposure, soil conditions, density of bushes, 134
presence of additional wild or cultivated plants, age of bushes and pruning style, and 135
agrochemical use, among other factors (Moguel and Toledo 1999, Tscharntke et al. 2011). The 136
most traditional coffee growing practices, as seen in ‘rustic’ coffee, involves growing coffee 137
under a diverse canopy of native forest trees in high to moderate shade. As vegetation 138
management is ‘intensified’, plantations have fewer shade trees, fewer shade tree species, lower 139
canopy cover, and fewer epiphytes (Moguel and Toledo 1999). Shade management 140
intensification is often also accompanied by increased use of synthetic agrochemicals (e.g. 141
pesticides, fungicides, herbicides, and fertilizers). Finally, at the most ‘intensified’ end of the 142
vegetation management spectrum, coffee is grown in full sun. 143

7
Interestingly, examining coffee vegetation management across a number of countries 144
reveals that shade cover management is heterogeneous, and the changes in its global coverage 145
are region-specific. In Latin America, between 1970 and 1990, nearly 50% of all shade coffee 146
farms were converted to low shade systems (Perfecto et al. 1996). Changes varied by country, 147
ranging from 15% of farms in Mexico to 60% in Colombia (Perfecto et al. 1996). Since the 148
1990s, regions with intensively managed coffee, such as Brazil and Colombia, still remain 149
largely devoid of diverse shade systems, and have either maintained or increased areas of sun-150
coffee (Guhl 2004, Croce 2013). From the 1990s to 2010, most Latin American countries 151
decreased the percent of total coffee production area dedicated to traditional diversified shade 152
coffee production, but at a slower rate than from 1970 to the 1990s. Based on the ten countries 153
for which we have data from both the 1990s and the 2010s, we find that half of these countries 154
experienced a decrease in the percent of all coffee under traditional shade management 155
(Colombia, Costa Rica, El Salvador, Guatemala, and Nicaragua). However, because coffee 156
production areas expanded in the many of the remaining countries and several of these countries 157
reported higher percentages of shade production (e.g. Honduras, Panama), our calculations 158
suggest that there was an overall 11% increase in the area of land dedicated to diverse shade 159
coffee production. 160
However, examining at a more global scale, if we include all 19 countries for which we 161
have 2010 data, approximately 41% of coffee area is currently managed with no shade, 35% with 162
sparse shade, and only 24% with traditional diverse shade (supplemental table S1, figure 2). This 163
indicates that global shade coffee cultivation is lower than our estimates for 1996 (about 20% 164
lower), when approximately 43% of all coffee areas surveyed were cultivated in traditional 165
diverse shade. For example, between 2000 and 2009, coffee-growing regions in Costa Rica 166

8
experienced a 50% loss of shaded coffee (and shade trees) in the process of conversion to sun-167
coffee, pasture, or other crops (Bosselmann 2012). The sun-coffee management style has also 168
dominated many new coffee growing regions, exemplified in Vietnam’s dramatic expansion of 169
coffee, and also evident in Thailand and Indonesia (Fig 2). In contrast, only a few countries, 170
(Colombia, Haiti, India), have continued managing diverse shade since the 1990s in all or parts 171
of their coffee regions (Fig 2). 172
Coffee vegetation management patterns are nuanced and often depend on farm size, 173
available alternatives, national and regional politics, risk aversion strategies and development 174
funding. For example, 81% of the coffee in Nicaragua and El Salvador grew under a shade 175
canopy in 1996, and while recent surveys document declines in shade tree diversity since then, 176
these declines mostly occurred on larger farms, with many smallholder cooperatives preserving 177
high levels of biodiversity, including more than 100 species of shade trees found on less than 30 178
farms (Méndez et al. 2010a). Similarly, in the Kodagu coffee-growing region of India, nearly 179
100 tree species can still be found in smallholder coffee farms (Bhagwat et al. 2005). 180
While it is clear that coffee management styles remain unevenly distributed both within 181
and among countries, the causes for this high level of variation have never been systematically 182
reviewed. We document several broad trends and posit that coffee vegetation management style 183
is influenced primarily by five main factors: 1) cultivar origin, 2) perceived resistance to disease, 184
primarily the coffee leaf rust, 3) perceived increases in yield, 4) socio-economic decisions related 185
to group membership and livelihoods, and 5) shifting economic incentives linked to global coffee 186
markets and value chains. Here, we present a comprehensive review on these five major factors 187
and document the evidence supporting and contradicting each. 188
189

9
a. Cultivar origin 190
The two dominant coffee species cultivated globally are Coffea arabica (Arabica) and C. 191
canephora (Robusta), which have distinct origins and cultivation histories and thus differ in 192
flavor, ideal growing conditions, resistance to pests/pathogens, and yield, among other traits. 193
Most notably, while Arabica and its cultivars grow best at mid-high elevation (600-2000 meters), 194
exhibiting maximum photosynthetic rate at moderate temperatures and higher shade levels, 195
Robusta and its cultivars are tolerant of lower-elevation (0-800 m) and full sun exposure, 196
growing best at temperatures between 24 and 30° C (Wilson 1999). The distinctions between 197
these species, their tolerance for temperature shifts, the development of disease resistant 198
cultivars, along with a number of socioeconomic factors described in this review, underlie much 199
of the variations in current coffee vegetation management practices seen across the globe. 200
201
b. Coffee diseases and yield 202
Fungi cause most major coffee diseases (e.g., coffee leaf rust, brown eyespot, and coffee berry 203
disease), primarily affecting Coffea arabica (Staver et al. 2001), while C. canephora varieties 204
remain more resistant (FAO 2012). Coffee leaf rust (Hemileia vastatrix) is the main disease of C. 205
arabica in Latin America (Avelino et al. 2007), with the latest (2012-2013) outbreak lowering 206
harvests by 10-70% in several Latin American countries, including Peru (JNC 2013), Mexico 207
(GAIN Report, 2013), Colombia, Costa Rica, Nicaragua, Honduras, Panama, El Salvador, and 208
Guatemala (Virginio 2013). Efforts to control coffee leaf rust in the 1970s and 1980s led to much 209
of the ‘modernization’ of coffee cultivation practices in Guatemala, Honduras, Panama and other 210
countries, and include practices such as the use of supposedly disease-resistant high-yielding 211

10
varieties, the reduction of shade, and the increased planting density of coffee bushes (Rice and 212
McLean 1999). 213
Although these measures were implemented to reduce coffee leaf disease, research has 214
shown that disease dynamics depend on the specific disease, local fertilization conditions, 215
humidity, elevation, temperature, and regional land management. Vegetation complexity may 216
increase coffee leaf spot (Mycena citricolor)(Avelino et al. 2007), brown eyespot (Cercospora 217
coffeicola), and coffee rust incidence, but with the latter two species, the specific cause of the 218
increase is linked to humidity, not shade, as rust incidence increases with humidity independent 219
of shade levels (Staver et al. 2001). Other studies document no correlation between shade and 220
leaf rust on Arabica varieties (e.g., Soto-Pinto et al. 2002, Lopez Bravo et al. 2012). In fact, 221
moderate shade (35-65%) can actually reduce brown eyespot (Staver et al. 2001), weeds, and the 222
citrus mealy bug, and can increase the effectiveness of parasites of other pests (Perfecto et al. 223
1996, Staver et al. 2001). Additionally, moderate shade levels can hinder fungal diseases by 224
creating windbreaks and slowing the horizontal spread of coffee leaf rust spores (e.g., Soto-Pinto 225
et al. 2002). Thus, coffee disease cannot be reduced by shade management alone, but in 226
combination with modified humidity, predator management, and local and regional landscape 227
management. 228
229
c. Shade, yield, and quality 230
The interactions between shade, yield, and ‘cup’ quality are very important to farmers, the coffee 231
industry, and consumers. Yield-focused government incentives such as Coffee Research 232
Institutes, created in the 1970s and 1980s (e.g., PROCAFE in El Salvador, ANACAFE in 233
Guatemala, ICAFE in Costa Rica, and IHCAFE in Honduras) promoted the reduction or removal 234

11
of shade cover (Staver et al. 2001), created extension programs to support technified practices, 235
and financed programs that often included free or subsidized agrochemicals (Rice and McLean 236
1999). While many farmers cite increases in coffee yields as the main reason for removing shade 237
trees and native vegetation, the ecological evidence supporting decreased shade and increased 238
coffee yield is far from clear. Studies that have categorically compared yield in low vs. high 239
shade treatments have found lower yields with shade, higher yields with shade, and no 240
difference; however, studies that examine a continuous gradient of shade predominantly reveal 241
that intermediate shade levels (~35-50%) produce the highest coffee yield, likely due to the 242
balance maintained between optimal temperatures in shaded environments and optimal 243
photosynthetic rates in unshaded environments (Soto Pinto et al. 2000 and references therein). 244
While it is difficult to compare findings across studies due to geographical differences, it is clear 245
that yield is not solely or linearly linked to shade tree density or diversity. 246
Recent work also shows that cup quality is the result of a variety of interacting factors 247
that include environmental conditions, field management, adequate processing and drying, as 248
well as roasting. Surprisingly, breeding efforts for coffee have largely ignored quality and 249
focused mostly on increasing yields and disease resistance (Montagnon et al. 2012). Research 250
related to shade effects on ‘Catimor’ varieties points to shade’s positive effect on coffee bean 251
and cup quality in lower elevations (≤ 500 m) and positive to negative effects on cup quality at 252
higher elevations (Bosselmann et al. 2009). Shade appears to impart its greatest benefit in coffee 253
bean flavor for plants growing in suboptimal and heat-stressed growing regions, where shade can 254
bring environmental conditions closer to ideal levels (Muschler 2001). This suggests that shade 255
may be particularly important for maintaining coffee quality in the context of climate change, 256
especially in regions with expected temperature increases in future climate scenarios. 257

12
258
d. livelihood, cooperatives, and shade coffee management 259
Farm size, cultural history, and relationship with cooperatives can influence farmer management 260
decisions and shade vegetation (Moguel and Toledo 1999). In Veracruz, Mexico, small-scale 261
producers (1-5 ha) used lower levels of agrochemicals per farm than larger scale farmers (>45 262
ha), resulting in fewer soil and water contamination problems. However, many of these small-263
scale farmers are slowly adopting several of the intensified management practices utilized by 264
larger growers (Guadarrama-Zugasti 2008). In El Salvador and Nicaragua, small (1-10 ha), 265
individually-managed farms contained higher levels of shade tree diversity compared to larger 266
(>100 ha) collectively managed holdings (Méndez et al. 2007); furthermore, tree diversification 267
levels were highest for cooperatives that clearly defined who was going to benefit from shade 268
tree products (Méndez et al. 2009). In both of these countries, individually managed farms 269
adopted vegetation diversification in order to generate a higher variety of tree products and on-270
farm benefits (Méndez et al. 2010a). These farmers managed their coffee plantations both for 271
household consumption products, as well as income from coffee. In contrast, collectively 272
managed farms focus almost entirely on producing coffee for income, due in part to the 273
challenge of distributing both the work and the benefits to obtain more on-farm products. The 274
only non-coffee product on which collective farm members are dependent and actively collect is 275
firewood; collective cooperatives have an open policy for its members to access firewood for 276
household use (Méndez et al. 2007, Méndez et al. 2009). Thus, well organized cooperatives, if 277
present, can be essential for coordinating collective action that can help smallholders manage the 278
distribution of benefits and retain land titles (Raynolds et al. 2007), potentially creating key 279
institutional environments for sustainable land stewardship. 280

13
In addition to land titles, a number of assets are important for optimal livelihood: 281
participation in a cooperative or other local association, and access to land, water, loans, houses, 282
and equipment (e.g., Bacon et al. 2008). Research shows that individuals working at the 283
producing end of the coffee value chain (i.e. the farmers and countries) continue to receive a very 284
small fraction of the profits and coffee pickers and laborers (often migratory) are the most 285
marginalized actors within the coffee value chain (Oxfam 2002), since they are vulnerable to 286
shifts in production, climate, and market demands (Bacon et al. 2008, CEPAL 2002) and are paid 287
by the pound or volume of coffee cherries harvested, making as little as $2 to $10 per day in 288
many parts of the world (Oxfam 2002). For example, between 2000 and 2001, Ugandan farmers 289
received $0.14 for a kilo of unprocessed coffee that at retail would fetch more than $26.00 as 290
instant coffee in the United Kingdom (Oxfam 2002). Accounting for weight loss during the 291
processing and roasting of the coffee, this represents a 7000% price increase in the journey from 292
farm to shopping cart (Oxfam 2002). Other cases are less lopsided; Colombian farmers received 293
23-25% of the value added for coffee sold into specialty and mainstream markets in 2010 (Rueda 294
and Lambin 2013). However, while specialty coffees often result in higher prices at the farm 295
gate, questions remain about the extent to which the benefits of higher retail prices translate into 296
higher revenues for farmers and communities (Rueda and Lambin 2013). Broad-based job losses 297
in coffee farming have decreased since 2005, but seasonal hunger, marginalization, and 298
vulnerabilities persist (Bacon et al. 2008, Méndez et al. 2010b). 299
300
e. Shifting economic incentives linked to global coffee markets and value chains 301
One avenue to address declines in coffee profits and sustainable management is through the 302
specialty coffee market, which currently claims 37% of coffee volume but nearly 50% of the 303
14
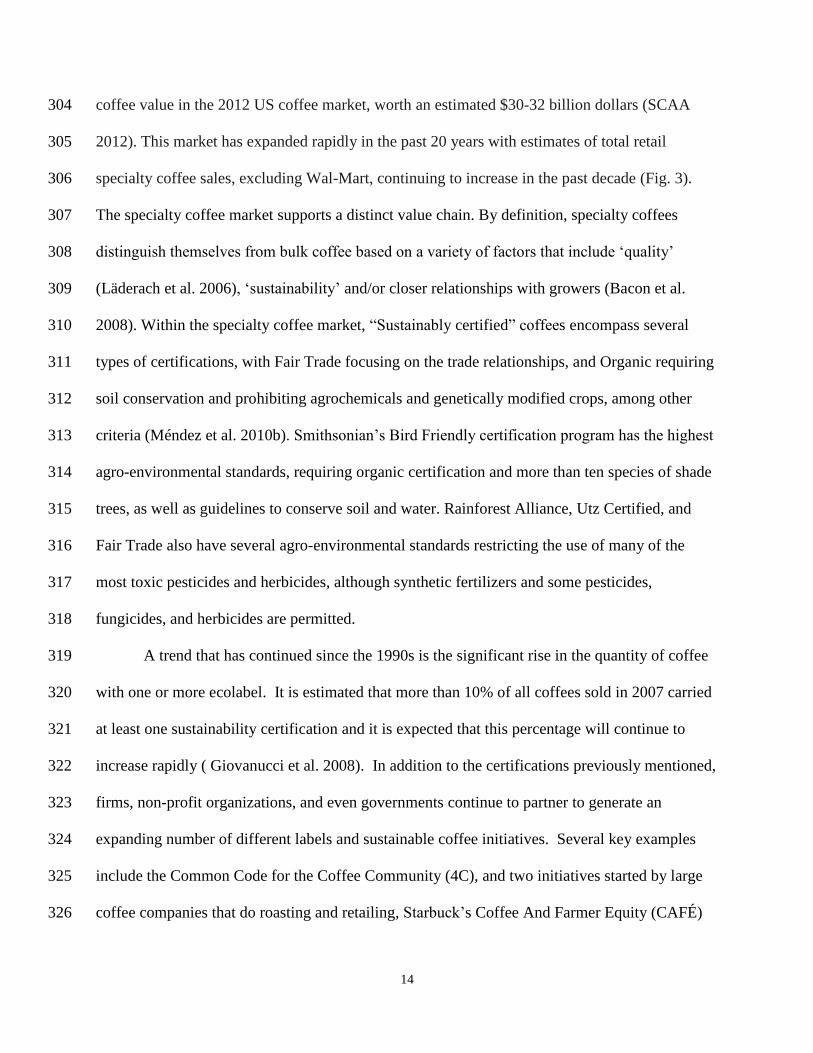
coffee value in the 2012 US coffee market, worth an estimated $30-32 billion dollars (SCAA 304
2012). This market has expanded rapidly in the past 20 years with estimates of total retail 305
specialty coffee sales, excluding Wal-Mart, continuing to increase in the past decade (Fig. 3). 306
The specialty coffee market supports a distinct value chain. By definition, specialty coffees 307
distinguish themselves from bulk coffee based on a variety of factors that include ‘quality’ 308
(Läderach et al. 2006), ‘sustainability’ and/or closer relationships with growers (Bacon et al. 309
2008). Within the specialty coffee market, “Sustainably certified” coffees encompass several 310
types of certifications, with Fair Trade focusing on the trade relationships, and Organic requiring 311
soil conservation and prohibiting agrochemicals and genetically modified crops, among other 312
criteria (Méndez et al. 2010b). Smithsonian’s Bird Friendly certification program has the highest 313
agro-environmental standards, requiring organic certification and more than ten species of shade 314
trees, as well as guidelines to conserve soil and water. Rainforest Alliance, Utz Certified, and 315
Fair Trade also have several agro-environmental standards restricting the use of many of the 316
most toxic pesticides and herbicides, although synthetic fertilizers and some pesticides, 317
fungicides, and herbicides are permitted. 318
A trend that has continued since the 1990s is the significant rise in the quantity of coffee 319
with one or more ecolabel. It is estimated that more than 10% of all coffees sold in 2007 carried 320
at least one sustainability certification and it is expected that this percentage will continue to 321
increase rapidly ( Giovanucci et al. 2008). In addition to the certifications previously mentioned, 322
firms, non-profit organizations, and even governments continue to partner to generate an 323
expanding number of different labels and sustainable coffee initiatives. Several key examples 324
include the Common Code for the Coffee Community (4C), and two initiatives started by large 325
coffee companies that do roasting and retailing, Starbuck’s Coffee And Farmer Equity (CAFÉ) 326

15
practices and Nestle’s Nespresso AAAA Sustainable Quality Program. These latter two 327
programs function by setting social and environmental criteria for certification and have grown 328
rapidly in the past decade, with more than 160 million pounds of coffee certified in 2006 alone 329
(Giovanucci et al. 2008). 330
A closer look at coffee profits and farmer livelihoods reveals that Fair Trade and Organic 331
certifications are able to provide a number of benefits to smallholder farmers, although 332
livelihood challenges persist (Arnould et al. 2009, Méndez et al. 2010b). For example, farmers 333
that participate in cooperatives connected to Fair Trade often have more access to credit and 334
technical support (Méndez et al. 2010b), and often receive higher prices for their coffee, 335
buffering exposure to falling coffee commodity prices and diminishing the negative 336
consequences of unexpected challenges, such as food shortages, hurricanes, and earthquakes 337
(e.g, Raynolds et al. 2007). However, Fair Trade does not necessarily improve access to food 338
through purchasing or production (Arnould et al. 2009, Méndez et al. 2010b). Furthermore, 339
although certifications are often associated with higher coffee prices, the small volumes sold and 340
additional certification costs often counterbalance added income at the household level, 341
especially as the real price premiums delivered to farmers have declined during the past decades 342
(Bacon 2010). This suggests that major changes are required to provide a strong incentive for 343
sustainable coffee management via the certification processes. 344
345
3. Biodiversity, ecosystem services, connectivity, and resilience to climate change 346
347
a. Biodiversity and ecosystem services 348
Shaded coffee plantations are increasingly valued for their contributions to biodiversity 349

16
conservation and the provisioning of ecosystem services (Beenhouwer et al. 2013, Tscharntke et 350
al. 2011). Since the 1990s, shade coffee has been noted for its contributions to conserving plant, 351
arthropod, bird, bat, and non-volant mammal diversity (Perfecto et al. 1996, Donald 2004). More 352
recent studies have documented patterns of bird, ant, and tree biodiversity decline specifically in 353
response to decreasing vegetation cover and increasing management intensity (Philpott et al. 354
2008a). Biodiversity declines within coffee systems are of particular concern given that 355
ecosystem services (ES) such as pollination, pest control, erosion control, watershed 356
management, and carbon sequestration, are worth billions annually and are largely a function of 357
biodiversity levels (Wardle et al. 2011). Thus, as a whole, ecosystem services tend to decline as 358
forests are converted to shade coffee, and shade coffee is converted to low shade coffee systems 359
(Beenhouwer et al. 2013). Based on our review, more than seventy studies have directly 360
measured unique ecosystems services across varying vegetation management styles, including 361
pollination (7 studies), pest-control (42 studies), climate regulation (13 studies), and nutrient 362
cycling (10 studies). While distinct methodologies and methods of measuring response variables 363
(e.g. predator species richness vs. predator abundance) complicate meta-analyses for each unique 364
ecosystem service, we found positive effects of shade on ecosystem services in approximately 365
58% of pollination studies, 60% of the pest control studies, 100% of the climate regulation 366
studies, and 93% of the nutrient cycling studies (Table 1, Literature Search details in Table S2). 367
Specifically, vegetation complexity at the canopy level can lead to lower weed densities 368
(Beer et al. 1998) and because many shade trees fix nitrogen (e.g. Inga spp.), shade trees can 369
increase the nutrient content of soils (Beer et al. 1998). Scant shade coffee systems (1-3 tree 370
species) sequester an additional 53-55 tons of carbon per hectare in above ground biomass 371
compared to unshaded coffee monocultures (Palm et al. 2005). In Mexico, Soto-Pinto et al. 372

17
(2010) found that Inga-shaded organic coffee maintained aboveground carbon (56.9 tons C per 373
hectare) and in the soil (166 tons C per hectare) to an equal extent as nearby forests, and 374
traditional polyculture coffee maintained more carbon than all other land-use types examined 375
(Soto-Pinto et al. 2010). If we consider that scant shade systems sequester an additional 53 tons 376
of carbon per hectare (Palm et al. 2005), then the conversion of even 10% of all sun coffee 377
systems (currently covering 3.1 million ha) to even scant shade cover, would result in 1.6 billion 378
additional tons of aboveground sequestered carbon. 379
Many organisms aid in pest control in shaded farms. Ants and spiders, for example, 380
reduce damage caused by the coffee berry borer, Hypothenemus hampei Ferrari (Perfecto and 381
Vandermeer 2006) and the coffee leaf miner, Leucoptera coffeella Guer. (De la Mora et al. 382
2008). Birds and bats predate on arthropods in shaded coffee plantations. Predation services by 383
birds (Kellermann et al. 2008, Karp et al. 2013) and bats (Williams-Guillen et al. 2008) have 384
been documented to improve coffee yields by 1-14%, amounting to values that exceeded $44–385
$105/ha/year (Kellermann et al. 2008) and $75-$310/ha/year for farmers (Karp et al. 2013). 386
Pollinators are also critical for coffee production because both commercial species of coffee (C. 387
arabica and C. canephora) benefit from pollinator visits and pollinator diversity (Klein et al. 388
2003). In Costa Rica, increased fruit set due to enhanced insect pollination at a per-bush level 389
improved coffee yields by more than 20% in one 1100 ha farm, worth an estimated $62,000 390
(Ricketts et al. 2004). Again, if 10% of all sun coffee systems were converted to scant or diverse 391
shade, and if pest control services in these shaded systems continued to be valued at $75/ha 392
(Karp et al. 2013), and pollination services at $56/ha (Ricketts et al. 2004), the additional pest-393
control and pollination contributions provided could exceed $2.3 and $1.7 billion, respectively. 394
Overall, these studies highlight the great potential for increased carbon sequestration, pest-395

18
control, and pollination services within shaded coffee systems. 396
397
b. Connectivity & resilience to climate change 398
Shade coffee systems also help to connect forest fragments within the landscape mosaic. For 399
example, migratory birds often use shade coffee farms as a corridor when moving between 400
temperate and tropical regions (e.g., Greenberg et al. 1997). Pollinators such as butterflies 401
(Muriel and Kattan 2009) and native bees (Jha and Dick 2010) can migrate between forest 402
fragments and shade coffee farms. As a result, native trees support pollinators that are critical 403
during the coffee bloom and are able to maintain reproduction and gene flow processes across 404
shade coffee systems (Jha and Dick 2010). Unlike sun coffee systems, which do not provide 405
pollinators with resources throughout the year (Jha and Vandermeer 2010) and are less 406
permeable to dispersing organisms (e.g., Muriel and Kattan 2009), shade coffee farms can 407
promote pollinator populations and serve as corridors for organisms moving regionally between 408
forest fragments. 409
The importance of connectivity between coffee and protected areas is tremendous given 410
the overlap and proximity of biodiversity hotspots and coffee growing regions (Hardner and Rice 411
2002) and the importance of shaded coffee in the face of global climate change. Coffee farms are 412
often located adjacent to protected areas, and in many countries, including El Salvador, 413
Guatemala, and Costa Rica, more than 30% of area surrounding coffee regions (50 km radius) 414
fall within protected areas (Jha et al. 2012). Because organisms like birds, bats, and bees in 415
tropical habitats often disperse across short distances, the proximity of coffee farms to protected 416
areas magnifies the role of coffee in serving as an important biological corridor. 417
Shaded systems have also been identified as part of the remedy for confronting harsh new 418

19
environments in coffee regions due to climate change (DaMatta and Ramalho 2006). 419
Climatological models predict that the Caribbean and Central America will experience general 420
drying as well as stronger later-season hurricanes (Neelin et al. 2006). Hurricanes can result in 421
major economic losses to coffee farmers but farms with more complex vegetation (i.e. greater 422
tree density and tree species richness) experience significantly fewer post-hurricane landslides 423
(Philpott et al. 2008b). Coffee farmers, realizing enhanced risk in less shaded fields, have 424
engaged in post-hurricane mitigation focused on increasing the planting of more shade trees 425
within their coffee fields (Cruz-Bello et al. 2011). Shaded and diversified coffee farms also 426
provide greater climate regulating services, with potential impacts on coffee berry development 427
and overall yield (Lin et al. 2008)(Table 1). Coffee depends on seasonal rainfall (or irrigation) 428
for flowering and leaf photosynthesis, thus coffee growth rates and yields are highest at specific 429
precipitation and temperature ranges (Lin et al. 2008, and references therein). We spatially 430
quantified the change in coffee suitability in Mesoamerica using the same methodology as 431
described in Läderach et al (2010a) for Nicaragua and Schroth et al (2009) for Chiapas in 432
Mexico. We used (i) WorldClim (http://www.worldclim.org) as the current climate data base, (ii) 433
the most representative Global Climate Models (GCM) of the Fourth Assessment Report (AR4) 434
for the Special Reports on Emission Scenarios (SRES) A2a (business as usual) emission scenario 435
and (iii) existing data of coffee suitability in Central America as input data for the Maxent 436
(Phillips et al 2006) niche model. The Maxent model predicts spatially current climatically 437
suitable coffee growing areas based on presence data and the climate at these locations. The 438
established relation between the current climate and the suitability index are then projected to the 439
future. The model is based on the assumption that in the future the same climatic factors will 440
drive coffee growth as currently, therefore the model does not take into account any adaptation 441

20
strategies by means of germplasm or other improvements. We show that there is an important 442
decrease in the suitability of coffee-producing areas by 2050 (Fig. 4). Coffee suitability in this 443
context refers to areas that are climatically suitable to grow coffee, where values below zero 444
indicate areas less suitable than current conditions, and values above zero indicate areas more 445
suitable than current conditions. Specifically, the average temperature is predicted to increase by 446
2-2.5 degrees Celsius by 2050, and because coffee is very sensitive to changes in temperature, 447
coffee planting will need to move up slope by 300-400 m in order to compensate for the increase 448
in temperature (Läderach et al. 2010b). The shift in elevation will increase the pressure on forests 449
and the environmental benefits they provide to downstream communities. 450
451
4. Synthesis 452
453
Synthesizing research on global coffee distribution and cultivation practices, livelihoods, 454
biodiversity, ecosystem services, and climate resilience, it is clear that distribution and 455
cultivation practices are heterogeneous and are largely a function of local and global market 456
forces, incentives for intensification, and price premiums for diversification or improved 457
livelihoods. Traditional shade systems comprise less than 24% of the coffee areas surveyed in 458
2010, and the coffee expansion in the past two decades has been typified by intensive non-459
shaded practices. Millions of coffee farmers continue to struggle for survival despite the 460
production of high quality coffees and the generation of critical ecosystem services (Bacon et al. 461
2008). While some ecosystem services (ES) are well-known to coffee farmers (Cerdan et al. 462
2012), many others remain obscure to external agencies due to the indirect nature of their 463
services and the potential for interaction (Bennett et al. 2009). Henry et al. (2009) examined 464

21
interactions between plant biodiversity, regulating (C sequestration), and provisioning (food 465
production) ecosystem services in Kenya and found that increasing C sequestration by adding 466
more trees could have a negative effect on food production. In another example, Méndez et al. 467
(2009) showed that a higher density and diversity of shade trees resulted in a higher potential for 468
provisioning services (e.g. timber) with greater profits for farmers, but with lower coffee yields. 469
Because coffee yields are typically assessed independent of yield from timber, other crops, or 470
ecosystem services, it may be difficult for governments and conservation institutes to weigh the 471
benefits of diversified farming approaches. We propose three main focal research and 472
development areas that could advance ecosystem service provision and sustainable livelihoods in 473
coffee systems. 474
475
a. Improve certification and ecosystem service valuation 476
While certification is a common default approach used to integrate sustainable agriculture with 477
worker livelihoods, the certification approach is challenged by the limited nature of certifications 478
available and organizational and financial costs for certification. Existing certifications have 479
unique ecological standards, offer distinct economic incentives to different agents (directly to 480
growers, exporters, or to certification agencies), and also differ in the price premium provided 481
(Bacon et al. 2008, Calo and Wise 2005, Raynolds et al. 2007). As a result, farms that provide 482
substantial ecosystem services but do not qualify for existing certifications are left out, and those 483
that do qualify often face high costs of inspection and certification. For example, while Organic 484
and Fair Trade certification may raise coffee export prices (Bacon et al. 2008), these returns may 485
not cover the additional costs associated with maintenance and certification (Calo and Wise 486
2005). 487

22
We suggest research and development efforts in the exploration of a combined 488
certification approach (i.e. both Fair Trade and Organic), which could balance the costs and 489
benefits of different certification systems (Calo and Wise 2005, Philpott et al. 2007). Because 490
certification can be expensive, multiple certifications may be cost-prohibitive, especially for 491
smallholder farmers (Calo and Wise 2005), but discounts or incentives could be put into place in 492
order to minimize the costs of multiple certifications. Alternatively, government agencies could 493
subsidize or provide loans for the initial costs of certification and transition, or these expenses 494
could be paid after the first years of profit are earned. In this way and others, the certification 495
system could be revised to be more inclusive of small landholders. It is also essential that 496
certification studies incorporate an analysis of the time, labor, and economic costs involved. 497
Future work should explicitly investigate the support needed from financial, institutional, and 498
community agencies in order to successfully transition non-certified farmers to Organic, Fair 499
Trade, biodiversity- or livelihood- friendly coffees. 500
501
b. Diversify coffee farms 502
For both economic and ecological resiliency, the diversification of crops and livelihoods is 503
essential for coffee producers (Rice 2008). This review describes how a diverse array of crops 504
and shade trees provides farmers with 1) alternative income sources in cases of crop losses and 505
price fluctuations, 2) income across the growing season, 3) food for home consumption, and 4) 506
improved fertilization, erosion control, and habitat for pollinators and predators. Thus, it is 507
essential to evaluate the services and products provided by shade trees and additional crops in 508
addition to coffee yields when evaluating diversified farming approaches. An additional level of 509
diversity worth incorporating is the selection and sharing of heirloom and local seed (especially 510

23
corn, beans, rice and other subsistence crops), including local landraces which could be resistant 511
to extreme weather and changing precipitation patterns (Méndez et al. 2010a). These diversified 512
farming practices require involvement of civil society and the state in order to address the 513
structural drivers affecting persistent hunger, fraying rural safety nets for health, and educational 514
opportunities (Bacon et al. 2008). 515
516
c. Change local and global policy 517
Since 1989, the role of national governments directly influencing global coffee markets and 518
prices paid to producers (through the ICA) has decreased (Topik et al. 2010) and in these years, 519
in many regions, rural poverty rates have increased together with accelerating rates of 520
environmental destruction (Bacon et al 2008). We suggest that national governments of coffee 521
producing regions need to play a more active role in providing basic services to their populace 522
and protecting ecosystem services. Payments or Compensation for Ecosystem Services (PES) 523
provide one avenue for compensation or rewards from the beneficiaries directly to the 524
landholders and have been implemented in a number of nations, including Costa Rica, Mexico, 525
and China (reviewed in Engel et al. 2008). Rewards for ecosystem services should not be used to 526
directly regulate land management, but they could provide valuable incentives, especially with 527
the incorporation of management extension services (Engel et al. 2008, van Noordwijk and 528
Leimona 2010). The difficulties of quantifying PES or integrating them with the practices of 529
potential stakeholders or government agencies create real challenges (van Noordwijk and 530
Leimona 2010). Thus, successful programs require stakeholder involvement and development of 531
sustainable farmer livelihoods (van Noordwijk and Leimona 2010). Local, regional, and even 532
national cooperatives with administrative capacity and accountability to their membership can 533

24
leverage international development funding to improve coffee yields and quality, increase 534
production from the diversified shade canopy, and support a wide array of social development 535
projects (Raynolds et al. 2007). Incentives and infrastructure directed toward farmers who use 536
sustainable practices and preserve biodiversity could encourage producers to make a living while 537
being good stewards of the land. 538
539
8. Conclusions 540
Our findings show that while global coffee acreage has decreased since 1990, cultivation has 541
grown dramatically in Asia and has been accompanied by declining levels of diverse shade 542
coffee, thus threatening the availability and flow of ecosystem services across the globe. 543
Although there have been several gains in the growth of sustainable certifications, research also 544
suggests that livelihoods remain vulnerable and poverty and hunger are persistent in many 545
farming communities. Research in coffee systems has allowed for an improved understanding of 546
habitat management and biodiversity, a closer examination of relationships between biodiversity 547
and ecosystem services, and a greater understanding of tropical spatial ecology and connectivity. 548
Coffee has also emerged as an important test case for assessing the effects of different 549
certification programs, evaluating the links between local and global economies, and examining 550
the arena for participatory and interdisciplinary research. However, diversified efforts are needed 551
to develop effective solutions for sustainable livelihoods, and it is essential that all members in 552
the coffee value chain become active stakeholders in these efforts. From local to global scales, it 553
is clear that farmers, cooperatives, government agencies, and consumers all influence coffee land 554
management and rural livelihoods. We document that many of the landscapes that generate 555
important ecosystem services do not necessarily harvest the benefits in terms of income, 556

25
incentives, and opportunities. In order for coffee landscapes to be sustainable for humans and 557
their ecosystems, we need to 1) better incorporate human well-being and livelihoods into global 558
concepts of sustainability, 2) encourage the diversification of coffee farms to promote greater 559
resilience to changes in global markets and climates, and 3) improve the valuation and reward for 560
ecosystem services via certification and other systems in order to compensate farmers for the 561
innumerable services that shaded landscapes provide. Building synergistic and cooperative 562
relationships between farmers, certifiers, global agencies, researchers, and consumers, can 563
provide greater transparency and creative solutions for promoting ecological processes and well-564
being across global coffee systems. 565
566
Acknowledgements 567
We would like to express our gratitude to the coffee farmers of Mexico, Nicaragua, El Salvador, 568
Guatemala, Peru, Indonesia, and Costa Rica, for their support and permission to conduct research 569
with their families, in their communities, and on their land. 570

26
References 571
Aide TM, Grau HR. 2004. Ecology - Globalization, migration, and Latin American 572
ecosystems. Science 305: 1915-1916. 573
Arnould EJ, Plastina A, Ball D. 2009. Does Fair Trade Deliver on Its Core Value 574
Proposition? Effects on Income, Educational Attainment, and Health in Three Countries. 575
Journal of Public Policy & Marketing 28: 186-201. 576
Avelino J, Zelaya H, Merlo A, Pineda A, Ordonez M, Savary S. 2006. The intensity of a 577
coffee rust epidemic is dependent on production situations. Ecological Modelling 197: 431-578
447. 579
Avelino J, Cabut S, Barboza B, Barquero M, Alfaro R, Esquivel C, Durand JF, Cilas C. 580
2007. Topography and crop management are key factors for the development of American 581
leaf spot epidemics on coffee in Costa Rica. Phytopathology 97: 1532-1542. 582
Babbin N. 2010. Dissertation: Agrarian Change, Agroecological Transformation and the 583
Coffee Crisis in Costa Rica. University of California, Santa Cruz. 584
Bacon C, Méndez V, Gliessman S, Goodman D, Fox J. 2008. Confronting the coffee crisis : 585
fair trade, sustainable livelihoods and ecosystems in Mexico and Central America. 586
Cambridge, Mass.: MIT Press. 587
Bacon CM. 2010. Who decides what is fair in fair trade? The agri-environmental governance 588
of standards, access, and price. Journal of Peasant Studies 37: 111-147. 589
Beenhouwer M, Aertsb R, Honnaya O. 2013. A global meta-analysis of the biodiversity and 590
ecosystem service benefits of coffee and cacao agroforestry. Agriculture, Ecosystems and 591
Environment 175. 592
Beer J, Muschler R, Kass D, Somarriba E. 1998. Shade management in coffee and cacao 593
plantations. Agroforestry Systems 38: 139-164. 594
Bennett E, Peterson G, Gordon L. 2009. Understanding relationships among multiple 595
ecosystem services. Ecology Letters 12: 1-11. 596
Bhagwat SA, Kushalappa CG, Williams PH, Brown ND. 2005. Landscape approach to 597
biodiversity conservation of sacred groves in the Western Ghats of India. Conservation 598
Biology 19: 1853-1862. 599
Bosselmann AS. 2012. Mediating factors of land use change among coffee farmers in a 600
biological corridor. Ecological Economics 80: 79-88. 601
Bosselmann AS, Dons K, Oberthur T, Olsen CS, Raebild A, Usma H. 2009. The influence of 602
shade trees on coffee quality in small holder coffee agroforestry systems in Southern 603
Colombia. Agriculture Ecosystems & Environment 129: 253-260. 604
Calo M, Wise TA. 2005. Revaluing Peasant Coffee Production: Organic and Fair Trade 605
Markets in Mexico. Medford, Massachusetts: Global Development and Environment 606
Institute. 607
CEPAL. 2002. Globalización y desarrollo. Santiago, Chile. 608

27
Cerdan CR, Rebolledo MC, Soto G, Rapidel B, Sinclair FL. 2012. Local knowledge of 609
impacts of tree cover on ecosystem services in smallholder coffee production systems. 610
Agricultural Systems 110: 119-130. 611
Croce M. 2013. Personal Interview. Interviewed by Robert Rice, November 2013. 612
Cruz-Bello GM, Eakin H, Morales H, Barrera JF. 2011. Linking multi-temproal analysis and 613
community consultation to evaluate the response to the impact of Hurricane Stan in coffee 614
areas of Chiapas, Mexico. Natural Hazards 58. 615
D’haeze D, Deckers J, Raes D, Phong TA, Loi HV. 2005. Environmental and socio-616
ecnonomic impacts of institutional reforms on the agricultural sector of Vietnam Land 617
suitability assessment for Robusta coffee in the Dak Gan region. Agriculture, Ecosystems & 618
Environment 105:59-76. 619
DaMatta F, Ramalho J. 2006. Impacts of drought and temperature stress on cofeee 620
physiology and production: a review. Brazilian Journal of Plant Physiology 18: 55-81. 621
De Beenhouwera M, Aertsb R, Honnay O. 2013. A global meta-analysis of the biodiversity 622
and ecosystem service benefits of coffee and cacao agroforestry. Agriculture, Ecosystems 623
and Environment: 1-7. 624
De la Mora A, Livingston G, Philpott SM. 2008. Arboreal Ant Abundance and Leaf Miner 625
Damage in Coffee Agroecosystems in Mexico. Biotropica 40: 742-746. 626
Donald PF. 2004. Biodiversity impacts of some agricultural commodity production systems. 627
Conservation Biology 18: 17-37. 628
Engel S, Pagiola S, Wunder S. 2008. Designing payments for environmental services in 629
theory and practice: An overview of the issues. Ecological Economics 65: 663-674. 630
FAO. 2010. Food and Agriculture Organization. 631
http://faostat.fao.org/site/567/DesktopDefault.aspx?PageID=567#ancor 632
FAO. 2012. Key differences between Arabica and Robusta coffee. Adapted from 633
International Coffee Organization, www.ico.org. 634
GAIN Report. 2013. Situation Update—Coffee Rust in Mexico. USDA Foreign Agricultural 635
Service, Report No. MX3015, 4 pp. 636
Giovannucci D, Potts J, Killian B, Wunderlich C, Soto G, Schuller S, Pinard F, Schroeder 637
K, Vagneron I. 2008. Seeking Sustainability: COSA Preliminary Analysis of Sustainability 638
Initiatives in the Coffee Sector (October 5, 2008), Committee on Sustainability Assessment. 639
Greenberg R, Bichier P, Angon AC, Reitsma R. 1997. Bird populations in shade and sun 640
coffee plantations in Central Guatemala. Conservation Biology 11: 448-459. 641
Guadarrama-Zugasti C. 2008. A grower typology approach to assessing the environmental 642
impact of coffee farming in Veracruz, Mexico. Pages 127-154 in Bacon CM, Méndez VE, 643
Gliessman SR, Goodman D, Fox JA, eds. Confronting the coffee crisis: Fair Trade, 644
sustainable livelihoods and ecosystems in Mexico and Central America. Cambridge, MA: 645
MIT Press. 646
Guhl A. 2004. Coffee and landcover changes in the Colombian Coffee region landscape 647
1970-1997. Bogota, Colombia: Ensayos. 648

28
Guingato P, Nardone E, Notarnicola L. 2008. Environmental and socio-economic effects of 649
intensive agriculture: the Vietnam case. Journal of commodity sicence, technology, and 650
quality 47:135-151. 651
Hardner J, Rice R. 2002. Rethinking green consumerism. Scientific American 286: 88-95. 652
ICO. 2013. International Coffee Organization website: http://www.ico.org/botanical.aspIlly 653
E. 2002. The Complexity of Coffee. Scientific American: 86-91. 654
ITC. 2011. The Coffee Exporter’s Guide. International Trade Center. Geneva, Switzerland 655
248 pp. 656
Izada F. 2013. Personal Interview. Interviewed by Robert Rice, November 2013. 657
Jena PR, Chichaibelu BB, Stellmacher T, Grote U. 2012. The impact of coffee certification 658
on small-scale producers' livelihoods: a case study from the Jimma Zone, Ethiopia. 659
Agricultural Economics 43: 429-440. 660
Jha S, Vandermeer J. 2010. Impacts of coffee agroforestry management on tropical bee 661
communities. Biological Conservation 143: 1423-1431. 662
Jha S, Dick CW. 2010. Native bees facilitate gene flow across shade coffee landscapes. 663
Proceedings of the National Academy of the Sciences 107: 13760-13764. 664
Jha S, Bacon C, Philpott SM, Rice RA, Méndez VE, Läderach P. 2012. Shade coffee at a 665
crossroads again: A global review of ecosystem services and farmer livelihoods. Pages 141-666
208 in Campbell WB, Lopez Ortiz S, eds. Integrating Agriculture, Conservation and 667
Ecotourism: Examples from the Field. Netherlands: Springer. 668
JNC. 2013. Programa nacional para la renovación de la caficultura. Junta Nacional del Café, 669
Lima, Peru. 15 pp. 670
Henry M, Tittonell P, Manlay RJ, Bernoux M, Albrecht A, Vanlauwe B. 2009. Biodiversity, 671
carbon stocks and sequestration potential in aboveground biomass in smallholder farming 672
systems of western Kenya. Agriculture Ecosystems & Environment 129: 238-252. 673
Kellermann J, Johnson M, Stercho A, Hackett S. 2008. Ecological and economic services 674
provided by birds on Jamaican Blue Mountain coffee farms. 22: 1177-1185. 675
Klein AM, Steffan-Dewenter I, Tscharntke T. 2003. Fruit set of highland coffee increases 676
with the diversity of pollinating bees. Proceedings of the Royal Society of London Series B-677
Biological Sciences 270: 955-961. 678
P, Oberthür T, Niederhauser N, Usma H, Collet L, Pohlan J. 2006. Café Especial: Factores, 679
dimensiones e interacciones Pages 141-160 in Pohlan J, Soto L, Barrera J, eds. El cafetal del 680
futuro: Realidades y Visiones. Aachen: Shaker Verlag. 681
Läderach P, Lundy M, Jarvis A, Ramírez J, Pérez PE, Schepp K, Eitzinger A (2010a) Predicted 682
impact of climate change on coffee-supply chains. In Leal Filho, W. (ed) The Economic, social 683
and Political Elements of Climate Change, Springer Verlag, Berlin, DE. 19 p. 684
Läderach P, Haggar J, Lau C, Eitzinger A, Ovalle O, Baca M, Jarvis A, Lundy M. 2010b. 685
Mesoamerican coffee: Building a climate change adaptation strategy. CIAT Policy Brief no. 686
2. Cali, Colombia: Centro Internacional de Agricultura Tropical. 687

29
Lin B, Perfecto I, Vandermeer J. 2008. Synergies between agricultural intensification and 688
climate change could create surprising vulnerabilities for crops. BioScience 58: 847-854. 689
Lopez-Bravo DF, Virginio ED, & Avelino J. 2012. Shade is conducive to coffee rust as 690
compared to full sun exposure under standardized fruit load conditions. Crop Protection, 38, 691
21-29. 692
Méndez V, Gliessman S, Gilbert G. 2007. Tree biodiversity in farmer cooperatives of a shade 693
coffee landscape in western El Salvador. Agriculture Ecosystems & Environment 119: 145-694
159. 695
Méndez V, Shapiro E, Gilbert G. 2009. Cooperative management and its effects on shade 696
tree diversity, soil properties and ecosystem services of coffee plantations in western El 697
Salvador. Agroforestry Systems 76: 111-126. 698
Méndez VE, Bacon CM, Olson M, Morris KS, Shattuck AK. 2010a. Agrobiodiversity and 699
shade coffee smallholder livelihoods: A review and synthesis of ten years of research in 700
Central America. Professional Geographer 62: 357-376. 701
Méndez VE, Bacon C, Olson M, Petchers S, Herrador D, Carranza C, Trujillo L, 702
Guadarrama-Zugasti C, Cordón A, Mendoza A. 2010b. Effects of Fair Trade and organic 703
certifications on small-scale coffee farmer households in Central America and Mexico. 704
Renewable Agriculture and Food Systems 25: 236-251. 705
Moguel P, Toledo VM. 1999. Biodiversity conservation in traditional coffee systems of 706
Mexico. Conservation Biology 13: 11-21. 707
Montagnon C, Marraccini P, Bertrand B. 2012. Specialty coffee: managing quality. 708
International Plant Nutrition Institute, Southeast Asia Program (IPNI-SEAP): Penang 709
Malaysia. Pages 93-122 in Oberthür T, Läderach P, Jürgen HA, Cook JH, eds. Breeding for 710
coffee quality. 711
Muriel SB, Kattan GH. 2009. Effects of Patch Size and Type of Coffee Matrix on Ithomiine 712
Butterfly Diversity and Dispersal in Cloud-Forest Fragments. Conservation Biology 23: 948-713
956. 714
Muschler R. 2001. Shade improves coffee quality in a sub-optimal coffee-zone of Costa 715
Rica. Agroforestry Systems 51: 131 – 139. 716
Neelin JD, Munnich M, Su H, Meyerson JE, Holloway CE. 2006. Tropical drying trends in 717
global warming models and observations. Proceedings of the National Academy of Sciences 718
of the United States of America 103: 6110-6115. 719
Neilson J. 2008. Global private regulation and value-chain restructuring in Indonesian 720
smallholder coffee systems. World Development 36: 1607-1622. 721
O’Brien TG, Kinnaird MF. 2003. Caffeine and conservation. Science: 587. 722
Oxfam. 2002. Mugged: Poverty in Your Coffee Cup. 723
Palm C, et al. 2005. Carbon losses and sequestration after land use change in the humid 724
tropics. Pages 41-63. Slash-and-Burn Agriculture: the Search for Alternatives. New York: 725
Columbia University Press. 726

30
Perfecto I, Vandermeer J. 2006. The effect of an ant-hemipteran mutualism on the coffee 727
berry borer (Hypothenemus hampei) in southern Mexico. Agriculture Ecosystems & 728
Environment 117: 218-221. 729
Perfecto I, Rice RA, Greenberg R, VanderVoort ME. 1996. Shade coffee: A disappearing 730
refuge for biodiversity. Bioscience 46: 598-608. 731
Phillips SJ, Anderson RP, Schapire RE (2006) Maximum entropy modeling of species 732
geographic distributions. Ecological Modelling 190:231-259. 733
Philpott SM, Bichier P, Rice R, Greenberg R. 2007. Field-testing ecological and economic 734
benefits of coffee certification programs. Conservation Biology 21: 975-985. 735
Philpott SM, Arendt W, Armbrecht I, Bichier P, Dietsch T, Gordon C, Greenberg R, Perfecto 736
I, Soto-Pinto L, Tejeda-Cruz C, Williams G, Valenzuela J. 2008a. Biodiversity loss in Latin 737
American coffee landscapes: reviewing evidence on ants, birds, and trees. Conservation 738
Biology 22: 1093-1105. 739
Philpott SM, Lin BB, Jha S, Brines SJ. 2008b. A multi-scale assessment of hurricane impacts 740
on agricultural landscapes based on land use and topographic features. Agriculture 741
Ecosystems & Environment 128: 12-20. 742
Raynolds LT, Murray D, Heller A. 2007. Regulating sustainability in the coffee sector: A 743
comparative analysis of third-party environmental and social certification initiatives. 744
Agriculture and Human Values 24: 147-163. 745
Rice P, McLean J. 1999. Sustainable coffee at the crossroads. Consumer's Choice Council. 746
Report no. 747
Rice RA. 2008. Agricultural intensification within agroforestry: The case of coffee and wood 748
products. Agriculture Ecosystems & Environment 128: 212-218. 749
Ricketts TH, Daily GC, Ehrlich PR, Michener CD. 2004. Economic value of tropical forest 750
to coffee production. Proceedings of the National Academy of Sciences of the United States 751
of America 101: 12579-12582. 752
Rueda X, Lambin E. 2013. Linking Globalization to Local Land Uses: How Eco-consumers 753
and Gourmands are Changing the Colombian Coffee Landscapes. World Development 41: 754
286-301. 755
SCAA. 2012. Specialty Coffee Facts and Figures. Report. Specialty Coffee Association of 756
America. Long Beach, CA. Long Beach, CA. Report no. 757
Soto-Pinto L, Perfecto I, Caballero-Nieto J. 2002. Shade over coffee: its effects on berry 758
borer, leaf rust and spontaneous herbs in Chiapas, Mexico. Agroforestry Systems 55: 37-45. 759
Soto-Pinto L, Perfecto I, Castillo-Hernandez J, Caballero-Nieto J. 2000. Shade effect on 760
coffee production at the northern Tzeltal zone of the state of Chiapas, Mexico. Agriculture, 761
Ecosystems and Environment 80: 61-69. 762
Soto-Pinto L, Anzueto M, Mendoza J, Ferrer GJ, de Jong B. 2010. Carbon sequestration 763
through agroforestry in indigenous communities of Chiapas, Mexico. Agroforestry Systems 764
78: 39-51. 765
Schroth G, Laderach P, Dempewolf J, Philpott S, Haggar J, Eakin H, Castillejos T, Moreno 766

31
JG, Soto Pinto L, Hernandez R, Eitzinger A, Ramirez-Villegas J (2009) Towards a climate 767
change adaptation strategy for coffee communities and ecosystems in the Sierra Madre de 768
Chiapas, Mexico. Mitig Adapt Strateg Glob Change 14:605–625 769
Staver C, Guharay F, Monterroso D, Muschler RG. 2001. Designing pest-suppressive 770
multistrata perennial crop systems: shade-grown coffee in Central America. Agroforestry 771
Systems 53: 151-170. 772
Topik S, Talbot J, Samper M. 2010. Introduction Globalization, Neoliberalism, and the Latin 773
American Coffee Societies. Latin American Perspectives 171: 5-20. 774
Tscharntke T, et al. 2011. Multifunctional shade-tree management in tropical agroforestry 775
landscapes - a review. Journal of Applied Ecology 48: 619-629. 776
Ukers W. 1922. All About Coffee. New York: The Tea and Coffee Trade Journal Company. 777
van Noordwijk M, Leimona B. 2010. Principles for Fairness and Efficiency in Enhancing 778
Environmental Services in Asia: Payments, Compensation, or Co-Investment? Ecology and 779
Society 15. 780
Virginio EM. 2013. Impactos de la roya en Centroamérica y avances de los 781
planes de control en los países: actualización con base en talleres nacionales. Published on 782
CATIE website: http://biblioteca.catie.ac.cr/royadelcafeto/ 783
Wardle DA, Bardgett RD, Callaway RM, Van der Putten WH. 2011. Terrestrial Ecosystem 784
Responses to Species Gains and Losses. Science 332: 1273-1277. 785
Wilson K. 1999. Coffee, cocoa and tea. Wallingford, Oxon, UK: CABI Publishing. 786
Zeltzer N. 2008. Foreign-Economic-Retirement Migration: Promises and Potential, Barriers 787
and Burdens Elder Law Journal. 16: 211- 241. 788
789

32
Table and Figure Captions: 790
Fig. 1. Spatial distribution of global coffee cultivation. 791
792
793

33
794
Fig. 2. Percent coffee area managed beneath different technological/shade levels. Diverse shade 795
has a closed or nearly closed canopy (>40% cover) with 10 or more species of shade 796
trees, Scant shade has minimal but existing canopy (1-40% cover) and usually 1-2 species 797
of shade trees (all with <10 species), and Sun coffee has no shade or shade trees in the 798
production area. 799
800
801
802
803

34
Fig. 3. Dollar size of the specialty coffee market in Billions. 804
805
806

35
Fig. 4. Distribution of coffee suitability in 2050 and current protected areas in Mesoamerica.807
808
809

36
Table 1. Impact of increasing vegetation complexity of shade coffee on pollination, pest-control, 810
climate-regulation, and nutrient & sequestration ecosystem services (description of literature and 811
references in Table S2). 812
pollination
pest control
climate regulation
nutrient & sequestration
higher pollinator species richness1, 2
higher pollinator abundance 2, 4
higher native bee abundance, higher social bee abundance3
no impact on pollinator abundance 5
no impact on pollinator diversity 68
lower pollinator abundance 6, 68
lower pollinator species richness 68
higher parasitism 49
higher predator abundance 8,
9, 14, 16, 17, 42, 55, 56, 57, 59, 67
higher predator nest availability 11
higher predator species richness 9, 15, 42, 43, 55, 67
higher removal of pests 7, 12, 13,
44, 46, 47, 53, 58
lower pest abundance 10, 13, 48,
51, 52, 61, 62, 63, 64
lower pest damage 66 0 no impact on pest abundance
61, 62, 63 0 no impact on predator
abundance 15, 16, 18, 49, 64, 65 0 no impact on predator species
richness 49, 54 0 no impact on prey abundance
50 0 no impact on removal of pests
42, 43, 45
higher pest abundance 19, 20, 21,
22, 51, 53
higher pest species richness 60
lower predator abundance 17,
65
lower predator species richness 57
higher leaf wetness frequency 19
lower air, soil, or leaf temperatures (mean maximum or mean) 23, 25,
27, 28, 29, 30, 33
lower global, PAR, or net solar radiation 23, 25, 28, 30,
33
fewer and smaller landslides 24
lower wind speed 25, 28, 30
lower soil evaporation rates, lower plant evaporative transpiration 26
higher relative extractable water in soil, higher soil moisture 29, 31,
33
higher precipitation capture 31
lower humidity and solar radiation fluctuations 32
lower frost damage 34
lower intra-day fluctuations in temperature, lower rate of cooling of night air 19,
32, 33
higher above ground carbon storage 35, 38,
39, 69
higher total soil organic C 27, 69
higher N mineralization, lower NP nutrient excess (inputs minus outputs) 27, 36, 41
higher soil microbial activity 27
higher soil pH, CEC, Ca, and Mg, and lower K 37
higher N concentration in leaves 38
higher fractions of P available to agricultural crops 40
no impact on soil organic carbon 70
813