2 material and methods - uni-halle.de
TRANSCRIPT
2 Material and methods
2 MATERIAL AND METHODS
2.1 Material
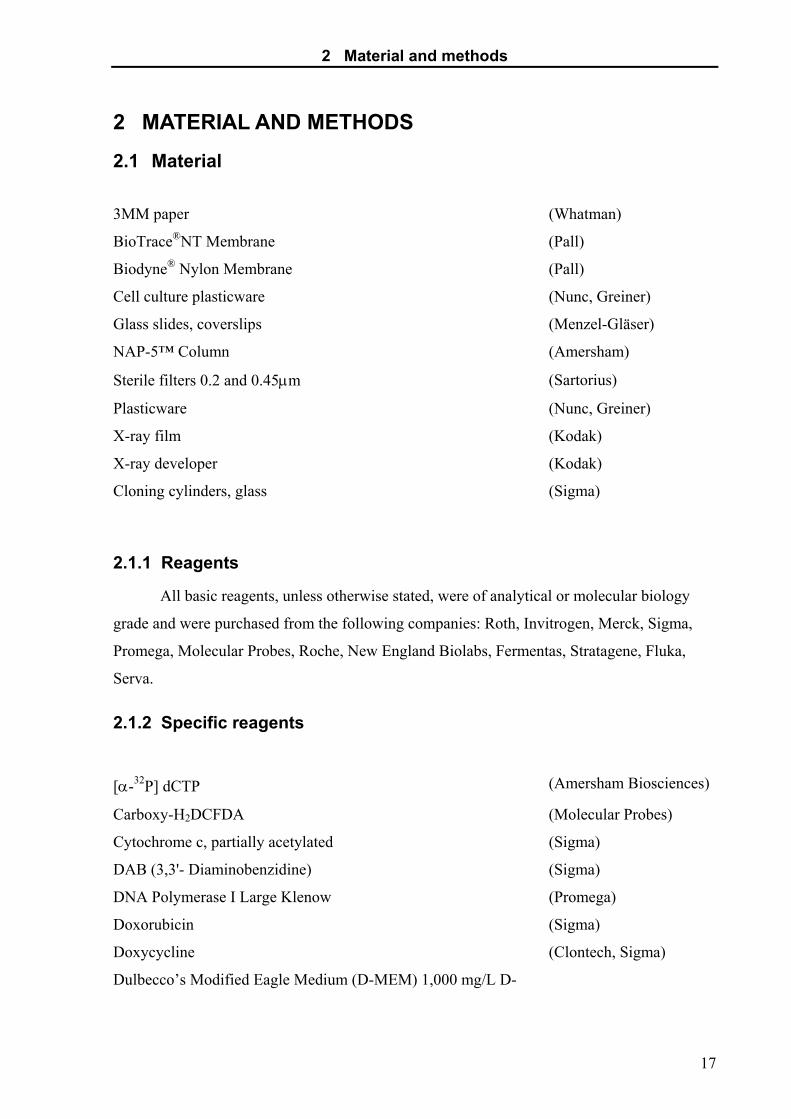
3MM paper (Whatman)
BioTrace®NT Membrane (Pall)
Biodyne® Nylon Membrane (Pall)
Cell culture plasticware (Nunc, Greiner)
Glass slides, coverslips (Menzel-Gläser)
NAP-5™ Column (Amersham)
Sterile filters 0.2 and 0.45µm (Sartorius)
Plasticware (Nunc, Greiner)
X-ray film (Kodak)
X-ray developer (Kodak)
Cloning cylinders, glass (Sigma)
2.1.1 Reagents
All basic reagents, unless otherwise stated, were of analytical or molecular biology
grade and were purchased from the following companies: Roth, Invitrogen, Merck, Sigma,
Promega, Molecular Probes, Roche, New England Biolabs, Fermentas, Stratagene, Fluka,
Serva.
2.1.2 Specific reagents
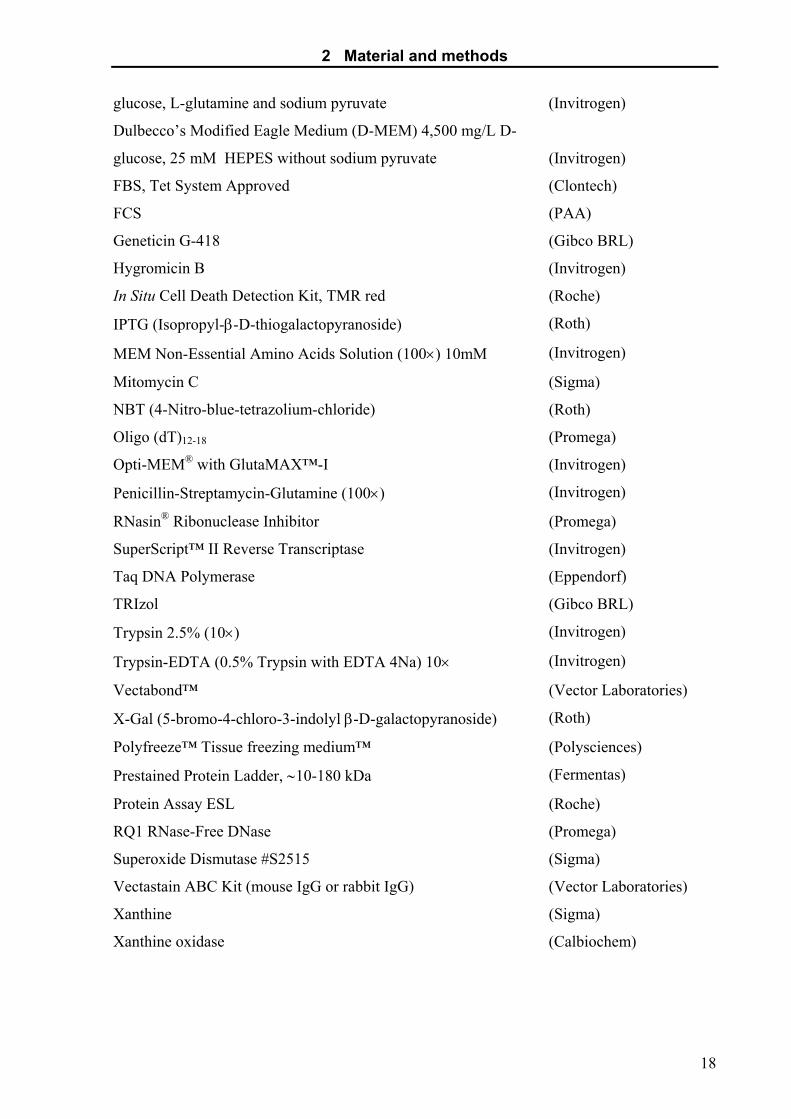
[α-32P] dCTP (Amersham Biosciences)
Carboxy-H DCFDA2 (Molecular Probes)
Cytochrome c, partially acetylated (Sigma)
DAB (3,3'- Diaminobenzidine) (Sigma)
DNA Polymerase I Large Klenow (Promega)
Doxorubicin (Sigma)
Doxycycline (Clontech, Sigma)
Dulbecco’s Modified Eagle Medium (D-MEM) 1,000 mg/L D-
17
2 Material and methods
glucose, L-glutamine and sodium pyruvate (Invitrogen)
Dulbecco’s Modified Eagle Medium (D-MEM) 4,500 mg/L D-
glucose, 25 mM HEPES without sodium pyruvate
(Invitrogen)
FBS, Tet System Approved (Clontech)
FCS (PAA)
Geneticin G-418 (Gibco BRL)
Hygromicin B (Invitrogen)
In Situ Cell Death Detection Kit, TMR red (Roche)
IPTG (Isopropyl-β-D-thiogalactopyranoside) (Roth)
MEM Non-Essential Amino Acids Solution (100×) 10mM (Invitrogen)
Mitomycin C (Sigma)
NBT (4-Nitro-blue-tetrazolium-chloride) (Roth)
Oligo (dT)12-18 (Promega)
Opti-MEM® with GlutaMAX™-I (Invitrogen)
Penicillin-Streptamycin-Glutamine (100×) (Invitrogen)
RNasin® Ribonuclease Inhibitor (Promega)
SuperScript™ II Reverse Transcriptase (Invitrogen)
Taq DNA Polymerase (Eppendorf)
TRIzol (Gibco BRL)
Trypsin 2.5% (10×) (Invitrogen)
Trypsin-EDTA (0.5% Trypsin with EDTA 4Na) 10× (Invitrogen)
Vectabond™ (Vector Laboratories)
X-Gal (5-bromo-4-chloro-3-indolyl β-D-galactopyranoside) (Roth)
Polyfreeze™ Tissue freezing medium™ (Polysciences)
Prestained Protein Ladder, ∼10-180 kDa (Fermentas)
Protein Assay ESL (Roche)
RQ1 RNase-Free DNase (Promega)
Superoxide Dismutase #S2515 (Sigma)
Vectastain ABC Kit (mouse IgG or rabbit IgG) (Vector Laboratories)
Xanthine (Sigma)
Xanthine oxidase (Calbiochem)
18
2 Material and methods
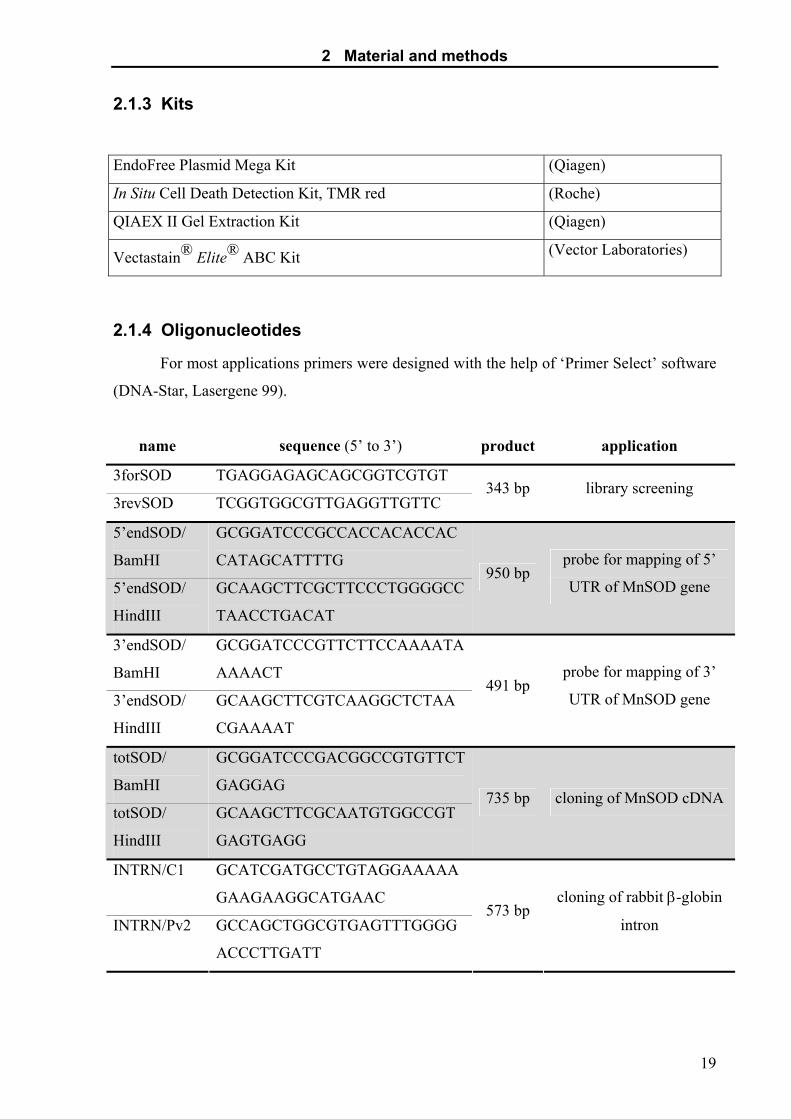
2.1.3 Kits
EndoFree Plasmid Mega Kit (Qiagen)
In Situ Cell Death Detection Kit, TMR red (Roche)
QIAEX II Gel Extraction Kit (Qiagen)
Vectastain® Elite® ABC Kit (Vector Laboratories)
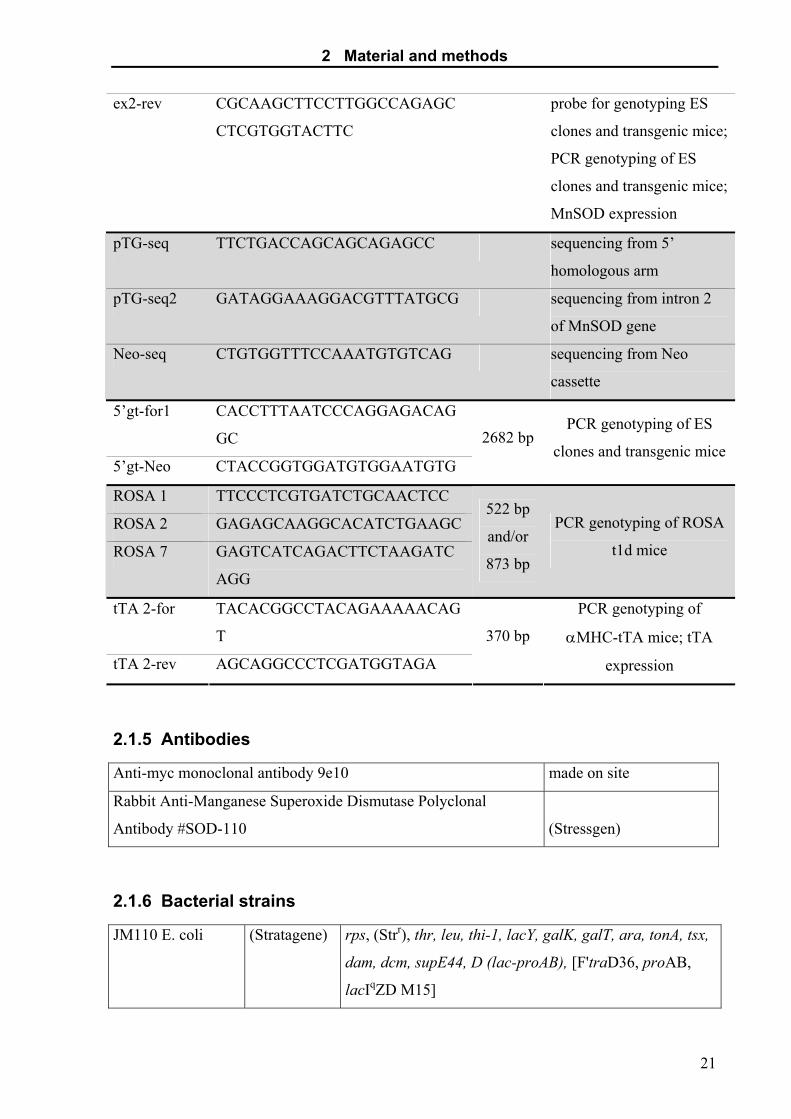
2.1.4 Oligonucleotides
For most applications primers were designed with the help of ‘Primer Select’ software
(DNA-Star, Lasergene 99).
name sequence (5’ to 3’) product application
3forSOD TGAGGAGAGCAGCGGTCGTGT
3revSOD TCGGTGGCGTTGAGGTTGTTC 343 bp library screening
5’endSOD/
BamHI
GCGGATCCCGCCACCACACCAC
CATAGCATTTTG
5’endSOD/
HindIII
GCAAGCTTCGCTTCCCTGGGGCC
TAACCTGACAT
950 bp probe for mapping of 5’
UTR of MnSOD gene
3’endSOD/
BamHI
GCGGATCCCGTTCTTCCAAAATA
AAAACT
3’endSOD/
HindIII
GCAAGCTTCGTCAAGGCTCTAA
CGAAAAT
491 bp probe for mapping of 3’
UTR of MnSOD gene
totSOD/
BamHI
GCGGATCCCGACGGCCGTGTTCT
GAGGAG
totSOD/
HindIII
GCAAGCTTCGCAATGTGGCCGT
GAGTGAGG
735 bp cloning of MnSOD cDNA
INTRN/C1 GCATCGATGCCTGTAGGAAAAA
GAAGAAGGCATGAAC
INTRN/Pv2 GCCAGCTGGCGTGAGTTTGGGG
ACCCTTGATT
573 bp cloning of rabbit β-globin
intron
19
2 Material and methods
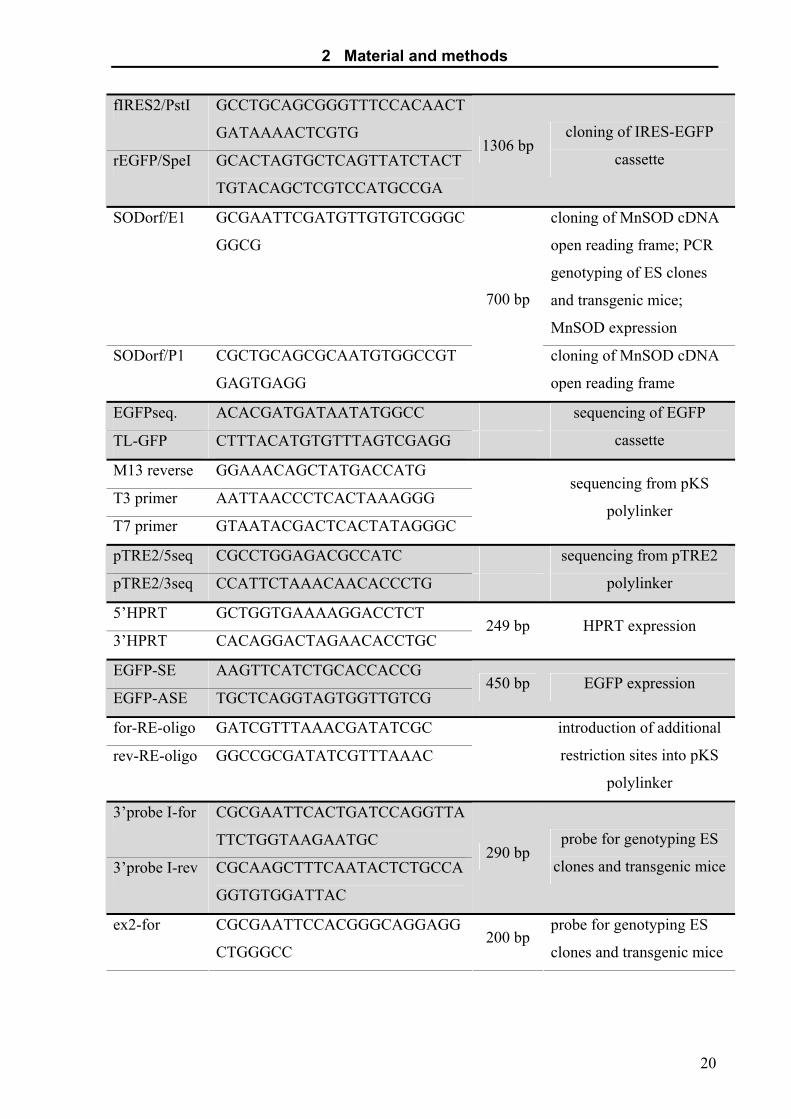
fIRES2/PstI GCCTGCAGCGGGTTTCCACAACT
GATAAAACTCGTG
rEGFP/SpeI GCACTAGTGCTCAGTTATCTACT
TGTACAGCTCGTCCATGCCGA
1306 bp cloning of IRES-EGFP
cassette
SODorf/E1 GCGAATTCGATGTTGTGTCGGGC
GGCG
cloning of MnSOD cDNA
open reading frame; PCR
genotyping of ES clones
and transgenic mice;
MnSOD expression
SODorf/P1 CGCTGCAGCGCAATGTGGCCGT
GAGTGAGG
700 bp
cloning of MnSOD cDNA
open reading frame
EGFPseq. ACACGATGATAATATGGCC
TL-GFP CTTTACATGTGTTTAGTCGAGG
sequencing of EGFP
cassette
M13 reverse GGAAACAGCTATGACCATG
T3 primer AATTAACCCTCACTAAAGGG
T7 primer GTAATACGACTCACTATAGGGC
sequencing from pKS
polylinker
pTRE2/5seq CGCCTGGAGACGCCATC
pTRE2/3seq CCATTCTAAACAACACCCTG
sequencing from pTRE2
polylinker
5’HPRT GCTGGTGAAAAGGACCTCT
3’HPRT CACAGGACTAGAACACCTGC 249 bp HPRT expression
EGFP-SE AAGTTCATCTGCACCACCG
EGFP-ASE TGCTCAGGTAGTGGTTGTCG 450 bp EGFP expression
for-RE-oligo GATCGTTTAAACGATATCGC
rev-RE-oligo GGCCGCGATATCGTTTAAAC
introduction of additional
restriction sites into pKS
polylinker
3’probe I-for CGCGAATTCACTGATCCAGGTTA
TTCTGGTAAGAATGC
3’probe I-rev CGCAAGCTTTCAATACTCTGCCA
GGTGTGGATTAC
290 bp probe for genotyping ES
clones and transgenic mice
ex2-for CGCGAATTCCACGGGCAGGAGG
CTGGGCC 200 bp
probe for genotyping ES
clones and transgenic mice
20
2 Material and methods
ex2-rev CGCAAGCTTCCTTGGCCAGAGC
CTCGTGGTACTTC
probe for genotyping ES
clones and transgenic mice;
PCR genotyping of ES
clones and transgenic mice;
MnSOD expression
pTG-seq TTCTGACCAGCAGCAGAGCC sequencing from 5’
homologous arm
pTG-seq2 GATAGGAAAGGACGTTTATGCG sequencing from intron 2
of MnSOD gene
Neo-seq CTGTGGTTTCCAAATGTGTCAG sequencing from Neo
cassette
5’gt-for1 CACCTTTAATCCCAGGAGACAG
GC
5’gt-Neo CTACCGGTGGATGTGGAATGTG
2682 bp PCR genotyping of ES
clones and transgenic mice
ROSA 1 TTCCCTCGTGATCTGCAACTCC
ROSA 2 GAGAGCAAGGCACATCTGAAGC
ROSA 7 GAGTCATCAGACTTCTAAGATC
AGG
522 bp
and/or
873 bp
PCR genotyping of ROSA
t1d mice
tTA 2-for TACACGGCCTACAGAAAAACAG
T
tTA 2-rev AGCAGGCCCTCGATGGTAGA
370 bp
PCR genotyping of
αMHC-tTA mice; tTA
expression
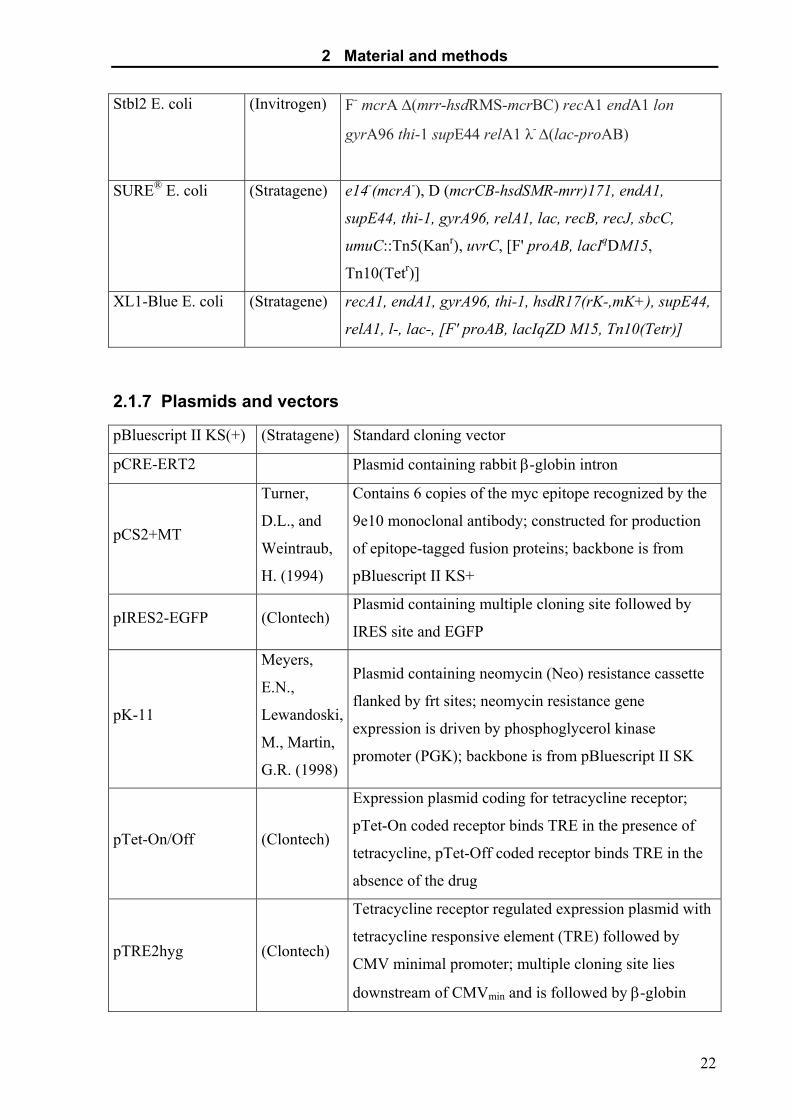
2.1.5 Antibodies
Anti-myc monoclonal antibody 9e10 made on site
Rabbit Anti-Manganese Superoxide Dismutase Polyclonal
Antibody #SOD-110
(Stressgen)
2.1.6 Bacterial strains
JM110 E. coli (Stratagene) rps, (Strr), thr, leu, thi-1, lacY, galK, galT, ara, tonA, tsx,
dam, dcm, supE44, D (lac-proAB), [F'traD36, proAB,
lacIqZD M15]
21
2 Material and methods
Stbl2 E. coli (Invitrogen) F- mcrA ∆(mrr-hsdRMS-mcrBC) recA1 endA1 lon
gyrA96 thi-1 supE44 relA1 λ- ∆(lac-proAB)
SURE® E. coli (Stratagene) e14-(mcrA-), D (mcrCB-hsdSMR-mrr)171, endA1,
supE44, thi-1, gyrA96, relA1, lac, recB, recJ, sbcC,
umuC::Tn5(Kanr), uvrC, [F' proAB, lacIqDM15,
Tn10(Tetr)]
XL1-Blue E. coli (Stratagene) recA1, endA1, gyrA96, thi-1, hsdR17(rK-,mK+), supE44,
relA1, l-, lac-, [F' proAB, lacIqZD M15, Tn10(Tetr)]
2.1.7 Plasmids and vectors
pBluescript II KS(+) (Stratagene) Standard cloning vector
pCRE-ERT2 Plasmid containing rabbit β-globin intron
pCS2+MT
Turner,
D.L., and
Weintraub,
H. (1994)
Contains 6 copies of the myc epitope recognized by the
9e10 monoclonal antibody; constructed for production
of epitope-tagged fusion proteins; backbone is from
pBluescript II KS+
pIRES2-EGFP (Clontech) Plasmid containing multiple cloning site followed by
IRES site and EGFP
pK-11
Meyers,
E.N.,
Lewandoski,
M., Martin,
G.R. (1998)
Plasmid containing neomycin (Neo) resistance cassette
flanked by frt sites; neomycin resistance gene
expression is driven by phosphoglycerol kinase
promoter (PGK); backbone is from pBluescript II SK
pTet-On/Off (Clontech)
Expression plasmid coding for tetracycline receptor;
pTet-On coded receptor binds TRE in the presence of
tetracycline, pTet-Off coded receptor binds TRE in the
absence of the drug
pTRE2hyg (Clontech)
Tetracycline receptor regulated expression plasmid with
tetracycline responsive element (TRE) followed by
CMV minimal promoter; multiple cloning site lies
downstream of CMVmin and is followed by β-globin
22
2 Material and methods
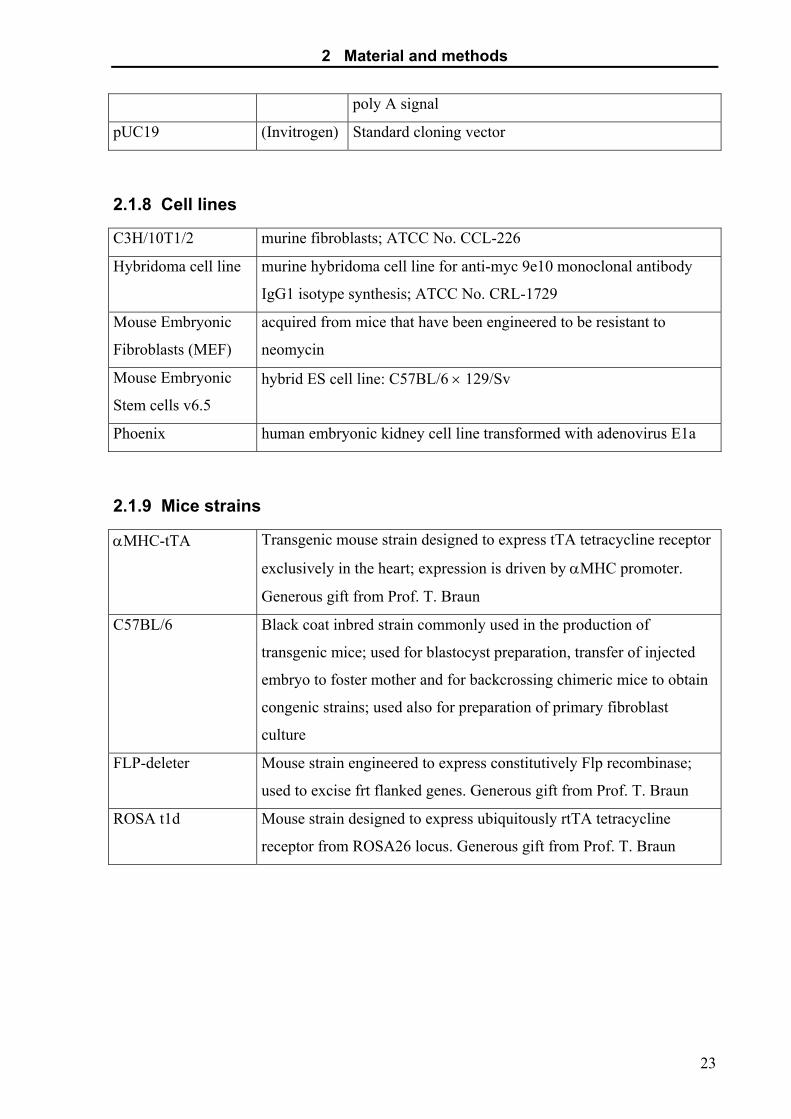
poly A signal
pUC19 (Invitrogen) Standard cloning vector
2.1.8 Cell lines
C3H/10T1/2 murine fibroblasts; ATCC No. CCL-226
Hybridoma cell line murine hybridoma cell line for anti-myc 9e10 monoclonal antibody
IgG1 isotype synthesis; ATCC No. CRL-1729
Mouse Embryonic
Fibroblasts (MEF)
acquired from mice that have been engineered to be resistant to
neomycin
Mouse Embryonic
Stem cells v6.5
hybrid ES cell line: C57BL/6 × 129/Sv
Phoenix human embryonic kidney cell line transformed with adenovirus E1a
2.1.9 Mice strains
αMHC-tTA Transgenic mouse strain designed to express tTA tetracycline receptor
exclusively in the heart; expression is driven by αMHC promoter.
Generous gift from Prof. T. Braun
C57BL/6 Black coat inbred strain commonly used in the production of
transgenic mice; used for blastocyst preparation, transfer of injected
embryo to foster mother and for backcrossing chimeric mice to obtain
congenic strains; used also for preparation of primary fibroblast
culture
FLP-deleter Mouse strain engineered to express constitutively Flp recombinase;
used to excise frt flanked genes. Generous gift from Prof. T. Braun
ROSA t1d Mouse strain designed to express ubiquitously rtTA tetracycline
receptor from ROSA26 locus. Generous gift from Prof. T. Braun
23
2 Material and methods
2.2 Methods
Unless otherwise stated, all molecular biology techniques were performed in
accordance with standard protocols described in “Molecular Cloning” (Sambrook et al., 1989)
or “Current Protocols in Molecular Biology” (Ausubel et al., 1992). All cloning steps as well
as PCR and RT-PCR products were confirmed by restriction digestions and DNA sequencing.
All solutions were made in double-distilled water or demineralized MilliQ water. Solutions
were either autoclaved or filter-sterilized.
2.2.1 Generation of cell culture and targeting constructs
2.2.1.1 Genomic library screening
Mouse strain 129 genomic library was provided in pools by RZPD Deutsches
Ressourcenzentrum für Genomforschung GmbH. Pools were screened for MnSOD locus by
PCR reaction with 3forSOD (exon 1) and 3revSOD (exon 2) primers. Positive pools that
produced 343 bp product in PCR reaction were used to order genomic clones which were
provided in Lawrist 7 cosmids. Primers 3’endSOD/BamHI with 3’endSOD/HindIII and
5’endSOD/BamHI with 5’endSOD/HindIII were used in further PCR reactions to prove the
presence of 3’ and 5’ part of MnSOD gene as well as to generate probes for mapping of the
locus. Primers produced 491 bp and 950 bp products, respectively.
2.2.1.2 Mapping of the MnSOD locus
The partial sequence of MnSOD locus was published by Jones et al. in 1995 and is
available under the following GenBank accession numbers: L35525, L35526, L35527 and
L35528. Standard molecular biology techniques were used to map unknown restriction sites
and identify desired fragments which after cloning into pKS vector served either as probes or
homologous arms for construction of the targeting vector. Further mapping was greatly
facilitated by nucleotide sequence retrieved from mouse genome database available at
www.ensembl.org
24
2 Material and methods
2.2.1.3 Generation of cell culture construct pTRE2hyg/SOD2ex
TRIzol extracted wild type liver RNA was reverse transcribed according to general
protocol – see 2.2.5.1. cDNA for MnSOD was amplified with totSOD/HindIII and
totSOD/BamHI primers. 735 bp fragment was digested with HindIII and BamHI restriction
enzymes and cloned to pKS vector (pKS/totSOD). Cloned fragment was sequenced and
compared to known cDNA sequence. Then SODorf/E1 and SODorf/P1 primers were used to
amplify 691 bp fragment containing MnSOD ORF and introduce EcoRI site in front of start
codon.
Myc epitope sequence (260 bp) was cut out from pCS2+ MT plasmid with ClaI and EcoRI
enzymes and cloned to pKS (pKS/tag). Next, PCR amplified 691 bp MnSOD coding region
was cut with EcoRI and PstI and introduced into relevant sites in pKS/tag (pKS/tagSOD).
Obtained fusion of myc epitope and MnSOD was sequenced with particular attention paid to
the fusion site.
Then fIRES2/PstI and rEGFP/SpeI primers were used to amplify IRES-EGFP cassette (1306
bp) from pIRES2-EGFP vector. This fragment was cloned to PstI-SpeI sites in pKS/tagSOD
and obtained pKS/tagSOD IRES-EGFP plasmid was verified by sequencing.
Rabbit β-globin intron was PCR amplified from pCRE-ERT2 plasmid with INTRN/C1 and
INTRN/Pv2 primers (573 bp) cut with ClaI and PvuII restriction enzymes and cloned to
pTRE2 vector (pTRE2/INTRN).
Subsequently whole tagSOD IRES-EGFP expression cassette was cut out from pKS/tagSOD
IRES-EGFP plasmid with ClaI and XbaI enzymes and cloned to respective sites in
pTRE2/INTRN plasmid (pTRE2/SOD2ex). Finally, hygromycin resistance cassette was cut
out from pTRE2hyg vector with XhoI enzyme and cloned into XhoI site in pTRE2/SOD2ex.
Obtained pTRE2hyg/SOD2ex cell culture construct was used in further work.
Partial digestions of pTRE2hyg/SOD2ex plasmid with XhoI enzyme were done to inactivate
one of the two XhoI sites (at position 2). The obtained pZK/SOD construct was linearized
with XhoI and used exclusively in stable cell line generation. This modification had no
influence on functionality of the construct.
2.2.1.4 Generation of targeting construct pTG/TRE
Homologous arms were cloned as follows. Lawrist 7 cosmid with MnSOD gene was
digested with HindIII restriction enzyme and 2445 bp HindIII fragment (5’ arm) was
25
2 Material and methods
identified by means of Southern blot hybridization. Primers 5’endSOD/BamHI and
5’endSOD/HindIII were used to synthesize probe. This HindIII fragment was cloned to pKS
vector (pKS/5’).
For 3’ arm cloning BamHI digestions of MnSOD cosmid were done and 8.75 kb BamHI
fragment (3’ arm) was identified with a probe prepared with 3’endSOD/BamHI and
3’endSOD/HindIII primers. BamHI fragment was cloned to pKS vector (pKS/3’).
Then 3’ arm fragment was cut out from pKS/3’ with XmaI and SacII restriction enzymes and
ligated to respective sites in pKS/5’ (pKS/5’-3’).
Neomycin resistance cassette flanked by frt sites (1.96 kb) was cut out from pK-11 with SacI
and KpnI enzymes and subcloned to pUC18 vector (pUC/Neo). Subsequently it was cut out
with XmaI together with EcoRI and ligated to relevant sites in pKS/5’-3’ (pKS/5’-Neo-3’).
Correct ligation was verified by sequencing of junction points with pTG-seq and Neo-seq
primers.
MnSOD expression cassette together with CMVmin promoter, TRE and β-globin poly A was
cut out from pTRE2hyg/SODex construct with XhoI and BsrBI enzymes. This 4.7 kb
fragment was blunt-ended and ligated to SmaI site in modified pKS vector (PmeI and EcoRV
sites introduced between BamHI and NotI). Then whole expression cassette was cut out with
EcoRV enzyme and blunt end ligated to SmaI site in pKS/5’-Neo-3’. Desired orientation of
the expression cassette was identified and pTG/TRE targeting construct was completed. NotI
restriction site located downstream of the 3’ arm was used to linearize the construct before
transfecting into ES cells.
2.2.1.5 Generation of targeting construct pTG/TRE tetR
Tetracycline receptor (Tet-Off) coding sequence together with CMV promoter and
SV40 poly A was cut out from pTet-Off plasmid with XhoI and PvuII enzymes, blunted and
ligated to SmaI site in modified pKS vector. The whole tetracycline receptor cassette was cut
out with EcoRV and modified with AscI linkers. The PmeI site in pTG/TRE construct was
also changed with AscI linkers. Finally, the AscI linkered tetracycline receptor cassette was
cloned into the AscI site in pTG/TRE to complete the pTG/TRE tetR targeting construct. Two
orientations of tetR were obtained. After functional test of both orientations (transient
transfections and GFP spectrophotometric measurement) the plasmid with the reverse
orientation of tetR was used for further work. Similarly NotI restriction site was used to
linearize this construct.
26
2 Material and methods
2.2.1.6 Principles of Tetracycline-regulated expression system
Tetracycline (Tet) regulated expression system is based on two separate vectors. The
response vector (pTRE2 or pTRE2hyg) contains tetracycline responsive element (TRE)
upstream of the inherently inactive minimal CMV promoter (CMVmin) and multiple cloning
site (MCS). Binding of tetracycline receptor to TRE element activates the promoter and leads
to transcription of the gene cloned in the MCS.
Regulation of the system is achieved through vectors coding for different types of tetracycline
receptors: pTet-On – codes for a receptor which binds to TRE element and activates
transcription in the response vector only in the presence of doxycycline; pTet-Off – codes for
a tetracycline receptor which binds TRE element in the absence of tetracycline, so
administration of the antibiotic stops transcription.
Originally, tetracycline was used to control this system. However the Tet-Off system is
equally inducible with doxycycline (Dox), while the mutated version of Tet-Off is responsive
only to doxycycline. Moreover there are some other more important reasons to use Dox: it has
longer half-life and much lower concentrations of Dox are required to operate the system.
Therefore, doxycycline was used in all experiments as well as, when required, during
animals’ maintenance. Principles of Tet-regulated expression system are shown on Fig. 1.
27

2 Material and methods
Clontech 2001
Fig. 1. Schematic representation of tetracycline regulated gene expression system. Doxycycline is used instead of tetracycline. Abbreviations: PCMV – CMV promoter, tTA – tetracycline controlled transactivator, rtTA – reverse tTA, rtetR – Tet repressor protein, VP16 – Herpes simplex virus VP16 activation domain, TRE - tetracycline responsive element, PminCMV – minimal CMV promoter, Dox – doxycycline
2.2.2 Cell culture methods
2.2.2.1 Basic maintenance
C3H/10T1/2 and Phoenix cell lines were grown in D-MEM (1,000 mg/ml glucose)
medium containing 10% FCS, 100 U/ml of penicillin, 100 µg/ml of streptomycin and 0,292
mg/ml L-glutamine.
Cells transiently transfected with pTet-On/Off and pTRE2hyg/SODex plasmids as
well as cell lines stably transfected with pTet-Off and double-stable pTet-OFF/
pTRE2hyg/SODex were cultivated in identical medium except that instead of FCS Tet
System Approved FBS was used.
28

2 Material and methods
Cells were grown for 2-3 days to 80-90% confluence in humidified atmosphere
containing 10% CO2 at 37° C. Cells were detached from dishes with trypsin solution (0.05%
trypsin, 0.02% EDTA in 1×PBS) and split 1 to 6.
Frozen stocks were made in freezing medium: 20% FCS and 10% DMSO in D-MEM.
2.2.2.2 Primary fibroblast culture
Nineteen 14 days old embryos were isolated from two SOD+/- pregnant females
crossed with SOD+/- male. Heads of the embryos were cut off and saved for DNA extraction.
Organs were dissected and the carcasses transferred to separate, fresh 6-cm plates filled with
0.25% trypsin in HEPES/EDTA buffer. Each embryo was chopped to tiny pieces with
a sterile scalpel and then incubated for 40 minutes in the cell culture incubator. Next, tissues
were disaggregated by vigorous pipetting and returned to the incubator for 10 minutes. Then
the volume was made to 20 ml with Mouse Embryonic Fibroblast (MEF) medium i.e.
D-MEM (4,500 mg/ml glucose) medium containing 15% FCS, 100 U/ml of penicillin, 100
µg/ml of streptomycin and 0,292 mg/ml L-glutamine. Each pool of cells was transferred to
separate 15-cm plate. After overnight incubation fibroblasts attached to the cell culture plate
and debris was removed by aspirating the medium. Fresh medium was added and the cells
were grown to 90% confluency. In the meantime MnSOD locus genotype of each embryo was
determined according to the procedure described under 2.2.6.2. Primary cell lines of interest
were expanded and frozen stocks were made at passage 2.
For further work cells were cultured in D-MEM (1,000 mg/ml glucose) medium containing
10% FCS, 100 U/ml of penicillin, 100 µg/ml of streptomycin and 0,292 mg/ml L-glutamine.
Cells were grown for 2-3 days to 90% confluence in humidified atmosphere containing 3%
oxygen and 10% CO2 at 37° C. Cells were detached from dishes with trypsin solution (0.25%
trypsin in HEPES/EDTA buffer) and split 1 to 3.
2.2.2.3 Transient transfections
2.2.2.3.1 Calcium phosphate
On the day before transfection cells were trypsinized and plated at 10 000 – 15 000 cells
per cm2 (C3H/10T1/2) or 30 000 cells per cm2 (Phoenix). Typically 6-well plates were used.
Next day cells should reach 60-70% confluence. 3 hours before transfection medium was
29
2 Material and methods
aspirated and changed to fresh growth medium. 30 minutes before transfection the following
coctail was prepared: 5 µg plasmid DNA and 750 µl HBS (100 mM NaCl, 6.5 mM KCl, 0.8
M Na2HPO4 ⋅ 2H2O, 210 mM HEPES) pH 7.05. To this mixture 48 µl of 2 M CaCl2 was
added dropwise and shaked after each drop. Transfection coctail was incubated for 30 minutes
at room temperature. After incubation, coctail was transferred to a single well of a 6-well
plate in dropwise fashion. After 12-16 hours medium was changed. Cells were photographed
or collected by trypsinization after 24-72 hours.
2.2.2.3.2 Electroporation
On the day of electroporation cells were 70-80% confluent. Cells were detached with
trypsin, centrifuged and 2 mln cells were suspended in 400 µl of electroporation buffer: Opti-
MEM and cytosalts (1 M KCl, 10 mM CaCl2, 0.5 M K2HPO4 pH 7.6, 100 mM MgCl2) in 25
to 75 ratio. Up to 60 µg of plasmid DNA was added to this electroporation coctail and the
whole volume was transferred to 4 mm gap electroporation cuvettes. Electroporation was
performed in BTX ECM 600 electroporator with the following settings:
Low Voltage Mode
Voltage: 475 V
Pulse Length: 1 millisecond
Number of Pulses: 4
Cells were plated in 10-cm plates 5-10 min. after pulsing. After 12-16 hours medium was
changed. Cells were photographed or collected by trypsinization after 24-72 hours.
2.2.2.4 Double-stable cell line generation
C3H/10T1/2 cells were transfected with 1 µg of pTet-Off by means of standard
electroporation protocol except that cells were plated in 3 separate 10-cm plates at
concentrations: 50, 100 and 200 thousand per plate. The following day medium was replaced
with selection medium i.e. standard growth medium supplemented with G418 at 1 mg/ml
concentration. Medium was replenished every second day. Cells were cultivated for 10-14
days until considerable number of large colonies was obtained. Single colonies were isolated
by trypsinization in cloning cylinders. Each trypsinized colony was transferred to single well
of a 96-well plate and expanded in standard growth medium containing 0.5 mg/ml G418.
30
2 Material and methods
29 stable clones were isolated and screened for the presence of integrated plasmid by
Southern blot hybrydization with a probe specific for neomycin resistance gene.
9 stable clones were subjected to functional screening to test inducibility of the Tet-Off
system: cells were transiently transfected with pTRE2hyg/SODex plasmid by the standard
electroporation protocol. Following electroporation cells were split to two 6-cm dishes and
allowed to grow in the presence or absence of doxycycline at 1 µg/ml. Cells were collected by
trypsinization when they reached confluence and proteins were extracted according to the
described procedure (see 2.2.4.1). Then intensity of fluorescence of EGFP reporter molecule
was determined in protein extracts in Hitachi F-2000 fluorescence spectrophotometer set at:
excitation – 488 nm, emission – 509 nm. EGFP Relative Fluorescence Units (RFU) were
normalized to the protein concentration. Normalized values for cells grown without
doxycycline (induced state) were related to cells grown in the presence of the drug (repressed
state). These ratios were compared between all analyzed clones. The clone with the highest
induction of expression and the lowest background (clone OFF2) was selected for the next
transfection.
OFF2 cell line was stably transfected with 1 µg of XhoI linearized pZK/SOD plasmid. All
procedures were carried out as mentioned above except that selection medium contained
0.5 mg/ml G418 and 800 µg/ml Hygromicin B. Following selection and thereafter double-
stable clones were grown in selection medium containing 0.5 mg/ml G418 and 200 µg/ml
Hygromicin B. Clones were subjected to functional screening procedure as described above.
Four double-transfected clones with the highest expression induction and the lowest
background were selected and grown for few weeks. During this period EGFP fluorescence
was monitored under the fluorescence microscope and the clone showing the most stable and
consistent expression of the transgene was chosen for further experiments.
2.2.2.5 Mouse embryonic stem cells culture
2.2.2.5.1 Preparation of mitomycin C treated MEFs
Mouse embryonic fibroblasts (MEFs) were isolated as described in 2.2.2.2 from
a neomycin resistant mouse strain. One frozen stock was thawed in a 10-cm plate. After the
cells reached 90% confluence they were detached with 0.25% trypsin in HEPES/EDTA buffer
and plated on 15-cm plate which after reaching 90% confluence was split to three 15-cm
plates. Subsequently cells from three 15-cm plates were collected and plated on ten 15-cm
31

2 Material and methods
dishes. Day after the cells reached 90% confluence MEF medium was replaced with 5% FCS
MEF medium supplemented with Mitomycin C at 10 µg/ml and incubated for 2-4 hours in
cell culture incubator. Then cells were washed two times with HEPES buffer and collected
by trypsinization. 3 frozen stocks of ready to use feeder cells were made from each 15-cm
plate. Typically 1-2 frozen stocks were plated on one 10-cm plate, 6-well plate, 24-well plate
or 96-well plate.
2.2.2.5.2 Basic maintenance
Tissue culture plates used in embryonic stem (ES) cells culture were routinely covered
with 0.2% gelatine in water. Then this solution was aspirated and feeder cells (protocol
2.2.2.5.1) were plated a day before planned ES cells plating. Throughout the work with ES
cells ES-medium was used. Cells were grown for 3-4 days in humidified atmosphere
containing 10% CO2 at 37° C. Medium was changed every day. Before trypsinization cells
were washed with HEPES buffer and detached with 0.25% trypsin in HEPES/EDTA buffer.
ES cells were split 1:6.
2.2.2.5.3 Electroporation of ES cells
For electroporation ES cells were split 1:4 and grown for 2 days. Two hours before
electroporation cells were fed with fresh medium. Then cells were detached and counted in
hemacytometer. 13-16 mln cells were suspended in 600 µl of Opti-MEM medium and
transferred to 4 mm gap electroporation cuvette. 25 µg of linearized pTG/TRE or pTG/TRE
tetR plasmid in 100 µl of Opti-MEM was added to cells and mixed. Electroporation was
performed under the following conditions:
Low Voltage Mode
Voltage: 250 V
Pulse Length: 1 millisecond
Number of Pulses: 1
Cells were resuspended in ES-medium 10 min. after pulsing. Then cells were plated in 10-cm
dishes as follows: 3 plates with 4 mln cells each and 2 plates with 0.7 mln cells each. 24 hours
after transfection medium was changed to selection medium: ES-medium supplemented with
G418 at 400 µg/ml. Henceforth medium was changed daily and growth of ES colonies was
monitored for 10-14 days.
32
2 Material and methods
2.2.2.5.4 Isolation of recombinant ES cell clones
Once colonies reached appropriate size they were picked with tips mounted on 50 µl
automatic pipette. Only colonies with irregular shape and sharp boundaries were picked.
Those, showing signs of differentiation (dark center surrounded with light ring and growing
upwards) were not collected. Shortly before picking of clones medium was aspirated and
replaced with HEPES/EDTA buffer. Open dishes were placed under inverted microscope and
clones were picked with the help of the microscope and transferred to V-bottomed 96-well
plate filled with 0.25% trypsin in HEPES/EDTA buffer. After picking of 16 colonies the 96-
well plate was incubated for 10 min. in cell culture incubator. Then colonies were dissociated
by vigorous pipetting and transferred to previously prepared flat bottom 96-well plate with
feeder cells. Thereafter ES-medium without G418 was used. All the operations were done
under tissue culture hood.
After 3-4 days of growth ES clones were split. Trypsinized cells were divided 1:4 i.e.
one part was trasferred to previously prepared 24-well plate with feeder cells and four parts
left in 96-well plate were mixed with freezing medium, covered with mineral oil and frozen at
-80° C. From these frozen stocks only selected clones with successfully targeted locus were
expanded and used in balstocyst injections. ES clones in 24-well plates were grown for 7-10
days until they reached confluence. As these cells were used only for DNA isolation medium
was not changed during their growth.
2.2.2.5.5 DNA extraction from ES cells
24-well plates with confluent ES cells were washed with 1×PBS and covered with 500
µl of ES-lysis buffer. Cells were incubated in cell culture incubator for 24-72 hours. Then
plates were shaked for 1 hour at room temperature. After that 500 µl of isopropanol was
added and plates were shaked for next 1 hour. Finally, white DNA precipitate was lifted with
a needle bent at the end and transferred to 1.5 ml tubes with 100 µl TE buffer. DNA was
dissolved overnight at 55° C with shaking. ES clones were screened for desired recombination
by PCR and Southern blot hybridization (see 2.2.6).
33

2 Material and methods
2.2.3 ROS measurement by Fluorescence Activated Cell Sorting (FACS)
Cells were cultured in triplicates on 6-cm plates. For FACS analysis they were
detached with trypsin and washed with PBS two times. Then cells were resuspended in 0.5-
1 ml of prewarmed HBS medium with carboxy-H2DCFDA at 5 µM and incubated for
30 minutes at 37° C. Then cells were transferred to ice and 2 µl of propidium iodide (PI) at
100 µg/ml was added immediately before analysis. Cells were sorted in FACSFlow cytometer
(Becton Dickinson) and data were analyzed in CellQuest™ software. Instrument calibrations
were performed on unstained and stained with single dye cells. FACS settings were as
follows:
Detector Voltage AmpGain Mode FSC E-1 6.55 log SSC 272 1.00 log FL-1 420 1.00 log FL-2 430 1.00 log
Thershold: Compensation: Parameter: FSC FL-1 – 1.0% FL-2 Value: 52 FL-2 – 21.0% FL-1
Fluorescence was analyzed in the continuous presence of both dyes. Carboxy-H2DCFDA was
analyzed in FL-1 channel, PI in the FL-2 channel. PI was used to exclude non-viable cells
from analysis.
2.2.4 AOE’s activity methods
2.2.4.1 Protein extraction
Cells from confluent 15-cm plate were resuspended in 100-150 µl cell homogenization
buffer pH 7.2 and homogenized with a handheld teflon homogenizer. Then the homogenate
was subjected to two cycles of freezing and thawing followed by 10 minutes centrifugation at
600×g at 4° C. Supernatant was transferred to new tubes, aliquoted and stored at -80° C.
Tissues were weighted and appropriate volume of tissue homogenization buffer pH 7.2
was added to make a 4-5% (w/v) solution. Ultra Turrax (IKA Works) homogenizer was used
for disintegration of heart tissue and teflon homogenizer for brain and liver. All steps were
performed on wet ice. Then extracts were centrifuged at 600×g at 4° C. Supernatants were
saved, aliquoted and frozen at -80° C.
34
2 Material and methods
Protein concentration in extracts was determined according to the procedure provided
with Protein Assay ESL kit (Roche).
2.2.4.2 Superoxide Dismutase (SOD)
2.2.4.2.1 SOD activity gel
In gel SOD activity assay was done as described by Beauchamp and Fridovich (1971).
Native polyacrylamide gel was made of separating gel – 12% and stacking gel – 6%. Non-
denaturing loading buffer was mixed with 80-120 µg protein and loaded to a single well. The
gel was run for 2-3 hours at 15-20 mA. Following electrophoresis the gel was soaked in 2.45
mM NBT for 20 min. with gentle rocking. Then NBT was replaced with the solution:
TEMED 28 mM, riboflavin 0.028 mM, K-phosphate buffer pH 7.8 36 mM. If MnSOD was
visualized only KCN was added to this solution to final concentration 8 mM. Gel was
incubated in this solution for 15 min. with gentle rocking. Finally, the gel was briefly washed
with water and illuminated on light box for 15-30 min. until blue colour developed.
2.2.4.2.2 Cytochrome C method
In order to determine precisely SOD activities the method of inhibition of cytochrome c
reduction was used (McCord and Fridovich, 1969). Cytochrome c buffer was prepared as
follows: 50 mM potassium phosphate buffer pH 7.8, 50 µM xanthine and 0.248 mg/ml
cytochrome c. The optimal concentration of xanthine oxidase (XO) in the assay was
established by adding 12-20 µl of XO (0.8 U/ml) to 960 µl of cytochrome c buffer. Changes
of cytochrome c absorbance measured against cytochrome c buffer without XO were followed
during 3 min. incubation at 550 nm. Changes of absorbance in time (∆A550nm/min) from 60th
to 120th second were recorded every 10 seconds and the average value from 6 measurements
was calculated. ∆A550nm/min in the range of 0.023-0.025 was considered optimal for SOD
activity assay. Once the volume of XO giving this ∆A550nm/min range was established, it was
used throughout whole experiment.
For determination of total SOD activity in tissues 960 µl of cytochrome c buffer was mixed
with 12-20 µl of xanthine oxidase and 10-40 µl of tissue protein extract (to obtain
∆A550nm/min in the range 0.010-0.020). To differentiate between MnSOD and CuZnSOD
KCN was used to inhibit specifically cytosolic SOD. Inhibition was achieved by incubation of
the protein extract with 10 µl of 0.2 M KCN for 2 minutes.
35
2 Material and methods
Commercially available SOD of known activity was also measured and used to establish
a standard curve from which activities of unknown samples were read. CuZnSOD activity
was calculated by substracting MnSOD activity from total SOD. Hitachi U-2000
thermostatted spectrophotometer was set at kinetic mode. Assay was done at 30° C, each
sample was measured at least 3 times. Activities were normalized to protein concentration and
expressed in U/min/mg protein.
2.2.4.3 Catalase (CAT)
Catalase activity buffer was prepared as follows: 50 mM potassium phosphate buffer
at pH 7.2-7.4, 1 mM EDTA and 0.05% Triton X-100. Hydrogen peroxide was added to 990 µl
of catalase buffer to 10 mM final concentration and absorbance was read in a quartz cuvette at
260 nm. Absorbance in the range 0.4-0.45 was regarded as optimal for catalase activity
measurements. For determination of CAT activity in tissues 980 µl of buffer with hydrogen
peroxide was mixed with 20 µl of extracts. After 15 seconds incubation absorbance change in
time (∆A260nm/min) was measured against catalase buffer with the same amount of tissue
extract but without hydrogen peroxide. Reaction was followed for 2 minutes and average
read-outs were recorded. Obtained ∆A260nm/min values were in the range of 0.02-0.05. To
calculate units of CAT activity, it was assumed that decomposition of 1 µM of H2O2 gives
∆A260nm/min = 0.0394. Assay was done at room temperature, each sample was measured at
least 3 times on a Hitachi U-2000 spectrophotometer. Activities were normalized to protein
concentration and expressed in µmole/min/mg protein.
2.2.4.4 Glutathione Peroxidase (GPX)
Reaction buffer was prepared as follows:
48 ml of 75mM sodium phosphate buffer pH 7.0
1 ml of 60 mM reduced glutathione
2 ml of glutathione reductase (30 U/ml)
1 ml of 120 mM sodium azide
2 ml of 15 mM EDTA
2 ml of 3 mM NADPH
36
2 Material and methods
pH of this reaction buffer was adjusted to 7.0. All components of this mix as well as 1 mM
DTT solution were prepared in 75 mM sodium phosphate buffer pH 7.0. 933 µl of reaction
buffer was mixed either with 30 µl tissue extract or the same volume of 1 mM DTT (to
substract non-enzymatic glutathione oxidation) which served as reference cuvette. Reaction
was started with addition of 33 µl 7.5 mM H2O2. Decrease in absorbance at 340 nm was
followed for 5 minutes in Hitachi U-2000 spectrophotometer. ∆A340nm/min values in the range
of 0.02-0.05 were considered optimal for the reaction. GPX activity was calculated assuming
that millimolar extinction coefficient of NADPH is 6.22. Assay was done at room
temperature, each sample was measured at least 3 times. Activities were normalized to protein
concentration and expressed in nmole/min/mg protein.
2.2.5 General PCR and RT-PCR methods
2.2.5.1 Reverse transcription (RT)
Total RNA was extracted with TRIzol reagent according to manufacturer’s protocol.
Concentration of RNA was determined with Eppendorf BioPhotometer by measuring
absorbance at 260 nm and assuming that 1 unit of absorbance corresponds to 40 µg of RNA.
In the first step, RNA extract was purified from DNA contamination:
3 µg total RNA 1 µl RQ1 RNase-Free DNase 10×buffer 1 µl RQ1 RNase-Free DNase [1 U/µl]
to 10 µl water
Incubation at 37° C for 30 minutes followed by addition of 1 µl of Stop Reaction buffer and
incubation at 65° C for 10 minutes.
Then 1 µg of DNase-treated RNA (3.5 µl from above reaction) was reverse transcribed:
3.5 µl DNase-treated RNA
1 µl oligo d(T)12-18 [500 µg/ml] 5 µl dNTP’s [2 mM] 3 µl water
12.5 µl total
37
2 Material and methods
This coctail was incubated at 65° C for 10 minutes and then immediately placed on ice.
Following reagents were added to the above mix:
4 µl RT SSII buffer [5× conc.] 2 µl DTT [0.1 M]
0.5 µl RNasin [40 U/µl]
1 µl Super Script II Reverse Transcriptase [200 U/µl]
20 µl total
RNA was reverse transcribed for 1 hour at 42° C followed by incubation at 70° C for 15
minutes. Obtained cDNA was used immediately in PCR reaction or frozen at -20° C.
2.2.5.2 Polymerase chain reaction (PCR)
Typical PCR reaction was done as follows:
1.5 µl Taq buffer [10×, with 15 mM MgCl2] 1.5 µl dNTP’s [2 mM]
3 µl TaqMaster PCR Enhancer [5×] 0.15-0.3 µl forward primer [10 µm] 0.15-0.3 µl reverse primer [10 µm]
1-3 µl DNA 0.15 µl Taq DNA Polymerase [5 U/µl]
to 15 µl water
All PCR conditions were optimized experimentally for each primer pair. When necessary
MgCl2 was added to final concentration of 2-5 mM. Thermal cycling conditions were also
optimized empirically.
2.2.5.3 Reverse transcription - Polymerase chain reaction (RT-PCR)
Reactions were performed as in 2.2.5.2 except that typically 3 µl of cDNA from
2.2.5.1 was used as template.
38
2 Material and methods
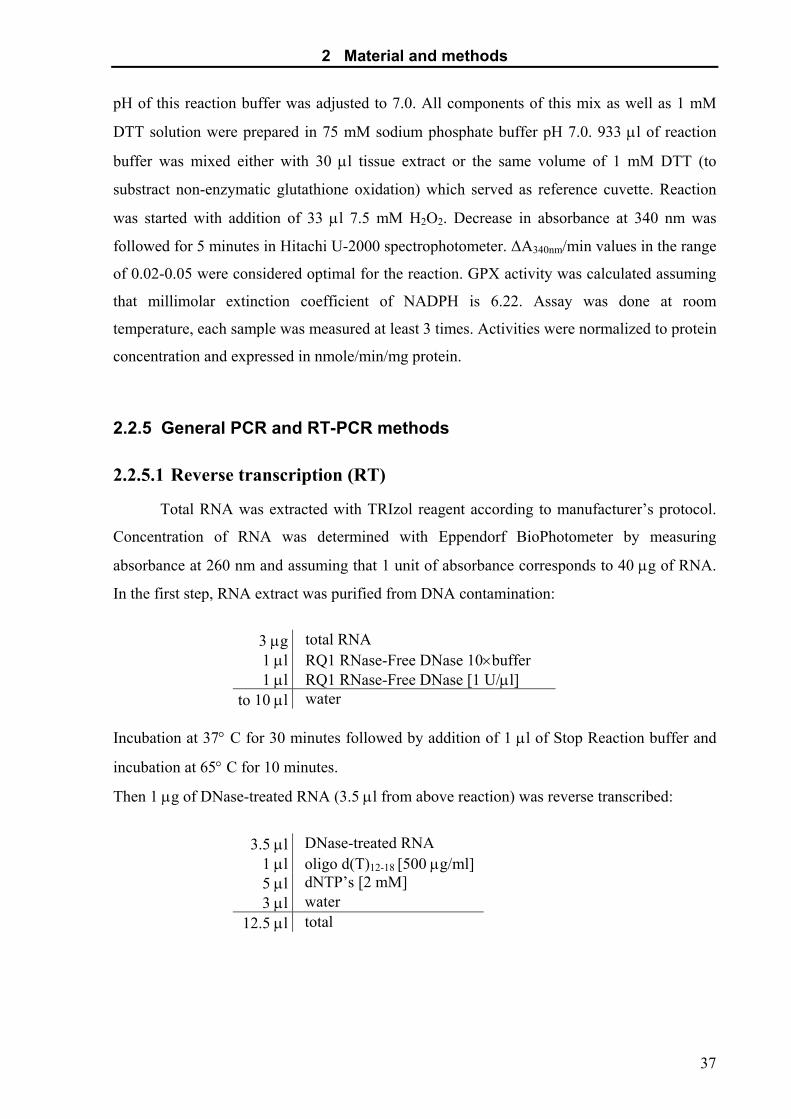
2.2.6 Genotyping of recombinant ES cells and transgenic mice
2.2.6.1 Tail DNA isolation
Approximately 5 mm tip of a tail was immersed in 0.5 ml tail lysis buffer and
incubated overnight at 56° C with shaking. Next day samples were centrifuged for 10 min. at
13 000 rpm. DNA was precipitated from supernatant with 0.5 ml isopropanol, centrifuged at
13 000 rpm for 15 min. and pellet was washed with 70% ethanol, dried and dissolved in 100
µl TE.
2.2.6.2 PCR
SOD locus
Two primer pairs were employed. External primers allowed the detection of
successful targeting of the MnSOD locus with targeting construct. The forward primer
was designed to bind sequence upstream of the modified region. This pair of primers
was used to screen neomycin resistant ES cell clones in search for desired
recombination events. Occasionally they were also used in verification of
homozygosity in transgenic mice. PCR amplification with external primers produced
a specific 2.7 kb band.
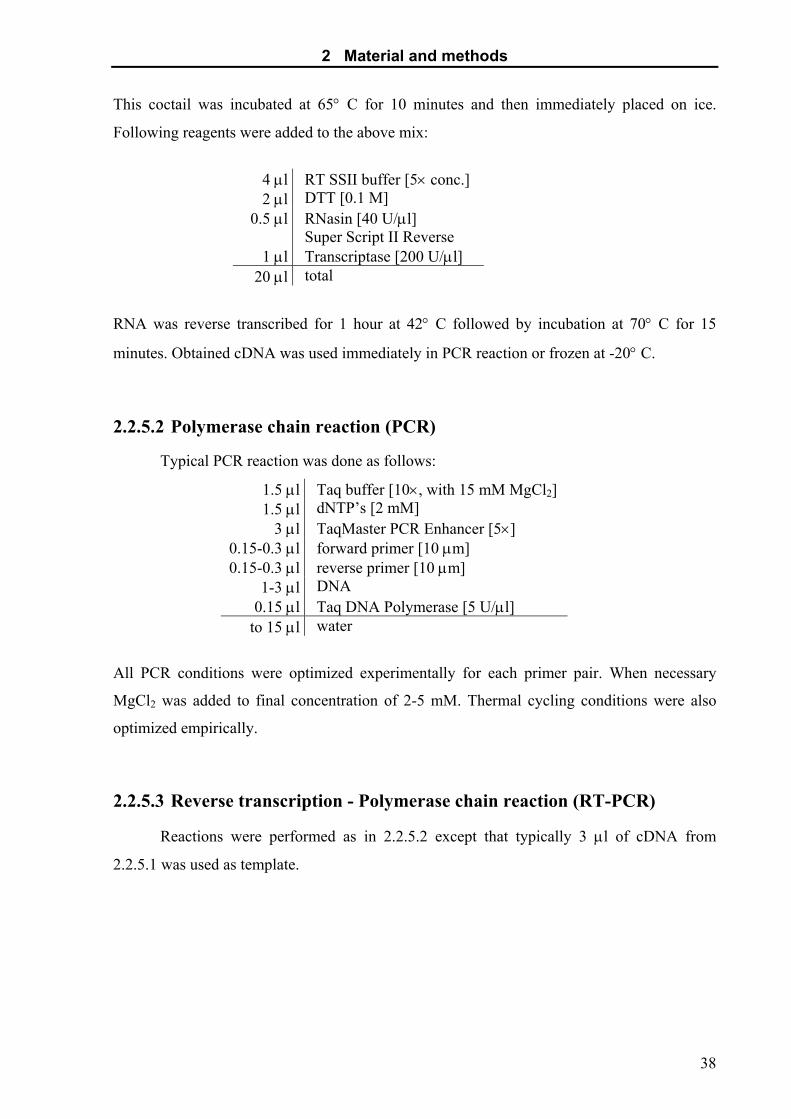
Internal primers are complementary to sequences in two neighbouring exons to
allow discrimination between cDNA in targeting construct and DNA of native
MnSOD locus. These primers produced 226 bp and 340 bp bands, respectively. They
were mainly used to assess genotype of transgenic mice.
Prior PCR reactions tail or ES cell DNA was diluted in water 1:10.
external primers
39
2 Material and methods
PCR: Profile: “touch-down”
10x Taq buffer 1.5 µl2mM dNTP’s 1.5 µl5x enhancer 3 µl10µM 5’gt-for2 0.3 µl10µM 5’gt-Neo 0.3 µlDNA [1:10] 1 µlTaq Pol [5U/µl] 0.15 µlwater 7.25 µltotal 15 µl
95º C – 7 min. 95º C – 1 min. 65º, 63º, 61º, 59º, 57º, 55º C – 45 sec. 2 cycles each 72º C – 3 min. 10 sec. 95º C – 1 min. 53º C – 45 sec. 23 cycles 72º C – 5 min. 72º C – 10 min.
internal primers
PCR Profile:
10x Taq buffer 1.5 µl2mM dNTP’s 1.5 µl25mM MgCl2 1.5 µl5x enhancer 3 µl10µM SOD orf E1 0.15 µl10µM ex2-rev 0.15 µlDNA [1:10] 1 µlTaq Pol [5U/µl] 0.15 µlwater 6.05 µltotal 15 µl
95º C – 7 min. 95º C – 45 sec. 65º C – 20 sec. 40 cycles 72º C – 30 sec. 72º C – 10 min.
40
2 Material and methods
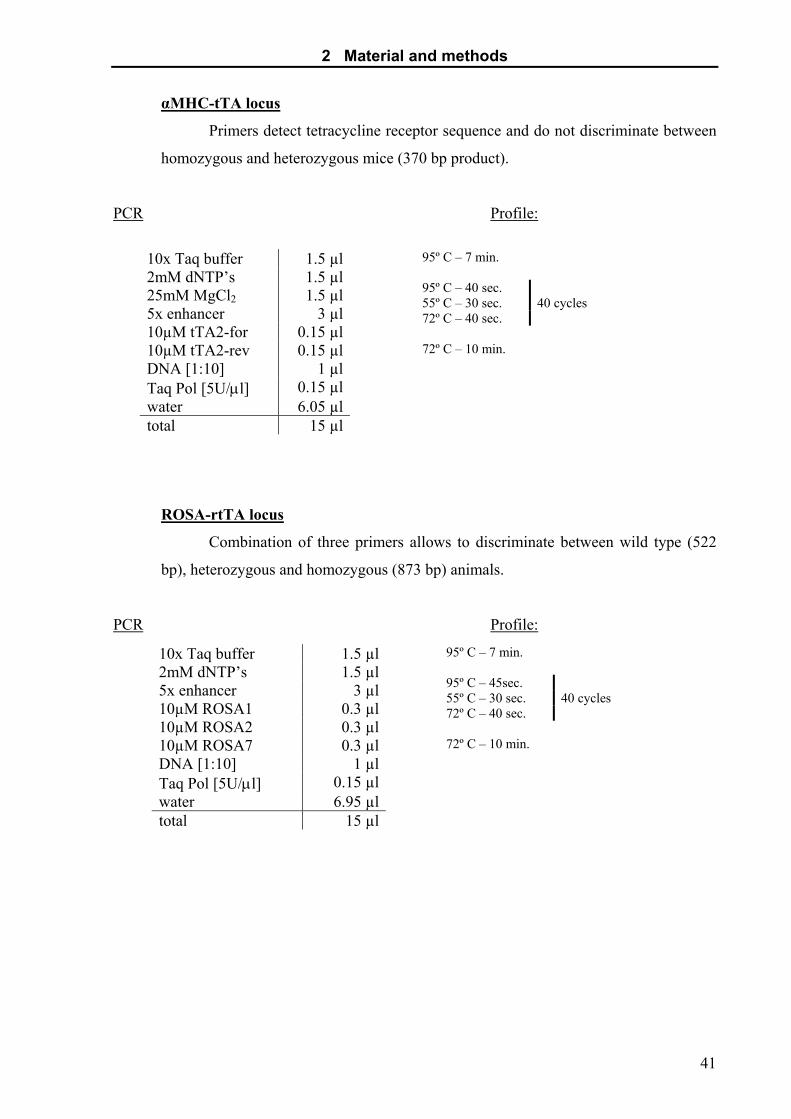
αMHC-tTA locus
Primers detect tetracycline receptor sequence and do not discriminate between
homozygous and heterozygous mice (370 bp product).
PCR Profile:
10x Taq buffer 1.5 µl2mM dNTP’s 1.5 µl25mM MgCl2 1.5 µl5x enhancer 3 µl10µM tTA2-for 0.15 µl10µM tTA2-rev 0.15 µlDNA [1:10] 1 µlTaq Pol [5U/µl] 0.15 µlwater 6.05 µltotal 15 µl
95º C – 7 min. 95º C – 40 sec. 55º C – 30 sec. 40 cycles 72º C – 40 sec. 72º C – 10 min.
ROSA-rtTA locus
Combination of three primers allows to discriminate between wild type (522
bp), heterozygous and homozygous (873 bp) animals.
PCR Profile:
10x Taq buffer 1.5 µl2mM dNTP’s 1.5 µl5x enhancer 3 µl10µM ROSA1 0.3 µl10µM ROSA2 0.3 µl10µM ROSA7 0.3 µlDNA [1:10] 1 µlTaq Pol [5U/µl] 0.15 µlwater 6.95 µltotal 15 µl
95º C – 7 min. 95º C – 45sec. 55º C – 30 sec. 40 cycles 72º C – 40 sec. 72º C – 10 min.
41
2 Material and methods
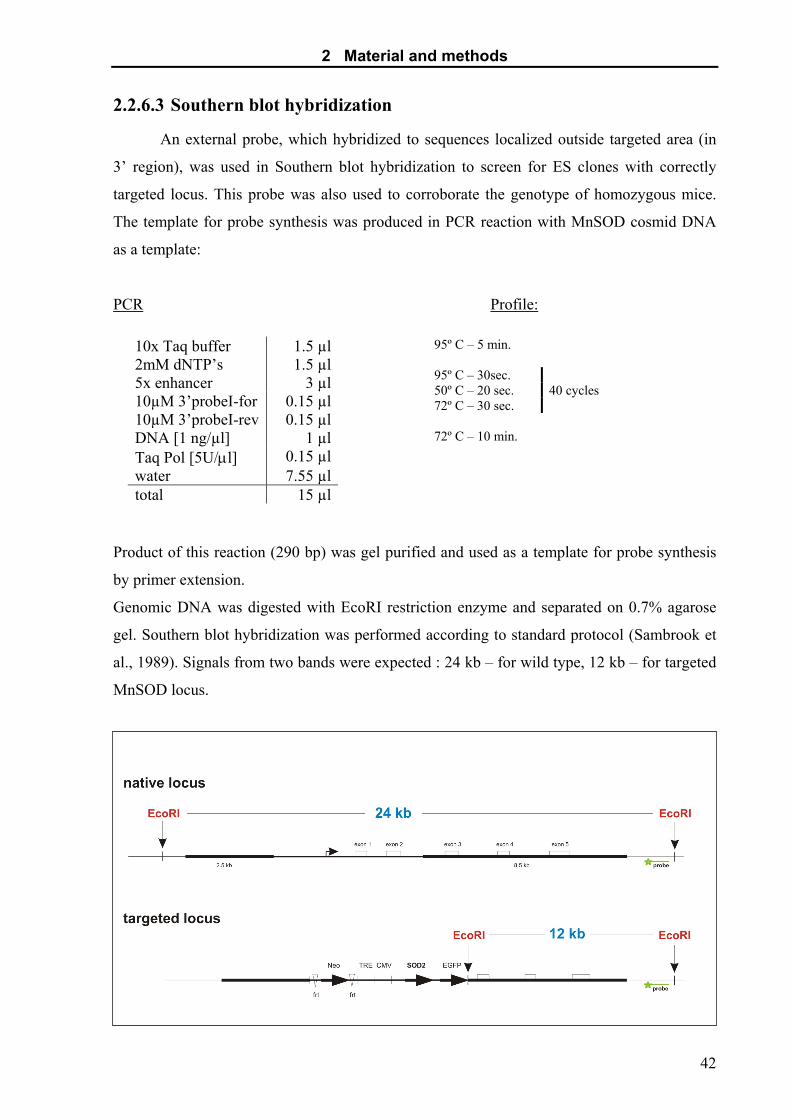
2.2.6.3 Southern blot hybridization
An external probe, which hybridized to sequences localized outside targeted area (in
3’ region), was used in Southern blot hybridization to screen for ES clones with correctly
targeted locus. This probe was also used to corroborate the genotype of homozygous mice.
The template for probe synthesis was produced in PCR reaction with MnSOD cosmid DNA
as a template:
PCR Profile:
10x Taq buffer 1.5 µl2mM dNTP’s 1.5 µl5x enhancer 3 µl10µM 3’probeI-for 0.15 µl10µM 3’probeI-rev 0.15 µlDNA [1 ng/µl] 1 µlTaq Pol [5U/µl] 0.15 µlwater 7.55 µltotal 15 µl
95º C – 5 min. 95º C – 30sec. 50º C – 20 sec. 40 cycles 72º C – 30 sec. 72º C – 10 min.
Product of this reaction (290 bp) was gel purified and used as a template for probe synthesis
by primer extension.
Genomic DNA was digested with EcoRI restriction enzyme and separated on 0.7% agarose
gel. Southern blot hybridization was performed according to standard protocol (Sambrook et
al., 1989). Signals from two bands were expected : 24 kb – for wild type, 12 kb – for targeted
MnSOD locus.
42

2 Material and methods
2.2.7 Tissue sections
2.2.7.1 Paraffin embedding and sectioning
After excision organs were thoroughly washed in ice-cold PBS and fixed in 4% PFA
in PBS overnight. Then dehydration was performed as follows: 1 hour in 25% EtOH, 1 hour
in 50% EtOH, 1 hour in 75% EtOH, 1 hour in 96% EtOH, then 100% EtOH two times
10 minutes followed by overnight incubation in 100% EtOH at -20° C. On the next day
organs were soaked in EtOH/xylol (1:1) for 1 hour, followed by two 1 hour washes in xylol,
2 hour wash in xylol/paraffin (1:1) at 60° C and overnight incubation in xylol/paraffin (1:1) at
room temperature. The following day tissues were incubated in xylol/paraffin (1:1) at 60° C
for 1 hour and then washed two times (1 hour incubations) with paraffin at 60° C. Finally,
tissues were embedded in paraffin. Tissue sections (7-15 µm thick) were cut from paraffin-
embedded blocks on Leica microtome and mounted from warm water (40°C) onto adhesive
microscope slides (prepared with Vectabond). Sections were allowed to dry on heating block
(40° C) for 1-4 hours and then stored at room temperature.
2.2.7.2 Cryosectioning
Immediately after excision and washing in ice-cold PBS organs were embedded in
Polyfreeze™ Tissue freezing medium™. Sections (8-40 µm thick) were cut with Leica
cryotome and immediately mounted on adhesive microscope slides. Then sections were
briefly fixed (15 minutes) in 4% PFA in PBS, washed in PBS and subjected to SA-β-Gal
staining.
2.2.8 In situ hybridization
2.2.8.1 Probe synthesis
Riboprobe was synthesized in the following reaction mix:
1 µg linearised plasmid 4 µl 5× transcription buffer 2 µl DTT [0.1 M] 2 µl Dig-Mix 1 µl RNA polymerase (T3,T7 or Sp6) 1 µl RNasin [40 U/µl]
to 20 µl water
43

2 Material and methods
Reaction was incubated at 37º C for 2 hours. Next DNA template was digested with DNase I
for 30 min. at 37º C and inactivated at 65º C for 15 min. The probe was ethanol precipitated
and redissolved in water supplemented with RNasin. Quality of cRNA was checked on 1%
agarose gel.
2.2.8.2 In situ hybridization
The procedure involved preparation of slides for hybridization, hybrydization,
posthybridization wash and staining. Preparation of slides for hybridization consisted of the
following steps performed at room temperature:
99.8% Ethanol 2 min. 99.8% Ethanol 2 min. 96% Ethanol 1 min. 70% Ethanol 1 min. 50% Ethanol 1 min. 30% Ethanol 1 min. PBS 5 min. 4% PFA 15 min. PBS 5 min. Proteinase K (10µg/ml) 5 min. Glycine (2mg/ml) 10 min. PBS 5 min. 4% PFA 15 min. Acetic Anhydrate/0.25% TEA/H2O 10 min. 2x PBS 5 min. Hybridization Buffer 15 min. at 65º C Hybridization overnight at 65º C
Hybridization was performed overnight at 65º C in hybridization buffer containing 1-5 µl of
synthesized riboprobe per 1 ml. Then slides were washed 3 times in solution I at 65º C for 15
min. each, 3 times in solution III at 65º C for 15 min. each, 3 times in TBST at room
temperature for 10 min. each and once in blocking solution at room temperature for 30 min.
Then slides were incubated with anti-digoxygenin antibody (1:2000) in TBST at 4º C
overnight. Next day antibody was washed away by washing 3 times in TBST 15 min. each
and 3 times NTMT 10 min. each. Staining solution contained NBT/BCIP (4.5 µl and 3.5 µl
respectively) in NTMT. Staining was performed in darkness until desired intensity was
achieved.
44
2 Material and methods
2.2.9 Senescence Associated β-Galactosidase staining (SA-β-Gal)
Accelerated senescence in cells was achieved as follows. Cells were plated at density
of 100 000 per well of a 6-well plate. Next day doxorubicin was added to medium to final
concentration 200 – 800 nM. After two days incubation medium was replaced with fresh
medium containing doxorubicin. On the third day cells were given fresh medium without
doxorubicin and allowed to recover for the following 4 days with medium changes every
second day.
SA-β-Gal staining was essentially performed as described in Dimri et al. (1995). Cells were
washed 2 times with PBS and fixed in 5% formalin in PBS for 5 minutes. After fixation cells
were washed with PBS 2 times. Then SA-β-Gal staining solution was applied: 40 mM sodium
phosphate pH 6.0, 5 mM potassium ferrocyanide, 5 mM K-ferricyanide, 150 mM NaCl, 1 –
4 mg/ml X-gal. Cells were stained for 48 – 96 hours. The reaction was stopped with PBS.
2.2.10 Immunoprecipitation
Protein A sepharose was equilibrated by washing three times in washing buffer:
250 mM NaCl, 0.25% NP-40, 10 mM Tris⋅HCl pH 7.5, 5 mM EDTA. 25 µl of typical protein
extract from cells was incubated with 10 µl of purified anti-myc 9e10 monoclonal antibody at
room temperature for 20 minutes. Then 100 µl of washing buffer and 40 µl of equilibrated
Protein A sepharose were added and immunoprecipitation was carried out at 4° C with
rotation overnight. Next day sepharose beads were washed 4 times with 500 µl of washing
buffer. Finally beads were mixed with 25 µl of SDS-loading buffer, denatured at 95° C for
5 minutes and loaded on SDS-gel.
2.2.11 In-situ anti-myc staining
Cells remaining on plates were washed 2 times with PBS and then fixed with 70%
methan ol/30% aceton mixture for 5 minutes at room temperature. Then cells were washed
3 times with PBS/ 0.1% Triton X-100. Next cells were incubated overnight at 4° C with 2 ml
of anti-myc 9e10 monoclonal antibody diluted in 1 ml PBS/ 1% horse serum. After that cells
were washed 4 times (5 minutes each) with PBS containing 0.1% Triton X-100 and 1% BSA.
Then incubation with biotinylated secondary antibody (1:600 in PBS with 1% horse serum)
was performed at room temperature for 60 minutes. Cells were washed 2 times (5 minutes
45
2 Material and methods
each) in PBS with 0.1% Triton X-100 and 1% BSA. Then again washed 2 times in
PBS/0.1% Triton X-100 and two times in PBS. After washings cells were incubated with
ABC solution (2 drops of ‘label A’ and 2 drops of ‘label B’ in 5 ml PBS prepared 30 minutes
in advance, Vector Laboratories) for 30 minutes. Specimens were washed with PBS 4 times
(5 minutes each) and incubated with staining solution: 2.5 mg/ml DAB in 10 ml 0.1 M
Tris⋅HCl pH 7.2 with 5 µl 30% H2O2. Staining was stopped by replacing DAB solution with
PBS.
2.2.12 Western blotting
Proteins were separated on standard denaturing SDS-PAGE gels. Stacking gel was
6%, separating gel – 12%. 15-50 µg of crude protein extract was loaded per well. Upon
completion of electrophoresis proteins were transferred onto nitrocellulose membrane by
semi-dry electroblotting (Fastblot B 43, Biometra). 4 pieces of Whatman 3MM paper and
1 piece of BioTrace® Nitrocellulose Membrane were cut to the size of the gel and together
with the gel they were soaked for few minutes in electroblotting buffer. Two layers of 3MM
paper were placed on the anode. On top of the pile a nylon membrane was placed. Gel was
laid on the membrane and covered with 2 layers of 3MM paper. The whole stack was covered
with the cathode and pressed. Electroblotting was run at a current of 5 mA per cm2 of the blot
for 45 minutes. The membrane was blocked in 1% non-fat dry milk in TBST solution for 1-2
hours at room temperature. Next the membrane was incubated at 4° C overnight with anti-
MnSOD rabbit polyclonal antibody diluted (1:10 000) in blocking buffer. Three 5 minutes’
washings in TBST preceded 1 hour incubation (room temperature) with biotinylated
secondary antibody (anti-rabbit IgG) diluted 1:600 in TBST with 1% horse serum. After 3
washings (5 minutes each) in TBST, the membrane was incubated with ABC solution (2
drops of ‘label A’ and 2 drops of ‘label B’ in 5 ml TBST prepared 30 minutes in advance,
Vector Laboratories) for 30 minutes. After that, the membrane was washed three times with
TBS buffer. Bound antibodies were detected with DAB (2.5 mg/ml) in 10 ml of 0.1 M
Tris⋅HCl pH 7.2 with 5 µl 30% H2O2. Staining was stopped by thorough rinsing of the
membrane in water.
46
2 Material and methods
2.2.13 Northern blotting
Procedure was performed essentially as described in Sambrook et al. (1989). 20 or 50
µg RNA was denatured in glyoxal mixture at 65° C for 10 minutes, chilled on ice, mixed with
RNA gel loading buffer and separated in 1.2% agarose gel in 1× BPTE. Electrophoresis was
run at 5V/cm of the gel. Then RNA was transferred onto a Biodyne® Nylon Membrane. The
hybridization probe (approximately 700 bp) for detection of MnSOD mRNA was synthesized
using the complete MnSOD cDNA as a template. cDNA was produced in standard PCR
reaction with primers: SODorf/E1 and SODorf/P1. The probe was synthesized by a primer
extension reaction. Signals from two bands were expected: 1 kb from native MnSOD mRNA
and 3.45 kb from targeting construct mRNA.
Blot was stripped and reprobed with GAPDH probe to provide a control for even loading and
integrity of RNA. Template for probe synthesis (primer extension) was made by standard
PCR with primers: 5’GAPDH and 3’GAPDH. Signal from 1.25 kb band was expected.
2.2.14 Echocardiography
Blinded studies were done in mice, which were anesthetized with 1.5% isoflurane.
Examination was performed with a 10MHz Toshiba PSK-70LT ultrasound probe during 10-
20 min. sessions. During that time, both 2-D and M-mode echocardiography were repeated 3
times for each mouse at midpapillary level.
In the 2-D echocardiography endocardial borders were traced at the end of diastole and
systole and thereby endsystolic area (ESA) and end-diastolic area (EDA) were determined. 2-
D image acquisition was performed at 168 frames per second. Heart rate (HR) during each
scanning was calculated as the mean value from three RR-distances during M-mode
measurements. Left ventricle internal diameter in systole and diastole (LVIDS and LVIDD)
was obtained from M-mode images. Left ventricle fractional area change (FAC) and fraction
shortening (FS) were calculated according to the following formulas:
FAC [%] = [(EDA–ESA)/EDA] × 100
FS [%] = [(LVIDD–LVIDS)/LVIDD] × 100
Ejection fraction (EF) was calculated according to Teichholz equation:
47

2 Material and methods
LVEDV = [7.0/(2.4 + LVIDD)] × LVIDD3
LVESV = [7.0/(2.4 + LVIDS)] × LVIDS3
EF [%] = [(LVEDV–LVESV)/LVEDV] × 100
2.2.15 Statistics
Unless otherwise stated all data are means ± SD. Statistical analysis was performed
using Statistica software (StatSoft). Student’s t tests were used. Data were considered
significant when p<0.05.
48