2 fact book 2007 08 students - cmu · lebanon 1 5309 macau 1 0001 malaysia 16 25023 mongolia 0 1001...
TRANSCRIPT

Student Enrollment
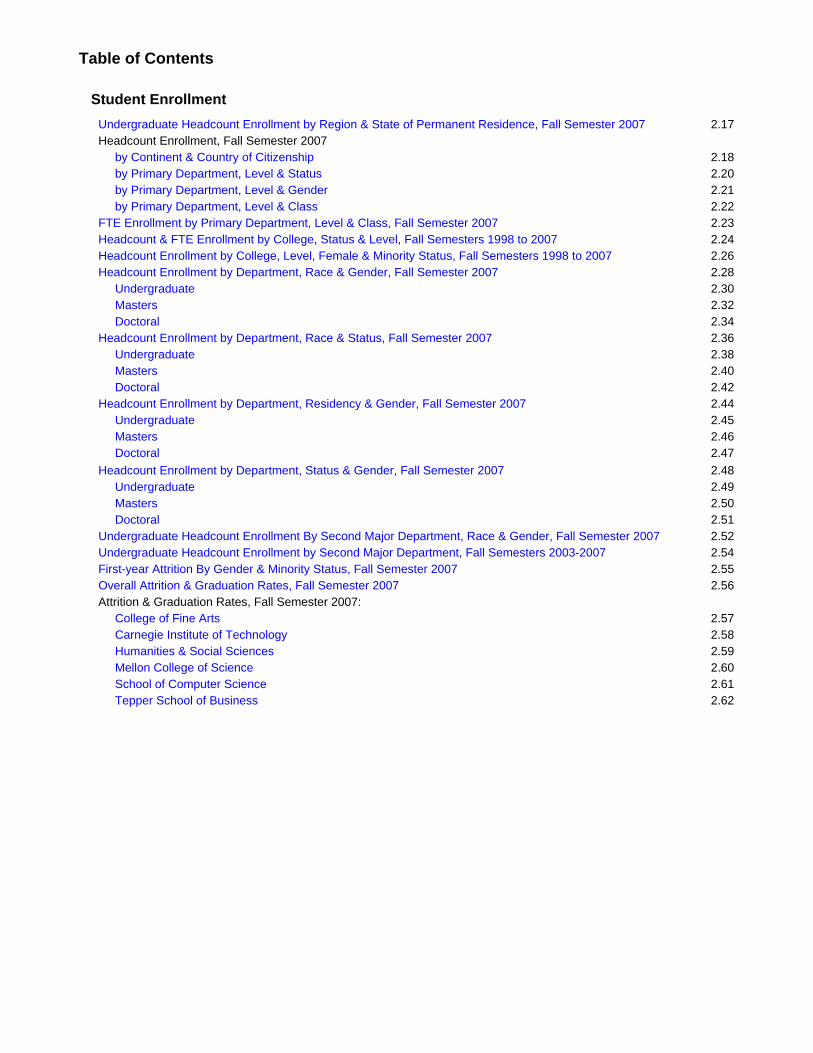
Table of Contents
Student Enrollment Undergraduate Headcount Enrollment by Region & State of Permanent Residence, Fall Semester 2007 2.17 Headcount Enrollment, Fall Semester 2007 by Continent & Country of Citizenship 2.18 by Primary Department, Level & Status 2.20 by Primary Department, Level & Gender 2.21 by Primary Department, Level & Class 2.22 FTE Enrollment by Primary Department, Level & Class, Fall Semester 2007 2.23 Headcount & FTE Enrollment by College, Status & Level, Fall Semesters 1998 to 2007 2.24 Headcount Enrollment by College, Level, Female & Minority Status, Fall Semesters 1998 to 2007 2.26 Headcount Enrollment by Department, Race & Gender, Fall Semester 2007 2.28 Undergraduate 2.30 Masters 2.32 Doctoral 2.34 Headcount Enrollment by Department, Race & Status, Fall Semester 2007 2.36 Undergraduate 2.38 Masters 2.40 Doctoral 2.42 Headcount Enrollment by Department, Residency & Gender, Fall Semester 2007 2.44 Undergraduate 2.45 Masters 2.46 Doctoral 2.47 Headcount Enrollment by Department, Status & Gender, Fall Semester 2007 2.48 Undergraduate 2.49 Masters 2.50 Doctoral 2.51 Undergraduate Headcount Enrollment By Second Major Department, Race & Gender, Fall Semester 2007 2.52 Undergraduate Headcount Enrollment by Second Major Department, Fall Semesters 2003-2007 2.54 First-year Attrition By Gender & Minority Status, Fall Semester 2007 2.55 Overall Attrition & Graduation Rates, Fall Semester 2007 2.56 Attrition & Graduation Rates, Fall Semester 2007: College of Fine Arts 2.57 Carnegie Institute of Technology 2.58 Humanities & Social Sciences 2.59 Mellon College of Science 2.60 School of Computer Science 2.61 Tepper School of Business 2.62

Undergraduate Headcount Enrollment (Excluding Branch Campuses) By Region & State of Permanent ResidenceFall Semester 2007
Region / State Region / State Region / State Region / State
New England South Midwest WestConnecticut 144 Alabama 11 Illinois 95 Alaska 7Maine 20 Arkansas 4 Indiana 24 California 315Massachusetts 226 Florida 128 Iowa 9 Colorado 28New Hampshire 33 Georgia 42 Kansas 6 Hawaii 36Rhode Island 20 Kentucky 13 Michigan 43 Idaho 4Vermont 9 Louisiana 13 Minnesota 20 Montana 6TOTAL 452 Mississippi 2 Missouri 21 Nevada 13 % of Total 8% North Carolina 39 Nebraska 3 Oregon 29
South Carolina 20 North Dakota 2 Utah 1Tennessee 24 South Dakota 1 Washington 41
Middle States Virginia 191 Wisconsin 25 Wyoming 2Delaware 13 TOTAL 487 TOTAL 249 TOTAL 482District of Col. 9 % of Total 9% % of Total 4% % of Total 9%Maryland 262New Jersey 615 SouthwestNew York 662 Arizona 15 US Territories 7 U.S. Total 4,924Ohio 162 New Mexico 10 % of Total 88%Pennsylvania 1,156 Oklahoma 9West Virginia 23 Texas 156 NRA/International 667TOTAL 2,902 TOTAL 190 Unknown 155 % of Total 12% % of Total 52% % of Total 3%
TOTAL 5,591
0 - 25 26 - 100 101 - 200 More than 200
2.17
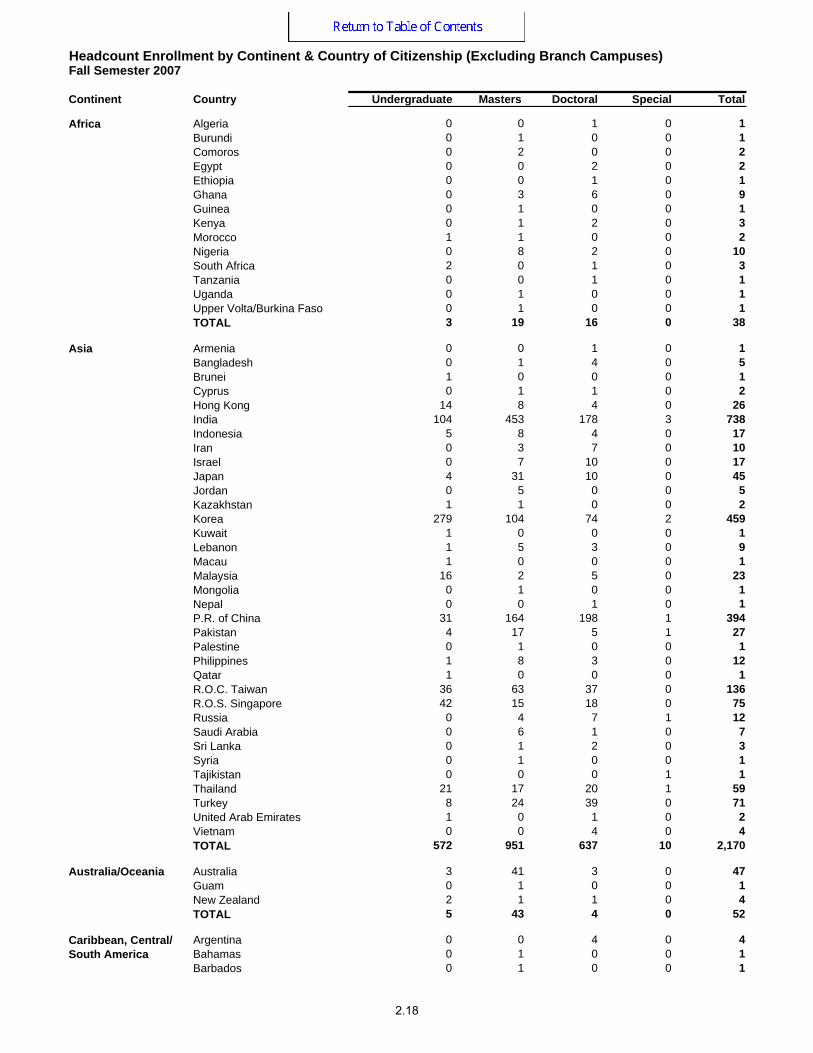
Continent Country Undergraduate Masters Doctoral Special Total
Algeria 0 0 1 0 1Burundi 0 1 0 0 1Comoros 0 2 0 0 2Egypt 0 0 2 0 2Ethiopia 0 0 1 0 1Ghana 0 3 6 0 9Guinea 0 1 0 0 1Kenya 0 1 2 0 3Morocco 1 1 0 0 2Nigeria 0 8 2 0 10South Africa 2 0 1 0 3Tanzania 0 0 1 0 1Uganda 0 1 0 0 1Upper Volta/Burkina Faso 0 1 0 0 1TOTAL 3 19 16 0 38
Armenia 0 0 1 0 1Bangladesh 0 1 4 0 5Brunei 1 0 0 0 1Cyprus 0 1 1 0 2Hong Kong 14 8 4 0 26India 104 453 178 3 738Indonesia 5 8 4 0 17Iran 0 3 7 0 10Israel 0 7 10 0 17Japan 4 31 10 0 45Jordan 0 5 0 0 5Kazakhstan 1 1 0 0 2Korea 279 104 74 2 459Kuwait 1 0 0 0 1Lebanon 1 5 3 0 9Macau 1 0 0 0 1Malaysia 16 2 5 0 23Mongolia 0 1 0 0 1Nepal 0 0 1 0 1P.R. of China 31 164 198 1 394Pakistan 4 17 5 1 27Palestine 0 1 0 0 1Philippines 1 8 3 0 12Qatar 1 0 0 0 1R.O.C. Taiwan 36 63 37 0 136R.O.S. Singapore 42 15 18 0 75Russia 0 4 7 1 12Saudi Arabia 0 6 1 0 7Sri Lanka 0 1 2 0 3Syria 0 1 0 0 1Tajikistan 0 0 0 1 1Thailand 21 17 20 1 59Turkey 8 24 39 0 71United Arab Emirates 1 0 1 0 2Vietnam 0 0 4 0 4TOTAL 572 951 637 10 2,170
Australia 3 41 3 0 47Guam 0 1 0 0 1New Zealand 2 1 1 0 4TOTAL 5 43 4 0 52
Caribbean, Central/ Argentina 0 0 4 0 4South America Bahamas 0 1 0 0 1
Barbados 0 1 0 0 1
Asia
Australia/Oceania
Headcount Enrollment by Continent & Country of Citizenship (Excluding Branch Campuses)Fall Semester 2007
Africa
2.18
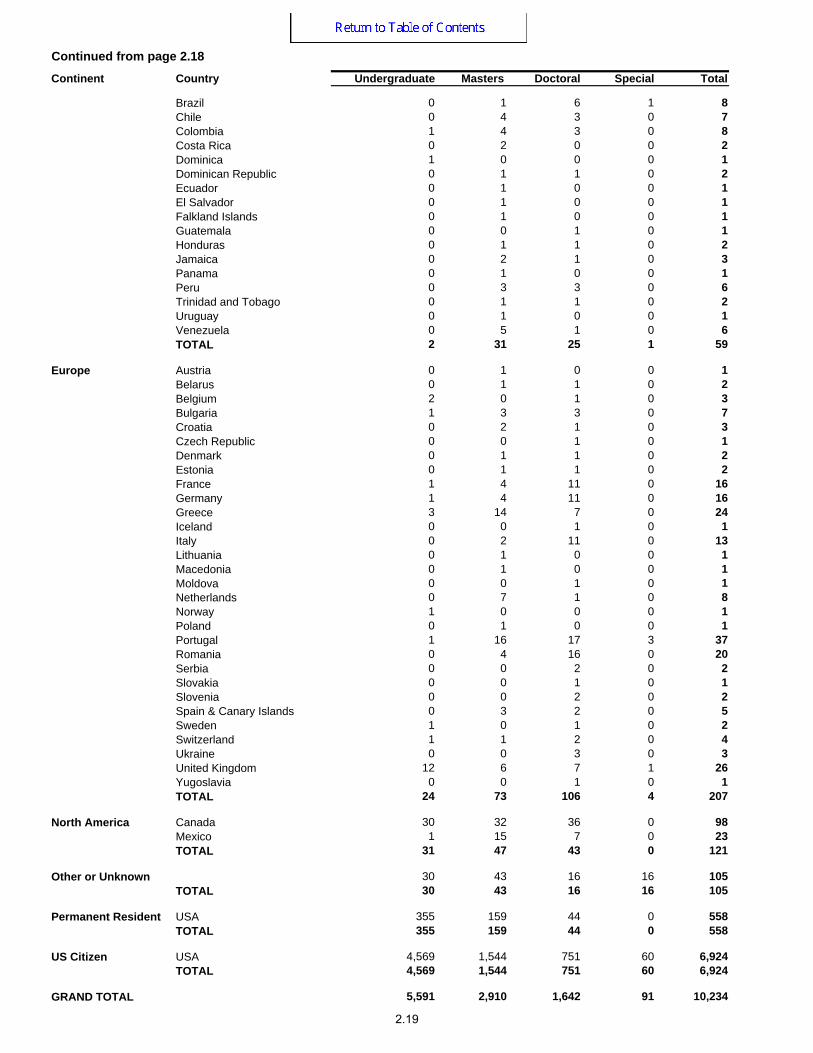
Continent Country Undergraduate Masters Doctoral Special Total
Brazil 0 1 6 1 8Chile 0 4 3 0 7Colombia 1 4 3 0 8Costa Rica 0 2 0 0 2Dominica 1 0 0 0 1Dominican Republic 0 1 1 0 2Ecuador 0 1 0 0 1El Salvador 0 1 0 0 1Falkland Islands 0 1 0 0 1Guatemala 0 0 1 0 1Honduras 0 1 1 0 2Jamaica 0 2 1 0 3Panama 0 1 0 0 1Peru 0 3 3 0 6Trinidad and Tobago 0 1 1 0 2Uruguay 0 1 0 0 1Venezuela 0 5 1 0 6TOTAL 2 31 25 1 59
Austria 0 1 0 0 1Belarus 0 1 1 0 2Belgium 2 0 1 0 3Bulgaria 1 3 3 0 7Croatia 0 2 1 0 3Czech Republic 0 0 1 0 1Denmark 0 1 1 0 2Estonia 0 1 1 0 2France 1 4 11 0 16Germany 1 4 11 0 16Greece 3 14 7 0 24Iceland 0 0 1 0 1Italy 0 2 11 0 13Lithuania 0 1 0 0 1Macedonia 0 1 0 0 1Moldova 0 0 1 0 1Netherlands 0 7 1 0 8Norway 1 0 0 0 1Poland 0 1 0 0 1Portugal 1 16 17 3 37Romania 0 4 16 0 20Serbia 0 0 2 0 2Slovakia 0 0 1 0 1Slovenia 0 0 2 0 2Spain & Canary Islands 0 3 2 0 5Sweden 1 0 1 0 2Switzerland 1 1 2 0 4Ukraine 0 0 3 0 3United Kingdom 12 6 7 1 26Yugoslavia 0 0 1 0 1TOTAL 24 73 106 4 207
Canada 30 32 36 0 98Mexico 1 15 7 0 23TOTAL 31 47 43 0 121
30 43 16 16 105TOTAL 30 43 16 16 105
USA 355 159 44 0 558TOTAL 355 159 44 0 558
USA 4,569 1,544 751 60 6,924TOTAL 4,569 1,544 751 60 6,924
5,591 2,910 1,642 91 10,234
Europe
Continued from page 2.18
GRAND TOTAL
North America
Other or Unknown
Permanent Resident
US Citizen
2.19
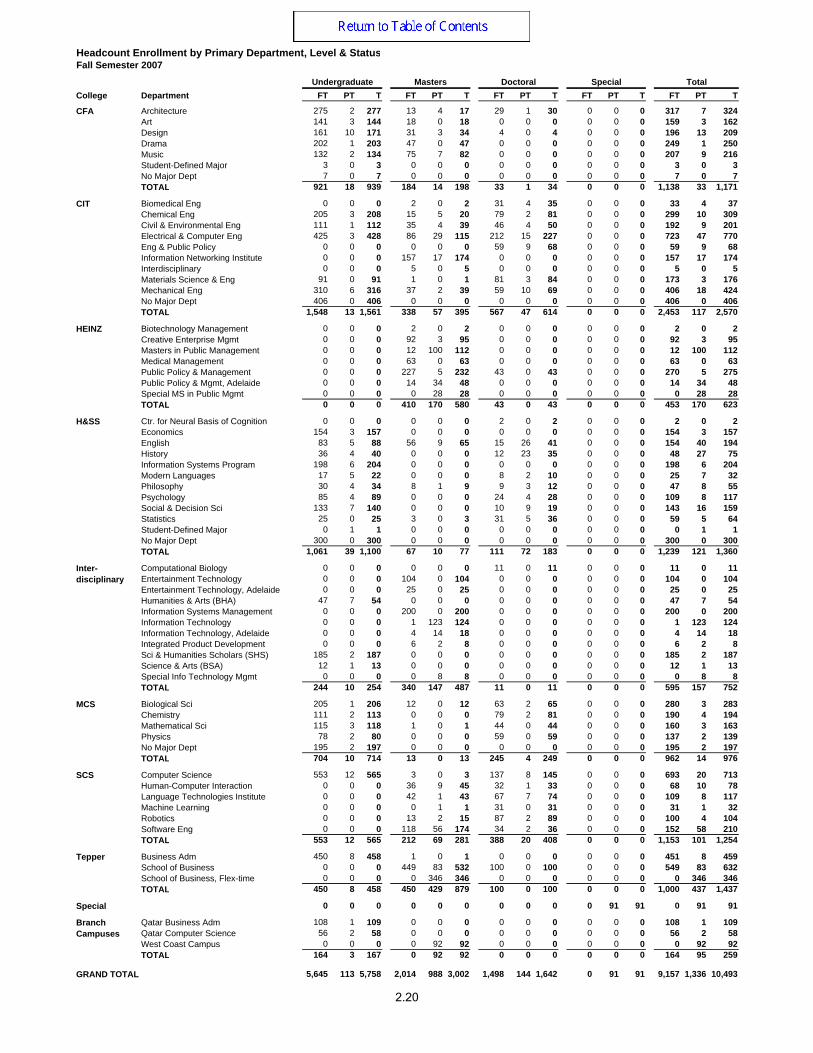
College Department FT PT T FT PT T FT PT T FT PT T FT PT T
Architecture 275 2 277 13 4 17 29 1 30 0 0 0 317 7 324Art 141 3 144 18 0 18 0 0 0 0 0 0 159 3 162Design 161 10 171 31 3 34 4 0 4 0 0 0 196 13 209Drama 202 1 203 47 0 47 0 0 0 0 0 0 249 1 250Music 132 2 134 75 7 82 0 0 0 0 0 0 207 9 216Student-Defined Major 3 0 3 0 0 0 0 0 0 0 0 0 3 0 3No Major Dept 7 0 7 0 0 0 0 0 0 0 0 0 7 0 7TOTAL 921 18 939 184 14 198 33 1 34 0 0 0 1,138 33 1,171
Biomedical Eng 0 0 0 2 0 2 31 4 35 0 0 0 33 4 37Chemical Eng 205 3 208 15 5 20 79 2 81 0 0 0 299 10 309Civil & Environmental Eng 111 1 112 35 4 39 46 4 50 0 0 0 192 9 201Electrical & Computer Eng 425 3 428 86 29 115 212 15 227 0 0 0 723 47 770Eng & Public Policy 0 0 0 0 0 0 59 9 68 0 0 0 59 9 68Information Networking Institute 0 0 0 157 17 174 0 0 0 0 0 0 157 17 174Interdisciplinary 0 0 0 5 0 5 0 0 0 0 0 0 5 0 5Materials Science & Eng 91 0 91 1 0 1 81 3 84 0 0 0 173 3 176Mechanical Eng 310 6 316 37 2 39 59 10 69 0 0 0 406 18 424No Major Dept 406 0 406 0 0 0 0 0 0 0 0 0 406 0 406TOTAL 1,548 13 1,561 338 57 395 567 47 614 0 0 0 2,453 117 2,570
Biotechnology Management 0 0 0 2 0 2 0 0 0 0 0 0 2 0 2Creative Enterprise Mgmt 0 0 0 92 3 95 0 0 0 0 0 0 92 3 95Masters in Public Management 0 0 0 12 100 112 0 0 0 0 0 0 12 100 112Medical Management 0 0 0 63 0 63 0 0 0 0 0 0 63 0 63Public Policy & Management 0 0 0 227 5 232 43 0 43 0 0 0 270 5 275Public Policy & Mgmt, Adelaide 0 0 0 14 34 48 0 0 0 0 0 0 14 34 48Special MS in Public Mgmt 0 0 0 0 28 28 0 0 0 0 0 0 0 28 28TOTAL 0 0 0 410 170 580 43 0 43 0 0 0 453 170 623
Ctr. for Neural Basis of Cognition 0 0 0 0 0 0 2 0 2 0 0 0 2 0 2Economics 154 3 157 0 0 0 0 0 0 0 0 0 154 3 157English 83 5 88 56 9 65 15 26 41 0 0 0 154 40 194History 36 4 40 0 0 0 12 23 35 0 0 0 48 27 75Information Systems Program 198 6 204 0 0 0 0 0 0 0 0 0 198 6 204Modern Languages 17 5 22 0 0 0 8 2 10 0 0 0 25 7 32Philosophy 30 4 34 8 1 9 9 3 12 0 0 0 47 8 55Psychology 85 4 89 0 0 0 24 4 28 0 0 0 109 8 117Social & Decision Sci 133 7 140 0 0 0 10 9 19 0 0 0 143 16 159Statistics 25 0 25 3 0 3 31 5 36 0 0 0 59 5 64Student-Defined Major 0 1 1 0 0 0 0 0 0 0 0 0 0 1 1No Major Dept 300 0 300 0 0 0 0 0 0 0 0 0 300 0 300TOTAL 1,061 39 1,100 67 10 77 111 72 183 0 0 0 1,239 121 1,360
Computational Biology 0 0 0 0 0 0 11 0 11 0 0 0 11 0 11Entertainment Technology 0 0 0 104 0 104 0 0 0 0 0 0 104 0 104Entertainment Technology, Adelaide 0 0 0 25 0 25 0 0 0 0 0 0 25 0 25Humanities & Arts (BHA) 47 7 54 0 0 0 0 0 0 0 0 0 47 7 54Information Systems Management 0 0 0 200 0 200 0 0 0 0 0 0 200 0 200Information Technology 0 0 0 1 123 124 0 0 0 0 0 0 1 123 124Information Technology, Adelaide 0 0 0 4 14 18 0 0 0 0 0 0 4 14 18Integrated Product Development 0 0 0 6 2 8 0 0 0 0 0 0 6 2 8Sci & Humanities Scholars (SHS) 185 2 187 0 0 0 0 0 0 0 0 0 185 2 187Science & Arts (BSA) 12 1 13 0 0 0 0 0 0 0 0 0 12 1 13Special Info Technology Mgmt 0 0 0 0 8 8 0 0 0 0 0 0 0 8 8TOTAL 244 10 254 340 147 487 11 0 11 0 0 0 595 157 752
Biological Sci 205 1 206 12 0 12 63 2 65 0 0 0 280 3 283Chemistry 111 2 113 0 0 0 79 2 81 0 0 0 190 4 194Mathematical Sci 115 3 118 1 0 1 44 0 44 0 0 0 160 3 163Physics 78 2 80 0 0 0 59 0 59 0 0 0 137 2 139No Major Dept 195 2 197 0 0 0 0 0 0 0 0 0 195 2 197TOTAL 704 10 714 13 0 13 245 4 249 0 0 0 962 14 976
Computer Science 553 12 565 3 0 3 137 8 145 0 0 0 693 20 713Human-Computer Interaction 0 0 0 36 9 45 32 1 33 0 0 0 68 10 78Language Technologies Institute 0 0 0 42 1 43 67 7 74 0 0 0 109 8 117Machine Learning 0 0 0 0 1 1 31 0 31 0 0 0 31 1 32Robotics 0 0 0 13 2 15 87 2 89 0 0 0 100 4 104Software Eng 0 0 0 118 56 174 34 2 36 0 0 0 152 58 210TOTAL 553 12 565 212 69 281 388 20 408 0 0 0 1,153 101 1,254
Business Adm 450 8 458 1 0 1 0 0 0 0 0 0 451 8 459School of Business 0 0 0 449 83 532 100 0 100 0 0 0 549 83 632School of Business, Flex-time 0 0 0 0 346 346 0 0 0 0 0 0 0 346 346TOTAL 450 8 458 450 429 879 100 0 100 0 0 0 1,000 437 1,437
Special 0 0 0 0 0 0 0 0 0 0 91 91 0 91 91
Qatar Business Adm 108 1 109 0 0 0 0 0 0 0 0 0 108 1 109Qatar Computer Science 56 2 58 0 0 0 0 0 0 0 0 0 56 2 58West Coast Campus 0 0 0 0 92 92 0 0 0 0 0 0 0 92 92TOTAL 164 3 167 0 92 92 0 0 0 0 0 0 164 95 259
5,645 113 5,758 2,014 988 3,002 1,498 144 1,642 0 91 91 9,157 1,336 10,493
Branch Campuses
GRAND TOTAL
Special
Inter-disciplinary
MCS
SCS
Tepper
CFA
CIT
HEINZ
H&SS
Headcount Enrollment by Primary Department, Level & StatusFall Semester 2007
Undergraduate Masters Doctoral Total
2.20
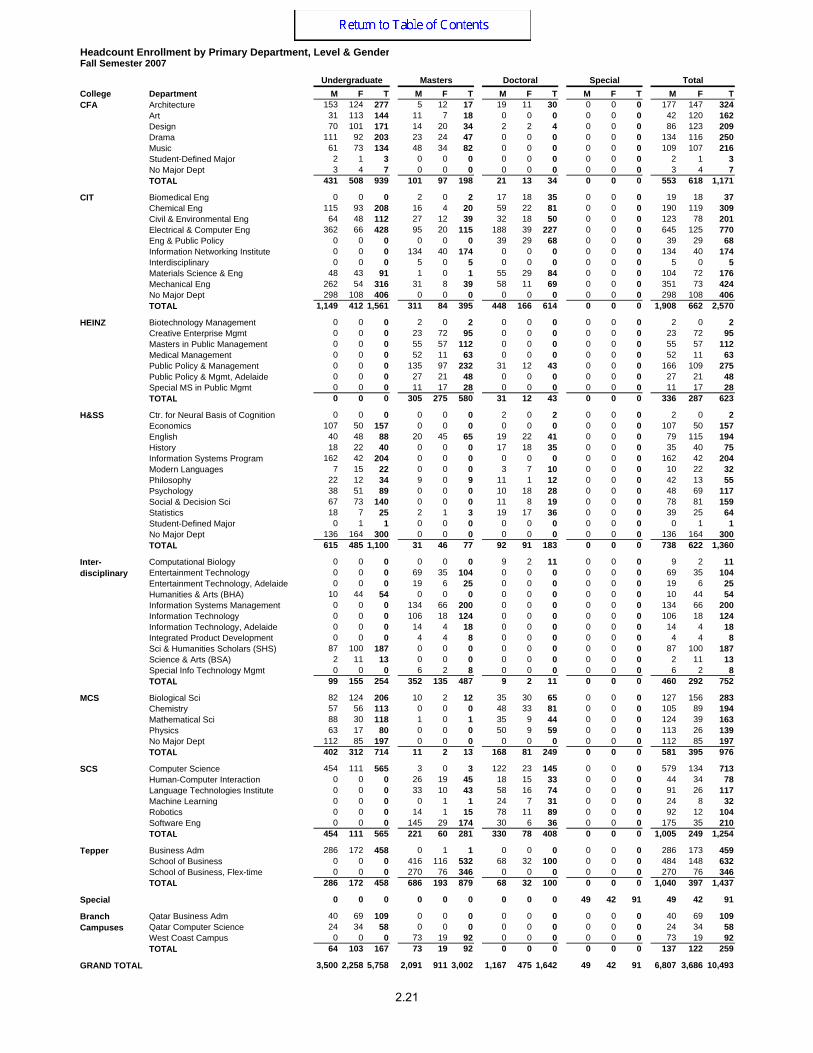
College Department M F T M F T M F T M F T M F TArchitecture 153 124 277 5 12 17 19 11 30 0 0 0 177 147 324Art 31 113 144 11 7 18 0 0 0 0 0 0 42 120 162Design 70 101 171 14 20 34 2 2 4 0 0 0 86 123 209Drama 111 92 203 23 24 47 0 0 0 0 0 0 134 116 250Music 61 73 134 48 34 82 0 0 0 0 0 0 109 107 216Student-Defined Major 2 1 3 0 0 0 0 0 0 0 0 0 2 1 3No Major Dept 3 4 7 0 0 0 0 0 0 0 0 0 3 4 7TOTAL 431 508 939 101 97 198 21 13 34 0 0 0 553 618 1,171
Biomedical Eng 0 0 0 2 0 2 17 18 35 0 0 0 19 18 37Chemical Eng 115 93 208 16 4 20 59 22 81 0 0 0 190 119 309Civil & Environmental Eng 64 48 112 27 12 39 32 18 50 0 0 0 123 78 201Electrical & Computer Eng 362 66 428 95 20 115 188 39 227 0 0 0 645 125 770Eng & Public Policy 0 0 0 0 0 0 39 29 68 0 0 0 39 29 68Information Networking Institute 0 0 0 134 40 174 0 0 0 0 0 0 134 40 174Interdisciplinary 0 0 0 5 0 5 0 0 0 0 0 0 5 0 5Materials Science & Eng 48 43 91 1 0 1 55 29 84 0 0 0 104 72 176Mechanical Eng 262 54 316 31 8 39 58 11 69 0 0 0 351 73 424No Major Dept 298 108 406 0 0 0 0 0 0 0 0 0 298 108 406TOTAL 1,149 412 1,561 311 84 395 448 166 614 0 0 0 1,908 662 2,570
Biotechnology Management 0 0 0 2 0 2 0 0 0 0 0 0 2 0 2Creative Enterprise Mgmt 0 0 0 23 72 95 0 0 0 0 0 0 23 72 95Masters in Public Management 0 0 0 55 57 112 0 0 0 0 0 0 55 57 112Medical Management 0 0 0 52 11 63 0 0 0 0 0 0 52 11 63Public Policy & Management 0 0 0 135 97 232 31 12 43 0 0 0 166 109 275Public Policy & Mgmt, Adelaide 0 0 0 27 21 48 0 0 0 0 0 0 27 21 48Special MS in Public Mgmt 0 0 0 11 17 28 0 0 0 0 0 0 11 17 28TOTAL 0 0 0 305 275 580 31 12 43 0 0 0 336 287 623
Ctr. for Neural Basis of Cognition 0 0 0 0 0 0 2 0 2 0 0 0 2 0 2Economics 107 50 157 0 0 0 0 0 0 0 0 0 107 50 157English 40 48 88 20 45 65 19 22 41 0 0 0 79 115 194History 18 22 40 0 0 0 17 18 35 0 0 0 35 40 75Information Systems Program 162 42 204 0 0 0 0 0 0 0 0 0 162 42 204Modern Languages 7 15 22 0 0 0 3 7 10 0 0 0 10 22 32Philosophy 22 12 34 9 0 9 11 1 12 0 0 0 42 13 55Psychology 38 51 89 0 0 0 10 18 28 0 0 0 48 69 117Social & Decision Sci 67 73 140 0 0 0 11 8 19 0 0 0 78 81 159Statistics 18 7 25 2 1 3 19 17 36 0 0 0 39 25 64Student-Defined Major 0 1 1 0 0 0 0 0 0 0 0 0 0 1 1No Major Dept 136 164 300 0 0 0 0 0 0 0 0 0 136 164 300TOTAL 615 485 1,100 31 46 77 92 91 183 0 0 0 738 622 1,360
Computational Biology 0 0 0 0 0 0 9 2 11 0 0 0 9 2 11Entertainment Technology 0 0 0 69 35 104 0 0 0 0 0 0 69 35 104Entertainment Technology, Adelaide 0 0 0 19 6 25 0 0 0 0 0 0 19 6 25Humanities & Arts (BHA) 10 44 54 0 0 0 0 0 0 0 0 0 10 44 54Information Systems Management 0 0 0 134 66 200 0 0 0 0 0 0 134 66 200Information Technology 0 0 0 106 18 124 0 0 0 0 0 0 106 18 124Information Technology, Adelaide 0 0 0 14 4 18 0 0 0 0 0 0 14 4 18Integrated Product Development 0 0 0 4 4 8 0 0 0 0 0 0 4 4 8Sci & Humanities Scholars (SHS) 87 100 187 0 0 0 0 0 0 0 0 0 87 100 187Science & Arts (BSA) 2 11 13 0 0 0 0 0 0 0 0 0 2 11 13Special Info Technology Mgmt 0 0 0 6 2 8 0 0 0 0 0 0 6 2 8TOTAL 99 155 254 352 135 487 9 2 11 0 0 0 460 292 752
Biological Sci 82 124 206 10 2 12 35 30 65 0 0 0 127 156 283Chemistry 57 56 113 0 0 0 48 33 81 0 0 0 105 89 194Mathematical Sci 88 30 118 1 0 1 35 9 44 0 0 0 124 39 163Physics 63 17 80 0 0 0 50 9 59 0 0 0 113 26 139No Major Dept 112 85 197 0 0 0 0 0 0 0 0 0 112 85 197TOTAL 402 312 714 11 2 13 168 81 249 0 0 0 581 395 976
Computer Science 454 111 565 3 0 3 122 23 145 0 0 0 579 134 713Human-Computer Interaction 0 0 0 26 19 45 18 15 33 0 0 0 44 34 78Language Technologies Institute 0 0 0 33 10 43 58 16 74 0 0 0 91 26 117Machine Learning 0 0 0 0 1 1 24 7 31 0 0 0 24 8 32Robotics 0 0 0 14 1 15 78 11 89 0 0 0 92 12 104Software Eng 0 0 0 145 29 174 30 6 36 0 0 0 175 35 210TOTAL 454 111 565 221 60 281 330 78 408 0 0 0 1,005 249 1,254
Business Adm 286 172 458 0 1 1 0 0 0 0 0 0 286 173 459School of Business 0 0 0 416 116 532 68 32 100 0 0 0 484 148 632School of Business, Flex-time 0 0 0 270 76 346 0 0 0 0 0 0 270 76 346TOTAL 286 172 458 686 193 879 68 32 100 0 0 0 1,040 397 1,437
Special 0 0 0 0 0 0 0 0 0 49 42 91 49 42 91
Qatar Business Adm 40 69 109 0 0 0 0 0 0 0 0 0 40 69 109Qatar Computer Science 24 34 58 0 0 0 0 0 0 0 0 0 24 34 58West Coast Campus 0 0 0 73 19 92 0 0 0 0 0 0 73 19 92TOTAL 64 103 167 73 19 92 0 0 0 0 0 0 137 122 259
3,500 2,258 5,758 2,091 911 3,002 1,167 475 1,642 49 42 91 6,807 3,686 10,493
Branch Campuses
GRAND TOTAL
Inter-disciplinary
MCS
SCS
Tepper
CFA
CIT
HEINZ
H&SS
Headcount Enrollment by Primary Department, Level & GenderFall Semester 2007
Undergraduate Masters Doctoral Special Total
2.21
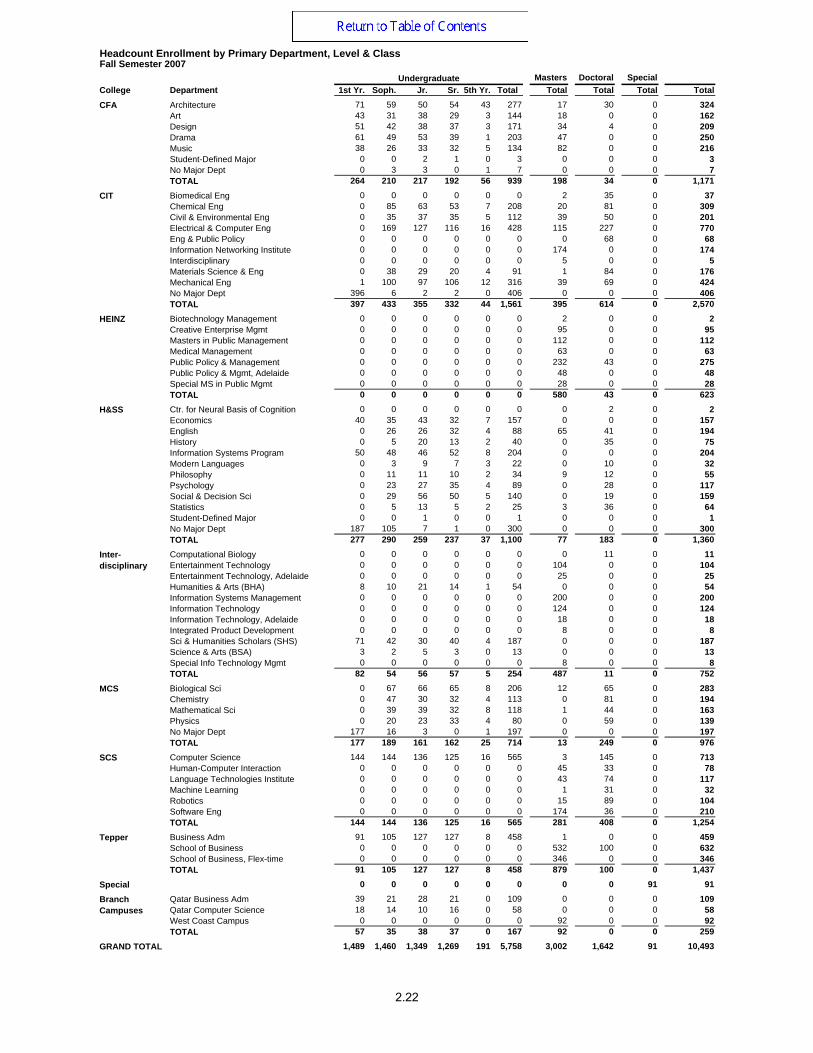
Masters Doctoral SpecialCollege Department 1st Yr. Soph. Jr. Sr. 5th Yr. Total Total Total Total Total
Architecture 71 59 50 54 43 277 17 30 0 324Art 43 31 38 29 3 144 18 0 0 162Design 51 42 38 37 3 171 34 4 0 209Drama 61 49 53 39 1 203 47 0 0 250Music 38 26 33 32 5 134 82 0 0 216Student-Defined Major 0 0 2 1 0 3 0 0 0 3No Major Dept 0 3 3 0 1 7 0 0 0 7TOTAL 264 210 217 192 56 939 198 34 0 1,171Biomedical Eng 0 0 0 0 0 0 2 35 0 37Chemical Eng 0 85 63 53 7 208 20 81 0 309Civil & Environmental Eng 0 35 37 35 5 112 39 50 0 201Electrical & Computer Eng 0 169 127 116 16 428 115 227 0 770Eng & Public Policy 0 0 0 0 0 0 0 68 0 68Information Networking Institute 0 0 0 0 0 0 174 0 0 174Interdisciplinary 0 0 0 0 0 0 5 0 0 5Materials Science & Eng 0 38 29 20 4 91 1 84 0 176Mechanical Eng 1 100 97 106 12 316 39 69 0 424No Major Dept 396 6 2 2 0 406 0 0 0 406TOTAL 397 433 355 332 44 1,561 395 614 0 2,570Biotechnology Management 0 0 0 0 0 0 2 0 0 2Creative Enterprise Mgmt 0 0 0 0 0 0 95 0 0 95Masters in Public Management 0 0 0 0 0 0 112 0 0 112Medical Management 0 0 0 0 0 0 63 0 0 63Public Policy & Management 0 0 0 0 0 0 232 43 0 275Public Policy & Mgmt, Adelaide 0 0 0 0 0 0 48 0 0 48Special MS in Public Mgmt 0 0 0 0 0 0 28 0 0 28TOTAL 0 0 0 0 0 0 580 43 0 623Ctr. for Neural Basis of Cognition 0 0 0 0 0 0 0 2 0 2Economics 40 35 43 32 7 157 0 0 0 157English 0 26 26 32 4 88 65 41 0 194History 0 5 20 13 2 40 0 35 0 75Information Systems Program 50 48 46 52 8 204 0 0 0 204Modern Languages 0 3 9 7 3 22 0 10 0 32Philosophy 0 11 11 10 2 34 9 12 0 55Psychology 0 23 27 35 4 89 0 28 0 117Social & Decision Sci 0 29 56 50 5 140 0 19 0 159Statistics 0 5 13 5 2 25 3 36 0 64Student-Defined Major 0 0 1 0 0 1 0 0 0 1No Major Dept 187 105 7 1 0 300 0 0 0 300TOTAL 277 290 259 237 37 1,100 77 183 0 1,360Computational Biology 0 0 0 0 0 0 0 11 0 11Entertainment Technology 0 0 0 0 0 0 104 0 0 104Entertainment Technology, Adelaide 0 0 0 0 0 0 25 0 0 25Humanities & Arts (BHA) 8 10 21 14 1 54 0 0 0 54Information Systems Management 0 0 0 0 0 0 200 0 0 200Information Technology 0 0 0 0 0 0 124 0 0 124Information Technology, Adelaide 0 0 0 0 0 0 18 0 0 18Integrated Product Development 0 0 0 0 0 0 8 0 0 8Sci & Humanities Scholars (SHS) 71 42 30 40 4 187 0 0 0 187Science & Arts (BSA) 3 2 5 3 0 13 0 0 0 13Special Info Technology Mgmt 0 0 0 0 0 0 8 0 0 8TOTAL 82 54 56 57 5 254 487 11 0 752Biological Sci 0 67 66 65 8 206 12 65 0 283Chemistry 0 47 30 32 4 113 0 81 0 194Mathematical Sci 0 39 39 32 8 118 1 44 0 163Physics 0 20 23 33 4 80 0 59 0 139No Major Dept 177 16 3 0 1 197 0 0 0 197TOTAL 177 189 161 162 25 714 13 249 0 976Computer Science 144 144 136 125 16 565 3 145 0 713Human-Computer Interaction 0 0 0 0 0 0 45 33 0 78Language Technologies Institute 0 0 0 0 0 0 43 74 0 117Machine Learning 0 0 0 0 0 0 1 31 0 32Robotics 0 0 0 0 0 0 15 89 0 104Software Eng 0 0 0 0 0 0 174 36 0 210TOTAL 144 144 136 125 16 565 281 408 0 1,254Business Adm 91 105 127 127 8 458 1 0 0 459School of Business 0 0 0 0 0 0 532 100 0 632School of Business, Flex-time 0 0 0 0 0 0 346 0 0 346TOTAL 91 105 127 127 8 458 879 100 0 1,437
Special 0 0 0 0 0 0 0 0 91 91Qatar Business Adm 39 21 28 21 0 109 0 0 0 109Qatar Computer Science 18 14 10 16 0 58 0 0 0 58West Coast Campus 0 0 0 0 0 0 92 0 0 92TOTAL 57 35 38 37 0 167 92 0 0 259
1,489 1,460 1,349 1,269 191 5,758 3,002 1,642 91 10,493
Branch Campuses
GRAND TOTAL
Undergraduate
Inter-disciplinary
MCS
SCS
Tepper
CFA
CIT
HEINZ
H&SS
Headcount Enrollment by Primary Department, Level & ClassFall Semester 2007
2.22

Masters Doctoral Special FTECollege Department 1st Yr. Soph. Jr. Sr. 5th Yr. Total Total Total Total Total
Architecture 71.0 59.0 50.0 52.0 43.0 275.0 13.6 29.2 0 317.8Art 43.0 31.0 37.8 28.6 2.3 142.7 18.0 0 0 160.7Design 51.0 42.0 32.0 36.0 1.8 162.7 32.3 4.0 0 199.0Drama 61.0 48.0 53.0 39.0 1.0 202.0 47.0 0 0 249.0Music 38.0 26.0 33.0 32.0 4.0 133.0 78.4 0 0 211.4Student-Defined Major 0 0 2.0 1.0 0 3.0 0 0 0 3.0No Major Dept 0 3.0 3.0 0 1.0 7.0 0 0 0 7.0TOTAL 264.0 209.0 210.8 188.6 53.0 925.4 189.3 33.2 0 1,147.9Biomedical Eng 0 0 0 0 0 0 2.0 33.3 0 35.3Chemical Eng 0 85.0 62.3 51.0 7.0 205.3 16.7 79.3 0 301.2Civil & Environmental Eng 0 35.0 37.0 35.0 4.4 111.4 36.2 46.5 0 194.1Electrical & Computer Eng 0 169.0 126.0 115.0 15.6 425.6 102.9 215.2 0 743.7Eng & Public Policy 0 0 0 0 0 0 0 59.5 0 59.5Information Networking Institute 0 0 0 0 0 0 165.7 0 0 165.7Interdisciplinary 0 0 0 0 0 0 5.0 0 0 5.0Materials Science & Eng 0 38.0 29.0 20.0 4.0 91.0 1.0 81.4 0 173.4Mechanical Eng 1.0 99.6 97.0 102.0 11.2 310.8 37.7 61.4 0 409.8No Major Dept 396.0 6.0 2.0 2.0 0 406.0 0 0 0 406.0TOTAL 397.0 432.6 353.3 325.0 42.2 1,550.0 367.1 576.5 0 2,493.6Biotechnology Management 0 0 0 0 0 0 2.0 0 0 2.0Creative Enterprise Mgmt 0 0 0 0 0 0 93.3 0 0 93.3Masters in Public Management 0 0 0 0 0 0 52.7 0 0 52.7Medical Management 0 0 0 0 0 0 63.0 0 0 63.0Public Policy & Management 0 0 0 0 0 0 229.5 43.0 0 272.5Public Policy & Mgmt, Adelaide 0 0 0 0 0 0 30.5 0 0 30.5Special MS in Public Mgmt 0 0 0 0 0 0 9.9 0 0 9.9TOTAL 0 0 0 0 0 0 480.9 43.0 0 523.9Ctr. for Neural Basis of Cognition 0 0 0 0 0 0 0 2.0 0 2.0Economics 40.0 35.0 41.0 32.0 6.5 154.5 0 0 0 154.5English 0 26.0 23.3 30.6 4.0 83.8 60.0 19.2 0 163.0History 0 4.3 19.0 12.0 1.3 36.6 0 15.2 0 51.8Information Systems Program 50.0 48.0 45.3 51.2 6.6 201.0 0 0 0 201.0Modern Languages 0 3.0 8.0 4.4 2.7 18.1 0 8.3 0 26.4Philosophy 0 10.5 10.0 9.6 1.5 31.6 8.1 9.4 0 49.1Psychology 0 23.0 27.0 33.1 3.6 86.7 0 24.8 0 111.4Social & Decision Sci 0 29.0 51.0 49.0 4.5 133.5 0 11.1 0 144.6Statistics 0 5.0 13.0 5.0 2.0 25.0 3.0 31.6 0 59.6Student-Defined Major 0 0 0.3 0 0 0 0 0 0 0.3No Major Dept 187.0 105.0 7.0 1.0 0 300.0 0 0 0 300.0TOTAL 277.0 288.8 244.8 227.8 32.7 1,071.0 71.1 121.5 0 1,263.7Computational Biology 0 0 0 0 0 0 0 11.0 0 11.0Entertainment Technology 0 0 0 0 0 0 104.0 0 0 104.0Entertainment Technology, Adelaide 0 0 0 0 0 0 25.0 0 0 25.0Humanities & Arts (BHA) 8.0 10.0 18.0 11.7 0.7 48.4 0 0 0 48.4Information Systems Management 0 0 0 0 0 0 200.0 0 0 200.0Information Technology 0 0 0 0 0 0 42.3 0 0 42.3Information Technology, Adelaide 0 0 0 0 0 0 10.2 0 0 10.2Integrated Product Development 0 0 0 0 0 0 7.5 0 0 7.5Sci & Humanities Scholars (SHS) 71.0 42.0 30.0 40.0 3.3 186.3 0 0 0 186.3Science & Arts (BSA) 3.0 2.0 4.0 3.0 0 12.0 0 0 0 12.0Special Info Technology Mgmt 0 0 0 0 0 0 2.4 0 0 2.4TOTAL 82.0 54.0 52.0 54.7 4.0 246.6 391.4 11.0 0 649.0Biological Sci 0 67.0 66.0 65.0 7.3 205.3 12.0 63.5 0 280.8Chemistry 0 47.0 29.8 31.0 4.0 111.8 0 79.0 0 190.8Mathematical Sci 0 39.0 36.0 32.0 8.0 115.0 1.0 44.0 0 160.0Physics 0 20.0 22.8 32.3 4.0 79.1 0 59.0 0 138.1No Major Dept 177.0 16.0 2.3 0 0.8 196.1 0 0 0 196.1TOTAL 177.0 189.0 156.9 160.3 24.1 707.3 13.0 245.5 0 965.8Computer Science 144.0 144.0 134.0 122.9 12.2 557.1 3.0 141.0 0 701.0Human-Computer Interaction 0 0 0 0 0 0 40.7 32.3 0 72.9Language Technologies Institute 0 0 0 0 0 0 42.3 67.6 0 110.0Machine Learning 0 0 0 0 0 0 0.3 31.0 0 31.3Robotics 0 0 0 0 0 0 13.5 87.2 0 100.6Software Eng 0 0 0 0 0 0 137.5 34.8 0 172.3TOTAL 144.0 144.0 134.0 122.9 12.2 557.1 237.3 393.8 0 1,188.2Business Adm 91.0 105.0 121.0 126.0 8.0 451.0 1.0 0 0 452.0School of Business 0 0 0 0 0 0 485.9 100.0 0 585.9School of Business, Flex-time 0 0 0 0 0 0 126.8 0 0 126.8TOTAL 91.0 105.0 121.0 126.0 8.0 451.0 613.7 100.0 0 1,164.7
Special 0 0 0 0 0 0 0 0 33.3 33.3Qatar Business Adm 39.0 21.0 27.3 21.0 0 108.3 0 0 0 108.3Qatar Computer Science 18.0 14.0 10.0 15.7 0 57.7 0 0 0 57.7West Coast Campus 0 0 0 0 0 0 28.9 0 0 28.9TOTAL 57.0 35.0 37.3 36.7 0 165.9 28.9 0 0 194.8
1,489.0 1,457.3 1,309.9 1,242.0 176.1 5,674.3 2,392.6 1,524.5 33.3 9,624.7
FTE Enrollment by Primary Department, Level & ClassFall Semester 2007
Branch Campuses
GRAND TOTAL
Undergraduate
Inter-disciplinary
MCS
SCS
Tepper
CFA
CIT
HEINZ
H&SS
2.23
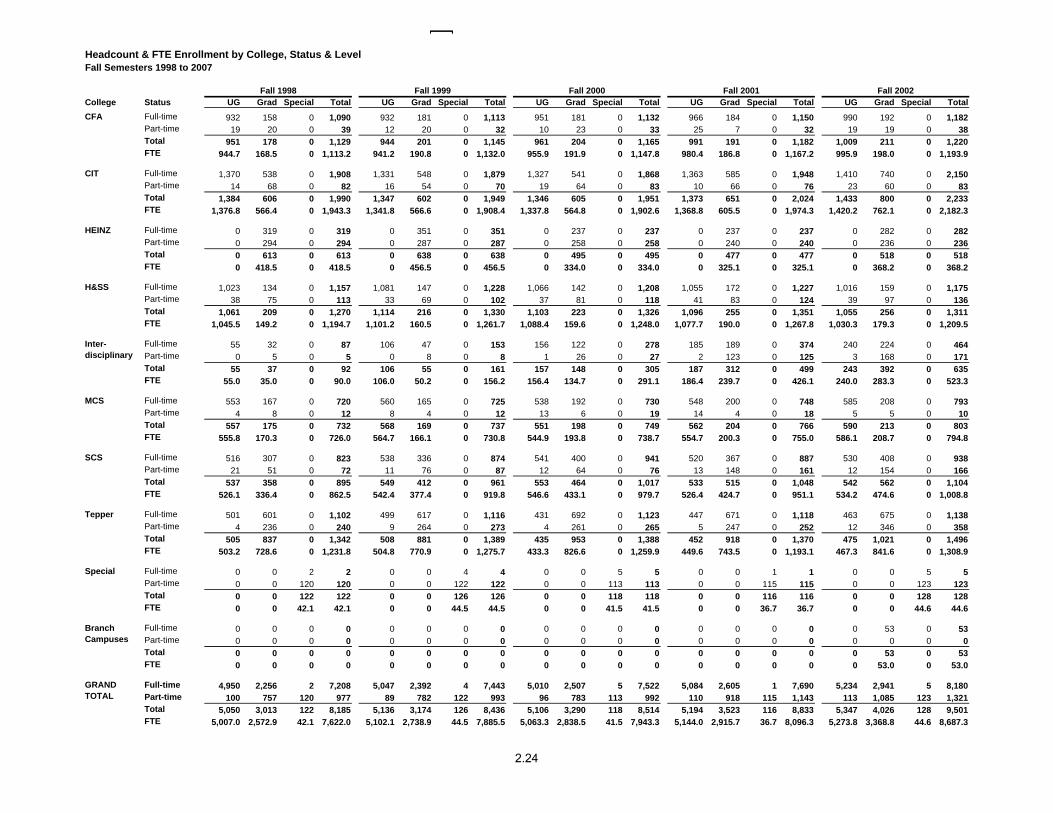
College Status UG Grad Special Total UG Grad Special Total UG Grad Special Total UG Grad Special Total UG Grad Special TotalFull-timePart-time 19 20 0 39 12 20 0 32 10 23 0 33 25 7 0 32 19 19 0 38Total 951 178 0 1,129 944 201 0 1,145 961 204 0 1,165 991 191 0 1,182 1,009 211 0 1,220FTE 944.7 168.5 0 1,113.2 941.2 190.8 0 1,132.0 955.9 191.9 0 1,147.8 980.4 186.8 0 1,167.2 995.9 198.0 0 1,193.9
Full-time 1,370 538 0 1,908 1,331 548 0 1,879 1,327 541 0 1,868 1,363 585 0 1,948 1,410 740 0 2,150Part-time 14 68 0 82 16 54 0 70 19 64 0 83 10 66 0 76 23 60 0 83Total 1,384 606 0 1,990 1,347 602 0 1,949 1,346 605 0 1,951 1,373 651 0 2,024 1,433 800 0 2,233FTE 1,376.8 566.4 0 1,943.3 1,341.8 566.6 0 1,908.4 1,337.8 564.8 0 1,902.6 1,368.8 605.5 0 1,974.3 1,420.2 762.1 0 2,182.3
Full-time 0 319 0 319 0 351 0 351 0 237 0 237 0 237 0 237 0 282 0 282Part-time 0 294 0 294 0 287 0 287 0 258 0 258 0 240 0 240 0 236 0 236Total 0 613 0 613 0 638 0 638 0 495 0 495 0 477 0 477 0 518 0 518FTE 0 418.5 0 418.5 0 456.5 0 456.5 0 334.0 0 334.0 0 325.1 0 325.1 0 368.2 0 368.2
Full-time 1,023 134 0 1,157 1,081 147 0 1,228 1,066 142 0 1,208 1,055 172 0 1,227 1,016 159 0 1,175Part-time 38 75 0 113 33 69 0 102 37 81 0 118 41 83 0 124 39 97 0 136Total 1,061 209 0 1,270 1,114 216 0 1,330 1,103 223 0 1,326 1,096 255 0 1,351 1,055 256 0 1,311FTE 1,045.5 149.2 0 1,194.7 1,101.2 160.5 0 1,261.7 1,088.4 159.6 0 1,248.0 1,077.7 190.0 0 1,267.8 1,030.3 179.3 0 1,209.5
Full-time 55 32 0 87 106 47 0 153 156 122 0 278 185 189 0 374 240 224 0 464Part-time 0 5 0 5 0 8 0 8 1 26 0 27 2 123 0 125 3 168 0 171Total 55 37 0 92 106 55 0 161 157 148 0 305 187 312 0 499 243 392 0 635FTE 55.0 35.0 0 90.0 106.0 50.2 0 156.2 156.4 134.7 0 291.1 186.4 239.7 0 426.1 240.0 283.3 0 523.3
Full-time 553 167 0 720 560 165 0 725 538 192 0 730 548 200 0 748 585 208 0 793Part-time 4 8 0 12 8 4 0 12 13 6 0 19 14 4 0 18 5 5 0 10Total 557 175 0 732 568 169 0 737 551 198 0 749 562 204 0 766 590 213 0 803FTE 555.8 170.3 0 726.0 564.7 166.1 0 730.8 544.9 193.8 0 738.7 554.7 200.3 0 755.0 586.1 208.7 0 794.8
Full-time 516 307 0 823 538 336 0 874 541 400 0 941 520 367 0 887 530 408 0 938Part-time 21 51 0 72 11 76 0 87 12 64 0 76 13 148 0 161 12 154 0 166Total 537 358 0 895 549 412 0 961 553 464 0 1,017 533 515 0 1,048 542 562 0 1,104FTE 526.1 336.4 0 862.5 542.4 377.4 0 919.8 546.6 433.1 0 979.7 526.4 424.7 0 951.1 534.2 474.6 0 1,008.8
Full-time 501 601 0 1,102 499 617 0 1,116 431 692 0 1,123 447 671 0 1,118 463 675 0 1,138Part-time 4 236 0 240 9 264 0 273 4 261 0 265 5 247 0 252 12 346 0 358Total 505 837 0 1,342 508 881 0 1,389 435 953 0 1,388 452 918 0 1,370 475 1,021 0 1,496FTE 503.2 728.6 0 1,231.8 504.8 770.9 0 1,275.7 433.3 826.6 0 1,259.9 449.6 743.5 0 1,193.1 467.3 841.6 0 1,308.9
Full-time 0 0 2 2 0 0 4 4 0 0 5 5 0 0 1 1 0 0 5 5Part-time 0 0 120 120 0 0 122 122 0 0 113 113 0 0 115 115 0 0 123 123Total 0 0 122 122 0 0 126 126 0 0 118 118 0 0 116 116 0 0 128 128FTE 0 0 42.1 42.1 0 0 44.5 44.5 0 0 41.5 41.5 0 0 36.7 36.7 0 0 44.6 44.6
Full-time 0 0 0 0 0 0 0 0 0 0 0 0 0 0 0 0 0 53 0 53Part-time 0 0 0 0 0 0 0 0 0 0 0 0 0 0 0 0 0 0 0 0Total 0 0 0 0 0 0 0 0 0 0 0 0 0 0 0 0 0 53 0 53FTE 0 0 0 0 0 0 0 0 0 0 0 0 0 0 0 0 0 53.0 0 53.0
Full-time 4,950 2,256 2 7,208 5,047 2,392 4 7,443 5,010 2,507 5 7,522 5,084 2,605 1 7,690 5,234 2,941 5 8,180Part-time 100 757 120 977 89 782 122 993 96 783 113 992 110 918 115 1,143 113 1,085 123 1,321Total 5,050 3,013 122 8,185 5,136 3,174 126 8,436 5,106 3,290 118 8,514 5,194 3,523 116 8,833 5,347 4,026 128 9,501FTE 5,007.0 2,572.9 42.1 7,622.0 5,102.1 2,738.9 44.5 7,885.5 5,063.3 2,838.5 41.5 7,943.3 5,144.0 2,915.7 36.7 8,096.3 5,273.8 3,368.8 44.6 8,687.3
Branch Campuses
GRAND TOTAL
Inter-disciplinary
MCS
SCS
Tepper
Special
CFA
CIT
H&SS
HEINZ
990 192 0 1,182966 184 0 1,150951 181 0 1,132932 158 0 1,090 932 181 0 1,113
Headcount & FTE Enrollment by College, Status & LevelFall Semesters 1998 to 2007
Fall 1998 Fall 1999 Fall 2000 Fall 2001 Fall 2002
2.24
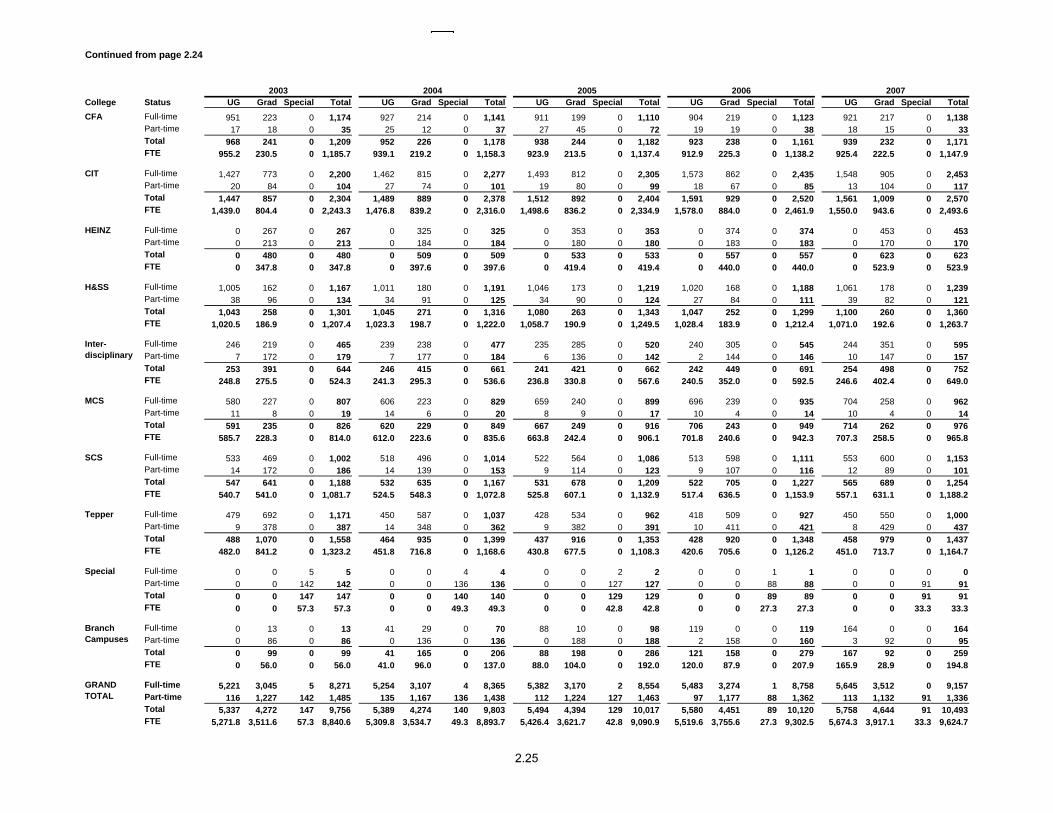
College Status UG Grad Special Total UG Grad Special Total UG Grad Special Total UG Grad Special Total UG Grad Special TotalFull-timePart-time 17 18 0 35 25 12 0 37 27 45 0 72 19 19 0 38 18 15 0 33Total 968 241 0 1,209 952 226 0 1,178 938 244 0 1,182 923 238 0 1,161 939 232 0 1,171FTE 955.2 230.5 0 1,185.7 939.1 219.2 0 1,158.3 923.9 213.5 0 1,137.4 912.9 225.3 0 1,138.2 925.4 222.5 0 1,147.9
Full-time 1,427 773 0 2,200 1,462 815 0 2,277 1,493 812 0 2,305 1,573 862 0 2,435 1,548 905 0 2,453Part-time 20 84 0 104 27 74 0 101 19 80 0 99 18 67 0 85 13 104 0 117Total 1,447 857 0 2,304 1,489 889 0 2,378 1,512 892 0 2,404 1,591 929 0 2,520 1,561 1,009 0 2,570FTE 1,439.0 804.4 0 2,243.3 1,476.8 839.2 0 2,316.0 1,498.6 836.2 0 2,334.9 1,578.0 884.0 0 2,461.9 1,550.0 943.6 0 2,493.6
Full-time 0 267 0 267 0 325 0 325 0 353 0 353 0 374 0 374 0 453 0 453Part-time 0 213 0 213 0 184 0 184 0 180 0 180 0 183 0 183 0 170 0 170Total 0 480 0 480 0 509 0 509 0 533 0 533 0 557 0 557 0 623 0 623FTE 0 347.8 0 347.8 0 397.6 0 397.6 0 419.4 0 419.4 0 440.0 0 440.0 0 523.9 0 523.9
Full-time 1,005 162 0 1,167 1,011 180 0 1,191 1,046 173 0 1,219 1,020 168 0 1,188 1,061 178 0 1,239Part-time 38 96 0 134 34 91 0 125 34 90 0 124 27 84 0 111 39 82 0 121Total 1,043 258 0 1,301 1,045 271 0 1,316 1,080 263 0 1,343 1,047 252 0 1,299 1,100 260 0 1,360FTE 1,020.5 186.9 0 1,207.4 1,023.3 198.7 0 1,222.0 1,058.7 190.9 0 1,249.5 1,028.4 183.9 0 1,212.4 1,071.0 192.6 0 1,263.7
Full-time 246 219 0 465 239 238 0 477 235 285 0 520 240 305 0 545 244 351 0 595Part-time 7 172 0 179 7 177 0 184 6 136 0 142 2 144 0 146 10 147 0 157Total 253 391 0 644 246 415 0 661 241 421 0 662 242 449 0 691 254 498 0 752FTE 248.8 275.5 0 524.3 241.3 295.3 0 536.6 236.8 330.8 0 567.6 240.5 352.0 0 592.5 246.6 402.4 0 649.0
Full-time 580 227 0 807 606 223 0 829 659 240 0 899 696 239 0 935 704 258 0 962Part-time 11 8 0 19 14 6 0 20 8 9 0 17 10 4 0 14 10 4 0 14Total 591 235 0 826 620 229 0 849 667 249 0 916 706 243 0 949 714 262 0 976FTE 585.7 228.3 0 814.0 612.0 223.6 0 835.6 663.8 242.4 0 906.1 701.8 240.6 0 942.3 707.3 258.5 0 965.8
Full-time 533 469 0 1,002 518 496 0 1,014 522 564 0 1,086 513 598 0 1,111 553 600 0 1,153Part-time 14 172 0 186 14 139 0 153 9 114 0 123 9 107 0 116 12 89 0 101Total 547 641 0 1,188 532 635 0 1,167 531 678 0 1,209 522 705 0 1,227 565 689 0 1,254FTE 540.7 541.0 0 1,081.7 524.5 548.3 0 1,072.8 525.8 607.1 0 1,132.9 517.4 636.5 0 1,153.9 557.1 631.1 0 1,188.2
Full-time 479 692 0 1,171 450 587 0 1,037 428 534 0 962 418 509 0 927 450 550 0 1,000Part-time 9 378 0 387 14 348 0 362 9 382 0 391 10 411 0 421 8 429 0 437Total 488 1,070 0 1,558 464 935 0 1,399 437 916 0 1,353 428 920 0 1,348 458 979 0 1,437FTE 482.0 841.2 0 1,323.2 451.8 716.8 0 1,168.6 430.8 677.5 0 1,108.3 420.6 705.6 0 1,126.2 451.0 713.7 0 1,164.7
Full-time 0 0 5 5 0 0 4 4 0 0 2 2 0 0 1 1 0 0 0 0Part-time 0 0 142 142 0 0 136 136 0 0 127 127 0 0 88 88 0 0 91 91Total 0 0 147 147 0 0 140 140 0 0 129 129 0 0 89 89 0 0 91 91FTE 0 0 57.3 57.3 0 0 49.3 49.3 0 0 42.8 42.8 0 0 27.3 27.3 0 0 33.3 33.3
Full-time 0 13 0 13 41 29 0 70 88 10 0 98 119 0 0 119 164 0 0 164Part-time 0 86 0 86 0 136 0 136 0 188 0 188 2 158 0 160 3 92 0 95Total 0 99 0 99 41 165 0 206 88 198 0 286 121 158 0 279 167 92 0 259FTE 0 56.0 0 56.0 41.0 96.0 0 137.0 88.0 104.0 0 192.0 120.0 87.9 0 207.9 165.9 28.9 0 194.8
Full-time 5,221 3,045 5 8,271 5,254 3,107 4 8,365 5,382 3,170 2 8,554 5,483 3,274 1 8,758 5,645 3,512 0 9,157Part-time 116 1,227 142 1,485 135 1,167 136 1,438 112 1,224 127 1,463 97 1,177 88 1,362 113 1,132 91 1,336Total 5,337 4,272 147 9,756 5,389 4,274 140 9,803 5,494 4,394 129 10,017 5,580 4,451 89 10,120 5,758 4,644 91 10,493FTE 5,271.8 3,511.6 57.3 8,840.6 5,309.8 3,534.7 49.3 8,893.7 5,426.4 3,621.7 42.8 9,090.9 5,519.6 3,755.6 27.3 9,302.5 5,674.3 3,917.1 33.3 9,624.7
1,138CFA
CIT
H&SS
1,123 921 217 00 219
Branch Campuses
GRAND TOTAL
01,141 911 199 0 1,110 9040 1,174 927 214
HEINZ
Special
951 223
Inter-disciplinary
MCS
SCS
Tepper
Continued from page 2.24
2003 2004 2005 2006 2007
2.25

College Level Total Female Minority Total Female Minority Total Female Minority Total Female Minority Total Female MinorityUndergraduate 951 481 75 944 491 77 961 507 81 991 530 84 1,009 553 93Masters 150 82 4 178 98 3 181 99 2 170 89 1 182 97 7Doctoral 28 12 0 23 10 0 23 12 0 21 12 0 29 17 0Total 1,129 575 79 1,145 599 80 1,165 618 83 1,182 631 85 1,220 667 100
Undergraduate 1,384 308 142 1,347 316 138 1,346 304 138 1,373 324 136 1,433 326 168Masters 249 34 13 249 36 13 234 43 6 257 52 11 400 80 13Doctoral 357 77 5 353 61 5 371 65 6 394 73 6 400 85 8Total 1,990 419 160 1,949 413 156 1,951 412 150 2,024 449 153 2,233 491 189
Masters 578 279 54 608 285 55 461 255 54 447 231 52 481 238 48Doctoral 35 15 1 30 14 1 34 13 2 30 10 2 37 11 2Total 613 294 55 638 299 56 495 268 56 477 241 54 518 249 50
Undergraduate 1,061 477 97 1,114 485 108 1,103 465 108 1,096 469 112 1,055 480 112Masters 73 39 2 68 36 5 62 32 4 85 47 2 79 43 1Doctoral 136 49 1 148 62 1 161 70 2 170 80 4 177 88 2Total 1,270 565 100 1,330 583 114 1,326 567 114 1,351 596 118 1,311 611 115
Undergraduate 55 41 3 106 65 7 157 98 13 187 109 10 243 144 18Masters 37 4 0 55 11 3 148 45 5 312 89 9 392 112 12Doctoral 0 0 0 0 0 0 0 0 0 0 0 0 0 0 0Total 92 45 3 161 76 10 305 143 18 499 198 19 635 256 30
Undergraduate 557 190 46 568 190 44 551 191 37 562 201 45 590 229 45Masters 5 1 0 2 0 0 3 0 0 2 0 0 3 2 0Doctoral 170 56 0 167 53 1 195 61 1 202 67 2 210 71 2Total 732 247 46 737 243 45 749 252 38 766 268 47 803 302 47
Undergraduate 537 71 48 549 113 40 553 143 38 533 159 38 542 165 48Masters 133 32 4 179 45 5 215 47 3 222 45 3 246 74 5Doctoral 225 35 2 233 38 0 249 46 0 293 53 2 316 60 2Total 895 138 54 961 196 45 1,017 236 41 1,048 257 43 1,104 299 55
Undergraduate 505 165 35 508 174 37 435 153 32 452 163 32 475 182 38Masters 746 170 18 785 166 29 869 192 27 828 171 26 915 170 23Doctoral 91 26 1 96 29 1 84 21 3 90 24 2 106 33 1Total 1,342 361 54 1,389 369 67 1,388 366 62 1,370 358 60 1,496 385 62
Special 122 60 5 126 62 5 118 55 4 116 53 4 128 53 8
Undergraduate 0 0 0 0 0 0 0 0 0 0 0 0 0 0 0Masters 0 0 0 0 0 0 0 0 0 0 0 0 53 15 0Total 0 0 0 0 0 0 0 0 0 0 0 0 53 15 0
Special 122 60 5 126 62 5 118 55 4 116 53 4 128 53 8Undergraduate 5,050 1,733 446 5,136 1,834 451 5,106 1,861 447 5,194 1,955 457 5,347 2,079 522Masters 1,971 641 95 2,124 677 113 2,173 713 101 2,323 724 104 2,751 831 109Doctoral 1,042 270 10 1,050 267 9 1,117 288 14 1,200 319 18 1,275 365 17Total 8,185 2,704 556 8,436 2,840 578 8,514 2,917 566 8,833 3,051 583 9,501 3,328 656
HEINZ
H&SS
Branch Campuses
GRAND TOTAL
Inter-disciplinary
MCS
SCS
Tepper
Minority Category includes US citizens or permanent residents who self-identify as African American/Black, American Indian/Alaskan Native or Hispanic.
Headcount Enrollment by College, Level, Female & Minority StatusFall Semesters 1998 to 2007
1998 1999 2000 2001 2002
CFA
CIT
2.26

College Level Total Female Minority Total Female Minority Total Female Minority Total Female Minority Total Female MinorityUndergraduate 968 530 101 952 526 115 938 517 111 923 513 110 939 508 113Masters 209 113 9 194 99 8 210 115 5 204 100 7 198 97 12Doctoral 32 18 0 32 16 0 34 14 0 34 15 0 34 13 0Total 1,209 661 110 1,178 641 123 1,182 646 116 1,161 628 117 1,171 618 125
Undergraduate 1,447 359 180 1,489 369 176 1,512 379 169 1,591 410 182 1,561 412 157Masters 426 88 11 423 80 15 342 70 4 317 66 5 395 84 10Doctoral 431 96 8 466 108 15 550 144 22 612 162 23 614 166 23Total 2,304 543 199 2,378 557 206 2,404 593 195 2,520 638 210 2,570 662 190
Masters 442 225 41 476 241 54 492 254 57 514 265 54 580 275 51Doctoral 38 14 2 33 11 2 41 13 1 43 15 1 43 12 1Total 480 239 43 509 252 56 533 267 58 557 280 55 623 287 52
Undergraduate 1,043 484 113 1,045 459 130 1,080 491 154 1,047 441 142 1,100 485 155Masters 86 56 2 95 55 4 91 51 3 77 40 5 77 46 5Doctoral 172 85 3 176 98 6 172 87 8 175 86 6 183 91 4Total 1,301 625 118 1,316 612 140 1,343 629 165 1,299 567 153 1,360 622 164
Undergraduate 253 154 20 246 145 19 241 149 23 242 149 17 254 155 13Masters 391 106 16 415 108 17 421 96 15 444 120 21 487 135 21Doctoral 0 0 0 0 0 0 0 0 0 5 0 0 11 2 0Total 644 260 36 661 253 36 662 245 38 691 269 38 752 292 34
Undergraduate 591 238 45 620 272 45 667 288 46 706 308 57 714 312 53Masters 4 2 0 8 1 1 13 2 1 10 2 0 13 2 0Doctoral 231 79 4 221 76 4 236 76 5 233 71 5 249 81 6Total 826 319 49 849 349 50 916 366 52 949 381 62 976 395 59
Undergraduate 547 162 60 532 136 56 531 123 57 522 117 52 565 111 49Masters 272 67 8 235 47 10 266 46 11 282 50 9 281 60 6Doctoral 369 79 2 400 83 2 412 87 3 423 90 2 408 78 5Total 1,188 308 70 1,167 266 68 1,209 256 71 1,227 257 63 1,254 249 60
Undergraduate 488 188 46 464 183 53 437 167 49 428 161 46 458 172 38Masters 951 182 43 833 160 35 812 163 38 826 174 48 879 193 51Doctoral 119 39 0 102 37 0 104 35 0 94 32 0 100 32 0Total 1,558 409 89 1,399 380 88 1,353 365 87 1,348 367 94 1,437 397 89
Special 147 66 7 140 58 4 129 56 2 89 33 3 91 42 5
Undergraduate 0 0 0 41 30 0 88 60 0 121 75 0 167 103 0Masters 99 28 1 165 43 8 198 46 11 158 36 6 92 19 4Total 99 28 1 206 73 8 286 106 11 279 111 6 259 122 4
Special 147 66 7 140 58 4 129 56 2 89 33 3 91 42 5Undergraduate 5,337 2,115 565 5,389 2,120 594 5,494 2,174 609 5,580 2,174 606 5,758 2,258 578Masters 2,880 867 131 2,844 834 152 2,845 843 145 2,832 853 155 3,002 911 160Doctoral 1,392 410 19 1,430 429 29 1,549 456 39 1,619 471 37 1,642 475 39Total 9,756 3,458 722 9,803 3,441 779 10,017 3,529 795 10,120 3,531 801 10,493 3,686 782
Tepper
CFA
CIT
Minority Category includes US citizens or permanent residents who self-identify as African American/Black, American Indian/Alaskan Native or Hispanic.
HEINZ
H&SS
Branch Campuses
GRAND TOTAL
Inter-disciplinary
MCS
SCS
2006 2007
Continued from page 2.26
2003 2004 2005
2.27
College Department M F T M F T M F T M F T
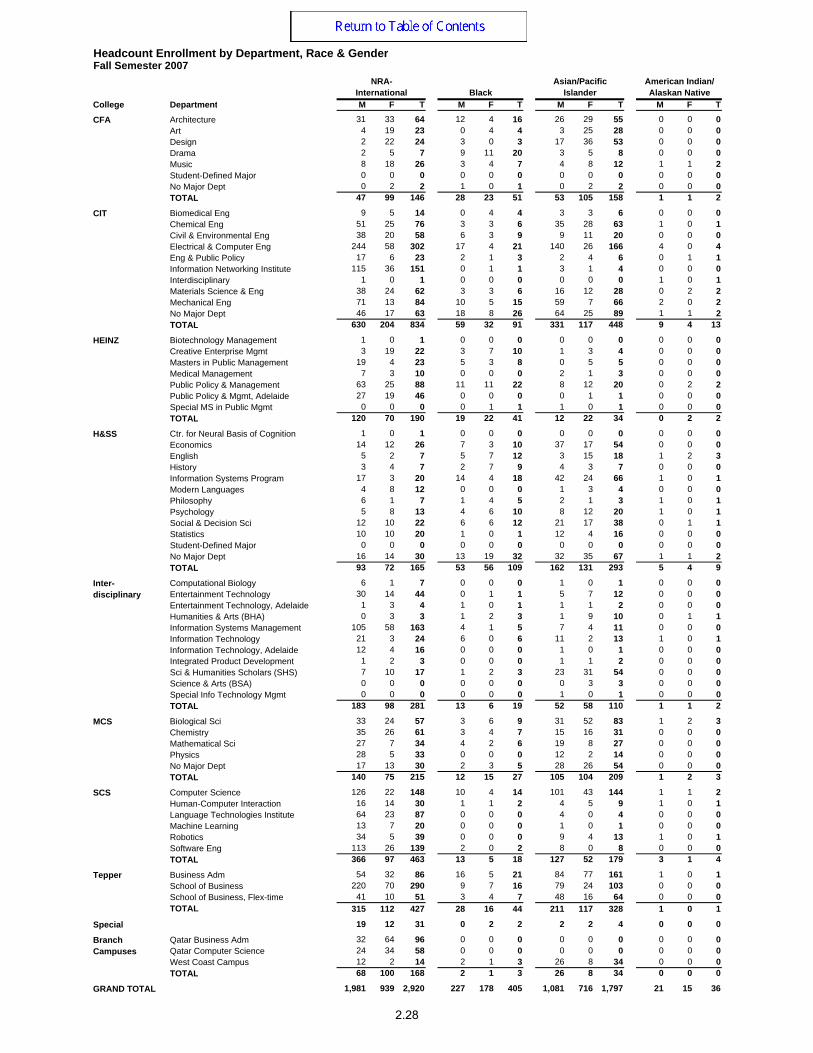
Architecture 31 33 64 12 4 16 26 29 55 0 0 0Art 4 19 23 0 4 4 3 25 28 0 0 0Design 2 22 24 3 0 3 17 36 53 0 0 0Drama 2 5 7 9 11 20 3 5 8 0 0 0Music 8 18 26 3 4 7 4 8 12 1 1 2Student-Defined Major 0 0 0 0 0 0 0 0 0 0 0 0No Major Dept 0 2 2 1 0 1 0 2 2 0 0 0TOTAL 47 99 146 28 23 51 53 105 158 1 1 2
Biomedical Eng 9 5 14 0 4 4 3 3 6 0 0 0Chemical Eng 51 25 76 3 3 6 35 28 63 1 0 1Civil & Environmental Eng 38 20 58 6 3 9 9 11 20 0 0 0Electrical & Computer Eng 244 58 302 17 4 21 140 26 166 4 0 4Eng & Public Policy 17 6 23 2 1 3 2 4 6 0 1 1Information Networking Institute 115 36 151 0 1 1 3 1 4 0 0 0Interdisciplinary 1 0 1 0 0 0 0 0 0 1 0 1Materials Science & Eng 38 24 62 3 3 6 16 12 28 0 2 2Mechanical Eng 71 13 84 10 5 15 59 7 66 2 0 2No Major Dept 46 17 63 18 8 26 64 25 89 1 1 2TOTAL 630 204 834 59 32 91 331 117 448 9 4 13
Biotechnology Management 1 0 1 0 0 0 0 0 0 0 0 0Creative Enterprise Mgmt 3 19 22 3 7 10 1 3 4 0 0 0Masters in Public Management 19 4 23 5 3 8 0 5 5 0 0 0Medical Management 7 3 10 0 0 0 2 1 3 0 0 0Public Policy & Management 63 25 88 11 11 22 8 12 20 0 2 2Public Policy & Mgmt, Adelaide 27 19 46 0 0 0 0 1 1 0 0 0Special MS in Public Mgmt 0 0 0 0 1 1 1 0 1 0 0 0TOTAL 120 70 190 19 22 41 12 22 34 0 2 2
Ctr. for Neural Basis of Cognition 1 0 1 0 0 0 0 0 0 0 0 0Economics 14 12 26 7 3 10 37 17 54 0 0 0English 5 2 7 5 7 12 3 15 18 1 2 3History 3 4 7 2 7 9 4 3 7 0 0 0Information Systems Program 17 3 20 14 4 18 42 24 66 1 0 1Modern Languages 4 8 12 0 0 0 1 3 4 0 0 0Philosophy 6 1 7 1 4 5 2 1 3 1 0 1Psychology 5 8 13 4 6 10 8 12 20 1 0 1Social & Decision Sci 12 10 22 6 6 12 21 17 38 0 1 1Statistics 10 10 20 1 0 1 12 4 16 0 0 0Student-Defined Major 0 0 0 0 0 0 0 0 0 0 0 0No Major Dept 16 14 30 13 19 32 32 35 67 1 1 2TOTAL 93 72 165 53 56 109 162 131 293 5 4 9
Computational Biology 6 1 7 0 0 0 1 0 1 0 0 0Entertainment Technology 30 14 44 0 1 1 5 7 12 0 0 0Entertainment Technology, Adelaide 1 3 4 1 0 1 1 1 2 0 0 0Humanities & Arts (BHA) 0 3 3 1 2 3 1 9 10 0 1 1Information Systems Management 105 58 163 4 1 5 7 4 11 0 0 0Information Technology 21 3 24 6 0 6 11 2 13 1 0 1Information Technology, Adelaide 12 4 16 0 0 0 1 0 1 0 0 0Integrated Product Development 1 2 3 0 0 0 1 1 2 0 0 0Sci & Humanities Scholars (SHS) 7 10 17 1 2 3 23 31 54 0 0 0Science & Arts (BSA) 0 0 0 0 0 0 0 3 3 0 0 0Special Info Technology Mgmt 0 0 0 0 0 0 1 0 1 0 0 0TOTAL 183 98 281 13 6 19 52 58 110 1 1 2
Biological Sci 33 24 57 3 6 9 31 52 83 1 2 3Chemistry 35 26 61 3 4 7 15 16 31 0 0 0Mathematical Sci 27 7 34 4 2 6 19 8 27 0 0 0Physics 28 5 33 0 0 0 12 2 14 0 0 0No Major Dept 17 13 30 2 3 5 28 26 54 0 0 0TOTAL 140 75 215 12 15 27 105 104 209 1 2 3
Computer Science 126 22 148 10 4 14 101 43 144 1 1 2Human-Computer Interaction 16 14 30 1 1 2 4 5 9 1 0 1Language Technologies Institute 64 23 87 0 0 0 4 0 4 0 0 0Machine Learning 13 7 20 0 0 0 1 0 1 0 0 0Robotics 34 5 39 0 0 0 9 4 13 1 0 1Software Eng 113 26 139 2 0 2 8 0 8 0 0 0TOTAL 366 97 463 13 5 18 127 52 179 3 1 4
Business Adm 54 32 86 16 5 21 84 77 161 1 0 1School of Business 220 70 290 9 7 16 79 24 103 0 0 0School of Business, Flex-time 41 10 51 3 4 7 48 16 64 0 0 0TOTAL 315 112 427 28 16 44 211 117 328 1 0 1
Special 19 12 31 0 2 2 2 2 4 0 0 0
Qatar Business Adm 32 64 96 0 0 0 0 0 0 0 0 0Qatar Computer Science 24 34 58 0 0 0 0 0 0 0 0 0West Coast Campus 12 2 14 2 1 3 26 8 34 0 0 0TOTAL 68 100 168 2 1 3 26 8 34 0 0 0
1,981 939 2,920 227 178 405 1,081 716 1,797 21 15 36
Branch Campuses
GRAND TOTAL
MCS
SCS
Tepper
Inter-disciplinary
CFA
CIT
HEINZ
H&SS
Headcount Enrollment by Department, Race & GenderFall Semester 2007
NRA- International Black
Asian/Pacific Islander
American Indian/ Alaskan Native
2.28

College Department M F T M F T M F T M F T
Architecture 11 15 26 78 51 129 19 15 34 177 147 324Art 5 6 11 17 47 64 13 19 32 42 120 162Design 4 6 10 48 45 93 12 14 26 86 123 209Drama 4 7 11 95 71 166 21 17 38 134 116 250Music 9 5 14 44 42 86 40 29 69 109 107 216Student-Defined Major 0 0 0 1 0 1 1 1 2 2 1 3No Major Dept 0 0 0 2 0 2 0 0 0 3 4 7TOTAL 33 39 72 285 256 541 106 95 201 553 618 1,171
Biomedical Eng 0 1 1 4 4 8 3 1 4 19 18 37Chemical Eng 10 8 18 76 50 126 14 5 19 190 119 309Civil & Environmental Eng 4 4 8 57 29 86 9 11 20 123 78 201Electrical & Computer Eng 14 4 18 178 25 203 48 8 56 645 125 770Eng & Public Policy 1 0 1 17 13 30 0 4 4 39 29 68Information Networking Institute 0 0 0 13 2 15 3 0 3 134 40 174Interdisciplinary 0 0 0 3 0 3 0 0 0 5 0 5Materials Science & Eng 2 3 5 37 18 55 8 10 18 104 72 176Mechanical Eng 14 2 16 163 33 196 32 13 45 351 73 424No Major Dept 15 4 19 129 40 169 25 13 38 298 108 406TOTAL 60 26 86 677 214 891 142 65 207 1,908 662 2,570
Biotechnology Management 0 0 0 0 0 0 1 0 1 2 0 2Creative Enterprise Mgmt 0 1 1 11 29 40 5 13 18 23 72 95Masters in Public Management 0 0 0 23 35 58 8 10 18 55 57 112Medical Management 0 0 0 38 5 43 5 2 7 52 11 63Public Policy & Management 3 5 8 53 36 89 28 18 46 166 109 275Public Policy & Mgmt, Adelaide 0 0 0 0 1 1 0 0 0 27 21 48Special MS in Public Mgmt 0 0 0 6 5 11 4 11 15 11 17 28TOTAL 3 6 9 131 111 242 51 54 105 336 287 623
Ctr. for Neural Basis of Cognition 0 0 0 1 0 1 0 0 0 2 0 2Economics 5 2 7 25 13 38 19 3 22 107 50 157English 2 2 4 41 73 114 22 14 36 79 115 194History 1 1 2 18 16 34 7 9 16 35 40 75Information Systems Program 3 1 4 61 6 67 24 4 28 162 42 204Modern Languages 0 2 2 4 6 10 1 3 4 10 22 32Philosophy 1 0 1 28 5 33 3 2 5 42 13 55Psychology 5 1 6 16 34 50 9 8 17 48 69 117Social & Decision Sci 3 3 6 22 33 55 14 11 25 78 81 159Statistics 0 1 1 13 5 18 3 5 8 39 25 64Student-Defined Major 0 0 0 0 0 0 0 1 1 0 1 1No Major Dept 2 11 13 55 64 119 17 20 37 136 164 300TOTAL 22 24 46 284 255 539 119 80 199 738 622 1,360
Computational Biology 0 0 0 1 1 2 1 0 1 9 2 11Entertainment Technology 2 1 3 22 9 31 10 3 13 69 35 104Entertainment Technology, Adelaide 1 0 1 11 2 13 4 0 4 19 6 25Humanities & Arts (BHA) 0 1 1 7 21 28 1 7 8 10 44 54Information Systems Management 1 0 1 11 2 13 6 1 7 134 66 200Information Technology 0 2 2 46 7 53 21 4 25 106 18 124Information Technology, Adelaide 0 0 0 0 0 0 1 0 1 14 4 18Integrated Product Development 0 0 0 1 1 2 1 0 1 4 4 8Sci & Humanities Scholars (SHS) 3 2 5 39 39 78 14 16 30 87 100 187Science & Arts (BSA) 0 0 0 1 5 6 1 3 4 2 11 13Special Info Technology Mgmt 0 0 0 4 2 6 1 0 1 6 2 8TOTAL 7 6 13 143 89 232 61 34 95 460 292 752
Biological Sci 5 5 10 43 61 104 11 6 17 127 156 283Chemistry 3 3 6 40 32 72 9 8 17 105 89 194Mathematical Sci 8 0 8 54 19 73 12 3 15 124 39 163Physics 1 0 1 51 15 66 21 4 25 113 26 139No Major Dept 2 2 4 51 25 76 12 16 28 112 85 197TOTAL 19 10 29 239 152 391 65 37 102 581 395 976
Computer Science 33 2 35 244 53 297 64 9 73 579 134 713Human-Computer Interaction 0 0 0 16 6 22 6 8 14 44 34 78Language Technologies Institute 0 0 0 14 1 15 9 2 11 91 26 117Machine Learning 0 0 0 8 1 9 2 0 2 24 8 32Robotics 1 0 1 38 3 41 9 0 9 92 12 104Software Eng 2 0 2 41 8 49 9 1 10 175 35 210TOTAL 36 2 38 361 72 433 99 20 119 1,005 249 1,254
Business Adm 15 1 16 85 44 129 31 14 45 286 173 459School of Business 12 5 17 127 29 156 37 13 50 484 148 632School of Business, Flex-time 11 0 11 133 43 176 34 3 37 270 76 346TOTAL 38 6 44 345 116 461 102 30 132 1,040 397 1,437
Special 3 0 3 20 21 41 5 5 10 49 42 91
Qatar Business Adm 0 0 0 0 0 0 8 5 13 40 69 109Qatar Computer Science 0 0 0 0 0 0 0 0 0 24 34 58West Coast Campus 1 0 1 20 2 22 12 6 18 73 19 92TOTAL 1 0 1 20 2 22 20 11 31 137 122 259
222 119 341 2,505 1,288 3,793 770 431 1,201 6,807 3,686 10,493
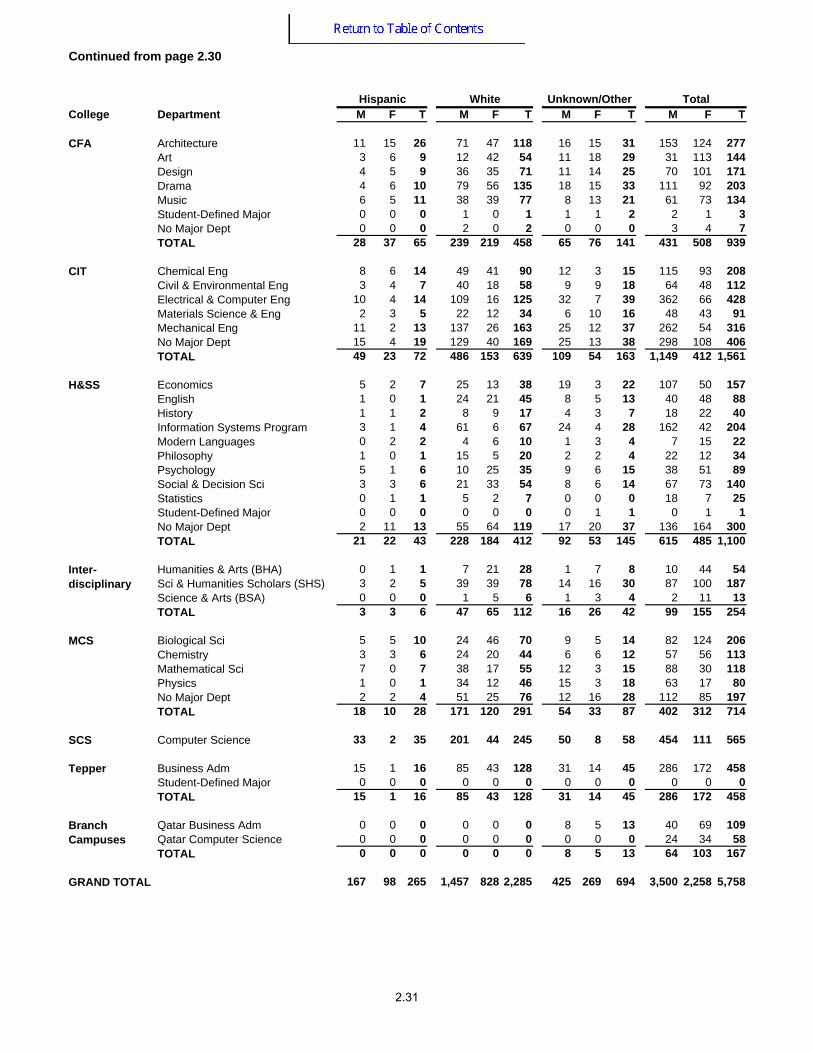
Continued from page 2.28
Hispanic White Unknown/Other Total
CFA
CIT
HEINZ
H&SS
Branch Campuses
GRAND TOTAL
MCS
SCS
Tepper
Inter-disciplinary
2.29
College Department M F T M F T M F T M F T
Architecture 17 16 33 12 3 15 26 28 54 0 0 0Art 2 18 20 0 4 4 3 25 28 0 0 0Design 1 12 13 3 0 3 15 35 50 0 0 0Drama 0 2 2 7 9 16 3 4 7 0 0 0Music 1 5 6 3 4 7 4 6 10 1 1 2Student-Defined Major 0 0 0 0 0 0 0 0 0 0 0 0No Major Dept 0 2 2 1 0 1 0 2 2 0 0 0TOTAL 21 55 76 26 20 46 51 100 151 1 1 2
Chemical Eng 10 15 25 3 3 6 32 25 57 1 0 1Civil & Environmental Eng 2 5 7 3 3 6 7 9 16 0 0 0Electrical & Computer Eng 80 13 93 16 3 19 112 23 135 3 0 3Materials Science & Eng 3 3 6 3 3 6 12 10 22 0 2 2Mechanical Eng 28 4 32 7 5 12 52 5 57 2 0 2No Major Dept 46 17 63 18 8 26 64 25 89 1 1 2TOTAL 169 57 226 50 25 75 279 97 376 7 3 10
Economics 14 12 26 7 3 10 37 17 54 0 0 0English 0 1 1 4 6 10 3 14 17 0 1 1History 1 0 1 2 6 8 2 3 5 0 0 0Information Systems Program 17 3 20 14 4 18 42 24 66 1 0 1Modern Languages 1 1 2 0 0 0 1 3 4 0 0 0Philosophy 0 0 0 1 4 5 2 1 3 1 0 1Psychology 2 3 5 4 6 10 7 10 17 1 0 1Social & Decision Sci 9 7 16 6 6 12 20 17 37 0 1 1Statistics 2 1 3 0 0 0 11 3 14 0 0 0Student-Defined Major 0 0 0 0 0 0 0 0 0 0 0 0No Major Dept 16 14 30 13 19 32 32 35 67 1 1 2TOTAL 62 42 104 51 54 105 157 127 284 4 3 7
Humanities & Arts (BHA) 0 3 3 1 2 3 1 9 10 0 1 1Sci & Humanities Scholars (SHS) 7 10 17 1 2 3 23 31 54 0 0 0Science & Arts (BSA) 0 0 0 0 0 0 0 3 3 0 0 0TOTAL 7 13 20 2 4 6 24 43 67 0 1 1
Biological Sci 10 9 19 3 6 9 30 52 82 1 1 2Chemistry 7 9 16 2 3 5 15 15 30 0 0 0Mathematical Sci 9 2 11 3 1 4 19 7 26 0 0 0Physics 2 0 2 0 0 0 11 2 13 0 0 0No Major Dept 17 13 30 2 3 5 28 26 54 0 0 0TOTAL 45 33 78 10 13 23 103 102 205 1 1 2
SCS Computer Science 65 12 77 9 3 12 95 41 136 1 1 2
Tepper Business Adm 54 32 86 16 5 21 84 77 161 1 0 1
Qatar Business Adm 32 64 96 0 0 0 0 0 0 0 0 0Qatar Computer Science 24 34 58 0 0 0 0 0 0 0 0 0TOTAL 56 98 154 0 0 0 0 0 0 0 0 0
479 342 821 164 124 288 793 587 1,380 15 10 25GRAND TOTAL
Inter-disciplinary
MCS
CFA
CIT
H&SS
Branch Campuses
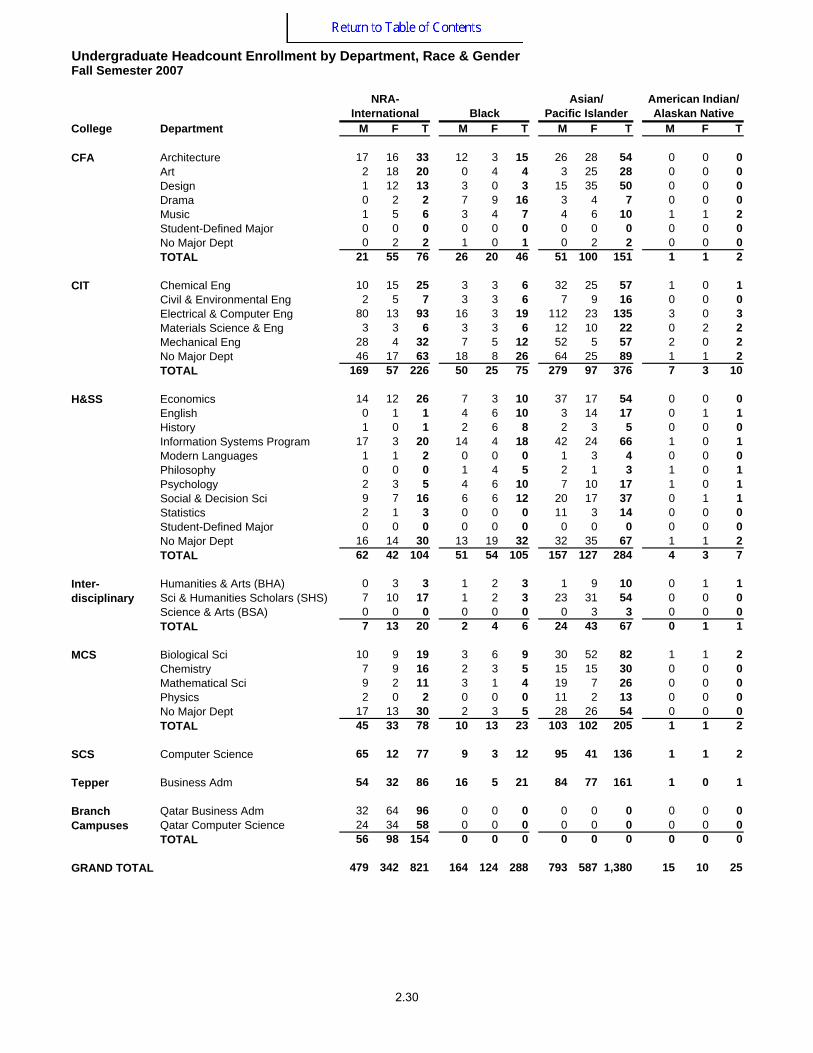
Undergraduate Headcount Enrollment by Department, Race & GenderFall Semester 2007
NRA-International Black
Asian/ Pacific Islander
American Indian/ Alaskan Native
2.30
College Department M F T M F T M F T M F T
Architecture 11 15 26 71 47 118 16 15 31 153 124 277Art 3 6 9 12 42 54 11 18 29 31 113 144Design 4 5 9 36 35 71 11 14 25 70 101 171Drama 4 6 10 79 56 135 18 15 33 111 92 203Music 6 5 11 38 39 77 8 13 21 61 73 134Student-Defined Major 0 0 0 1 0 1 1 1 2 2 1 3No Major Dept 0 0 0 2 0 2 0 0 0 3 4 7TOTAL 28 37 65 239 219 458 65 76 141 431 508 939
Chemical Eng 8 6 14 49 41 90 12 3 15 115 93 208Civil & Environmental Eng 3 4 7 40 18 58 9 9 18 64 48 112Electrical & Computer Eng 10 4 14 109 16 125 32 7 39 362 66 428Materials Science & Eng 2 3 5 22 12 34 6 10 16 48 43 91Mechanical Eng 11 2 13 137 26 163 25 12 37 262 54 316No Major Dept 15 4 19 129 40 169 25 13 38 298 108 406TOTAL 49 23 72 486 153 639 109 54 163 1,149 412 1,561
Economics 5 2 7 25 13 38 19 3 22 107 50 157English 1 0 1 24 21 45 8 5 13 40 48 88History 1 1 2 8 9 17 4 3 7 18 22 40Information Systems Program 3 1 4 61 6 67 24 4 28 162 42 204Modern Languages 0 2 2 4 6 10 1 3 4 7 15 22Philosophy 1 0 1 15 5 20 2 2 4 22 12 34Psychology 5 1 6 10 25 35 9 6 15 38 51 89Social & Decision Sci 3 3 6 21 33 54 8 6 14 67 73 140Statistics 0 1 1 5 2 7 0 0 0 18 7 25Student-Defined Major 0 0 0 0 0 0 0 1 1 0 1 1No Major Dept 2 11 13 55 64 119 17 20 37 136 164 300TOTAL 21 22 43 228 184 412 92 53 145 615 485 1,100
Humanities & Arts (BHA) 0 1 1 7 21 28 1 7 8 10 44 54Sci & Humanities Scholars (SHS) 3 2 5 39 39 78 14 16 30 87 100 187Science & Arts (BSA) 0 0 0 1 5 6 1 3 4 2 11 13TOTAL 3 3 6 47 65 112 16 26 42 99 155 254
Biological Sci 5 5 10 24 46 70 9 5 14 82 124 206Chemistry 3 3 6 24 20 44 6 6 12 57 56 113Mathematical Sci 7 0 7 38 17 55 12 3 15 88 30 118Physics 1 0 1 34 12 46 15 3 18 63 17 80No Major Dept 2 2 4 51 25 76 12 16 28 112 85 197TOTAL 18 10 28 171 120 291 54 33 87 402 312 714
SCS Computer Science 33 2 35 201 44 245 50 8 58 454 111 565
Business Adm 15 1 16 85 43 128 31 14 45 286 172 458Student-Defined Major 0 0 0 0 0 0 0 0 0 0 0 0TOTAL 15 1 16 85 43 128 31 14 45 286 172 458
Qatar Business Adm 0 0 0 0 0 0 8 5 13 40 69 109Qatar Computer Science 0 0 0 0 0 0 0 0 0 24 34 58TOTAL 0 0 0 0 0 0 8 5 13 64 103 167
167 98 265 1,457 828 2,285 425 269 694 3,500 2,258 5,758
Continued from page 2.30
Hispanic White Unknown/Other Total
CFA
CIT
H&SS
Branch Campuses
GRAND TOTAL
Inter-disciplinary
MCS
Tepper
2.31
College Department M F T M F T M F T M F T
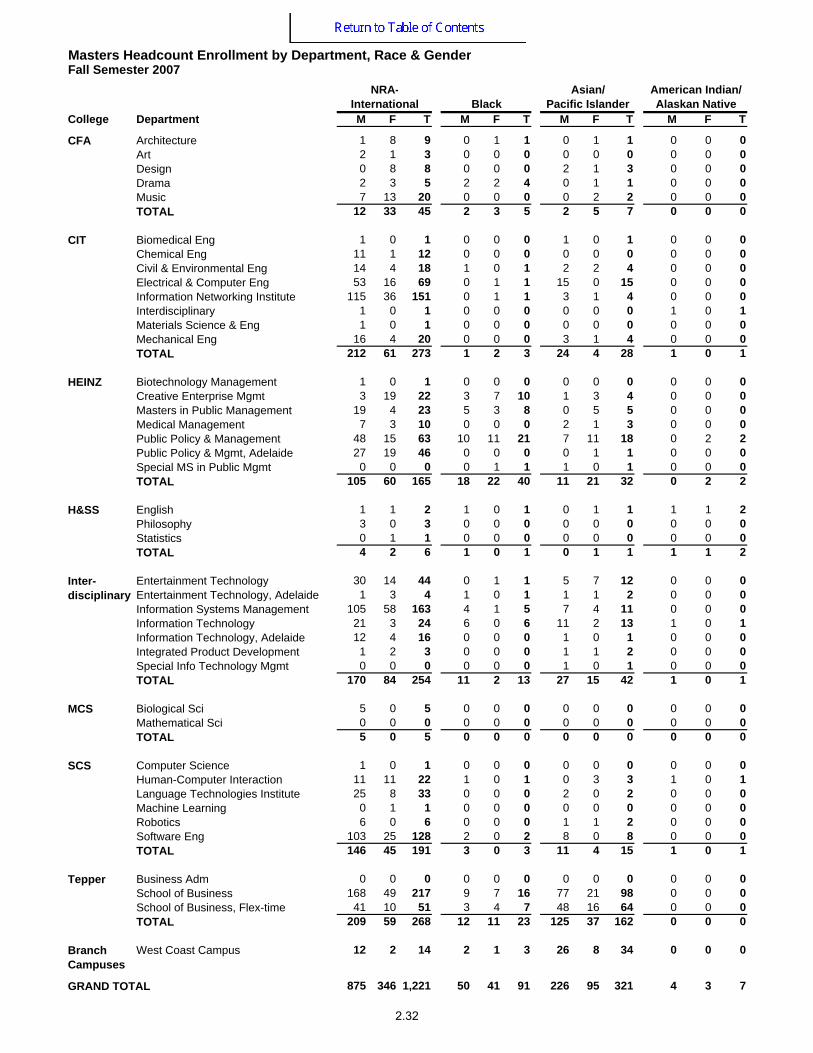
Architecture 1 8 9 0 1 1 0 1 1 0 0 0Art 2 1 3 0 0 0 0 0 0 0 0 0Design 0 8 8 0 0 0 2 1 3 0 0 0Drama 2 3 5 2 2 4 0 1 1 0 0 0Music 7 13 20 0 0 0 0 2 2 0 0 0TOTAL 12 33 45 2 3 5 2 5 7 0 0 0
Biomedical Eng 1 0 1 0 0 0 1 0 1 0 0 0Chemical Eng 11 1 12 0 0 0 0 0 0 0 0 0Civil & Environmental Eng 14 4 18 1 0 1 2 2 4 0 0 0Electrical & Computer Eng 53 16 69 0 1 1 15 0 15 0 0 0Information Networking Institute 115 36 151 0 1 1 3 1 4 0 0 0Interdisciplinary 1 0 1 0 0 0 0 0 0 1 0 1Materials Science & Eng 1 0 1 0 0 0 0 0 0 0 0 0Mechanical Eng 16 4 20 0 0 0 3 1 4 0 0 0TOTAL 212 61 273 1 2 3 24 4 28 1 0 1
Biotechnology Management 1 0 1 0 0 0 0 0 0 0 0 0Creative Enterprise Mgmt 3 19 22 3 7 10 1 3 4 0 0 0Masters in Public Management 19 4 23 5 3 8 0 5 5 0 0 0Medical Management 7 3 10 0 0 0 2 1 3 0 0 0Public Policy & Management 48 15 63 10 11 21 7 11 18 0 2 2Public Policy & Mgmt, Adelaide 27 19 46 0 0 0 0 1 1 0 0 0Special MS in Public Mgmt 0 0 0 0 1 1 1 0 1 0 0 0TOTAL 105 60 165 18 22 40 11 21 32 0 2 2
English 1 1 2 1 0 1 0 1 1 1 1 2Philosophy 3 0 3 0 0 0 0 0 0 0 0 0Statistics 0 1 1 0 0 0 0 0 0 0 0 0TOTAL 4 2 6 1 0 1 0 1 1 1 1 2
Entertainment Technology 30 14 44 0 1 1 5 7 12 0 0 0Entertainment Technology, Adelaide 1 3 4 1 0 1 1 1 2 0 0 0Information Systems Management 105 58 163 4 1 5 7 4 11 0 0 0Information Technology 21 3 24 6 0 6 11 2 13 1 0 1Information Technology, Adelaide 12 4 16 0 0 0 1 0 1 0 0 0Integrated Product Development 1 2 3 0 0 0 1 1 2 0 0 0Special Info Technology Mgmt 0 0 0 0 0 0 1 0 1 0 0 0TOTAL 170 84 254 11 2 13 27 15 42 1 0 1
Biological Sci 5 0 5 0 0 0 0 0 0 0 0 0Mathematical Sci 0 0 0 0 0 0 0 0 0 0 0 0TOTAL 5 0 5 0 0 0 0 0 0 0 0 0
Computer Science 1 0 1 0 0 0 0 0 0 0 0 0Human-Computer Interaction 11 11 22 1 0 1 0 3 3 1 0 1Language Technologies Institute 25 8 33 0 0 0 2 0 2 0 0 0Machine Learning 0 1 1 0 0 0 0 0 0 0 0 0Robotics 6 0 6 0 0 0 1 1 2 0 0 0Software Eng 103 25 128 2 0 2 8 0 8 0 0 0TOTAL 146 45 191 3 0 3 11 4 15 1 0 1
Business Adm 0 0 0 0 0 0 0 0 0 0 0 0School of Business 168 49 217 9 7 16 77 21 98 0 0 0School of Business, Flex-time 41 10 51 3 4 7 48 16 64 0 0 0TOTAL 209 59 268 12 11 23 125 37 162 0 0 0
West Coast Campus 12 2 14 2 1 3 26 8 34 0 0 0
875 346 1,221 50 41 91 226 95 321 4 3 7
Branch Campuses
GRAND TOTAL
H&SS
Inter-disciplinary
MCS
SCS
CFA
CIT
HEINZ
Tepper
Masters Headcount Enrollment by Department, Race & GenderFall Semester 2007
NRA-International Black
Asian/ Pacific Islander
American Indian/ Alaskan Native
2.32

College Department M F T M F T M F T M F T
Architecture 0 0 0 2 2 4 2 0 2 5 12 17Art 2 0 2 5 5 10 2 1 3 11 7 18Design 0 1 1 12 10 22 0 0 0 14 20 34Drama 0 1 1 16 15 31 3 2 5 23 24 47Music 3 0 3 6 3 9 32 16 48 48 34 82TOTAL 5 2 7 41 35 76 39 19 58 101 97 198
Biomedical Eng 0 0 0 0 0 0 0 0 0 2 0 2Chemical Eng 0 1 1 3 1 4 2 1 3 16 4 20Civil & Environmental Eng 1 0 1 9 6 15 0 0 0 27 12 39Electrical & Computer Eng 3 0 3 20 2 22 4 1 5 95 20 115Information Networking Institute 0 0 0 13 2 15 3 0 3 134 40 174Interdisciplinary 0 0 0 3 0 3 0 0 0 5 0 5Materials Science & Eng 0 0 0 0 0 0 0 0 0 1 0 1Mechanical Eng 1 0 1 9 2 11 2 1 3 31 8 39TOTAL 5 1 6 57 13 70 11 3 14 311 84 395
Biotechnology Management 0 0 0 0 0 0 1 0 1 2 0 2Creative Enterprise Mgmt 0 1 1 11 29 40 5 13 18 23 72 95Masters in Public Management 0 0 0 23 35 58 8 10 18 55 57 112Medical Management 0 0 0 38 5 43 5 2 7 52 11 63Public Policy & Management 3 5 8 42 35 77 25 18 43 135 97 232Public Policy & Mgmt, Adelaide 0 0 0 0 1 1 0 0 0 27 21 48Special MS in Public Mgmt 0 0 0 6 5 11 4 11 15 11 17 28TOTAL 3 6 9 120 110 230 48 54 102 305 275 580
English 0 2 2 10 37 47 7 3 10 20 45 65Philosophy 0 0 0 5 0 5 1 0 1 9 0 9Statistics 0 0 0 2 0 2 0 0 0 2 1 3TOTAL 0 2 2 17 37 54 8 3 11 31 46 77
Entertainment Technology 2 1 3 22 9 31 10 3 13 69 35 104Entertainment Technology, Adelaide 1 0 1 11 2 13 4 0 4 19 6 25Information Systems Management 1 0 1 11 2 13 6 1 7 134 66 200Information Technology 0 2 2 46 7 53 21 4 25 106 18 124Information Technology, Adelaide 0 0 0 0 0 0 1 0 1 14 4 18Integrated Product Development 0 0 0 1 1 2 1 0 1 4 4 8Special Info Technology Mgmt 0 0 0 4 2 6 1 0 1 6 2 8TOTAL 4 3 7 95 23 118 44 8 52 352 135 487
Biological Sci 0 0 0 5 1 6 0 1 1 10 2 12Mathematical Sci 0 0 0 1 0 1 0 0 0 1 0 1TOTAL 0 0 0 6 1 7 0 1 1 11 2 13
Computer Science 0 0 0 2 0 2 0 0 0 3 0 3Human-Computer Interaction 0 0 0 11 3 14 2 2 4 26 19 45Language Technologies Institute 0 0 0 5 1 6 1 1 2 33 10 43Machine Learning 0 0 0 0 0 0 0 0 0 0 1 1Robotics 1 0 1 4 0 4 2 0 2 14 1 15Software Eng 1 0 1 24 3 27 7 1 8 145 29 174TOTAL 2 0 2 46 7 53 12 4 16 221 60 281
Business Adm 0 0 0 0 1 1 0 0 0 0 1 1School of Business 12 5 17 116 22 138 34 12 46 416 116 532School of Business, Flex-time 11 0 11 133 43 176 34 3 37 270 76 346TOTAL 23 5 28 249 66 315 68 15 83 686 193 879
West Coast Campus 1 0 1 20 2 22 12 6 18 73 19 92
43 19 62 651 294 945 242 113 355 2,091 911 3,002
Continued from page 2.32
Hispanic White Unknown/Other Total
CFA
CIT
HEINZ
Tepper
Branch Campuses
GRAND TOTAL
H&SS
Inter-disciplinary
MCS
SCS
2.33
College Department M F T M F T M F T M F T
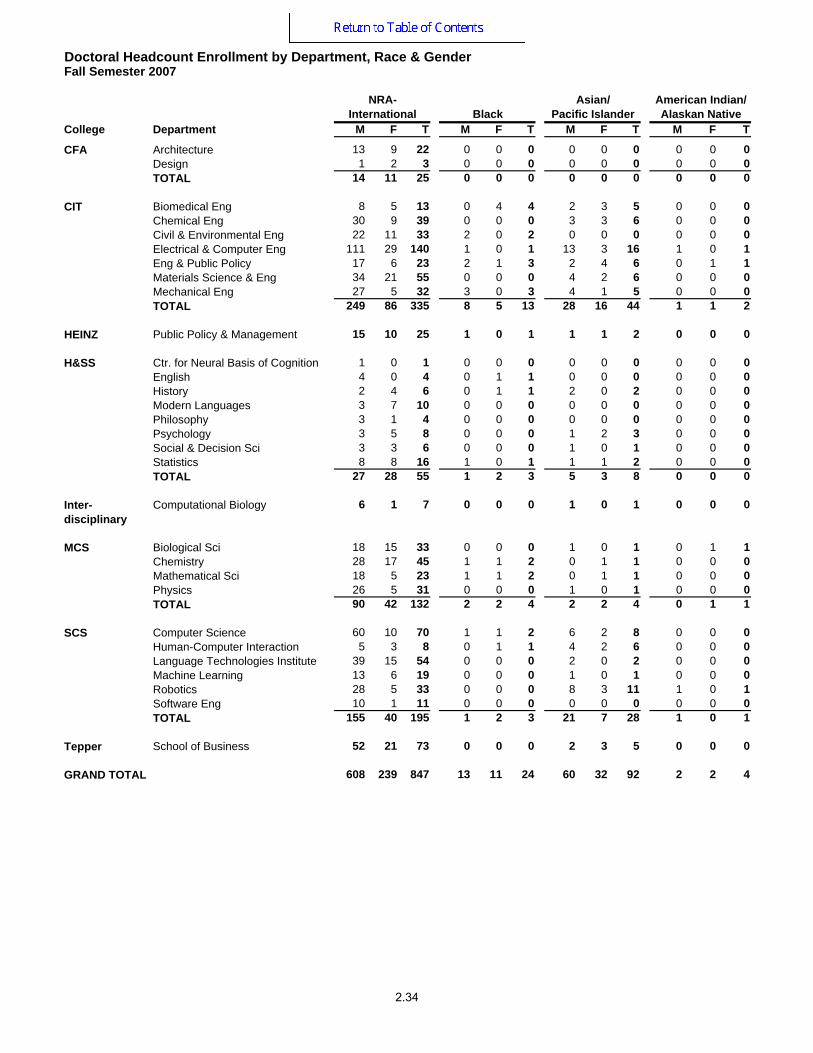
Architecture 13 9 22 0 0 0 0 0 0 0 0 0Design 1 2 3 0 0 0 0 0 0 0 0 0TOTAL 14 11 25 0 0 0 0 0 0 0 0 0
Biomedical Eng 8 5 13 0 4 4 2 3 5 0 0 0Chemical Eng 30 9 39 0 0 0 3 3 6 0 0 0Civil & Environmental Eng 22 11 33 2 0 2 0 0 0 0 0 0Electrical & Computer Eng 111 29 140 1 0 1 13 3 16 1 0 1Eng & Public Policy 17 6 23 2 1 3 2 4 6 0 1 1Materials Science & Eng 34 21 55 0 0 0 4 2 6 0 0 0Mechanical Eng 27 5 32 3 0 3 4 1 5 0 0 0TOTAL 249 86 335 8 5 13 28 16 44 1 1 2
HEINZ Public Policy & Management 15 10 25 1 0 1 1 1 2 0 0 0
Ctr. for Neural Basis of Cognition 1 0 1 0 0 0 0 0 0 0 0 0English 4 0 4 0 1 1 0 0 0 0 0 0History 2 4 6 0 1 1 2 0 2 0 0 0Modern Languages 3 7 10 0 0 0 0 0 0 0 0 0Philosophy 3 1 4 0 0 0 0 0 0 0 0 0Psychology 3 5 8 0 0 0 1 2 3 0 0 0Social & Decision Sci 3 3 6 0 0 0 1 0 1 0 0 0Statistics 8 8 16 1 0 1 1 1 2 0 0 0TOTAL 27 28 55 1 2 3 5 3 8 0 0 0
Computational Biology 6 1 7 0 0 0 1 0 1 0 0 0
Biological Sci 18 15 33 0 0 0 1 0 1 0 1 1Chemistry 28 17 45 1 1 2 0 1 1 0 0 0Mathematical Sci 18 5 23 1 1 2 0 1 1 0 0 0Physics 26 5 31 0 0 0 1 0 1 0 0 0TOTAL 90 42 132 2 2 4 2 2 4 0 1 1
Computer Science 60 10 70 1 1 2 6 2 8 0 0 0Human-Computer Interaction 5 3 8 0 1 1 4 2 6 0 0 0Language Technologies Institute 39 15 54 0 0 0 2 0 2 0 0 0Machine Learning 13 6 19 0 0 0 1 0 1 0 0 0Robotics 28 5 33 0 0 0 8 3 11 1 0 1Software Eng 10 1 11 0 0 0 0 0 0 0 0 0TOTAL 155 40 195 1 2 3 21 7 28 1 0 1
Tepper School of Business 52 21 73 0 0 0 2 3 5 0 0 0
608 239 847 13 11 24 60 32 92 2 2 4
CFA
CIT
GRAND TOTAL
H&SS
Inter-disciplinary
MCS
SCS
Doctoral Headcount Enrollment by Department, Race & GenderFall Semester 2007
NRA-International Black
Asian/ Pacific Islander
American Indian/ Alaskan Native
2.34

College Department M F T M F T M F T M F T
Architecture 0 0 0 5 2 7 1 0 1 19 11 30Design 0 0 0 0 0 0 1 0 1 2 2 4TOTAL 0 0 0 5 2 7 2 0 2 21 13 34
Biomedical Eng 0 1 1 4 4 8 3 1 4 17 18 35Chemical Eng 2 1 3 24 8 32 0 1 1 59 22 81Civil & Environmental Eng 0 0 0 8 5 13 0 2 2 32 18 50Electrical & Computer Eng 1 0 1 49 7 56 12 0 12 188 39 227Eng & Public Policy 1 0 1 17 13 30 0 4 4 39 29 68Materials Science & Eng 0 0 0 15 6 21 2 0 2 55 29 84Mechanical Eng 2 0 2 17 5 22 5 0 5 58 11 69TOTAL 6 2 8 134 48 182 22 8 30 448 166 614
HEINZ Public Policy & Management 0 0 0 11 1 12 3 0 3 31 12 43
Ctr. for Neural Basis of Cognition 0 0 0 1 0 1 0 0 0 2 0 2English 1 0 1 7 15 22 7 6 13 19 22 41History 0 0 0 10 7 17 3 6 9 17 18 35Modern Languages 0 0 0 0 0 0 0 0 0 3 7 10Philosophy 0 0 0 8 0 8 0 0 0 11 1 12Psychology 0 0 0 6 9 15 0 2 2 10 18 28Social & Decision Sci 0 0 0 1 0 1 6 5 11 11 8 19Statistics 0 0 0 6 3 9 3 5 8 19 17 36TOTAL 1 0 1 39 34 73 19 24 43 92 91 183
Computational Biology 0 0 0 1 1 2 1 0 1 9 2 11
Biological Sci 0 0 0 14 14 28 2 0 2 35 30 65Chemistry 0 0 0 16 12 28 3 2 5 48 33 81Mathematical Sci 1 0 1 15 2 17 0 0 0 35 9 44Physics 0 0 0 17 3 20 6 1 7 50 9 59TOTAL 1 0 1 62 31 93 11 3 14 168 81 249
Computer Science 0 0 0 41 9 50 14 1 15 122 23 145Human-Computer Interaction 0 0 0 5 3 8 4 6 10 18 15 33Language Technologies Institute 0 0 0 9 0 9 8 1 9 58 16 74Machine Learning 0 0 0 8 1 9 2 0 2 24 7 31Robotics 0 0 0 34 3 37 7 0 7 78 11 89Software Eng 1 0 1 17 5 22 2 0 2 30 6 36TOTAL 1 0 1 114 21 135 37 8 45 330 78 408
Tepper School of Business 0 0 0 11 7 18 3 1 4 68 32 100
9 2 11 377 145 522 98 44 142 1,167 475 1,642
CFA
CIT
GRAND TOTAL
H&SS
Inter-disciplinary
MCS
SCS
Continued from page 2.34
Hispanic White Unknown/Other Total
2.35
College Department FT PT T FT PT T FT PT T FT PT T
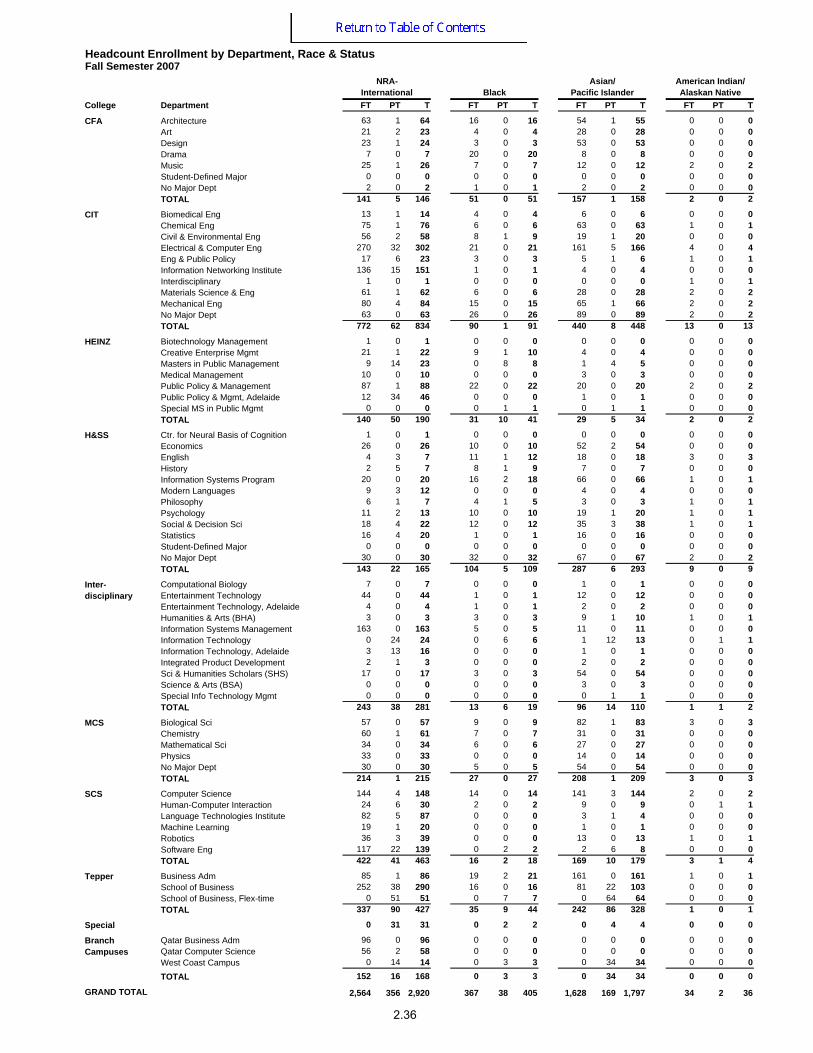
Architecture 63 1 64 16 0 16 54 1 55 0 0 0Art 21 2 23 4 0 4 28 0 28 0 0 0Design 23 1 24 3 0 3 53 0 53 0 0 0Drama 7 0 7 20 0 20 8 0 8 0 0 0Music 25 1 26 7 0 7 12 0 12 2 0 2Student-Defined Major 0 0 0 0 0 0 0 0 0 0 0 0No Major Dept 2 0 2 1 0 1 2 0 2 0 0 0TOTAL 141 5 146 51 0 51 157 1 158 2 0 2
Biomedical Eng 13 1 14 4 0 4 6 0 6 0 0 0Chemical Eng 75 1 76 6 0 6 63 0 63 1 0 1Civil & Environmental Eng 56 2 58 8 1 9 19 1 20 0 0 0Electrical & Computer Eng 270 32 302 21 0 21 161 5 166 4 0 4Eng & Public Policy 17 6 23 3 0 3 5 1 6 1 0 1Information Networking Institute 136 15 151 1 0 1 4 0 4 0 0 0Interdisciplinary 1 0 1 0 0 0 0 0 0 1 0 1Materials Science & Eng 61 1 62 6 0 6 28 0 28 2 0 2Mechanical Eng 80 4 84 15 0 15 65 1 66 2 0 2No Major Dept 63 0 63 26 0 26 89 0 89 2 0 2TOTAL 772 62 834 90 1 91 440 8 448 13 0 13
Biotechnology Management 1 0 1 0 0 0 0 0 0 0 0 0Creative Enterprise Mgmt 21 1 22 9 1 10 4 0 4 0 0 0Masters in Public Management 9 14 23 0 8 8 1 4 5 0 0 0Medical Management 10 0 10 0 0 0 3 0 3 0 0 0Public Policy & Management 87 1 88 22 0 22 20 0 20 2 0 2Public Policy & Mgmt, Adelaide 12 34 46 0 0 0 1 0 1 0 0 0Special MS in Public Mgmt 0 0 0 0 1 1 0 1 1 0 0 0TOTAL 140 50 190 31 10 41 29 5 34 2 0 2
Ctr. for Neural Basis of Cognition 1 0 1 0 0 0 0 0 0 0 0 0Economics 26 0 26 10 0 10 52 2 54 0 0 0English 4 3 7 11 1 12 18 0 18 3 0 3History 2 5 7 8 1 9 7 0 7 0 0 0Information Systems Program 20 0 20 16 2 18 66 0 66 1 0 1Modern Languages 9 3 12 0 0 0 4 0 4 0 0 0Philosophy 6 1 7 4 1 5 3 0 3 1 0 1Psychology 11 2 13 10 0 10 19 1 20 1 0 1Social & Decision Sci 18 4 22 12 0 12 35 3 38 1 0 1Statistics 16 4 20 1 0 1 16 0 16 0 0 0Student-Defined Major 0 0 0 0 0 0 0 0 0 0 0 0No Major Dept 30 0 30 32 0 32 67 0 67 2 0 2TOTAL 143 22 165 104 5 109 287 6 293 9 0 9
Computational Biology 7 0 7 0 0 0 1 0 1 0 0 0Entertainment Technology 44 0 44 1 0 1 12 0 12 0 0 0Entertainment Technology, Adelaide 4 0 4 1 0 1 2 0 2 0 0 0Humanities & Arts (BHA) 3 0 3 3 0 3 9 1 10 1 0 1Information Systems Management 163 0 163 5 0 5 11 0 11 0 0 0Information Technology 0 24 24 0 6 6 1 12 13 0 1 1Information Technology, Adelaide 3 13 16 0 0 0 1 0 1 0 0 0Integrated Product Development 2 1 3 0 0 0 2 0 2 0 0 0Sci & Humanities Scholars (SHS) 17 0 17 3 0 3 54 0 54 0 0 0Science & Arts (BSA) 0 0 0 0 0 0 3 0 3 0 0 0Special Info Technology Mgmt 0 0 0 0 0 0 0 1 1 0 0 0TOTAL 243 38 281 13 6 19 96 14 110 1 1 2
Biological Sci 57 0 57 9 0 9 82 1 83 3 0 3Chemistry 60 1 61 7 0 7 31 0 31 0 0 0Mathematical Sci 34 0 34 6 0 6 27 0 27 0 0 0Physics 33 0 33 0 0 0 14 0 14 0 0 0No Major Dept 30 0 30 5 0 5 54 0 54 0 0 0TOTAL 214 1 215 27 0 27 208 1 209 3 0 3
Computer Science 144 4 148 14 0 14 141 3 144 2 0 2Human-Computer Interaction 24 6 30 2 0 2 9 0 9 0 1 1Language Technologies Institute 82 5 87 0 0 0 3 1 4 0 0 0Machine Learning 19 1 20 0 0 0 1 0 1 0 0 0Robotics 36 3 39 0 0 0 13 0 13 1 0 1Software Eng 117 22 139 0 2 2 2 6 8 0 0 0TOTAL 422 41 463 16 2 18 169 10 179 3 1 4
Business Adm 85 1 86 19 2 21 161 0 161 1 0 1School of Business 252 38 290 16 0 16 81 22 103 0 0 0School of Business, Flex-time 0 51 51 0 7 7 0 64 64 0 0 0TOTAL 337 90 427 35 9 44 242 86 328 1 0 1
Special 0 31 31 0 2 2 0 4 4 0 0 0
Qatar Business Adm 96 0 96 0 0 0 0 0 0 0 0 0Qatar Computer Science 56 2 58 0 0 0 0 0 0 0 0 0West Coast Campus 0 14 14 0 3 3 0 34 34 0 0 0TOTAL 152 16 168 0 3 3 0 34 34 0 0 0
2,564 356 2,920 367 38 405 1,628 169 1,797 34 2 36
Headcount Enrollment by Department, Race & StatusFall Semester 2007
NRA- International Black
Asian/ Pacific Islander
American Indian/ Alaskan Native
Inter-disciplinary
CFA
CIT
HEINZ
H&SS
Branch Campuses
GRAND TOTAL
MCS
SCS
Tepper
2.36

College Department FT PT T FT PT T FT PT T FT PT T
Architecture 26 0 26 124 5 129 34 0 34 317 7 324Art 11 0 11 63 1 64 32 0 32 159 3 162Design 9 1 10 84 9 93 24 2 26 196 13 209Drama 11 0 11 165 1 166 38 0 38 249 1 250Music 14 0 14 84 2 86 63 6 69 207 9 216Student-Defined Major 0 0 0 1 0 1 2 0 2 3 0 3No Major Dept 0 0 0 2 0 2 0 0 0 7 0 7TOTAL 71 1 72 523 18 541 193 8 201 1,138 33 1,171
Biomedical Eng 0 1 1 7 1 8 3 1 4 33 4 37Chemical Eng 18 0 18 119 7 126 17 2 19 299 10 309Civil & Environmental Eng 8 0 8 81 5 86 20 0 20 192 9 201Electrical & Computer Eng 17 1 18 196 7 203 54 2 56 723 47 770Eng & Public Policy 1 0 1 28 2 30 4 0 4 59 9 68Information Networking Institute 0 0 0 14 1 15 2 1 3 157 17 174Interdisciplinary 0 0 0 3 0 3 0 0 0 5 0 5Materials Science & Eng 5 0 5 53 2 55 18 0 18 173 3 176Mechanical Eng 13 3 16 188 8 196 43 2 45 406 18 424No Major Dept 19 0 19 169 0 169 38 0 38 406 0 406TOTAL 81 5 86 858 33 891 199 8 207 2,453 117 2,570
Biotechnology Management 0 0 0 0 0 0 1 0 1 2 0 2Creative Enterprise Mgmt 1 0 1 39 1 40 18 0 18 92 3 95Masters in Public Management 0 0 0 2 56 58 0 18 18 12 100 112Medical Management 0 0 0 43 0 43 7 0 7 63 0 63Public Policy & Management 8 0 8 85 4 89 46 0 46 270 5 275Public Policy & Mgmt, Adelaide 0 0 0 1 0 1 0 0 0 14 34 48Special MS in Public Mgmt 0 0 0 0 11 11 0 15 15 0 28 28TOTAL 9 0 9 170 72 242 72 33 105 453 170 623
Ctr. for Neural Basis of Cognition 0 0 0 1 0 1 0 0 0 2 0 2Economics 7 0 7 37 1 38 22 0 22 154 3 157English 4 0 4 88 26 114 26 10 36 154 40 194History 2 0 2 22 12 34 7 9 16 48 27 75Information Systems Program 4 0 4 63 4 67 28 0 28 198 6 204Modern Languages 1 1 2 8 2 10 3 1 4 25 7 32Philosophy 1 0 1 28 5 33 4 1 5 47 8 55Psychology 6 0 6 46 4 50 16 1 17 109 8 117Social & Decision Sci 6 0 6 52 3 55 19 6 25 143 16 159Statistics 1 0 1 18 0 18 7 1 8 59 5 64Student-Defined Major 0 0 0 0 0 0 0 1 1 0 1 1No Major Dept 13 0 13 119 0 119 37 0 37 300 0 300TOTAL 45 1 46 482 57 539 169 30 199 1,239 121 1,360
Computational Biology 0 0 0 2 0 2 1 0 1 11 0 11Entertainment Technology 3 0 3 31 0 31 13 0 13 104 0 104Entertainment Technology, Adelaide 1 0 1 13 0 13 4 0 4 25 0 25Humanities & Arts (BHA) 0 1 1 24 4 28 7 1 8 47 7 54Information Systems Management 1 0 1 13 0 13 7 0 7 200 0 200Information Technology 0 2 2 0 53 53 0 25 25 1 123 124Information Technology, Adelaide 0 0 0 0 0 0 0 1 1 4 14 18Integrated Product Development 0 0 0 2 0 2 0 1 1 6 2 8Sci & Humanities Scholars (SHS) 5 0 5 76 2 78 30 0 30 185 2 187Science & Arts (BSA) 0 0 0 5 1 6 4 0 4 12 1 13Special Info Technology Mgmt 0 0 0 0 6 6 0 1 1 0 8 8TOTAL 10 3 13 166 66 232 66 29 95 595 157 752
Biological Sci 10 0 10 102 2 104 17 0 17 280 3 283Chemistry 6 0 6 69 3 72 17 0 17 190 4 194Mathematical Sci 8 0 8 70 3 73 15 0 15 160 3 163Physics 1 0 1 64 2 66 25 0 25 137 2 139No Major Dept 4 0 4 74 2 76 28 0 28 195 2 197TOTAL 29 0 29 379 12 391 102 0 102 962 14 976
Computer Science 35 0 35 288 9 297 69 4 73 693 20 713Human-Computer Interaction 0 0 0 19 3 22 14 0 14 68 10 78Language Technologies Institute 0 0 0 15 0 15 9 2 11 109 8 117Machine Learning 0 0 0 9 0 9 2 0 2 31 1 32Robotics 1 0 1 40 1 41 9 0 9 100 4 104Software Eng 2 0 2 28 21 49 3 7 10 152 58 210TOTAL 38 0 38 399 34 433 106 13 119 1,153 101 1,254
Business Adm 16 0 16 126 3 129 43 2 45 451 8 459School of Business 17 0 17 142 14 156 41 9 50 549 83 632School of Business, Flex-time 0 11 11 0 176 176 0 37 37 0 346 346TOTAL 33 11 44 268 193 461 84 48 132 1,000 437 1,437
Special 0 3 3 0 41 41 0 10 10 0 91 91
Qatar Business Adm 0 0 0 0 0 0 12 1 13 108 1 109Qatar Computer Science 0 0 0 0 0 0 0 0 0 56 2 58West Coast Campus 0 1 1 0 22 22 0 18 18 0 92 92TOTAL 0 1 1 0 22 22 12 19 31 164 95 259
316 25 341 3,245 548 3,793 1,003 198 1,201 9,157 1,336 10,493
Branch Campuses
GRAND TOTAL
Inter-disciplinary
MCS
SCS
Tepper
CFA
CIT
HEINZ
H&SS
Continued from page 2.36
Hispanic White Unknown/Other Total
2.37
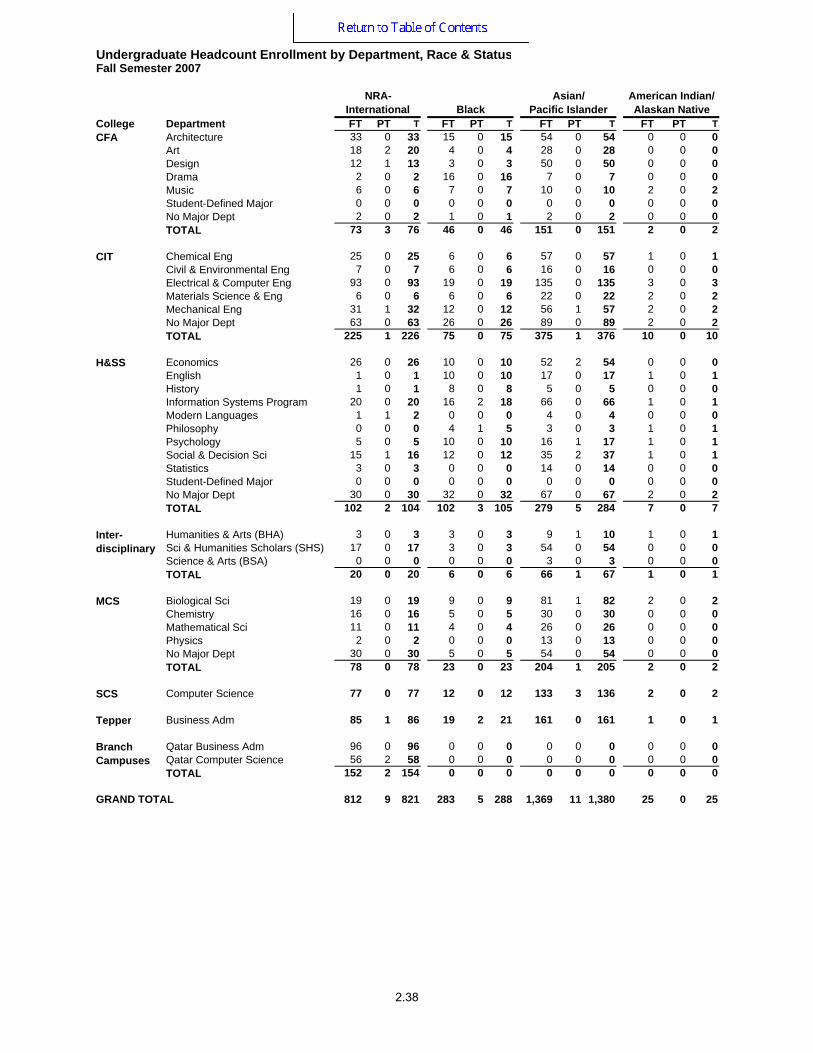
College Department FT PT T FT PT T FT PT T FT PT TArchitecture 33 0 33 15 0 15 54 0 54 0 0 0Art 18 2 20 4 0 4 28 0 28 0 0 0Design 12 1 13 3 0 3 50 0 50 0 0 0Drama 2 0 2 16 0 16 7 0 7 0 0 0Music 6 0 6 7 0 7 10 0 10 2 0 2Student-Defined Major 0 0 0 0 0 0 0 0 0 0 0 0No Major Dept 2 0 2 1 0 1 2 0 2 0 0 0TOTAL 73 3 76 46 0 46 151 0 151 2 0 2
Chemical Eng 25 0 25 6 0 6 57 0 57 1 0 1Civil & Environmental Eng 7 0 7 6 0 6 16 0 16 0 0 0Electrical & Computer Eng 93 0 93 19 0 19 135 0 135 3 0 3Materials Science & Eng 6 0 6 6 0 6 22 0 22 2 0 2Mechanical Eng 31 1 32 12 0 12 56 1 57 2 0 2No Major Dept 63 0 63 26 0 26 89 0 89 2 0 2TOTAL 225 1 226 75 0 75 375 1 376 10 0 10
Economics 26 0 26 10 0 10 52 2 54 0 0 0English 1 0 1 10 0 10 17 0 17 1 0 1History 1 0 1 8 0 8 5 0 5 0 0 0Information Systems Program 20 0 20 16 2 18 66 0 66 1 0 1Modern Languages 1 1 2 0 0 0 4 0 4 0 0 0Philosophy 0 0 0 4 1 5 3 0 3 1 0 1Psychology 5 0 5 10 0 10 16 1 17 1 0 1Social & Decision Sci 15 1 16 12 0 12 35 2 37 1 0 1Statistics 3 0 3 0 0 0 14 0 14 0 0 0Student-Defined Major 0 0 0 0 0 0 0 0 0 0 0 0No Major Dept 30 0 30 32 0 32 67 0 67 2 0 2TOTAL 102 2 104 102 3 105 279 5 284 7 0 7
Humanities & Arts (BHA) 3 0 3 3 0 3 9 1 10 1 0 1Sci & Humanities Scholars (SHS) 17 0 17 3 0 3 54 0 54 0 0 0Science & Arts (BSA) 0 0 0 0 0 0 3 0 3 0 0 0TOTAL 20 0 20 6 0 6 66 1 67 1 0 1
Biological Sci 19 0 19 9 0 9 81 1 82 2 0 2Chemistry 16 0 16 5 0 5 30 0 30 0 0 0Mathematical Sci 11 0 11 4 0 4 26 0 26 0 0 0Physics 2 0 2 0 0 0 13 0 13 0 0 0No Major Dept 30 0 30 5 0 5 54 0 54 0 0 0TOTAL 78 0 78 23 0 23 204 1 205 2 0 2
SCS Computer Science 77 0 77 12 0 12 133 3 136 2 0 2
Tepper Business Adm 85 1 86 19 2 21 161 0 161 1 0 1
Qatar Business Adm 96 0 96 0 0 0 0 0 0 0 0 0Qatar Computer Science 56 2 58 0 0 0 0 0 0 0 0 0TOTAL 152 2 154 0 0 0 0 0 0 0 0 0
812 9 821 283 5 288 1,369 11 1,380 25 0 25GRAND TOTAL
Inter-disciplinary
MCS
CFA
CIT
H&SS
Branch Campuses
Undergraduate Headcount Enrollment by Department, Race & StatusFall Semester 2007
NRA-International Black
Asian/ Pacific Islander
American Indian/ Alaskan Native
2.38
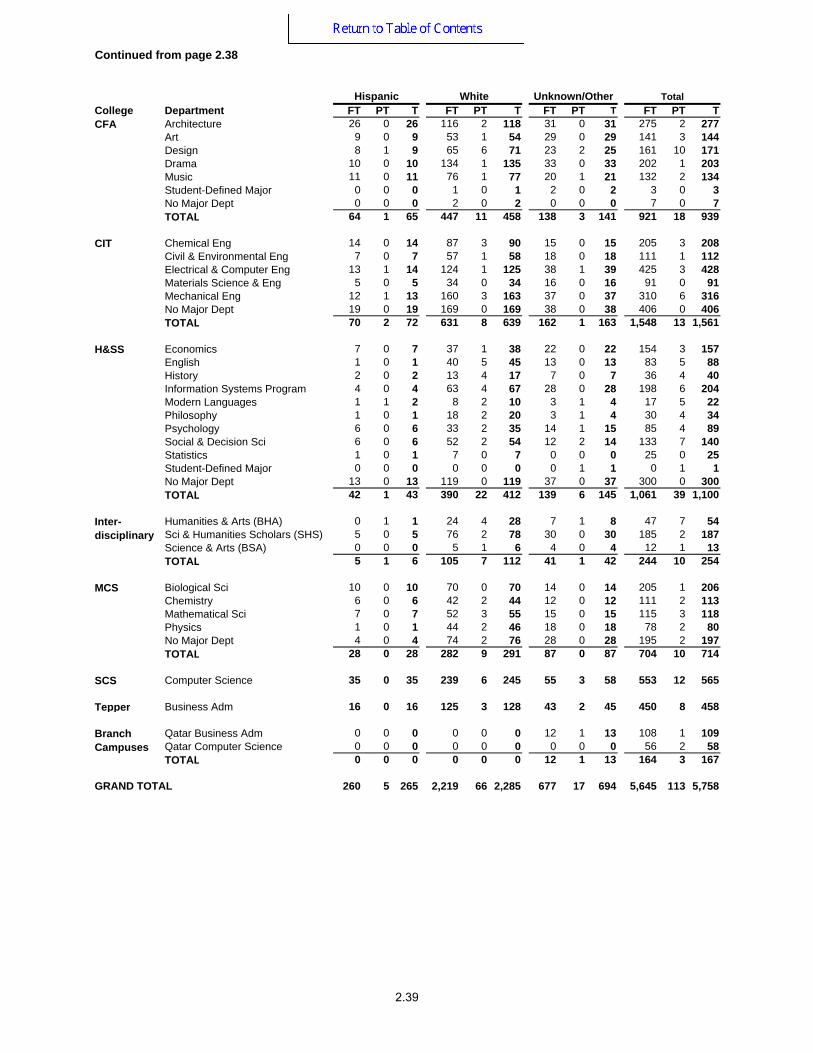
College Department FT PT T FT PT T FT PT T FT PT TArchitecture 26 0 26 116 2 118 31 0 31 275 2 277Art 9 0 9 53 1 54 29 0 29 141 3 144Design 8 1 9 65 6 71 23 2 25 161 10 171Drama 10 0 10 134 1 135 33 0 33 202 1 203Music 11 0 11 76 1 77 20 1 21 132 2 134Student-Defined Major 0 0 0 1 0 1 2 0 2 3 0 3No Major Dept 0 0 0 2 0 2 0 0 0 7 0 7TOTAL 64 1 65 447 11 458 138 3 141 921 18 939
Chemical Eng 14 0 14 87 3 90 15 0 15 205 3 208Civil & Environmental Eng 7 0 7 57 1 58 18 0 18 111 1 112Electrical & Computer Eng 13 1 14 124 1 125 38 1 39 425 3 428Materials Science & Eng 5 0 5 34 0 34 16 0 16 91 0 91Mechanical Eng 12 1 13 160 3 163 37 0 37 310 6 316No Major Dept 19 0 19 169 0 169 38 0 38 406 0 406TOTAL 70 2 72 631 8 639 162 1 163 1,548 13 1,561
Economics 7 0 7 37 1 38 22 0 22 154 3 157English 1 0 1 40 5 45 13 0 13 83 5 88History 2 0 2 13 4 17 7 0 7 36 4 40Information Systems Program 4 0 4 63 4 67 28 0 28 198 6 204Modern Languages 1 1 2 8 2 10 3 1 4 17 5 22Philosophy 1 0 1 18 2 20 3 1 4 30 4 34Psychology 6 0 6 33 2 35 14 1 15 85 4 89Social & Decision Sci 6 0 6 52 2 54 12 2 14 133 7 140Statistics 1 0 1 7 0 7 0 0 0 25 0 25Student-Defined Major 0 0 0 0 0 0 0 1 1 0 1 1No Major Dept 13 0 13 119 0 119 37 0 37 300 0 300TOTAL 42 1 43 390 22 412 139 6 145 1,061 39 1,100
Humanities & Arts (BHA) 0 1 1 24 4 28 7 1 8 47 7 54Sci & Humanities Scholars (SHS) 5 0 5 76 2 78 30 0 30 185 2 187Science & Arts (BSA) 0 0 0 5 1 6 4 0 4 12 1 13TOTAL 5 1 6 105 7 112 41 1 42 244 10 254
Biological Sci 10 0 10 70 0 70 14 0 14 205 1 206Chemistry 6 0 6 42 2 44 12 0 12 111 2 113Mathematical Sci 7 0 7 52 3 55 15 0 15 115 3 118Physics 1 0 1 44 2 46 18 0 18 78 2 80No Major Dept 4 0 4 74 2 76 28 0 28 195 2 197TOTAL 28 0 28 282 9 291 87 0 87 704 10 714
SCS Computer Science 35 0 35 239 6 245 55 3 58 553 12 565
Tepper Business Adm 16 0 16 125 3 128 43 2 45 450 8 458
Qatar Business Adm 0 0 0 0 0 0 12 1 13 108 1 109Qatar Computer Science 0 0 0 0 0 0 0 0 0 56 2 58TOTAL 0 0 0 0 0 0 12 1 13 164 3 167
260 5 265 2,219 66 2,285 677 17 694 5,645 113 5,758
Continued from page 2.38
Hispanic White Unknown/Other Total
GRAND TOTAL
Inter-disciplinary
MCS
CFA
CIT
H&SS
Branch Campuses
2.39
College Department FT PT T FT PT T FT PT T FT PT T
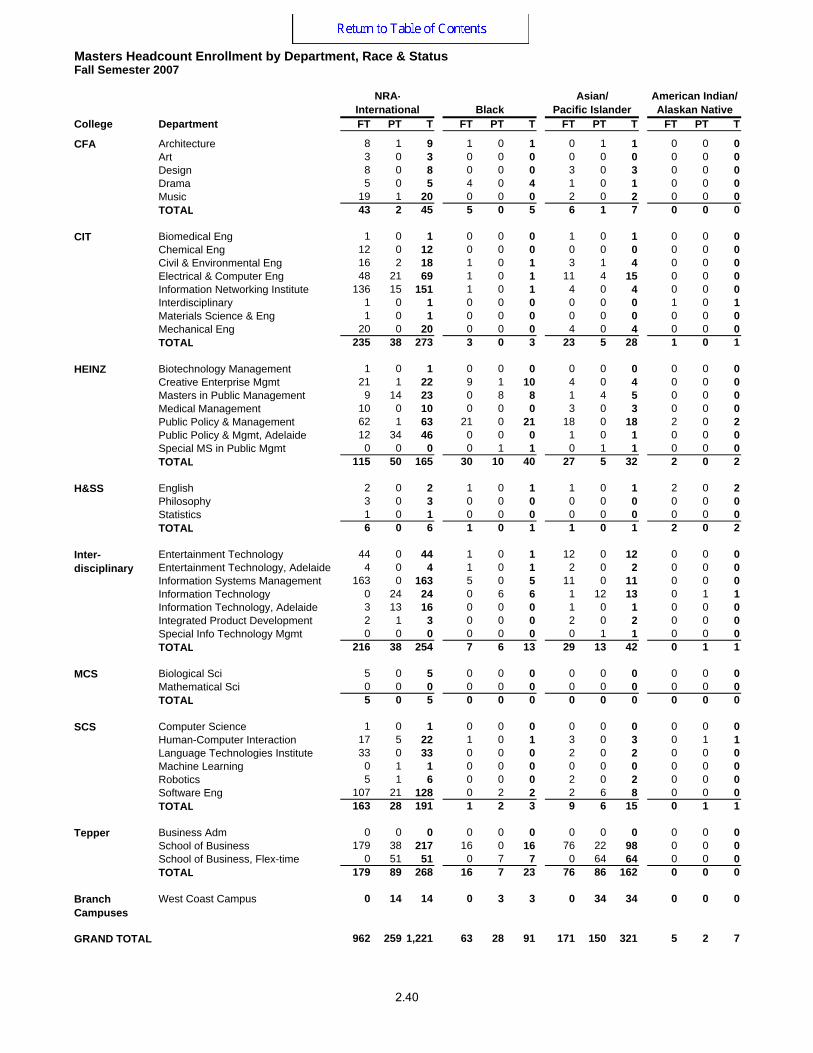
Architecture 8 1 9 1 0 1 0 1 1 0 0 0Art 3 0 3 0 0 0 0 0 0 0 0 0Design 8 0 8 0 0 0 3 0 3 0 0 0Drama 5 0 5 4 0 4 1 0 1 0 0 0Music 19 1 20 0 0 0 2 0 2 0 0 0TOTAL 43 2 45 5 0 5 6 1 7 0 0 0
Biomedical Eng 1 0 1 0 0 0 1 0 1 0 0 0Chemical Eng 12 0 12 0 0 0 0 0 0 0 0 0Civil & Environmental Eng 16 2 18 1 0 1 3 1 4 0 0 0Electrical & Computer Eng 48 21 69 1 0 1 11 4 15 0 0 0Information Networking Institute 136 15 151 1 0 1 4 0 4 0 0 0Interdisciplinary 1 0 1 0 0 0 0 0 0 1 0 1Materials Science & Eng 1 0 1 0 0 0 0 0 0 0 0 0Mechanical Eng 20 0 20 0 0 0 4 0 4 0 0 0TOTAL 235 38 273 3 0 3 23 5 28 1 0 1
Biotechnology Management 1 0 1 0 0 0 0 0 0 0 0 0Creative Enterprise Mgmt 21 1 22 9 1 10 4 0 4 0 0 0Masters in Public Management 9 14 23 0 8 8 1 4 5 0 0 0Medical Management 10 0 10 0 0 0 3 0 3 0 0 0Public Policy & Management 62 1 63 21 0 21 18 0 18 2 0 2Public Policy & Mgmt, Adelaide 12 34 46 0 0 0 1 0 1 0 0 0Special MS in Public Mgmt 0 0 0 0 1 1 0 1 1 0 0 0TOTAL 115 50 165 30 10 40 27 5 32 2 0 2
English 2 0 2 1 0 1 1 0 1 2 0 2Philosophy 3 0 3 0 0 0 0 0 0 0 0 0Statistics 1 0 1 0 0 0 0 0 0 0 0 0TOTAL 6 0 6 1 0 1 1 0 1 2 0 2
Entertainment Technology 44 0 44 1 0 1 12 0 12 0 0 0Entertainment Technology, Adelaide 4 0 4 1 0 1 2 0 2 0 0 0Information Systems Management 163 0 163 5 0 5 11 0 11 0 0 0Information Technology 0 24 24 0 6 6 1 12 13 0 1 1Information Technology, Adelaide 3 13 16 0 0 0 1 0 1 0 0 0Integrated Product Development 2 1 3 0 0 0 2 0 2 0 0 0Special Info Technology Mgmt 0 0 0 0 0 0 0 1 1 0 0 0TOTAL 216 38 254 7 6 13 29 13 42 0 1 1
Biological Sci 5 0 5 0 0 0 0 0 0 0 0 0Mathematical Sci 0 0 0 0 0 0 0 0 0 0 0 0TOTAL 5 0 5 0 0 0 0 0 0 0 0 0
Computer Science 1 0 1 0 0 0 0 0 0 0 0 0Human-Computer Interaction 17 5 22 1 0 1 3 0 3 0 1 1Language Technologies Institute 33 0 33 0 0 0 2 0 2 0 0 0Machine Learning 0 1 1 0 0 0 0 0 0 0 0 0Robotics 5 1 6 0 0 0 2 0 2 0 0 0Software Eng 107 21 128 0 2 2 2 6 8 0 0 0TOTAL 163 28 191 1 2 3 9 6 15 0 1 1
Business Adm 0 0 0 0 0 0 0 0 0 0 0 0School of Business 179 38 217 16 0 16 76 22 98 0 0 0School of Business, Flex-time 0 51 51 0 7 7 0 64 64 0 0 0TOTAL 179 89 268 16 7 23 76 86 162 0 0 0
West Coast Campus 0 14 14 0 3 3 0 34 34 0 0 0
962 259 1,221 63 28 91 171 150 321 5 2 7
Tepper
Branch Campuses
GRAND TOTAL
H&SS
Inter-disciplinary
MCS
SCS
CFA
CIT
HEINZ
Masters Headcount Enrollment by Department, Race & StatusFall Semester 2007
NRA-International Black
Asian/ Pacific Islander
American Indian/ Alaskan Native
2.40
College Department FT PT T FT PT T FT PT T FT PT T
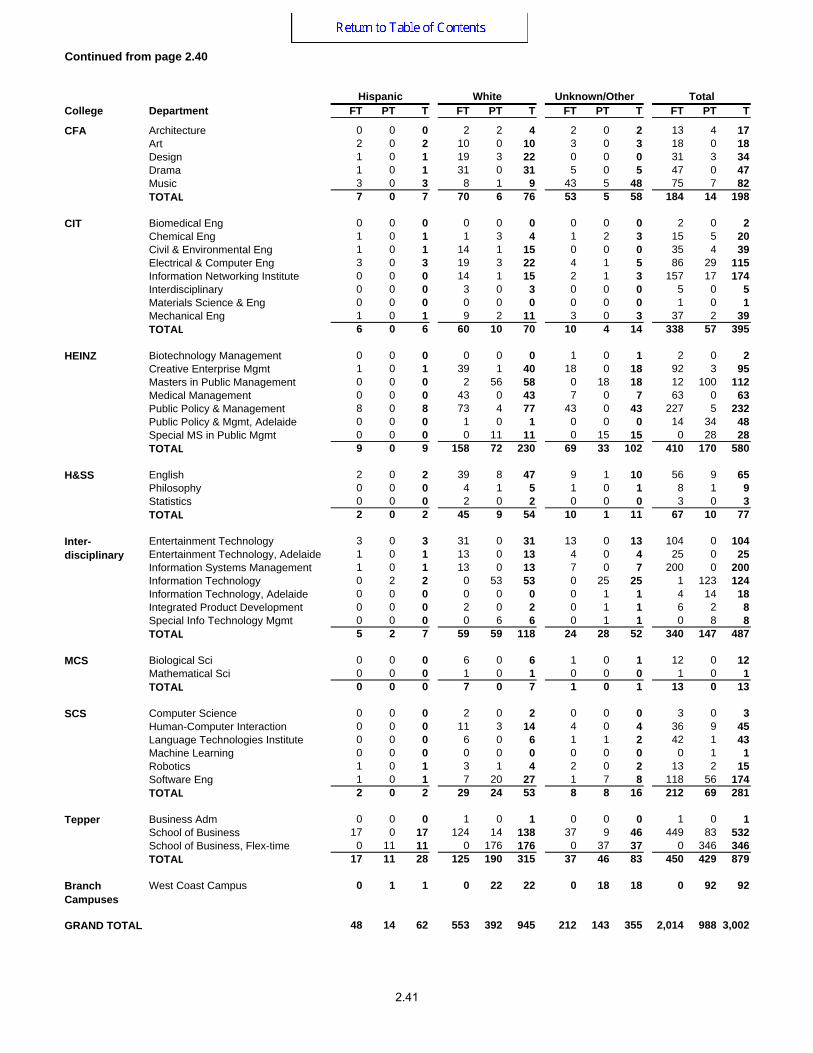
Architecture 0 0 0 2 2 4 2 0 2 13 4 17Art 2 0 2 10 0 10 3 0 3 18 0 18Design 1 0 1 19 3 22 0 0 0 31 3 34Drama 1 0 1 31 0 31 5 0 5 47 0 47Music 3 0 3 8 1 9 43 5 48 75 7 82TOTAL 7 0 7 70 6 76 53 5 58 184 14 198
Biomedical Eng 0 0 0 0 0 0 0 0 0 2 0 2Chemical Eng 1 0 1 1 3 4 1 2 3 15 5 20Civil & Environmental Eng 1 0 1 14 1 15 0 0 0 35 4 39Electrical & Computer Eng 3 0 3 19 3 22 4 1 5 86 29 115Information Networking Institute 0 0 0 14 1 15 2 1 3 157 17 174Interdisciplinary 0 0 0 3 0 3 0 0 0 5 0 5Materials Science & Eng 0 0 0 0 0 0 0 0 0 1 0 1Mechanical Eng 1 0 1 9 2 11 3 0 3 37 2 39TOTAL 6 0 6 60 10 70 10 4 14 338 57 395
Biotechnology Management 0 0 0 0 0 0 1 0 1 2 0 2Creative Enterprise Mgmt 1 0 1 39 1 40 18 0 18 92 3 95Masters in Public Management 0 0 0 2 56 58 0 18 18 12 100 112Medical Management 0 0 0 43 0 43 7 0 7 63 0 63Public Policy & Management 8 0 8 73 4 77 43 0 43 227 5 232Public Policy & Mgmt, Adelaide 0 0 0 1 0 1 0 0 0 14 34 48Special MS in Public Mgmt 0 0 0 0 11 11 0 15 15 0 28 28TOTAL 9 0 9 158 72 230 69 33 102 410 170 580
English 2 0 2 39 8 47 9 1 10 56 9 65Philosophy 0 0 0 4 1 5 1 0 1 8 1 9Statistics 0 0 0 2 0 2 0 0 0 3 0 3TOTAL 2 0 2 45 9 54 10 1 11 67 10 77
Entertainment Technology 3 0 3 31 0 31 13 0 13 104 0 104Entertainment Technology, Adelaide 1 0 1 13 0 13 4 0 4 25 0 25Information Systems Management 1 0 1 13 0 13 7 0 7 200 0 200Information Technology 0 2 2 0 53 53 0 25 25 1 123 124Information Technology, Adelaide 0 0 0 0 0 0 0 1 1 4 14 18Integrated Product Development 0 0 0 2 0 2 0 1 1 6 2 8Special Info Technology Mgmt 0 0 0 0 6 6 0 1 1 0 8 8TOTAL 5 2 7 59 59 118 24 28 52 340 147 487
Biological Sci 0 0 0 6 0 6 1 0 1 12 0 12Mathematical Sci 0 0 0 1 0 1 0 0 0 1 0 1TOTAL 0 0 0 7 0 7 1 0 1 13 0 13
Computer Science 0 0 0 2 0 2 0 0 0 3 0 3Human-Computer Interaction 0 0 0 11 3 14 4 0 4 36 9 45Language Technologies Institute 0 0 0 6 0 6 1 1 2 42 1 43Machine Learning 0 0 0 0 0 0 0 0 0 0 1 1Robotics 1 0 1 3 1 4 2 0 2 13 2 15Software Eng 1 0 1 7 20 27 1 7 8 118 56 174TOTAL 2 0 2 29 24 53 8 8 16 212 69 281
Business Adm 0 0 0 1 0 1 0 0 0 1 0 1School of Business 17 0 17 124 14 138 37 9 46 449 83 532School of Business, Flex-time 0 11 11 0 176 176 0 37 37 0 346 346TOTAL 17 11 28 125 190 315 37 46 83 450 429 879
West Coast Campus 0 1 1 0 22 22 0 18 18 0 92 92
48 14 62 553 392 945 212 143 355 2,014 988 3,002
Continued from page 2.40
Hispanic White Unknown/Other Total
CFA
CIT
HEINZ
Tepper
Branch Campuses
GRAND TOTAL
H&SS
Inter-disciplinary
MCS
SCS
2.41
FT PT T FT PT T FT PT T FT PT T
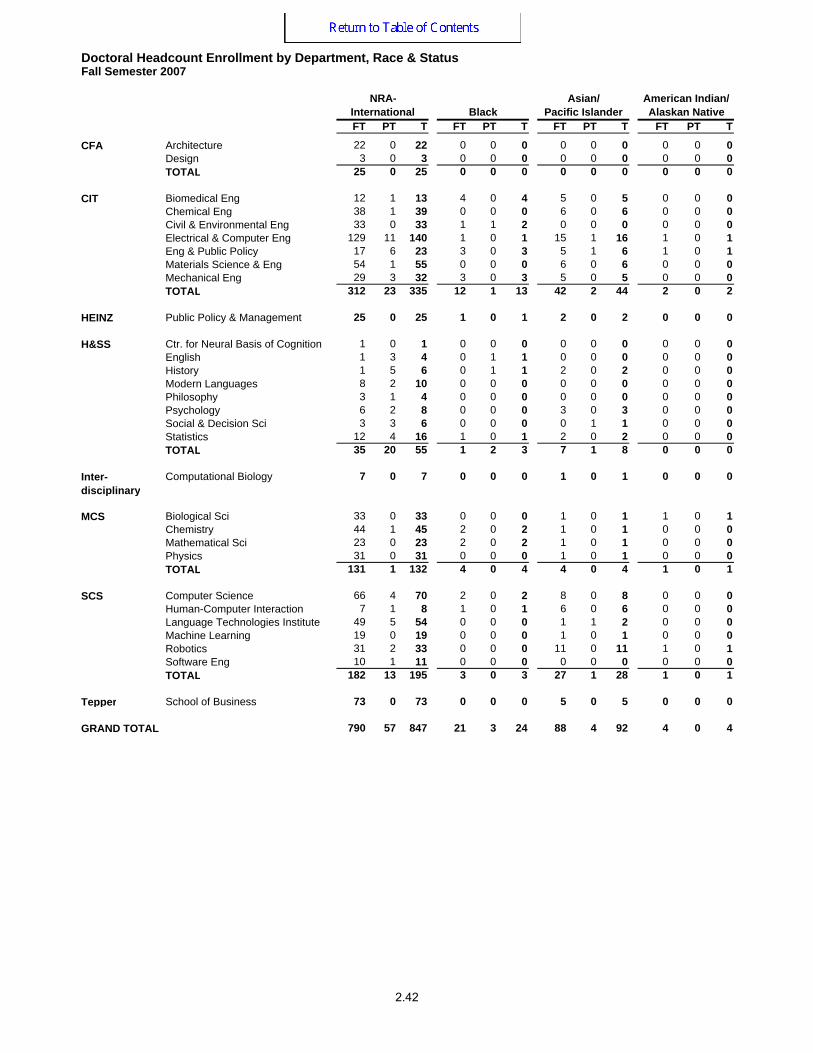
Architecture 22 0 22 0 0 0 0 0 0 0 0 0Design 3 0 3 0 0 0 0 0 0 0 0 0TOTAL 25 0 25 0 0 0 0 0 0 0 0 0
Biomedical Eng 12 1 13 4 0 4 5 0 5 0 0 0Chemical Eng 38 1 39 0 0 0 6 0 6 0 0 0Civil & Environmental Eng 33 0 33 1 1 2 0 0 0 0 0 0Electrical & Computer Eng 129 11 140 1 0 1 15 1 16 1 0 1Eng & Public Policy 17 6 23 3 0 3 5 1 6 1 0 1Materials Science & Eng 54 1 55 0 0 0 6 0 6 0 0 0Mechanical Eng 29 3 32 3 0 3 5 0 5 0 0 0TOTAL 312 23 335 12 1 13 42 2 44 2 0 2
HEINZ Public Policy & Management 25 0 25 1 0 1 2 0 2 0 0 0
Ctr. for Neural Basis of Cognition 1 0 1 0 0 0 0 0 0 0 0 0English 1 3 4 0 1 1 0 0 0 0 0 0History 1 5 6 0 1 1 2 0 2 0 0 0Modern Languages 8 2 10 0 0 0 0 0 0 0 0 0Philosophy 3 1 4 0 0 0 0 0 0 0 0 0Psychology 6 2 8 0 0 0 3 0 3 0 0 0Social & Decision Sci 3 3 6 0 0 0 0 1 1 0 0 0Statistics 12 4 16 1 0 1 2 0 2 0 0 0TOTAL 35 20 55 1 2 3 7 1 8 0 0 0
Computational Biology 7 0 7 0 0 0 1 0 1 0 0 0
Biological Sci 33 0 33 0 0 0 1 0 1 1 0 1Chemistry 44 1 45 2 0 2 1 0 1 0 0 0Mathematical Sci 23 0 23 2 0 2 1 0 1 0 0 0Physics 31 0 31 0 0 0 1 0 1 0 0 0TOTAL 131 1 132 4 0 4 4 0 4 1 0 1
Computer Science 66 4 70 2 0 2 8 0 8 0 0 0Human-Computer Interaction 7 1 8 1 0 1 6 0 6 0 0 0Language Technologies Institute 49 5 54 0 0 0 1 1 2 0 0 0Machine Learning 19 0 19 0 0 0 1 0 1 0 0 0Robotics 31 2 33 0 0 0 11 0 11 1 0 1Software Eng 10 1 11 0 0 0 0 0 0 0 0 0TOTAL 182 13 195 3 0 3 27 1 28 1 0 1
Tepper School of Business 73 0 73 0 0 0 5 0 5 0 0 0
790 57 847 21 3 24 88 4 92 4 0 4GRAND TOTAL
H&SS
Inter-disciplinary
MCS
SCS
CFA
CIT
Doctoral Headcount Enrollment by Department, Race & StatusFall Semester 2007
NRA-International Black
Asian/ Pacific Islander
American Indian/ Alaskan Native
2.42
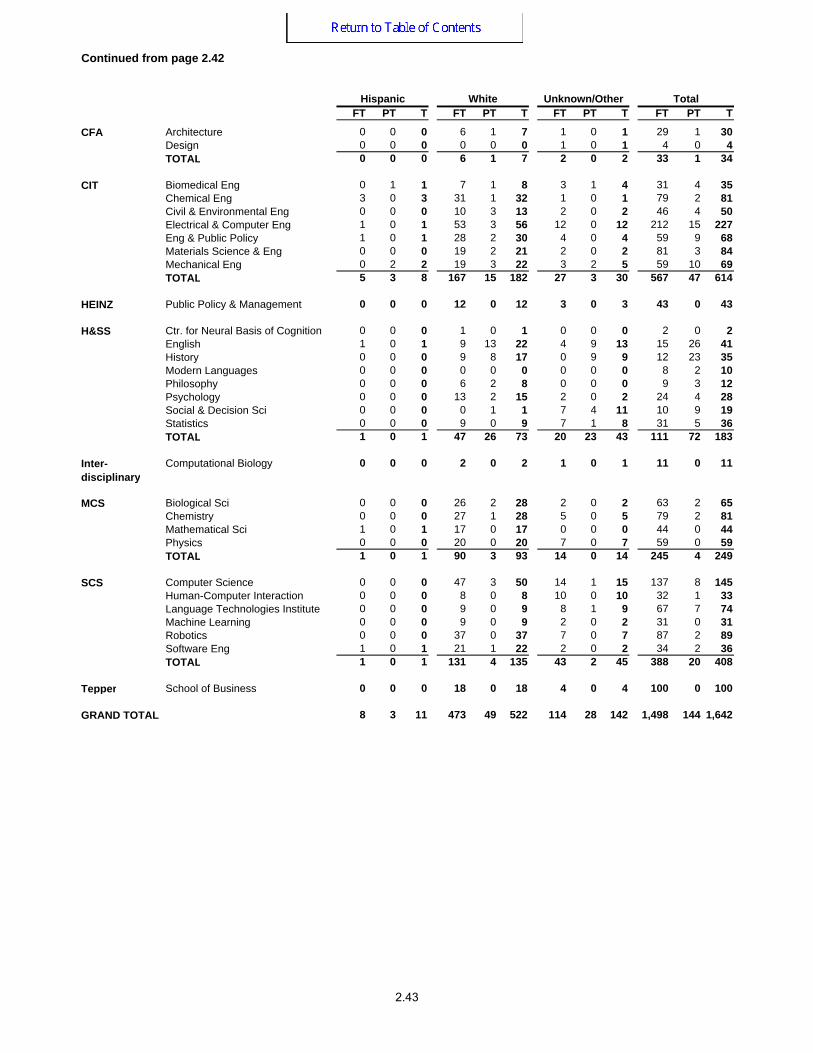
FT PT T FT PT T FT PT T FT PT T
Architecture 0 0 0 6 1 7 1 0 1 29 1 30Design 0 0 0 0 0 0 1 0 1 4 0 4TOTAL 0 0 0 6 1 7 2 0 2 33 1 34
Biomedical Eng 0 1 1 7 1 8 3 1 4 31 4 35Chemical Eng 3 0 3 31 1 32 1 0 1 79 2 81Civil & Environmental Eng 0 0 0 10 3 13 2 0 2 46 4 50Electrical & Computer Eng 1 0 1 53 3 56 12 0 12 212 15 227Eng & Public Policy 1 0 1 28 2 30 4 0 4 59 9 68Materials Science & Eng 0 0 0 19 2 21 2 0 2 81 3 84Mechanical Eng 0 2 2 19 3 22 3 2 5 59 10 69TOTAL 5 3 8 167 15 182 27 3 30 567 47 614
HEINZ Public Policy & Management 0 0 0 12 0 12 3 0 3 43 0 43
Ctr. for Neural Basis of Cognition 0 0 0 1 0 1 0 0 0 2 0 2English 1 0 1 9 13 22 4 9 13 15 26 41History 0 0 0 9 8 17 0 9 9 12 23 35Modern Languages 0 0 0 0 0 0 0 0 0 8 2 10Philosophy 0 0 0 6 2 8 0 0 0 9 3 12Psychology 0 0 0 13 2 15 2 0 2 24 4 28Social & Decision Sci 0 0 0 0 1 1 7 4 11 10 9 19Statistics 0 0 0 9 0 9 7 1 8 31 5 36TOTAL 1 0 1 47 26 73 20 23 43 111 72 183
Computational Biology 0 0 0 2 0 2 1 0 1 11 0 11
Biological Sci 0 0 0 26 2 28 2 0 2 63 2 65Chemistry 0 0 0 27 1 28 5 0 5 79 2 81Mathematical Sci 1 0 1 17 0 17 0 0 0 44 0 44Physics 0 0 0 20 0 20 7 0 7 59 0 59TOTAL 1 0 1 90 3 93 14 0 14 245 4 249
Computer Science 0 0 0 47 3 50 14 1 15 137 8 145Human-Computer Interaction 0 0 0 8 0 8 10 0 10 32 1 33Language Technologies Institute 0 0 0 9 0 9 8 1 9 67 7 74Machine Learning 0 0 0 9 0 9 2 0 2 31 0 31Robotics 0 0 0 37 0 37 7 0 7 87 2 89Software Eng 1 0 1 21 1 22 2 0 2 34 2 36TOTAL 1 0 1 131 4 135 43 2 45 388 20 408
Tepper School of Business 0 0 0 18 0 18 4 0 4 100 0 100
8 3 11 473 49 522 114 28 142 1,498 144 1,642GRAND TOTAL
H&SS
Inter-disciplinary
MCS
SCS
CFA
CIT
Continued from page 2.42
Hispanic White Unknown/Other Total
2.43
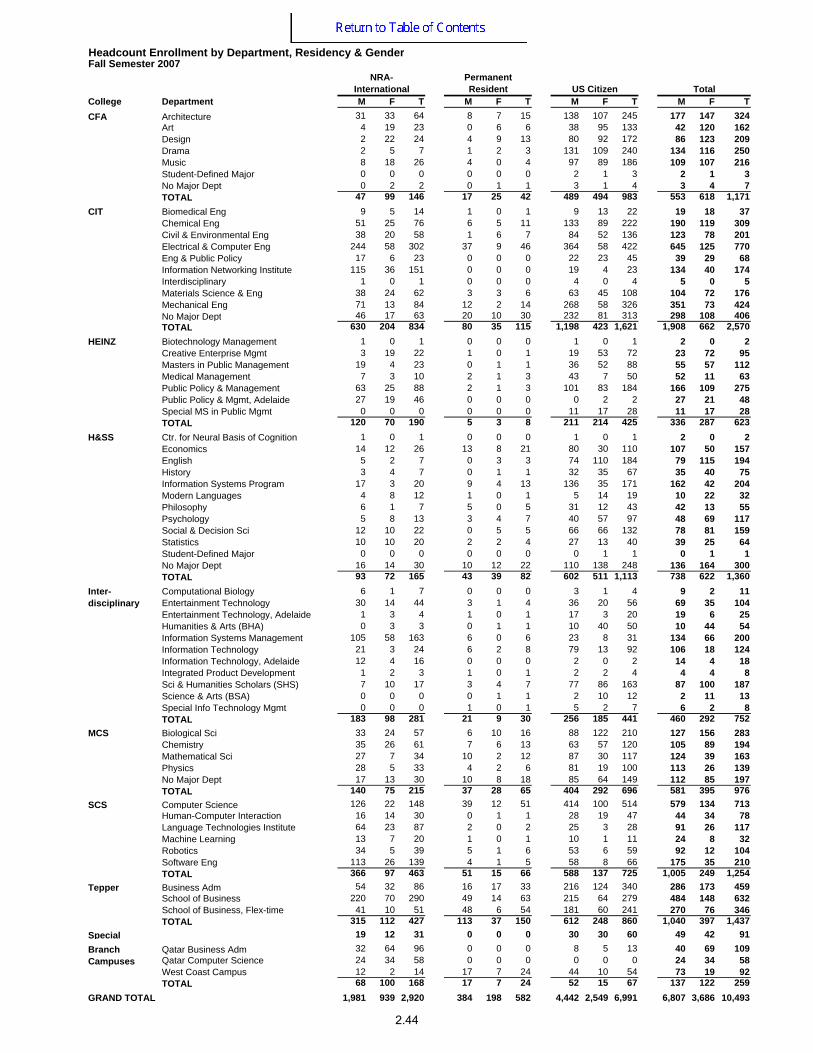
College Department M F T M F T M F T M F TArchitecture 31 33 64 8 7 15 138 107 245 177 147 324Art 4 19 23 0 6 6 38 95 133 42 120 162Design 2 22 24 4 9 13 80 92 172 86 123 209Drama 2 5 7 1 2 3 131 109 240 134 116 250Music 8 18 26 4 0 4 97 89 186 109 107 216Student-Defined Major 0 0 0 0 0 0 2 1 3 2 1 3No Major Dept 0 2 2 0 1 1 3 1 4 3 4 7TOTAL 47 99 146 17 25 42 489 494 983 553 618 1,171Biomedical Eng 9 5 14 1 0 1 9 13 22 19 18 37Chemical Eng 51 25 76 6 5 11 133 89 222 190 119 309Civil & Environmental Eng 38 20 58 1 6 7 84 52 136 123 78 201Electrical & Computer Eng 244 58 302 37 9 46 364 58 422 645 125 770Eng & Public Policy 17 6 23 0 0 0 22 23 45 39 29 68Information Networking Institute 115 36 151 0 0 0 19 4 23 134 40 174Interdisciplinary 1 0 1 0 0 0 4 0 4 5 0 5Materials Science & Eng 38 24 62 3 3 6 63 45 108 104 72 176Mechanical Eng 71 13 84 12 2 14 268 58 326 351 73 424No Major Dept 46 17 63 20 10 30 232 81 313 298 108 406TOTAL 630 204 834 80 35 115 1,198 423 1,621 1,908 662 2,570Biotechnology Management 1 0 1 0 0 0 1 0 1 2 0 2Creative Enterprise Mgmt 3 19 22 1 0 1 19 53 72 23 72 95Masters in Public Management 19 4 23 0 1 1 36 52 88 55 57 112Medical Management 7 3 10 2 1 3 43 7 50 52 11 63Public Policy & Management 63 25 88 2 1 3 101 83 184 166 109 275Public Policy & Mgmt, Adelaide 27 19 46 0 0 0 0 2 2 27 21 48Special MS in Public Mgmt 0 0 0 0 0 0 11 17 28 11 17 28TOTAL 120 70 190 5 3 8 211 214 425 336 287 623Ctr. for Neural Basis of Cognition 1 0 1 0 0 0 1 0 1 2 0 2Economics 14 12 26 13 8 21 80 30 110 107 50 157English 5 2 7 0 3 3 74 110 184 79 115 194History 3 4 7 0 1 1 32 35 67 35 40 75Information Systems Program 17 3 20 9 4 13 136 35 171 162 42 204Modern Languages 4 8 12 1 0 1 5 14 19 10 22 32Philosophy 6 1 7 5 0 5 31 12 43 42 13 55Psychology 5 8 13 3 4 7 40 57 97 48 69 117Social & Decision Sci 12 10 22 0 5 5 66 66 132 78 81 159Statistics 10 10 20 2 2 4 27 13 40 39 25 64Student-Defined Major 0 0 0 0 0 0 0 1 1 0 1 1No Major Dept 16 14 30 10 12 22 110 138 248 136 164 300TOTAL 93 72 165 43 39 82 602 511 1,113 738 622 1,360Computational Biology 6 1 7 0 0 0 3 1 4 9 2 11Entertainment Technology 30 14 44 3 1 4 36 20 56 69 35 104Entertainment Technology, Adelaide 1 3 4 1 0 1 17 3 20 19 6 25Humanities & Arts (BHA) 0 3 3 0 1 1 10 40 50 10 44 54Information Systems Management 105 58 163 6 0 6 23 8 31 134 66 200Information Technology 21 3 24 6 2 8 79 13 92 106 18 124Information Technology, Adelaide 12 4 16 0 0 0 2 0 2 14 4 18Integrated Product Development 1 2 3 1 0 1 2 2 4 4 4 8Sci & Humanities Scholars (SHS) 7 10 17 3 4 7 77 86 163 87 100 187Science & Arts (BSA) 0 0 0 0 1 1 2 10 12 2 11 13Special Info Technology Mgmt 0 0 0 1 0 1 5 2 7 6 2 8TOTAL 183 98 281 21 9 30 256 185 441 460 292 752Biological Sci 33 24 57 6 10 16 88 122 210 127 156 283Chemistry 35 26 61 7 6 13 63 57 120 105 89 194Mathematical Sci 27 7 34 10 2 12 87 30 117 124 39 163Physics 28 5 33 4 2 6 81 19 100 113 26 139No Major Dept 17 13 30 10 8 18 85 64 149 112 85 197TOTAL 140 75 215 37 28 65 404 292 696 581 395 976Computer Science 126 22 148 39 12 51 414 100 514 579 134 713Human-Computer Interaction 16 14 30 0 1 1 28 19 47 44 34 78Language Technologies Institute 64 23 87 2 0 2 25 3 28 91 26 117Machine Learning 13 7 20 1 0 1 10 1 11 24 8 32Robotics 34 5 39 5 1 6 53 6 59 92 12 104Software Eng 113 26 139 4 1 5 58 8 66 175 35 210TOTAL 366 97 463 51 15 66 588 137 725 1,005 249 1,254Business Adm 54 32 86 16 17 33 216 124 340 286 173 459School of Business 220 70 290 49 14 63 215 64 279 484 148 632School of Business, Flex-time 41 10 51 48 6 54 181 60 241 270 76 346TOTAL 315 112 427 113 37 150 612 248 860 1,040 397 1,437
Special 19 12 31 0 0 0 30 30 60 49 42 91Qatar Business Adm 32 64 96 0 0 0 8 5 13 40 69 109Qatar Computer Science 24 34 58 0 0 0 0 0 0 24 34 58West Coast Campus 12 2 14 17 7 24 44 10 54 73 19 92TOTAL 68 100 168 17 7 24 52 15 67 137 122 259
1,981 939 2,920 384 198 582 4,442 2,549 6,991 6,807 3,686 10,493
Branch Campuses
GRAND TOTAL
Inter-disciplinary
MCS
SCS
Tepper
CFA
CIT
HEINZ
H&SS
Headcount Enrollment by Department, Residency & GenderFall Semester 2007
NRA-International
Permanent Resident US Citizen Total
2.44
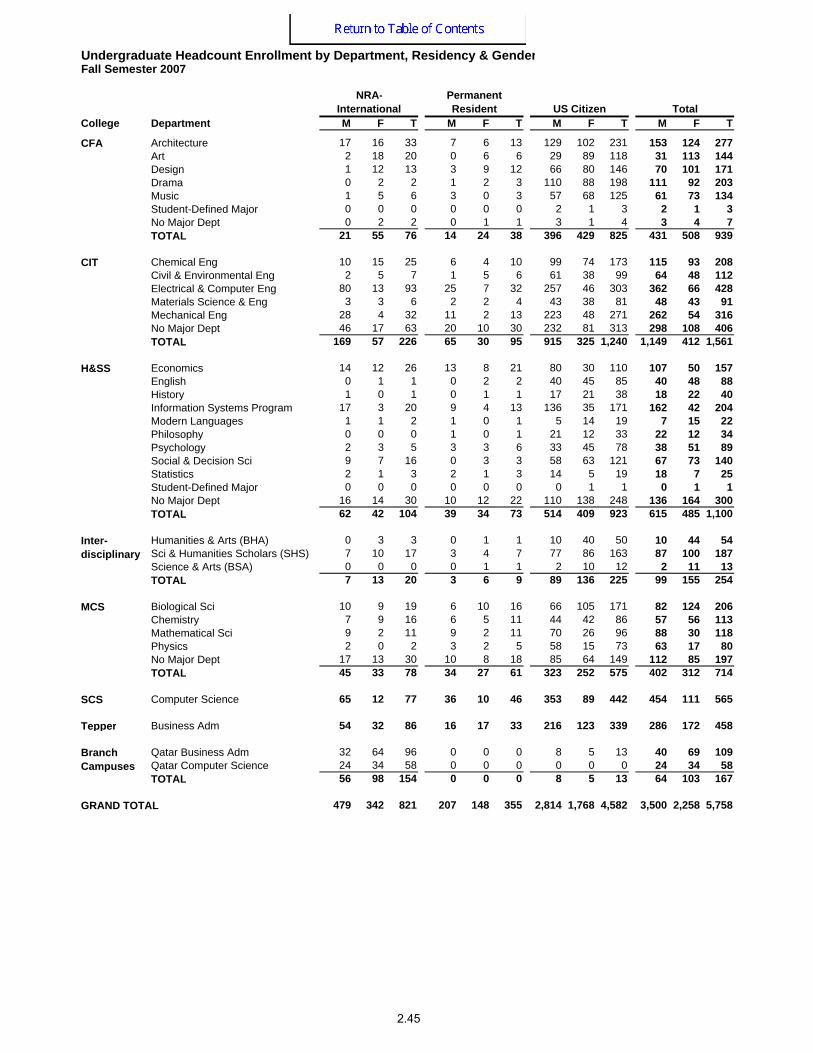
College Department M F T M F T M F T M F T
Architecture 17 16 33 7 6 13 129 102 231 153 124 277Art 2 18 20 0 6 6 29 89 118 31 113 144Design 1 12 13 3 9 12 66 80 146 70 101 171Drama 0 2 2 1 2 3 110 88 198 111 92 203Music 1 5 6 3 0 3 57 68 125 61 73 134Student-Defined Major 0 0 0 0 0 0 2 1 3 2 1 3No Major Dept 0 2 2 0 1 1 3 1 4 3 4 7TOTAL 21 55 76 14 24 38 396 429 825 431 508 939
Chemical Eng 10 15 25 6 4 10 99 74 173 115 93 208Civil & Environmental Eng 2 5 7 1 5 6 61 38 99 64 48 112Electrical & Computer Eng 80 13 93 25 7 32 257 46 303 362 66 428Materials Science & Eng 3 3 6 2 2 4 43 38 81 48 43 91Mechanical Eng 28 4 32 11 2 13 223 48 271 262 54 316No Major Dept 46 17 63 20 10 30 232 81 313 298 108 406TOTAL 169 57 226 65 30 95 915 325 1,240 1,149 412 1,561
Economics 14 12 26 13 8 21 80 30 110 107 50 157English 0 1 1 0 2 2 40 45 85 40 48 88History 1 0 1 0 1 1 17 21 38 18 22 40Information Systems Program 17 3 20 9 4 13 136 35 171 162 42 204Modern Languages 1 1 2 1 0 1 5 14 19 7 15 22Philosophy 0 0 0 1 0 1 21 12 33 22 12 34Psychology 2 3 5 3 3 6 33 45 78 38 51 89Social & Decision Sci 9 7 16 0 3 3 58 63 121 67 73 140Statistics 2 1 3 2 1 3 14 5 19 18 7 25Student-Defined Major 0 0 0 0 0 0 0 1 1 0 1 1No Major Dept 16 14 30 10 12 22 110 138 248 136 164 300TOTAL 62 42 104 39 34 73 514 409 923 615 485 1,100
Humanities & Arts (BHA) 0 3 3 0 1 1 10 40 50 10 44 54Sci & Humanities Scholars (SHS) 7 10 17 3 4 7 77 86 163 87 100 187Science & Arts (BSA) 0 0 0 0 1 1 2 10 12 2 11 13TOTAL 7 13 20 3 6 9 89 136 225 99 155 254
Biological Sci 10 9 19 6 10 16 66 105 171 82 124 206Chemistry 7 9 16 6 5 11 44 42 86 57 56 113Mathematical Sci 9 2 11 9 2 11 70 26 96 88 30 118Physics 2 0 2 3 2 5 58 15 73 63 17 80No Major Dept 17 13 30 10 8 18 85 64 149 112 85 197TOTAL 45 33 78 34 27 61 323 252 575 402 312 714
SCS Computer Science 65 12 77 36 10 46 353 89 442 454 111 565
Tepper Business Adm 54 32 86 16 17 33 216 123 339 286 172 458
Qatar Business Adm 32 64 96 0 0 0 8 5 13 40 69 109Qatar Computer Science 24 34 58 0 0 0 0 0 0 24 34 58TOTAL 56 98 154 0 0 0 8 5 13 64 103 167
479 342 821 207 148 355 2,814 1,768 4,582 3,500 2,258 5,758GRAND TOTAL
MCS
Branch Campuses
CFA
CIT
H&SS
Inter-disciplinary
Undergraduate Headcount Enrollment by Department, Residency & GenderFall Semester 2007
NRA-International
Permanent Resident US Citizen Total
2.45
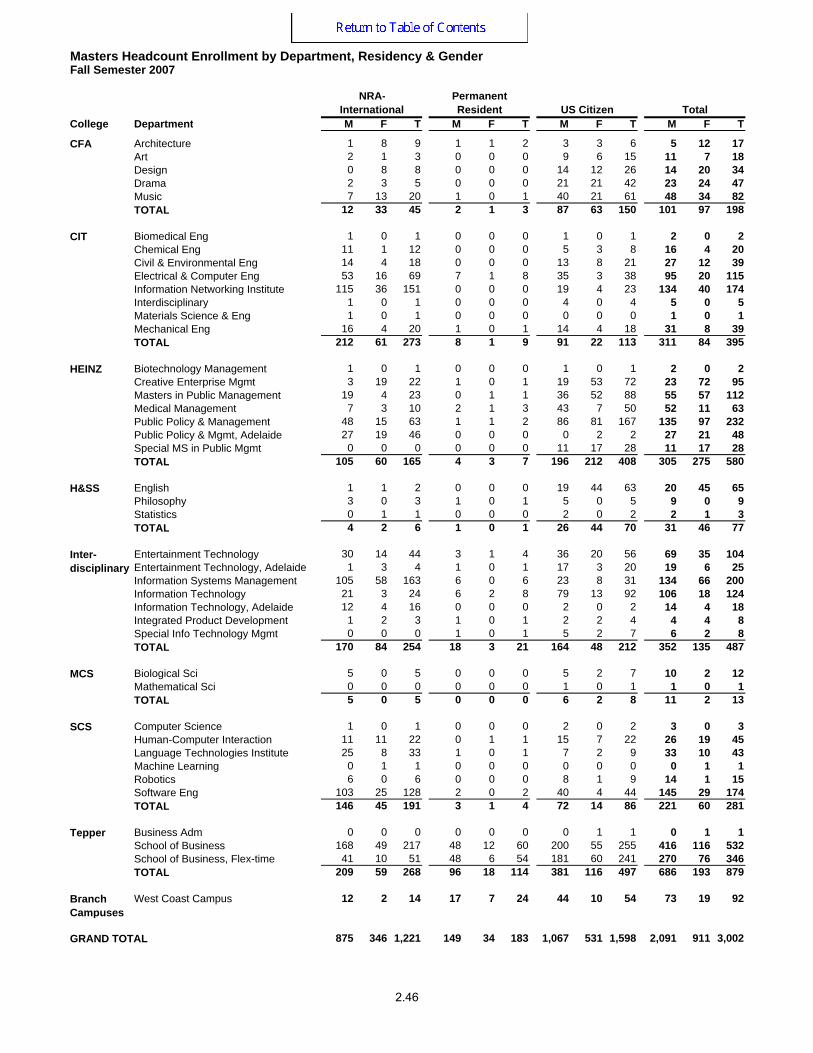
College Department M F T M F T M F T M F T
Architecture 1 8 9 1 1 2 3 3 6 5 12 17Art 2 1 3 0 0 0 9 6 15 11 7 18Design 0 8 8 0 0 0 14 12 26 14 20 34Drama 2 3 5 0 0 0 21 21 42 23 24 47Music 7 13 20 1 0 1 40 21 61 48 34 82TOTAL 12 33 45 2 1 3 87 63 150 101 97 198
Biomedical Eng 1 0 1 0 0 0 1 0 1 2 0 2Chemical Eng 11 1 12 0 0 0 5 3 8 16 4 20Civil & Environmental Eng 14 4 18 0 0 0 13 8 21 27 12 39Electrical & Computer Eng 53 16 69 7 1 8 35 3 38 95 20 115Information Networking Institute 115 36 151 0 0 0 19 4 23 134 40 174Interdisciplinary 1 0 1 0 0 0 4 0 4 5 0 5Materials Science & Eng 1 0 1 0 0 0 0 0 0 1 0 1Mechanical Eng 16 4 20 1 0 1 14 4 18 31 8 39TOTAL 212 61 273 8 1 9 91 22 113 311 84 395
Biotechnology Management 1 0 1 0 0 0 1 0 1 2 0 2Creative Enterprise Mgmt 3 19 22 1 0 1 19 53 72 23 72 95Masters in Public Management 19 4 23 0 1 1 36 52 88 55 57 112Medical Management 7 3 10 2 1 3 43 7 50 52 11 63Public Policy & Management 48 15 63 1 1 2 86 81 167 135 97 232Public Policy & Mgmt, Adelaide 27 19 46 0 0 0 0 2 2 27 21 48Special MS in Public Mgmt 0 0 0 0 0 0 11 17 28 11 17 28TOTAL 105 60 165 4 3 7 196 212 408 305 275 580
English 1 1 2 0 0 0 19 44 63 20 45 65Philosophy 3 0 3 1 0 1 5 0 5 9 0 9Statistics 0 1 1 0 0 0 2 0 2 2 1 3TOTAL 4 2 6 1 0 1 26 44 70 31 46 77
Entertainment Technology 30 14 44 3 1 4 36 20 56 69 35 104Entertainment Technology, Adelaide 1 3 4 1 0 1 17 3 20 19 6 25Information Systems Management 105 58 163 6 0 6 23 8 31 134 66 200Information Technology 21 3 24 6 2 8 79 13 92 106 18 124Information Technology, Adelaide 12 4 16 0 0 0 2 0 2 14 4 18Integrated Product Development 1 2 3 1 0 1 2 2 4 4 4 8Special Info Technology Mgmt 0 0 0 1 0 1 5 2 7 6 2 8TOTAL 170 84 254 18 3 21 164 48 212 352 135 487
Biological Sci 5 0 5 0 0 0 5 2 7 10 2 12Mathematical Sci 0 0 0 0 0 0 1 0 1 1 0 1TOTAL 5 0 5 0 0 0 6 2 8 11 2 13
Computer Science 1 0 1 0 0 0 2 0 2 3 0 3Human-Computer Interaction 11 11 22 0 1 1 15 7 22 26 19 45Language Technologies Institute 25 8 33 1 0 1 7 2 9 33 10 43Machine Learning 0 1 1 0 0 0 0 0 0 0 1 1Robotics 6 0 6 0 0 0 8 1 9 14 1 15Software Eng 103 25 128 2 0 2 40 4 44 145 29 174TOTAL 146 45 191 3 1 4 72 14 86 221 60 281
Business Adm 0 0 0 0 0 0 0 1 1 0 1 1School of Business 168 49 217 48 12 60 200 55 255 416 116 532School of Business, Flex-time 41 10 51 48 6 54 181 60 241 270 76 346TOTAL 209 59 268 96 18 114 381 116 497 686 193 879
West Coast Campus 12 2 14 17 7 24 44 10 54 73 19 92
875 346 1,221 149 34 183 1,067 531 1,598 2,091 911 3,002
Branch Campuses
GRAND TOTAL
Inter-disciplinary
MCS
SCS
Tepper
CFA
CIT
HEINZ
H&SS
Masters Headcount Enrollment by Department, Residency & GenderFall Semester 2007
NRA-International
Permanent Resident US Citizen Total
2.46
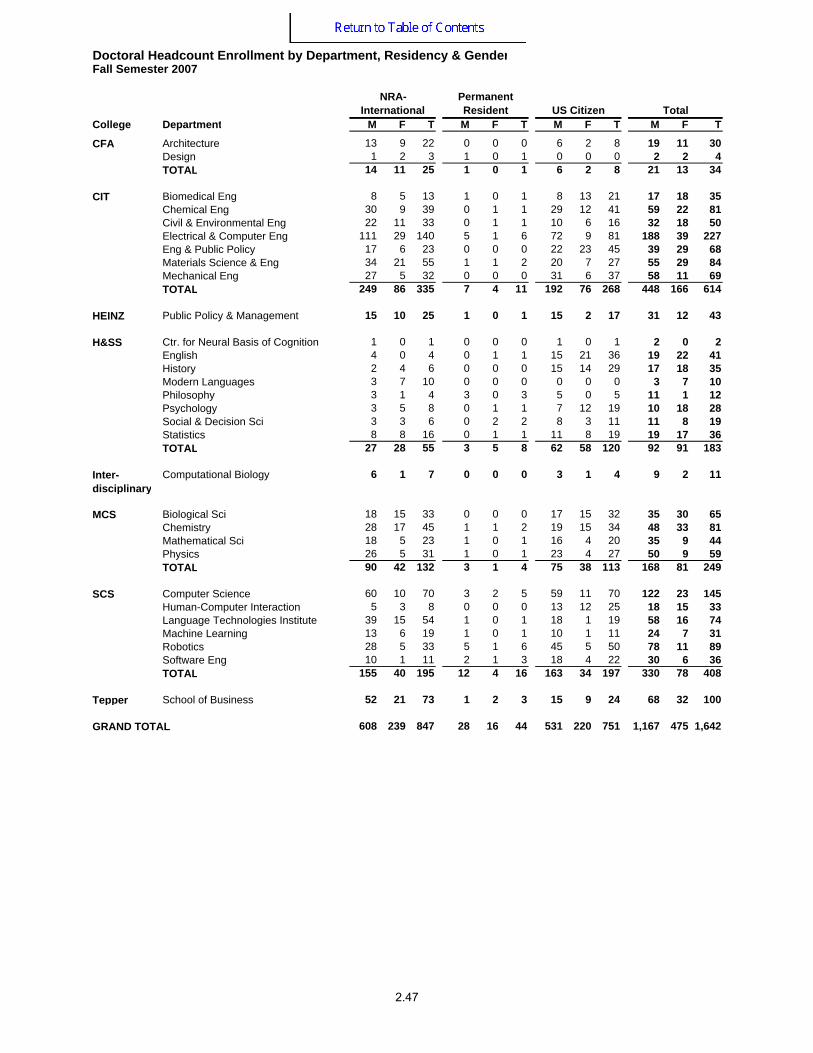
College Department M F T M F T M F T M F T
Architecture 13 9 22 0 0 0 6 2 8 19 11 30Design 1 2 3 1 0 1 0 0 0 2 2 4TOTAL 14 11 25 1 0 1 6 2 8 21 13 34
Biomedical Eng 8 5 13 1 0 1 8 13 21 17 18 35Chemical Eng 30 9 39 0 1 1 29 12 41 59 22 81Civil & Environmental Eng 22 11 33 0 1 1 10 6 16 32 18 50Electrical & Computer Eng 111 29 140 5 1 6 72 9 81 188 39 227Eng & Public Policy 17 6 23 0 0 0 22 23 45 39 29 68Materials Science & Eng 34 21 55 1 1 2 20 7 27 55 29 84Mechanical Eng 27 5 32 0 0 0 31 6 37 58 11 69TOTAL 249 86 335 7 4 11 192 76 268 448 166 614
HEINZ Public Policy & Management 15 10 25 1 0 1 15 2 17 31 12 43
Ctr. for Neural Basis of Cognition 1 0 1 0 0 0 1 0 1 2 0 2English 4 0 4 0 1 1 15 21 36 19 22 41History 2 4 6 0 0 0 15 14 29 17 18 35Modern Languages 3 7 10 0 0 0 0 0 0 3 7 10Philosophy 3 1 4 3 0 3 5 0 5 11 1 12Psychology 3 5 8 0 1 1 7 12 19 10 18 28Social & Decision Sci 3 3 6 0 2 2 8 3 11 11 8 19Statistics 8 8 16 0 1 1 11 8 19 19 17 36TOTAL 27 28 55 3 5 8 62 58 120 92 91 183
Computational Biology 6 1 7 0 0 0 3 1 4 9 2 11
Biological Sci 18 15 33 0 0 0 17 15 32 35 30 65Chemistry 28 17 45 1 1 2 19 15 34 48 33 81Mathematical Sci 18 5 23 1 0 1 16 4 20 35 9 44Physics 26 5 31 1 0 1 23 4 27 50 9 59TOTAL 90 42 132 3 1 4 75 38 113 168 81 249
Computer Science 60 10 70 3 2 5 59 11 70 122 23 145Human-Computer Interaction 5 3 8 0 0 0 13 12 25 18 15 33Language Technologies Institute 39 15 54 1 0 1 18 1 19 58 16 74Machine Learning 13 6 19 1 0 1 10 1 11 24 7 31Robotics 28 5 33 5 1 6 45 5 50 78 11 89Software Eng 10 1 11 2 1 3 18 4 22 30 6 36TOTAL 155 40 195 12 4 16 163 34 197 330 78 408
Tepper School of Business 52 21 73 1 2 3 15 9 24 68 32 100
608 239 847 28 16 44 531 220 751 1,167 475 1,642GRAND TOTAL
Inter-disciplinary
MCS
SCS
CFA
CIT
H&SS
Doctoral Headcount Enrollment by Department, Residency & GenderFall Semester 2007
NRA-International
Permanent Resident US Citizen Total
2.47

College Department M F T M F T M F TArchitecture 175 142 317 2 5 7 177 147 324Art 40 119 159 2 1 3 42 120 162Design 78 118 196 8 5 13 86 123 209Drama 133 116 249 1 0 1 134 116 250Music 103 104 207 6 3 9 109 107 216Student-Defined Major 2 1 3 0 0 0 2 1 3No Major Dept 3 4 7 0 0 0 3 4 7TOTAL 534 604 1,138 19 14 33 553 618 1,171Biomedical Eng 17 16 33 2 2 4 19 18 37Chemical Eng 183 116 299 7 3 10 190 119 309Civil & Environmental Eng 115 77 192 8 1 9 123 78 201Electrical & Computer Eng 608 115 723 37 10 47 645 125 770Eng & Public Policy 34 25 59 5 4 9 39 29 68Information Networking Institute 120 37 157 14 3 17 134 40 174Interdisciplinary 5 0 5 0 0 0 5 0 5Materials Science & Eng 102 71 173 2 1 3 104 72 176Mechanical Eng 338 68 406 13 5 18 351 73 424No Major Dept 298 108 406 0 0 0 298 108 406TOTAL 1,820 633 2,453 88 29 117 1,908 662 2,570Biotechnology Management 2 0 2 0 0 0 2 0 2Creative Enterprise Mgmt 21 71 92 2 1 3 23 72 95Masters in Public Management 9 3 12 46 54 100 55 57 112Medical Management 52 11 63 0 0 0 52 11 63Public Policy & Management 164 106 270 2 3 5 166 109 275Public Policy & Mgmt, Adelaide 7 7 14 20 14 34 27 21 48Special MS in Public Mgmt 0 0 0 11 17 28 11 17 28TOTAL 255 198 453 81 89 170 336 287 623Ctr. for Neural Basis of Cognition 2 0 2 0 0 0 2 0 2Economics 106 48 154 1 2 3 107 50 157English 61 93 154 18 22 40 79 115 194History 25 23 48 10 17 27 35 40 75Information Systems Program 157 41 198 5 1 6 162 42 204Modern Languages 7 18 25 3 4 7 10 22 32Philosophy 35 12 47 7 1 8 42 13 55Psychology 43 66 109 5 3 8 48 69 117Social & Decision Sci 70 73 143 8 8 16 78 81 159Statistics 37 22 59 2 3 5 39 25 64Student-Defined Major 0 0 0 0 1 1 0 1 1No Major Dept 136 164 300 0 0 0 136 164 300TOTAL 679 560 1,239 59 62 121 738 622 1,360Computational Biology 9 2 11 0 0 0 9 2 11Entertainment Technology 69 35 104 0 0 0 69 35 104Entertainment Technology, Adelaide 19 6 25 0 0 0 19 6 25Humanities & Arts (BHA) 10 37 47 0 7 7 10 44 54Information Systems Management 134 66 200 0 0 0 134 66 200Information Technology 1 0 1 105 18 123 106 18 124Information Technology, Adelaide 4 0 4 10 4 14 14 4 18Integrated Product Development 3 3 6 1 1 2 4 4 8Sci & Humanities Scholars (SHS) 86 99 185 1 1 2 87 100 187Science & Arts (BSA) 2 10 12 0 1 1 2 11 13Special Info Technology Mgmt 0 0 0 6 2 8 6 2 8TOTAL 337 258 595 123 34 157 460 292 752Biological Sci 125 155 280 2 1 3 127 156 283Chemistry 103 87 190 2 2 4 105 89 194Mathematical Sci 122 38 160 2 1 3 124 39 163Physics 111 26 137 2 0 2 113 26 139No Major Dept 110 85 195 2 0 2 112 85 197TOTAL 571 391 962 10 4 14 581 395 976Computer Science 560 133 693 19 1 20 579 134 713Human-Computer Interaction 36 32 68 8 2 10 44 34 78Language Technologies Institute 87 22 109 4 4 8 91 26 117Machine Learning 24 7 31 0 1 1 24 8 32Robotics 89 11 100 3 1 4 92 12 104Software Eng 124 28 152 51 7 58 175 35 210TOTAL 920 233 1,153 85 16 101 1,005 249 1,254Business Adm 282 169 451 4 4 8 286 173 459School of Business 417 132 549 67 16 83 484 148 632School of Business, Flex-time 0 0 0 270 76 346 270 76 346TOTAL 699 301 1,000 341 96 437 1,040 397 1,437
Special 0 0 0 49 42 91 49 42 91Qatar Business Adm 40 68 108 0 1 1 40 69 109Qatar Computer Science 22 34 56 2 0 2 24 34 58West Coast Campus 0 0 0 73 19 92 73 19 92TOTAL 62 102 164 75 20 95 137 122 259
5,877 3,280 9,157 930 406 1,336 6,807 3,686 10,493
Headcount Enrollment by Department, Status & GenderFall Semester 2007
Full-Time Part-Time Total
CFA
CIT
HEINZ
H&SS
Branch Campuses
GRAND TOTAL
Inter-disciplinary
MCS
SCS
Tepper
2.48
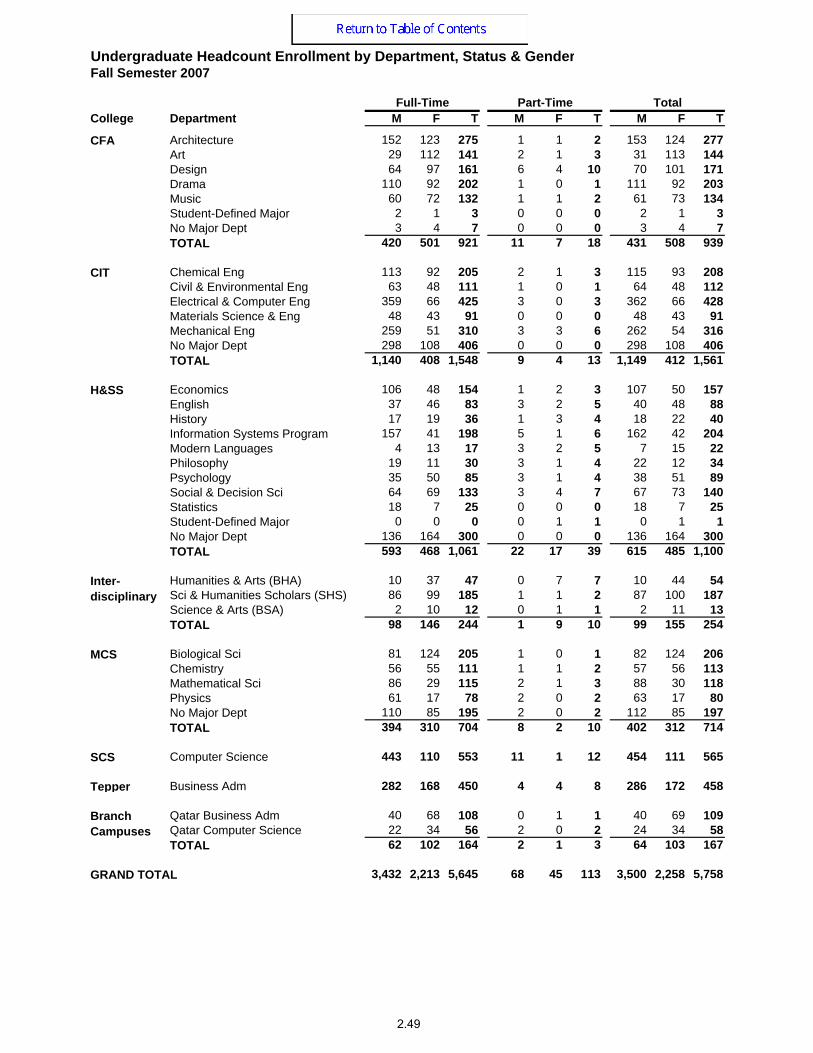
College Department M F T M F T M F T
Architecture 152 123 275 1 1 2 153 124 277Art 29 112 141 2 1 3 31 113 144Design 64 97 161 6 4 10 70 101 171Drama 110 92 202 1 0 1 111 92 203Music 60 72 132 1 1 2 61 73 134Student-Defined Major 2 1 3 0 0 0 2 1 3No Major Dept 3 4 7 0 0 0 3 4 7TOTAL 420 501 921 11 7 18 431 508 939
Chemical Eng 113 92 205 2 1 3 115 93 208Civil & Environmental Eng 63 48 111 1 0 1 64 48 112Electrical & Computer Eng 359 66 425 3 0 3 362 66 428Materials Science & Eng 48 43 91 0 0 0 48 43 91Mechanical Eng 259 51 310 3 3 6 262 54 316No Major Dept 298 108 406 0 0 0 298 108 406TOTAL 1,140 408 1,548 9 4 13 1,149 412 1,561
Economics 106 48 154 1 2 3 107 50 157English 37 46 83 3 2 5 40 48 88History 17 19 36 1 3 4 18 22 40Information Systems Program 157 41 198 5 1 6 162 42 204Modern Languages 4 13 17 3 2 5 7 15 22Philosophy 19 11 30 3 1 4 22 12 34Psychology 35 50 85 3 1 4 38 51 89Social & Decision Sci 64 69 133 3 4 7 67 73 140Statistics 18 7 25 0 0 0 18 7 25Student-Defined Major 0 0 0 0 1 1 0 1 1No Major Dept 136 164 300 0 0 0 136 164 300TOTAL 593 468 1,061 22 17 39 615 485 1,100
Humanities & Arts (BHA) 10 37 47 0 7 7 10 44 54Sci & Humanities Scholars (SHS) 86 99 185 1 1 2 87 100 187Science & Arts (BSA) 2 10 12 0 1 1 2 11 13TOTAL 98 146 244 1 9 10 99 155 254
Biological Sci 81 124 205 1 0 1 82 124 206Chemistry 56 55 111 1 1 2 57 56 113Mathematical Sci 86 29 115 2 1 3 88 30 118Physics 61 17 78 2 0 2 63 17 80No Major Dept 110 85 195 2 0 2 112 85 197TOTAL 394 310 704 8 2 10 402 312 714
SCS Computer Science 443 110 553 11 1 12 454 111 565
Tepper Business Adm 282 168 450 4 4 8 286 172 458
Qatar Business Adm 40 68 108 0 1 1 40 69 109Qatar Computer Science 22 34 56 2 0 2 24 34 58TOTAL 62 102 164 2 1 3 64 103 167
3,432 2,213 5,645 68 45 113 3,500 2,258 5,758
Undergraduate Headcount Enrollment by Department, Status & GenderFall Semester 2007
Full-Time Part-Time Total
GRAND TOTAL
MCS
Branch Campuses
CFA
CIT
H&SS
Inter-disciplinary
2.49

College Department M F T M F T M F T
Architecture 4 9 13 1 3 4 5 12 17Art 11 7 18 0 0 0 11 7 18Design 12 19 31 2 1 3 14 20 34Drama 23 24 47 0 0 0 23 24 47Music 43 32 75 5 2 7 48 34 82TOTAL 93 91 184 8 6 14 101 97 198
Biomedical Eng 2 0 2 0 0 0 2 0 2Chemical Eng 12 3 15 4 1 5 16 4 20Civil & Environmental Eng 24 11 35 3 1 4 27 12 39Electrical & Computer Eng 73 13 86 22 7 29 95 20 115Information Networking Institute 120 37 157 14 3 17 134 40 174Interdisciplinary 5 0 5 0 0 0 5 0 5Materials Science & Eng 1 0 1 0 0 0 1 0 1Mechanical Eng 29 8 37 2 0 2 31 8 39TOTAL 266 72 338 45 12 57 311 84 395
Biotechnology Management 2 0 2 0 0 0 2 0 2Creative Enterprise Mgmt 21 71 92 2 1 3 23 72 95Masters in Public Management 9 3 12 46 54 100 55 57 112Medical Management 52 11 63 0 0 0 52 11 63Public Policy & Management 133 94 227 2 3 5 135 97 232Public Policy & Mgmt, Adelaide 7 7 14 20 14 34 27 21 48Special MS in Public Mgmt 0 0 0 11 17 28 11 17 28TOTAL 224 186 410 81 89 170 305 275 580
English 17 39 56 3 6 9 20 45 65Philosophy 8 0 8 1 0 1 9 0 9Statistics 2 1 3 0 0 0 2 1 3TOTAL 27 40 67 4 6 10 31 46 77
Entertainment Technology 69 35 104 0 0 0 69 35 104Entertainment Technology, Adelaide 19 6 25 0 0 0 19 6 25Information Systems Management 134 66 200 0 0 0 134 66 200Information Technology 1 0 1 105 18 123 106 18 124Information Technology, Adelaide 4 0 4 10 4 14 14 4 18Integrated Product Development 3 3 6 1 1 2 4 4 8Special Info Technology Mgmt 0 0 0 6 2 8 6 2 8TOTAL 230 110 340 122 25 147 352 135 487
Biological Sci 10 2 12 0 0 0 10 2 12Mathematical Sci 1 0 1 0 0 0 1 0 1TOTAL 11 2 13 0 0 0 11 2 13
Computer Science 3 0 3 0 0 0 3 0 3Human-Computer Interaction 19 17 36 7 2 9 26 19 45Language Technologies Institute 33 9 42 0 1 1 33 10 43Machine Learning 0 0 0 0 1 1 0 1 1Robotics 12 1 13 2 0 2 14 1 15Software Eng 95 23 118 50 6 56 145 29 174TOTAL 162 50 212 59 10 69 221 60 281
Business Adm 0 1 1 0 0 0 0 1 1School of Business 349 100 449 67 16 83 416 116 532School of Business, Flex-time 0 0 0 270 76 346 270 76 346TOTAL 349 101 450 337 92 429 686 193 879
West Coast Campus 0 0 0 73 19 92 73 19 92
1,362 652 2,014 729 259 988 2,091 911 3,002
Branch Campuses
GRAND TOTAL
Inter-disciplinary
MCS
SCS
Tepper
CFA
CIT
HEINZ
H&SS
Masters Headcount Enrollment by Department, Status & GenderFall Semester 2007
Full-Time Part-Time Total
2.50
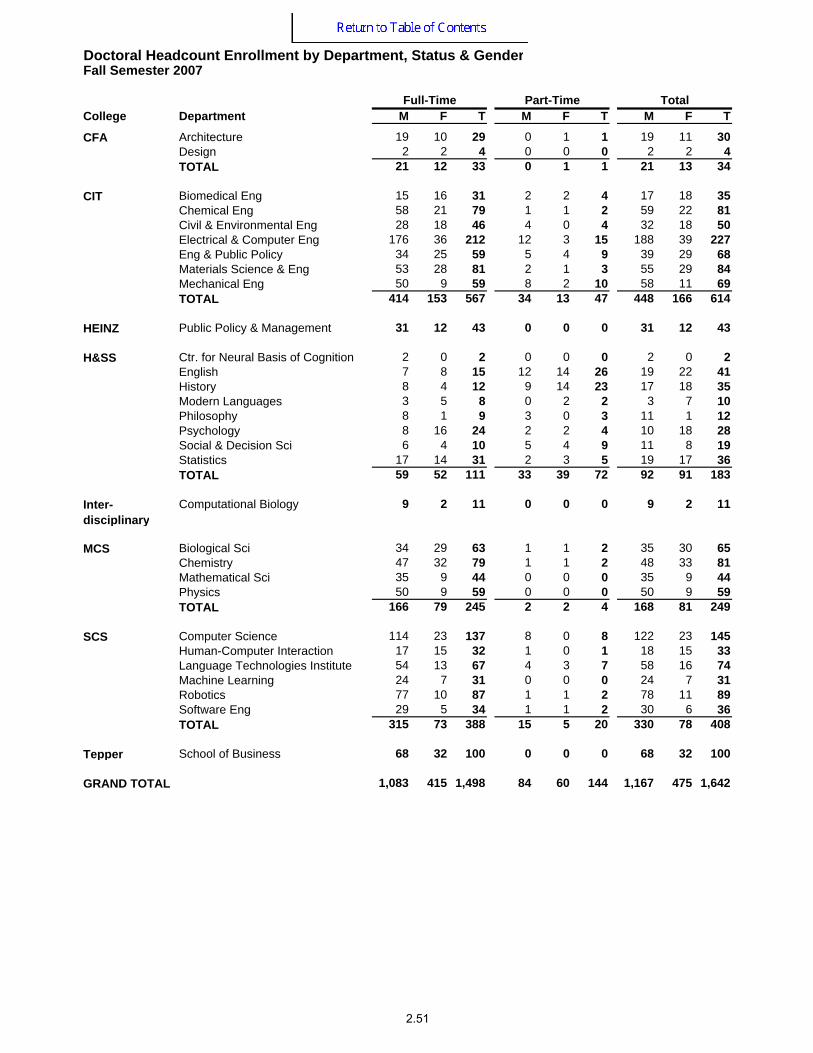
College Department M F T M F T M F T
Architecture 19 10 29 0 1 1 19 11 30Design 2 2 4 0 0 0 2 2 4TOTAL 21 12 33 0 1 1 21 13 34
Biomedical Eng 15 16 31 2 2 4 17 18 35Chemical Eng 58 21 79 1 1 2 59 22 81Civil & Environmental Eng 28 18 46 4 0 4 32 18 50Electrical & Computer Eng 176 36 212 12 3 15 188 39 227Eng & Public Policy 34 25 59 5 4 9 39 29 68Materials Science & Eng 53 28 81 2 1 3 55 29 84Mechanical Eng 50 9 59 8 2 10 58 11 69TOTAL 414 153 567 34 13 47 448 166 614
HEINZ Public Policy & Management 31 12 43 0 0 0 31 12 43
Ctr. for Neural Basis of Cognition 2 0 2 0 0 0 2 0 2English 7 8 15 12 14 26 19 22 41History 8 4 12 9 14 23 17 18 35Modern Languages 3 5 8 0 2 2 3 7 10Philosophy 8 1 9 3 0 3 11 1 12Psychology 8 16 24 2 2 4 10 18 28Social & Decision Sci 6 4 10 5 4 9 11 8 19Statistics 17 14 31 2 3 5 19 17 36TOTAL 59 52 111 33 39 72 92 91 183
Computational Biology 9 2 11 0 0 0 9 2 11
Biological Sci 34 29 63 1 1 2 35 30 65Chemistry 47 32 79 1 1 2 48 33 81Mathematical Sci 35 9 44 0 0 0 35 9 44Physics 50 9 59 0 0 0 50 9 59TOTAL 166 79 245 2 2 4 168 81 249
Computer Science 114 23 137 8 0 8 122 23 145Human-Computer Interaction 17 15 32 1 0 1 18 15 33Language Technologies Institute 54 13 67 4 3 7 58 16 74Machine Learning 24 7 31 0 0 0 24 7 31Robotics 77 10 87 1 1 2 78 11 89Software Eng 29 5 34 1 1 2 30 6 36TOTAL 315 73 388 15 5 20 330 78 408
Tepper School of Business 68 32 100 0 0 0 68 32 100
1,083 415 1,498 84 60 144 1,167 475 1,642
CFA
CIT
H&SS
Doctoral Headcount Enrollment by Department, Status & GenderFall Semester 2007
Full-Time Part-Time Total
GRAND TOTAL
Inter-disciplinary
MCS
SCS
2.51
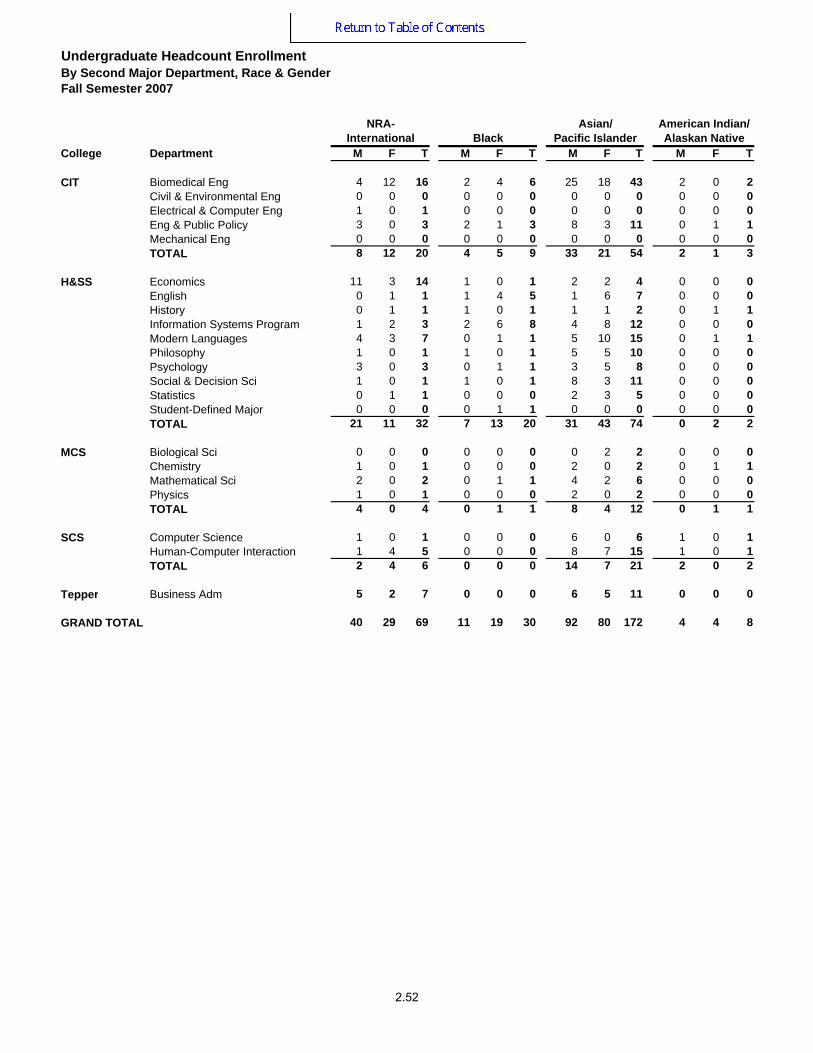
College Department M F T M F T M F T M F T
Biomedical Eng 4 12 16 2 4 6 25 18 43 2 0 2Civil & Environmental Eng 0 0 0 0 0 0 0 0 0 0 0 0Electrical & Computer Eng 1 0 1 0 0 0 0 0 0 0 0 0Eng & Public Policy 3 0 3 2 1 3 8 3 11 0 1 1Mechanical Eng 0 0 0 0 0 0 0 0 0 0 0 0TOTAL 8 12 20 4 5 9 33 21 54 2 1 3
Economics 11 3 14 1 0 1 2 2 4 0 0 0English 0 1 1 1 4 5 1 6 7 0 0 0History 0 1 1 1 0 1 1 1 2 0 1 1Information Systems Program 1 2 3 2 6 8 4 8 12 0 0 0Modern Languages 4 3 7 0 1 1 5 10 15 0 1 1Philosophy 1 0 1 1 0 1 5 5 10 0 0 0Psychology 3 0 3 0 1 1 3 5 8 0 0 0Social & Decision Sci 1 0 1 1 0 1 8 3 11 0 0 0Statistics 0 1 1 0 0 0 2 3 5 0 0 0Student-Defined Major 0 0 0 0 1 1 0 0 0 0 0 0TOTAL 21 11 32 7 13 20 31 43 74 0 2 2
Biological Sci 0 0 0 0 0 0 0 2 2 0 0 0Chemistry 1 0 1 0 0 0 2 0 2 0 1 1Mathematical Sci 2 0 2 0 1 1 4 2 6 0 0 0Physics 1 0 1 0 0 0 2 0 2 0 0 0TOTAL 4 0 4 0 1 1 8 4 12 0 1 1
Computer Science 1 0 1 0 0 0 6 0 6 1 0 1Human-Computer Interaction 1 4 5 0 0 0 8 7 15 1 0 1TOTAL 2 4 6 0 0 0 14 7 21 2 0 2
Tepper Business Adm 5 2 7 0 0 0 6 5 11 0 0 0
40 29 69 11 19 30 92 80 172 4 4 8
MCS
SCS
GRAND TOTAL
CIT
H&SS
Undergraduate Headcount EnrollmentBy Second Major Department, Race & GenderFall Semester 2007
NRA-International Black
Asian/ Pacific Islander
American Indian/ Alaskan Native
2.52
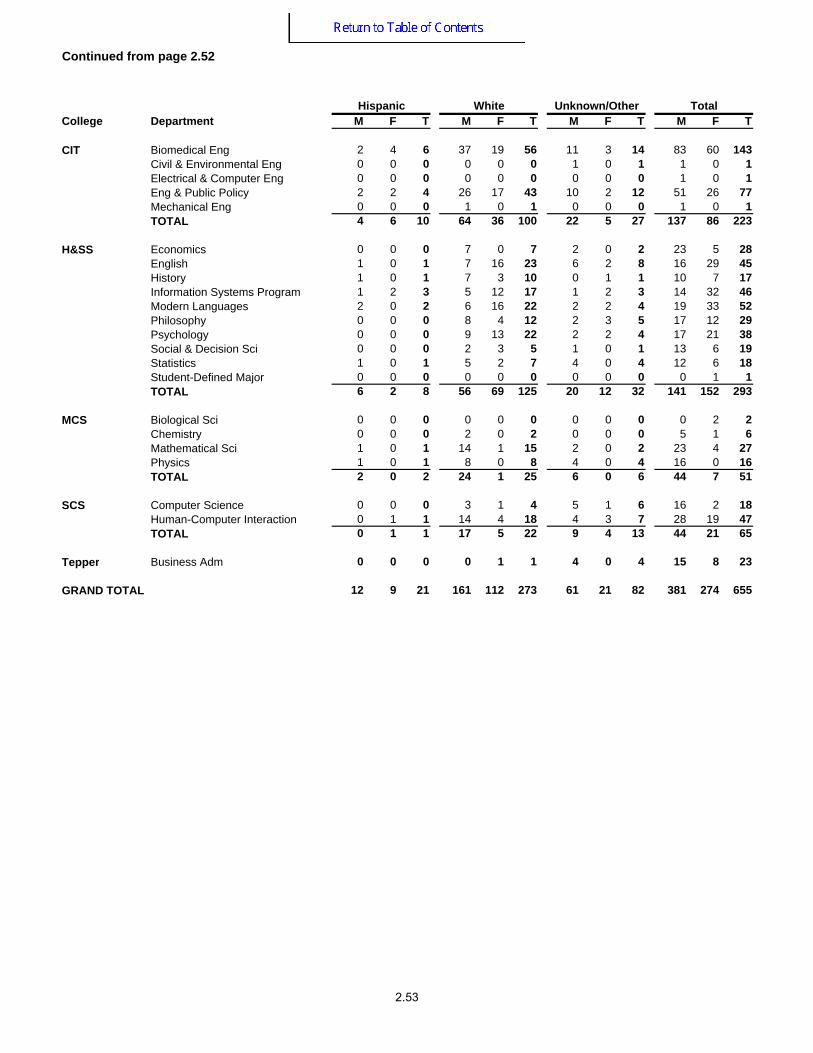
College Department M F T M F T M F T M F T
Biomedical Eng 2 4 6 37 19 56 11 3 14 83 60 143Civil & Environmental Eng 0 0 0 0 0 0 1 0 1 1 0 1Electrical & Computer Eng 0 0 0 0 0 0 0 0 0 1 0 1Eng & Public Policy 2 2 4 26 17 43 10 2 12 51 26 77Mechanical Eng 0 0 0 1 0 1 0 0 0 1 0 1TOTAL 4 6 10 64 36 100 22 5 27 137 86 223
Economics 0 0 0 7 0 7 2 0 2 23 5 28English 1 0 1 7 16 23 6 2 8 16 29 45History 1 0 1 7 3 10 0 1 1 10 7 17Information Systems Program 1 2 3 5 12 17 1 2 3 14 32 46Modern Languages 2 0 2 6 16 22 2 2 4 19 33 52Philosophy 0 0 0 8 4 12 2 3 5 17 12 29Psychology 0 0 0 9 13 22 2 2 4 17 21 38Social & Decision Sci 0 0 0 2 3 5 1 0 1 13 6 19Statistics 1 0 1 5 2 7 4 0 4 12 6 18Student-Defined Major 0 0 0 0 0 0 0 0 0 0 1 1TOTAL 6 2 8 56 69 125 20 12 32 141 152 293
Biological Sci 0 0 0 0 0 0 0 0 0 0 2 2Chemistry 0 0 0 2 0 2 0 0 0 5 1 6Mathematical Sci 1 0 1 14 1 15 2 0 2 23 4 27Physics 1 0 1 8 0 8 4 0 4 16 0 16TOTAL 2 0 2 24 1 25 6 0 6 44 7 51
Computer Science 0 0 0 3 1 4 5 1 6 16 2 18Human-Computer Interaction 0 1 1 14 4 18 4 3 7 28 19 47TOTAL 0 1 1 17 5 22 9 4 13 44 21 65
Tepper Business Adm 0 0 0 0 1 1 4 0 4 15 8 23
12 9 21 161 112 273 61 21 82 381 274 655
MCS
SCS
GRAND TOTAL
Unknown/OtherHispanic White Total
CIT
H&SS
Continued from page 2.52
2.53
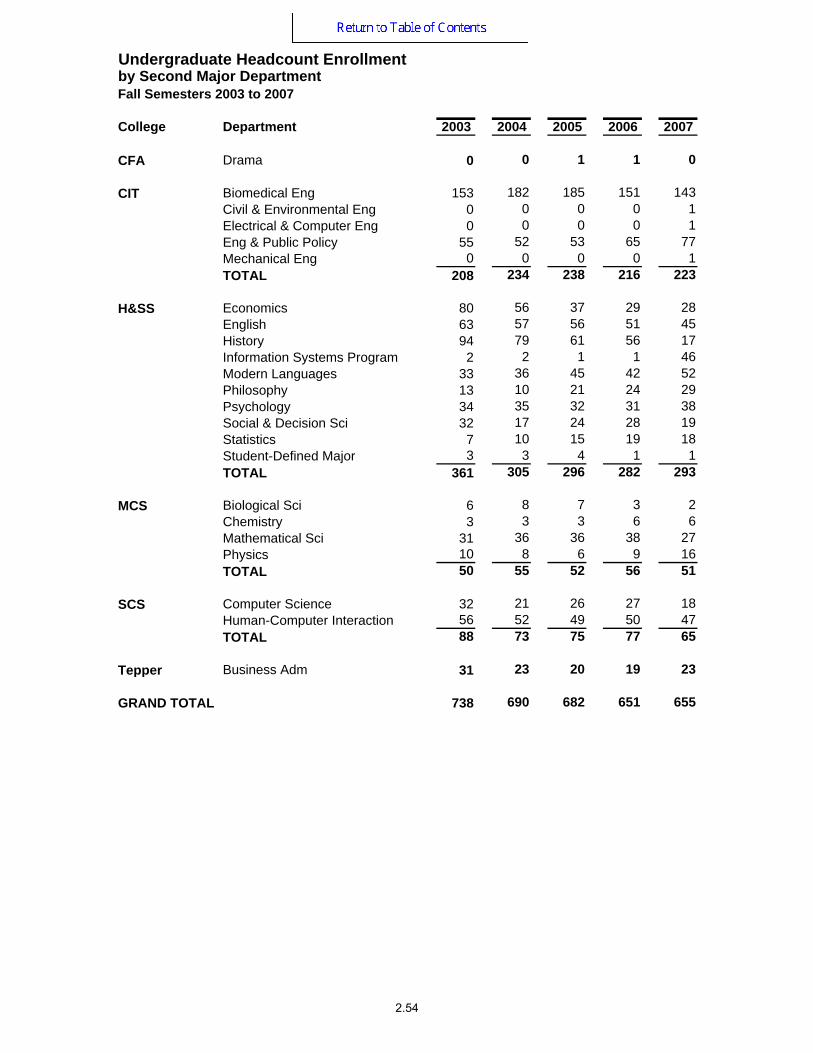
College Department 2003 2004 2005 2006 2007
CFA Drama 0 0 1 1 0
Biomedical Eng 153 182 185 151 143Civil & Environmental Eng 0 0 0 0 1Electrical & Computer Eng 0 0 0 0 1Eng & Public Policy 55 52 53 65 77Mechanical Eng 0 0 0 0 1TOTAL 208 234 238 216 223
Economics 80 56 37 29 28English 63 57 56 51 45History 94 79 61 56 17Information Systems Program 2 2 1 1 46Modern Languages 33 36 45 42 52Philosophy 13 10 21 24 29Psychology 34 35 32 31 38Social & Decision Sci 32 17 24 28 19Statistics 7 10 15 19 18Student-Defined Major 3 3 4 1 1TOTAL 361 305 296 282 293
Biological Sci 6 8 7 3 2Chemistry 3 3 3 6 6Mathematical Sci 31 36 36 38 27Physics 10 8 6 9 16TOTAL 50 55 52 56 51
Computer Science 32 21 26 27 18Human-Computer Interaction 56 52 49 50 47TOTAL 88 73 75 77 65
Tepper Business Adm 31 23 20 19 23
738 690 682 651 655
Undergraduate Headcount Enrollment
Fall Semesters 2003 to 2007
GRAND TOTAL
CIT
H&SS
MCS
SCS
by Second Major Department
2.54
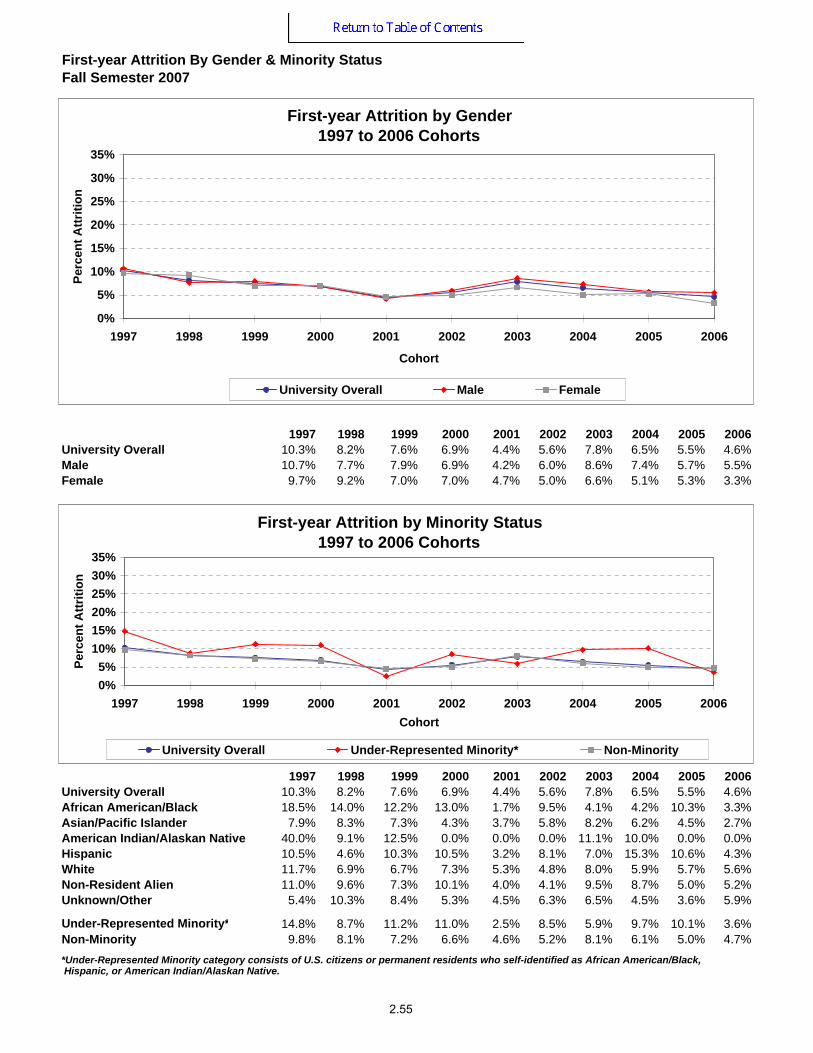
First-year Attrition By Gender & Minority StatusFall Semester 2007
1997 1998 1999 2000 2001 2002 2003 2004 2005 2006University Overall 10.3% 8.2% 7.6% 6.9% 4.4% 5.6% 7.8% 6.5% 5.5% 4.6%Male 10.7% 7.7% 7.9% 6.9% 4.2% 6.0% 8.6% 7.4% 5.7% 5.5%Female 9.7% 9.2% 7.0% 7.0% 4.7% 5.0% 6.6% 5.1% 5.3% 3.3%
1997 1998 1999 2000 2001 2002 2003 2004 2005 2006University Overall 10.3% 8.2% 7.6% 6.9% 4.4% 5.6% 7.8% 6.5% 5.5% 4.6%African American/Black 18.5% 14.0% 12.2% 13.0% 1.7% 9.5% 4.1% 4.2% 10.3% 3.3%Asian/Pacific Islander 7.9% 8.3% 7.3% 4.3% 3.7% 5.8% 8.2% 6.2% 4.5% 2.7%American Indian/Alaskan Native 40.0% 9.1% 12.5% 0.0% 0.0% 0.0% 11.1% 10.0% 0.0% 0.0%Hispanic 10.5% 4.6% 10.3% 10.5% 3.2% 8.1% 7.0% 15.3% 10.6% 4.3%White 11.7% 6.9% 6.7% 7.3% 5.3% 4.8% 8.0% 5.9% 5.7% 5.6%Non-Resident Alien 11.0% 9.6% 7.3% 10.1% 4.0% 4.1% 9.5% 8.7% 5.0% 5.2%Unknown/Other 5.4% 10.3% 8.4% 5.3% 4.5% 6.3% 6.5% 4.5% 3.6% 5.9%
Under-Represented Minority* 14.8% 8.7% 11.2% 11.0% 2.5% 8.5% 5.9% 9.7% 10.1% 3.6%Non-Minority 9.8% 8.1% 7.2% 6.6% 4.6% 5.2% 8.1% 6.1% 5.0% 4.7%*Under-Represented Minority category consists of U.S. citizens or permanent residents who self-identified as African American/Black, Hispanic, or American Indian/Alaskan Native.
First-year Attrition by Gender 1997 to 2006 Cohorts
0%
5%
10%
15%
20%
25%
30%
35%
1997 1998 1999 2000 2001 2002 2003 2004 2005 2006
Cohort
Perc
ent A
ttriti
on
University Overall Male Female
First-year Attrition by Minority Status1997 to 2006 Cohorts
0%5%
10%15%20%25%30%35%
1997 1998 1999 2000 2001 2002 2003 2004 2005 2006Cohort
Perc
ent A
ttriti
on
University Overall Under-Represented Minority* Non-Minority
2.55

Overall Attrition & Graduation RatesFall Semester 2007
ATTRITION RATES1997 1998 1999 2000 2001 2002 2003 2004 2005 2006
First-year to Sophomore 10.3% 8.2% 7.6% 6.9% 4.4% 5.6% 7.8% 6.5% 5.5% 4.6%First-year to Junior Cumulative 15.9% 13.7% 11.8% 10.8% 9.4% 9.6% 12.2% 11.5% 9.9%First-year to Senior Cumulative 17.0% 13.7% 12.0% 12.3% 11.5% 12.0% 14.0% 12.0%First-year to 6-Year Graduation 18.3% 15.2% 14.3% 13.7% 13.3%
GRADUATION RATES1997 1998 1999 2000 2001 2002 2003
Graduated in 4 Years or Less 62.9% 65.1% 66.5% 69.3% 70.3% 70.0% 67.2%Graduated in 5 Years 15.0% 17.5% 16.3% 14.5% 14.2% 14.1%Graduated in 6 Years 3.9% 2.2% 2.9% 2.6% 2.2%Graduated in 7 Years or More 2.0% 1.7% 2.3% 0.8%Cumulative Graduation Rate 83.7% 86.5% 88.0% 87.0% 86.7% 84.2% 67.2%
Carnegie Mellon University Attrition Rates, 1997 to 2006 Cohorts
0%5%
10%15%20%25%30%35%
1997N=1271
1998N=1305
1999N=1254
2000N=1328
2001N=1318
2002N=1365
2003N=1341
2004N=1367
2005N=1409
2006N=1428
Cohort / Number in Cohort
Perc
ent A
ttriti
on
First-year to Sophomore First-year to Junior CumulativeFirst-year to Senior Cumulative First-year to 6-Year Graduation
Carnegie Mellon University Overall Graduation Rates, 1997 to 2003 Cohorts
83.7% 86.5% 88.0% 87.0% 86.7% 84.2%
67.2%
0%10%20%30%40%50%60%70%80%90%
100%
1997 N=1271 1998 N=1305 1999 N=1254 2000 N=1328 2001 N=1318 2002 N=1365 2003 N=1341
Cohort / Number in Cohort
Gra
duat
ion
Rat
e
Graduated in 4 Years or Less Graduated in 5 Years Graduated in 6 YearsGraduated in 7 Years or More Cumulative Graduation Rate
2.56
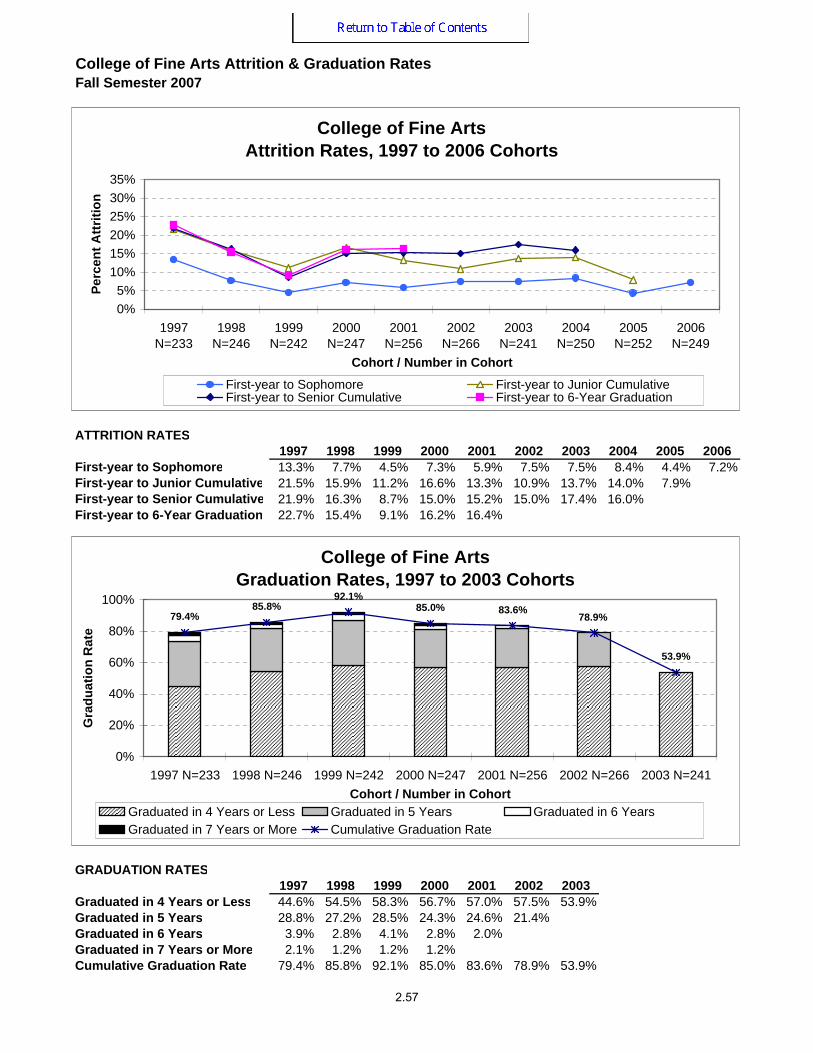
College of Fine Arts Attrition & Graduation RatesFall Semester 2007
ATTRITION RATES1997 1998 1999 2000 2001 2002 2003 2004 2005 2006
First-year to Sophomore 13.3% 7.7% 4.5% 7.3% 5.9% 7.5% 7.5% 8.4% 4.4% 7.2%First-year to Junior Cumulative 21.5% 15.9% 11.2% 16.6% 13.3% 10.9% 13.7% 14.0% 7.9%First-year to Senior Cumulative 21.9% 16.3% 8.7% 15.0% 15.2% 15.0% 17.4% 16.0%First-year to 6-Year Graduation 22.7% 15.4% 9.1% 16.2% 16.4%
GRADUATION RATES1997 1998 1999 2000 2001 2002 2003
Graduated in 4 Years or Less 44.6% 54.5% 58.3% 56.7% 57.0% 57.5% 53.9%Graduated in 5 Years 28.8% 27.2% 28.5% 24.3% 24.6% 21.4%Graduated in 6 Years 3.9% 2.8% 4.1% 2.8% 2.0%Graduated in 7 Years or More 2.1% 1.2% 1.2% 1.2%Cumulative Graduation Rate 79.4% 85.8% 92.1% 85.0% 83.6% 78.9% 53.9%
College of Fine Arts Attrition Rates, 1997 to 2006 Cohorts
0%5%
10%15%20%25%30%35%
1997N=233
1998N=246
1999N=242
2000N=247
2001N=256
2002N=266
2003N=241
2004N=250
2005N=252
2006N=249
Cohort / Number in Cohort
Perc
ent A
ttriti
on
First-year to Sophomore First-year to Junior CumulativeFirst-year to Senior Cumulative First-year to 6-Year Graduation
College of Fine Arts Graduation Rates, 1997 to 2003 Cohorts
79.4%85.8%
92.1%85.0% 83.6%
78.9%
53.9%
0%
20%
40%
60%
80%
100%
1997 N=233 1998 N=246 1999 N=242 2000 N=247 2001 N=256 2002 N=266 2003 N=241Cohort / Number in Cohort
Gra
duat
ion
Rat
e
Graduated in 4 Years or Less Graduated in 5 Years Graduated in 6 YearsGraduated in 7 Years or More Cumulative Graduation Rate
2.57
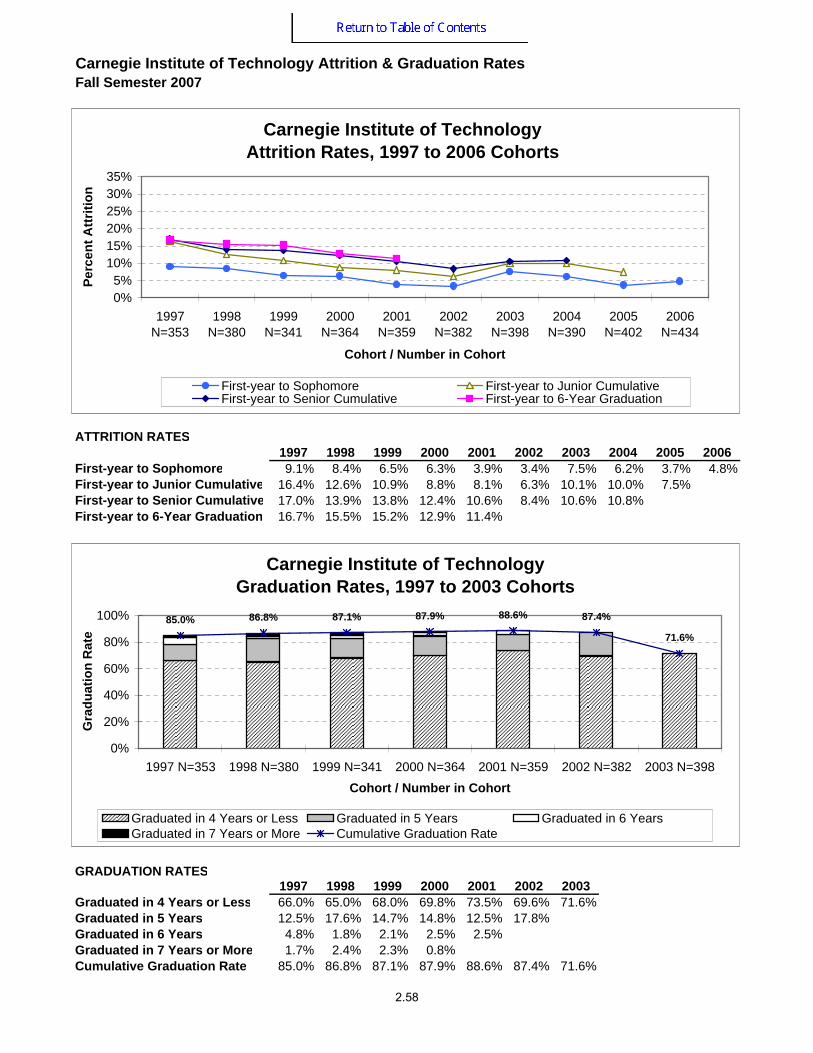
Carnegie Institute of Technology Attrition & Graduation RatesFall Semester 2007
ATTRITION RATES1997 1998 1999 2000 2001 2002 2003 2004 2005 2006
First-year to Sophomore 9.1% 8.4% 6.5% 6.3% 3.9% 3.4% 7.5% 6.2% 3.7% 4.8%First-year to Junior Cumulative 16.4% 12.6% 10.9% 8.8% 8.1% 6.3% 10.1% 10.0% 7.5%First-year to Senior Cumulative 17.0% 13.9% 13.8% 12.4% 10.6% 8.4% 10.6% 10.8%First-year to 6-Year Graduation 16.7% 15.5% 15.2% 12.9% 11.4%
GRADUATION RATES1997 1998 1999 2000 2001 2002 2003
Graduated in 4 Years or Less 66.0% 65.0% 68.0% 69.8% 73.5% 69.6% 71.6%Graduated in 5 Years 12.5% 17.6% 14.7% 14.8% 12.5% 17.8%Graduated in 6 Years 4.8% 1.8% 2.1% 2.5% 2.5%Graduated in 7 Years or More 1.7% 2.4% 2.3% 0.8%Cumulative Graduation Rate 85.0% 86.8% 87.1% 87.9% 88.6% 87.4% 71.6%
Carnegie Institute of Technology Attrition Rates, 1997 to 2006 Cohorts
0%5%
10%15%20%25%30%35%
1997N=353
1998N=380
1999N=341
2000N=364
2001N=359
2002N=382
2003N=398
2004N=390
2005N=402
2006N=434
Cohort / Number in Cohort
Perc
ent A
ttriti
on
First-year to Sophomore First-year to Junior CumulativeFirst-year to Senior Cumulative First-year to 6-Year Graduation
Carnegie Institute of Technology Graduation Rates, 1997 to 2003 Cohorts
71.6%
87.4%88.6%87.9%87.1%86.8%85.0%
0%
20%
40%
60%
80%
100%
1997 N=353 1998 N=380 1999 N=341 2000 N=364 2001 N=359 2002 N=382 2003 N=398Cohort / Number in Cohort
Gra
duat
ion
Rat
e
Graduated in 4 Years or Less Graduated in 5 Years Graduated in 6 YearsGraduated in 7 Years or More Cumulative Graduation Rate
2.58
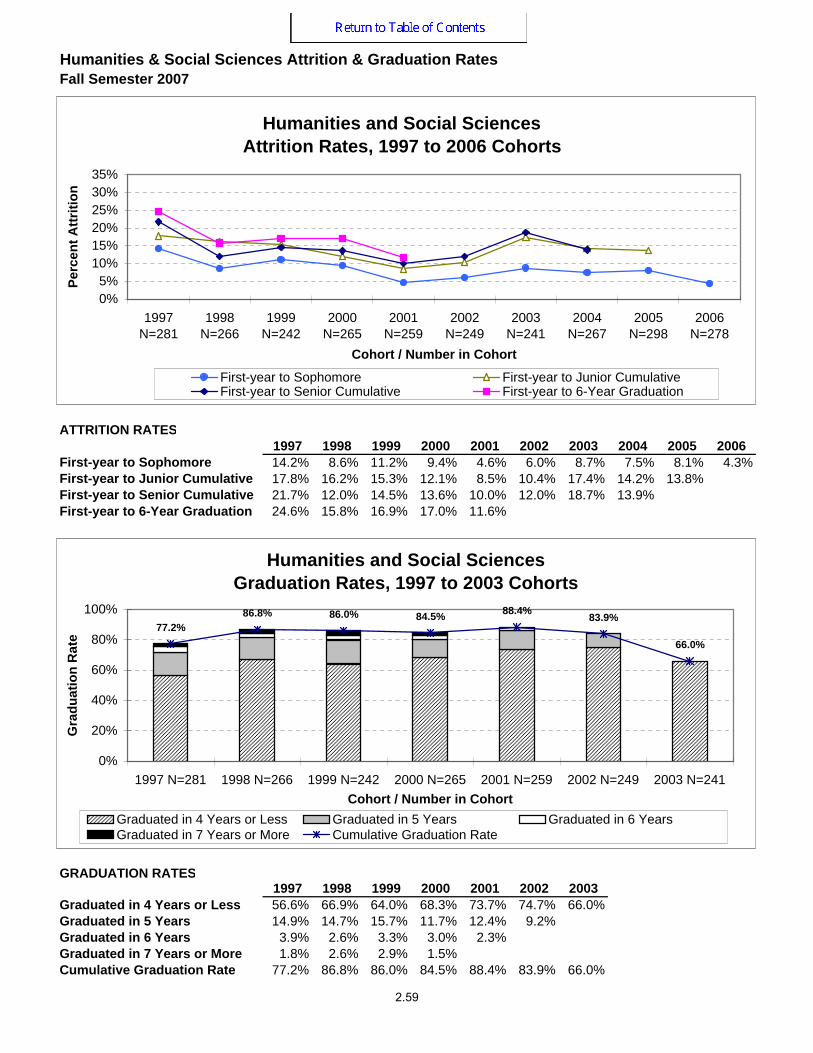
Humanities & Social Sciences Attrition & Graduation RatesFall Semester 2007
ATTRITION RATES1997 1998 1999 2000 2001 2002 2003 2004 2005 2006
First-year to Sophomore 14.2% 8.6% 11.2% 9.4% 4.6% 6.0% 8.7% 7.5% 8.1% 4.3%First-year to Junior Cumulative 17.8% 16.2% 15.3% 12.1% 8.5% 10.4% 17.4% 14.2% 13.8%First-year to Senior Cumulative 21.7% 12.0% 14.5% 13.6% 10.0% 12.0% 18.7% 13.9%First-year to 6-Year Graduation 24.6% 15.8% 16.9% 17.0% 11.6%
GRADUATION RATES1997 1998 1999 2000 2001 2002 2003
Graduated in 4 Years or Less 56.6% 66.9% 64.0% 68.3% 73.7% 74.7% 66.0%Graduated in 5 Years 14.9% 14.7% 15.7% 11.7% 12.4% 9.2%Graduated in 6 Years 3.9% 2.6% 3.3% 3.0% 2.3%Graduated in 7 Years or More 1.8% 2.6% 2.9% 1.5%Cumulative Graduation Rate 77.2% 86.8% 86.0% 84.5% 88.4% 83.9% 66.0%
Humanities and Social Sciences Attrition Rates, 1997 to 2006 Cohorts
0%5%
10%15%20%25%30%35%
1997N=281
1998N=266
1999N=242
2000N=265
2001N=259
2002N=249
2003N=241
2004N=267
2005N=298
2006N=278
Cohort / Number in Cohort
Perc
ent A
ttriti
on
First-year to Sophomore First-year to Junior CumulativeFirst-year to Senior Cumulative First-year to 6-Year Graduation
Humanities and Social Sciences Graduation Rates, 1997 to 2003 Cohorts
66.0%
83.9%88.4%84.5%86.0%86.8%77.2%
0%
20%
40%
60%
80%
100%
1997 N=281 1998 N=266 1999 N=242 2000 N=265 2001 N=259 2002 N=249 2003 N=241Cohort / Number in Cohort
Gra
duat
ion
Rat
e
Graduated in 4 Years or Less Graduated in 5 Years Graduated in 6 YearsGraduated in 7 Years or More Cumulative Graduation Rate
2.59
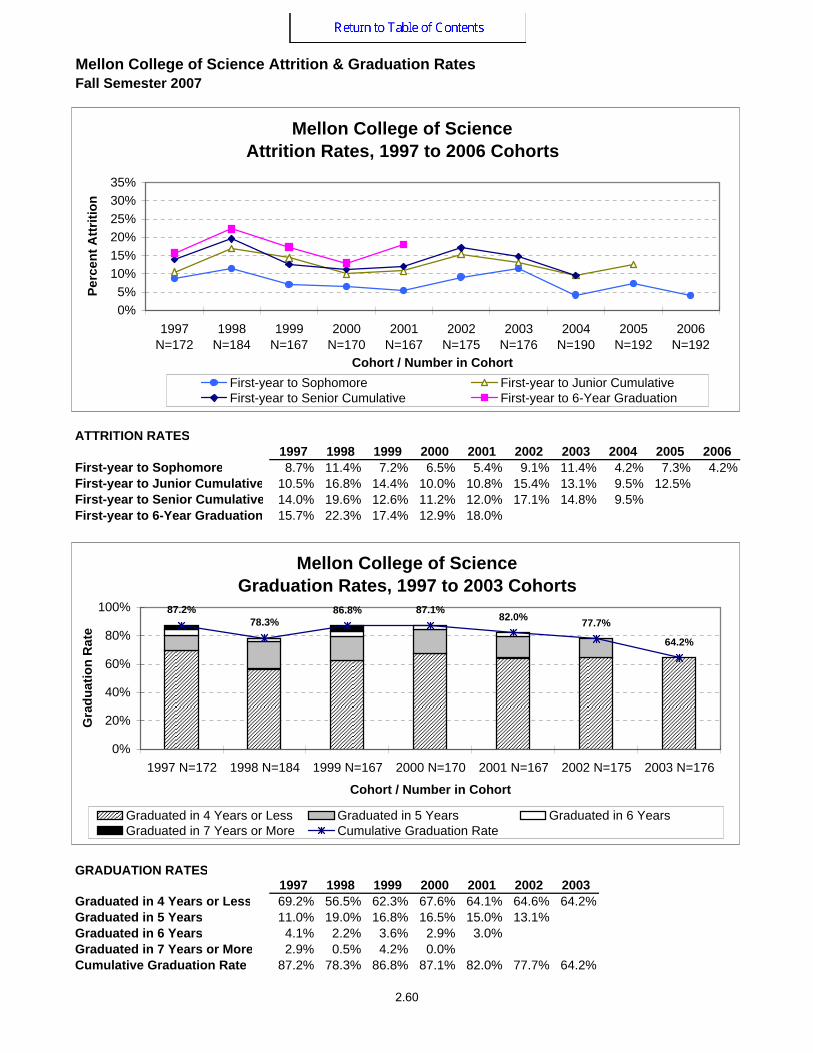
Mellon College of Science Attrition & Graduation RatesFall Semester 2007
ATTRITION RATES1997 1998 1999 2000 2001 2002 2003 2004 2005 2006
First-year to Sophomore 8.7% 11.4% 7.2% 6.5% 5.4% 9.1% 11.4% 4.2% 7.3% 4.2%First-year to Junior Cumulative 10.5% 16.8% 14.4% 10.0% 10.8% 15.4% 13.1% 9.5% 12.5%First-year to Senior Cumulative 14.0% 19.6% 12.6% 11.2% 12.0% 17.1% 14.8% 9.5%First-year to 6-Year Graduation 15.7% 22.3% 17.4% 12.9% 18.0%
GRADUATION RATES1997 1998 1999 2000 2001 2002 2003
Graduated in 4 Years or Less 69.2% 56.5% 62.3% 67.6% 64.1% 64.6% 64.2%Graduated in 5 Years 11.0% 19.0% 16.8% 16.5% 15.0% 13.1%Graduated in 6 Years 4.1% 2.2% 3.6% 2.9% 3.0%Graduated in 7 Years or More 2.9% 0.5% 4.2% 0.0%Cumulative Graduation Rate 87.2% 78.3% 86.8% 87.1% 82.0% 77.7% 64.2%
Mellon College of Science Attrition Rates, 1997 to 2006 Cohorts
0%5%
10%15%20%25%30%35%
1997N=172
1998N=184
1999N=167
2000N=170
2001N=167
2002N=175
2003N=176
2004N=190
2005N=192
2006N=192
Cohort / Number in Cohort
Perc
ent A
ttriti
on
First-year to Sophomore First-year to Junior CumulativeFirst-year to Senior Cumulative First-year to 6-Year Graduation
Mellon College of Science Graduation Rates, 1997 to 2003 Cohorts
64.2%
77.7%82.0%87.1%86.8%
78.3%87.2%
0%
20%
40%
60%
80%
100%
1997 N=172 1998 N=184 1999 N=167 2000 N=170 2001 N=167 2002 N=175 2003 N=176
Cohort / Number in Cohort
Gra
duat
ion
Rat
e
Graduated in 4 Years or Less Graduated in 5 Years Graduated in 6 YearsGraduated in 7 Years or More Cumulative Graduation Rate
2.60

School of Computer Science Attrition & Graduation RatesFall Semester 2007
ATTRITION RATES1997 1998 1999 2000 2001 2002 2003 2004 2005 2006
First-year to Sophomore 3.7% 4.3% 4.7% 3.1% 2.3% 1.5% 4.4% 4.6% 6.4% 1.5%First-year to Junior Cumulative 10.3% 4.3% 3.1% 3.1% 6.2% 6.2% 7.4% 12.3% 10.6%First-year to Senior Cumulative 7.4% 5.0% 4.7% 3.8% 8.5% 10.0% 9.6% 12.3%First-year to 6-Year Graduation 9.6% 6.4% 7.0% 4.6% 11.5%
GRADUATION RATES1997 1998 1999 2000 2001 2002 2003
Graduated in 4 Years or Less 80.1% 82.1% 82.8% 88.5% 80.0% 82.3% 72.6%Graduated in 5 Years 8.1% 8.6% 7.8% 4.6% 7.7% 6.9%Graduated in 6 Years 2.2% 2.9% 2.3% 2.3% 0.8%Graduated in 7 Years or More 2.9% 1.4% 0.8% 0.0%Cumulative Graduation Rate 93.4% 95.0% 93.8% 95.4% 88.5% 89.2% 72.6%
School of Computer Science Attrition Rates, 1997 to 2006 Cohorts
0%5%
10%15%20%25%30%35%
1997N=136
1998N=140
1999N=128
2000N=131
2001N=130
2002N=130
2003N=135
2004N=130
2005N=141
2006N=136
Cohort / Number in Cohort
Perc
ent A
ttriti
on
First-year to Sophomore First-year to Junior CumulativeFirst-year to Senior Cumulative First-year to 6-Year Graduation
School of Computer Science Graduation Rates, 1997 to 2003 Cohorts
72.6%
89.2%88.5%95.4%93.8%95.0%93.4%
0%
20%
40%
60%
80%
100%
1997 N=136 1998 N=140 1999 N=128 2000 N=131 2001 N=130 2002 N=130 2003 N=135Cohort / Number in Cohort
Gra
duat
ion
Rat
e
Graduated in 4 Years or Less Graduated in 5 Years Graduated in 6 YearsGraduated in 7 Years or More Cumulative Graduation Rate
2.61
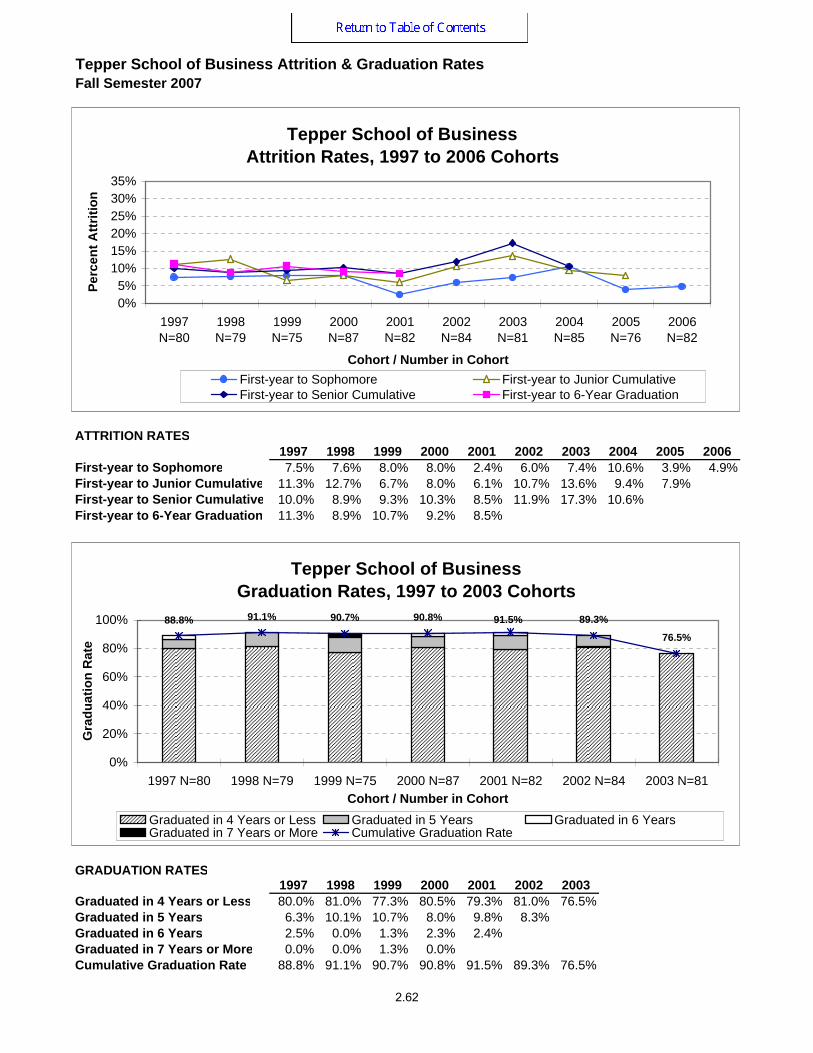
Tepper School of Business Attrition & Graduation RatesFall Semester 2007
ATTRITION RATES1997 1998 1999 2000 2001 2002 2003 2004 2005 2006
First-year to Sophomore 7.5% 7.6% 8.0% 8.0% 2.4% 6.0% 7.4% 10.6% 3.9% 4.9%First-year to Junior Cumulative 11.3% 12.7% 6.7% 8.0% 6.1% 10.7% 13.6% 9.4% 7.9%First-year to Senior Cumulative 10.0% 8.9% 9.3% 10.3% 8.5% 11.9% 17.3% 10.6%First-year to 6-Year Graduation 11.3% 8.9% 10.7% 9.2% 8.5%
GRADUATION RATES1997 1998 1999 2000 2001 2002 2003
Graduated in 4 Years or Less 80.0% 81.0% 77.3% 80.5% 79.3% 81.0% 76.5%Graduated in 5 Years 6.3% 10.1% 10.7% 8.0% 9.8% 8.3%Graduated in 6 Years 2.5% 0.0% 1.3% 2.3% 2.4%Graduated in 7 Years or More 0.0% 0.0% 1.3% 0.0%Cumulative Graduation Rate 88.8% 91.1% 90.7% 90.8% 91.5% 89.3% 76.5%
Tepper School of BusinessAttrition Rates, 1997 to 2006 Cohorts
0%5%
10%15%20%25%30%35%
1997N=80
1998N=79
1999N=75
2000N=87
2001N=82
2002N=84
2003N=81
2004N=85
2005N=76
2006N=82
Cohort / Number in Cohort
Perc
ent A
ttriti
on
First-year to Sophomore First-year to Junior CumulativeFirst-year to Senior Cumulative First-year to 6-Year Graduation
Tepper School of Business Graduation Rates, 1997 to 2003 Cohorts
88.8% 91.1% 90.7% 90.8% 91.5% 89.3%
76.5%
0%
20%
40%
60%
80%
100%
1997 N=80 1998 N=79 1999 N=75 2000 N=87 2001 N=82 2002 N=84 2003 N=81Cohort / Number in Cohort
Gra
duat
ion
Rat
e
Graduated in 4 Years or Less Graduated in 5 Years Graduated in 6 YearsGraduated in 7 Years or More Cumulative Graduation Rate
2.62