1st quarter 2021 performance
TRANSCRIPT

1st quarter 2021 Performance—WebcastMay 14, 2021
Henrique Lage
refinery - REVAP
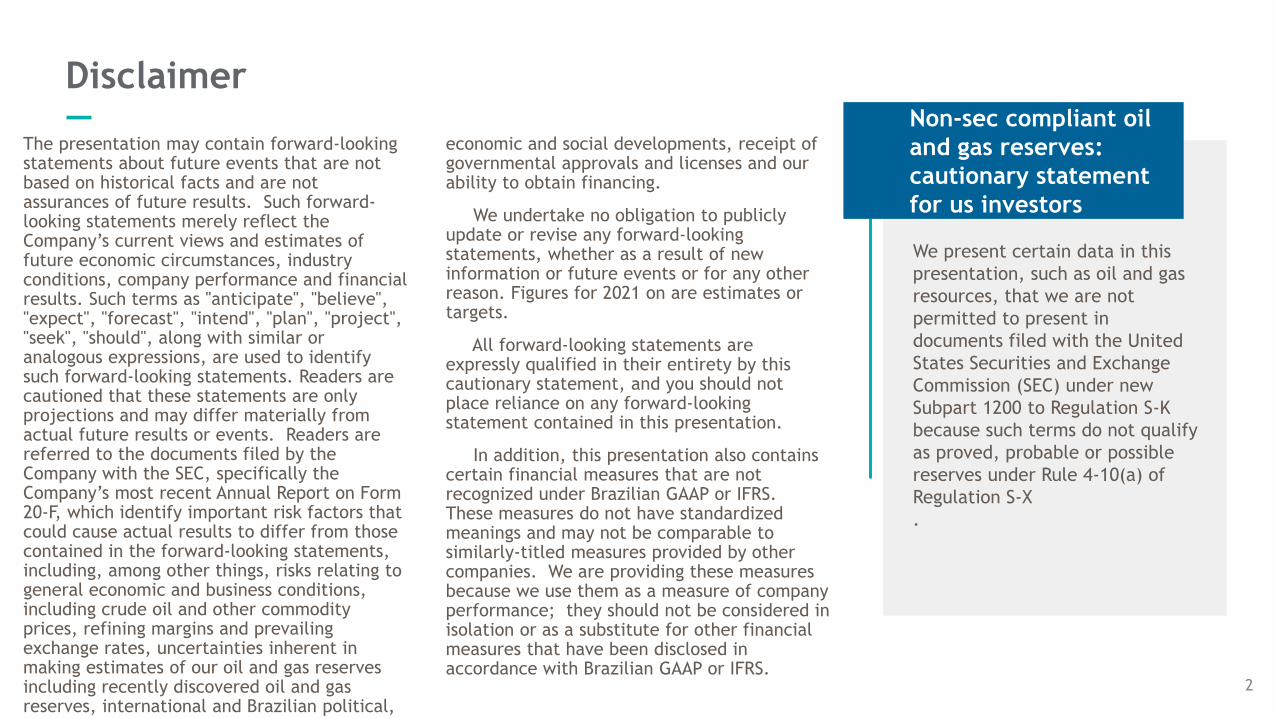
Disclaimer—
The presentation may contain forward-looking statements about future events that are not based on historical facts and are not assurances of future results. Such forward-looking statements merely reflect the Company’s current views and estimates of future economic circumstances, industry conditions, company performance and financial results. Such terms as "anticipate", "believe", "expect", "forecast", "intend", "plan", "project", "seek", "should", along with similar or analogous expressions, are used to identify such forward-looking statements. Readers are cautioned that these statements are only projections and may differ materially from actual future results or events. Readers are referred to the documents filed by the Company with the SEC, specifically the Company’s most recent Annual Report on Form 20-F, which identify important risk factors that could cause actual results to differ from those contained in the forward-looking statements, including, among other things, risks relating to general economic and business conditions, including crude oil and other commodity prices, refining margins and prevailing exchange rates, uncertainties inherent in making estimates of our oil and gas reserves including recently discovered oil and gas reserves, international and Brazilian political,
economic and social developments, receipt of governmental approvals and licenses and our ability to obtain financing.
We undertake no obligation to publicly update or revise any forward-looking statements, whether as a result of new information or future events or for any other reason. Figures for 2021 on are estimates or targets.
All forward-looking statements are expressly qualified in their entirety by this cautionary statement, and you should not place reliance on any forward-looking statement contained in this presentation.
In addition, this presentation also contains certain financial measures that are not recognized under Brazilian GAAP or IFRS. These measures do not have standardized meanings and may not be comparable to similarly-titled measures provided by other companies. We are providing these measures because we use them as a measure of company performance; they should not be considered in isolation or as a substitute for other financial measures that have been disclosed in accordance with Brazilian GAAP or IFRS.
Non-sec compliant oil
and gas reserves:
cautionary statement
for us investors
We present certain data in this
presentation, such as oil and gas
resources, that we are not
permitted to present in
documents filed with the United
States Securities and Exchange
Commission (SEC) under new
Subpart 1200 to Regulation S-K
because such terms do not qualify
as proved, probable or possible
reserves under Rule 4-10(a) of
Regulation S-X
.
2
ESGEnvironmental,Social and Governance

Safety as a value and fighting Covid-19—
2.15
1.63
1.08 1.010.76
0.56 0.62
2015 2016 2017 2018 2019 2020 1Q21
» Top metric TRI < 0.7
» 1Q21 within the Acceptable Maximum Limit
for 2021
TIRTotal recordable injuries
per million man-hours
Ambition: zero fatalities
RECENT ACTIONS AGAINST COVID-19
• Donation of intubation medication to the
Ministry of Health, in a joint action with
other companies
• Acquisition of mini oxygen units to supply
public hospitals, and donation of oxygen
cylinders
• Change in platforms´ boarding schedule to
reduce turnover and risk of contagion
4

Emission indicators—1Q21 within the targets established in the Strategic Plan
17.040.0
17.5 17.315.8 16.0
2018 2019 2020 1Q21
42.0 41.7 40.2 39.9
2018 2019 2020 1Q21
* The CWT (Complexity Weighted Tonne) of a refinery considers the potential CO2 emission, in equivalence to distillation, for each process unit.
** AML = Acceptable Maximum Limit
Target or 2021
AML**
Absolute GHG emissions in 1Q21: 15.4 MMt CO2e
Target or 2021
AML**
CARBON INTENSITY E&PkgCO2e/boe produced
CARBON INTENSITY REFININGkgCO2e/CWT*
5

FinancialHighlights
Rodrigo Araujo AlvesChief Financial and Investor Relations Officer

1Q21 Highlights
—
Cash inflow with divestments of
US$ 201 million
Increase in oil and natural gas
production (+3%)
Gross debt:
Annual reduction of
US$ 18.3 billion
Quarterly reduction of
US$ 4.6 billion
Repurchase of bonds of US$ 1.4
billion and prepayment of debts
of US$ 0.3 billion
Record sales of S-10 Diesel
7
Strong cash generation:
US$ 7.2 billion
Positive free cash flow:
US$ 5.6 billion
Recurring EBITDA growth of
34% and margin of 55%

8
50.26
29.20
43.00 44.23
60.90
1Q20 2Q20 3Q20 4Q20 1Q21
EXCHANGE
RATER$/US$
BRENTUS$/bbl
4.47
5.39 5.38 5.40 5.47
1Q20 2Q20 3Q20 4Q20 1Q21
External environment—
5.20
5.70
4Q20 1Q21
+10%
End of period exchange rate
Averageexchange rate
+38%

We continue to reduce indebtedness—
AMORTIZATION PROFILEUS$ billion
* As of 2018, amounts include leases
111
8776
7196
79
6358
2018 2019 2020 1Q21
Net DebtGross Debt
» Average debt maturity of 11.84 years
» Average financing rate of 6.0% p.y
INDEBTNESS*US$ billion
12.5
2.8 3.3 5.6 5.8 6,.1
26.78.3
3.3 3.52.1 1.5 1.2
8.9
20.8
6.2 6.8 7.7 7.3 7.3
35.6
2021 2022 2023 2024 2025 2026onwards
Financial debt
Leasing IFRS 16
Revolving
credit lines
Cash
9
In April, additional reduction of US$ 3.2 billion in gross debt
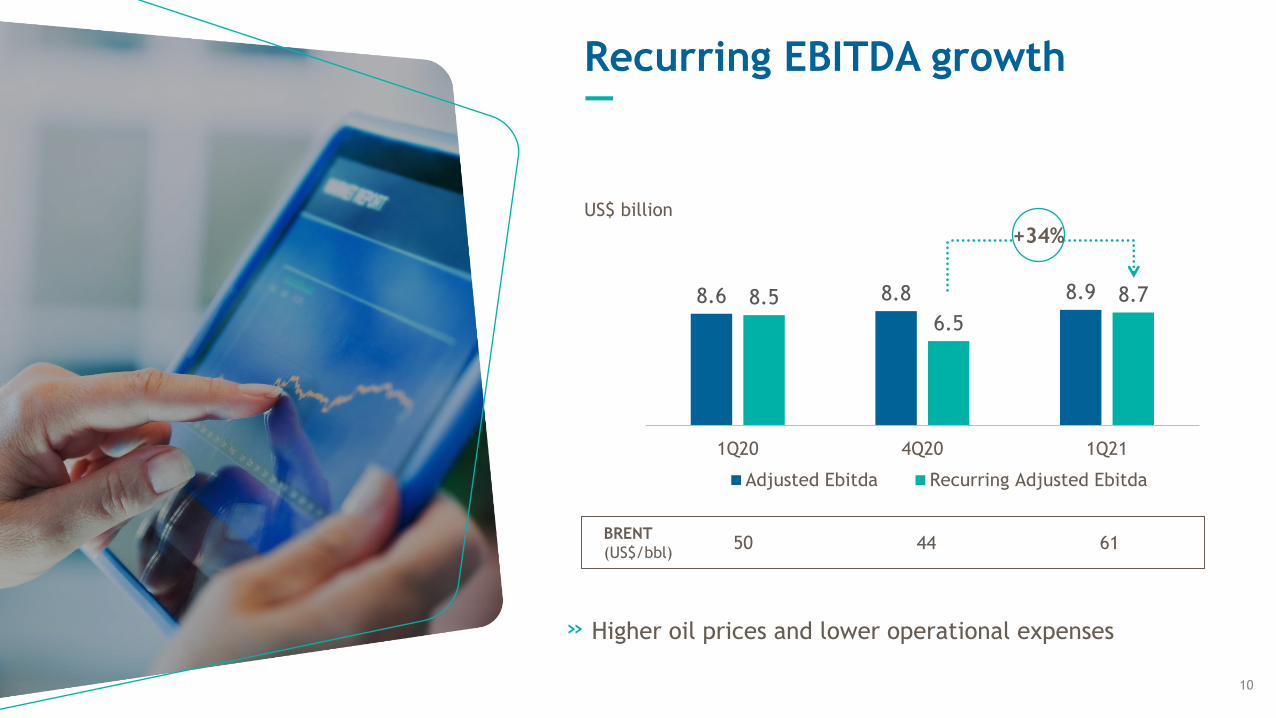
Recurring EBITDA growth—
10
8.6 8.8 8.98.5
6.5
8.7
1Q20 4Q20 1Q21
Adjusted Ebitda Recurring Adjusted Ebitda
+34%
» Higher oil prices and lower operational expenses
US$ billion
BRENT
(US$/bbl)50 44 61
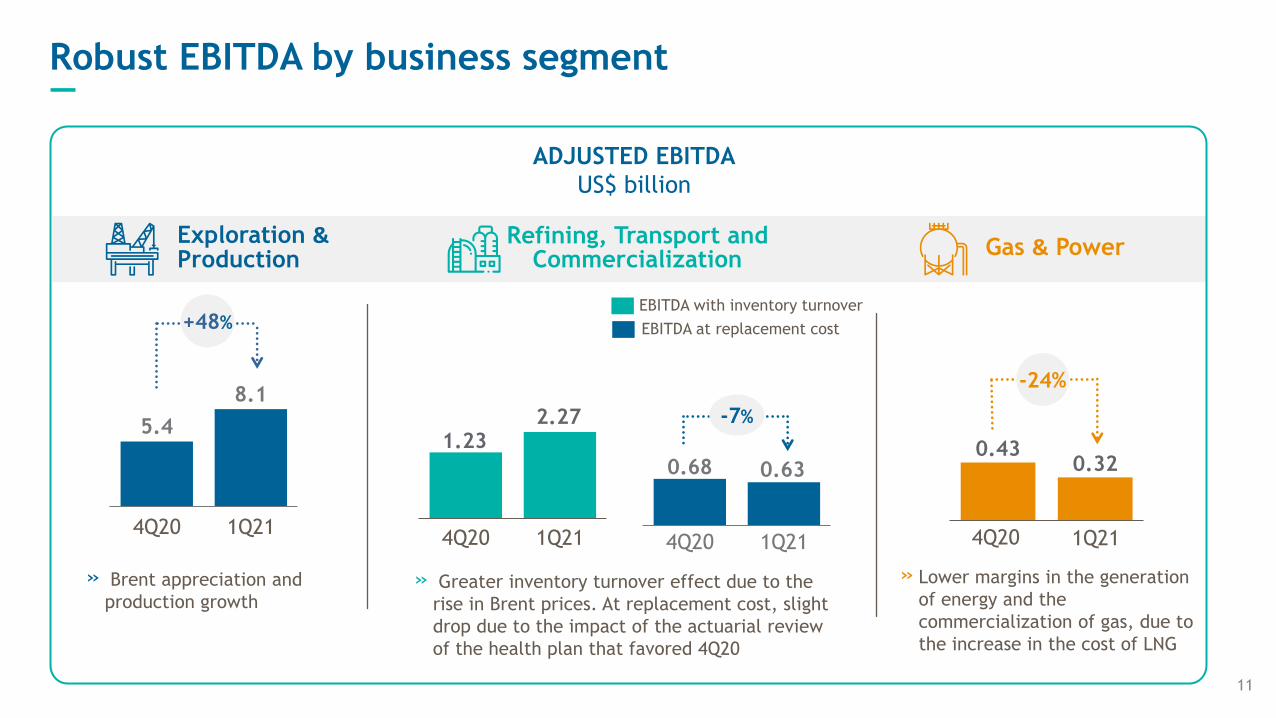
Robust EBITDA by business segment—
Refining, Transport and Commercialization
Exploration &Production
Gas & Power
1.232.27
4Q20 1Q21
0.430.32
4Q20 1Q21
5.4
8.1
4Q20 1Q21
+48%EBITDA with inventory turnover
EBITDA at replacement cost
-24%
11
0.68 0.63
4Q20 1Q21
-7%
» Brent appreciation and
production growth
» Lower margins in the generation
of energy and the
commercialization of gas, due to
the increase in the cost of LNG
» Greater inventory turnover effect due to the
rise in Brent prices. At replacement cost, slight
drop due to the impact of the actuarial review
of the health plan that favored 4Q20
ADJUSTED EBITDA
US$ billion
8.97.2
5.6 5.8
1.1
0.2
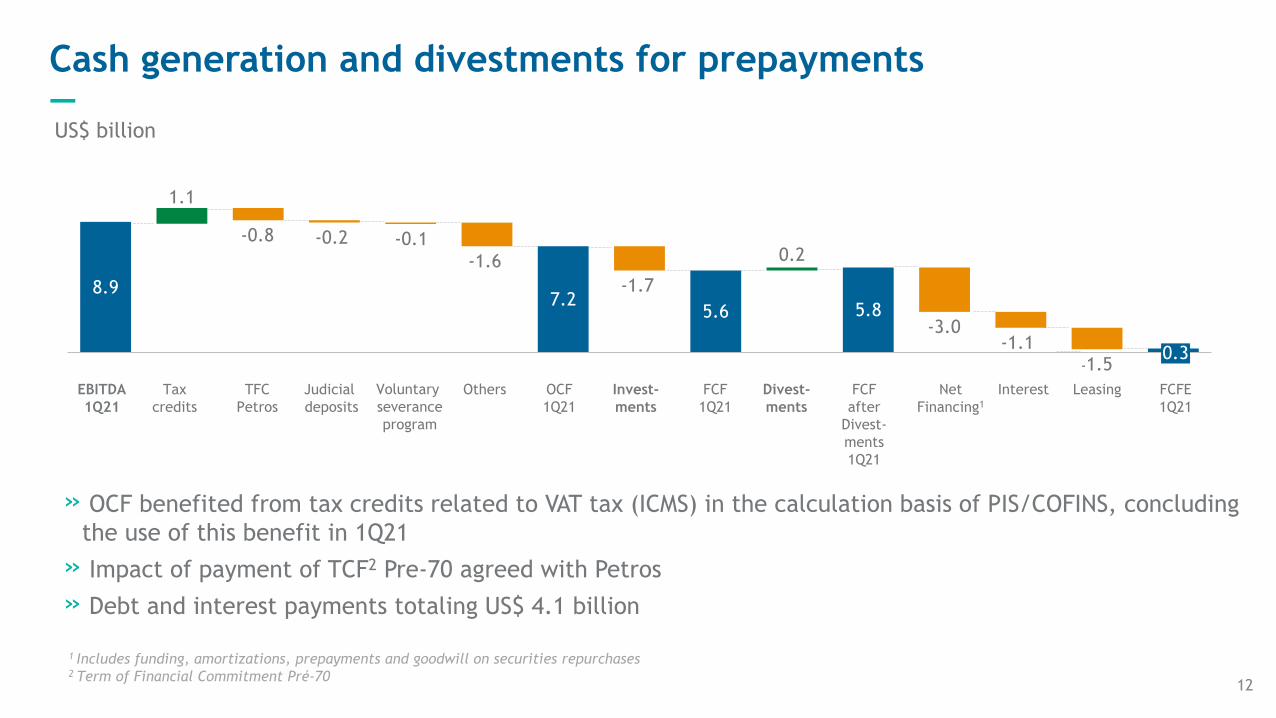
Cash generation and divestments for prepayments—
12
US$ billion
FCF
1Q21
Divest-
ments
-1.6
FCF
after
Divest-
ments
1Q21
TFC
Petros
Tax
credits
EBITDA
1Q21
Interest
-0.1
LeasingOCF
1Q21
-1.5
FCFE
1Q21
Judicial
deposits
Invest-
ments
-0.2
OthersVoluntary
severance
program
Net
Financing1
0.3
-0.8
-1.7
-3.0-1.1
1 Includes funding, amortizations, prepayments and goodwill on securities repurchases2 Term of Financial Commitment Pré-70
» OCF benefited from tax credits related to VAT tax (ICMS) in the calculation basis of PIS/COFINS, concluding
the use of this benefit in 1Q21
» Impact of payment of TCF2 Pre-70 agreed with Petros
» Debt and interest payments totaling US$ 4.1 billion

Liability management and capital optimization—
13
Repurchase of bonds maturing
between 2024 and 2050 with a
principal amount of US$ 2.5 billion
Tax agreements to close contingencies
in the amount of R$ 1.5 billion with
64% of avoided cost, which will allow
the recovery of R$180 million in judicial
deposits
Maturity extension to 2026 of US$ 2.05
billion that is part of the Revolving Credit
Facility of US$ 3.25 billion maturing in 2024
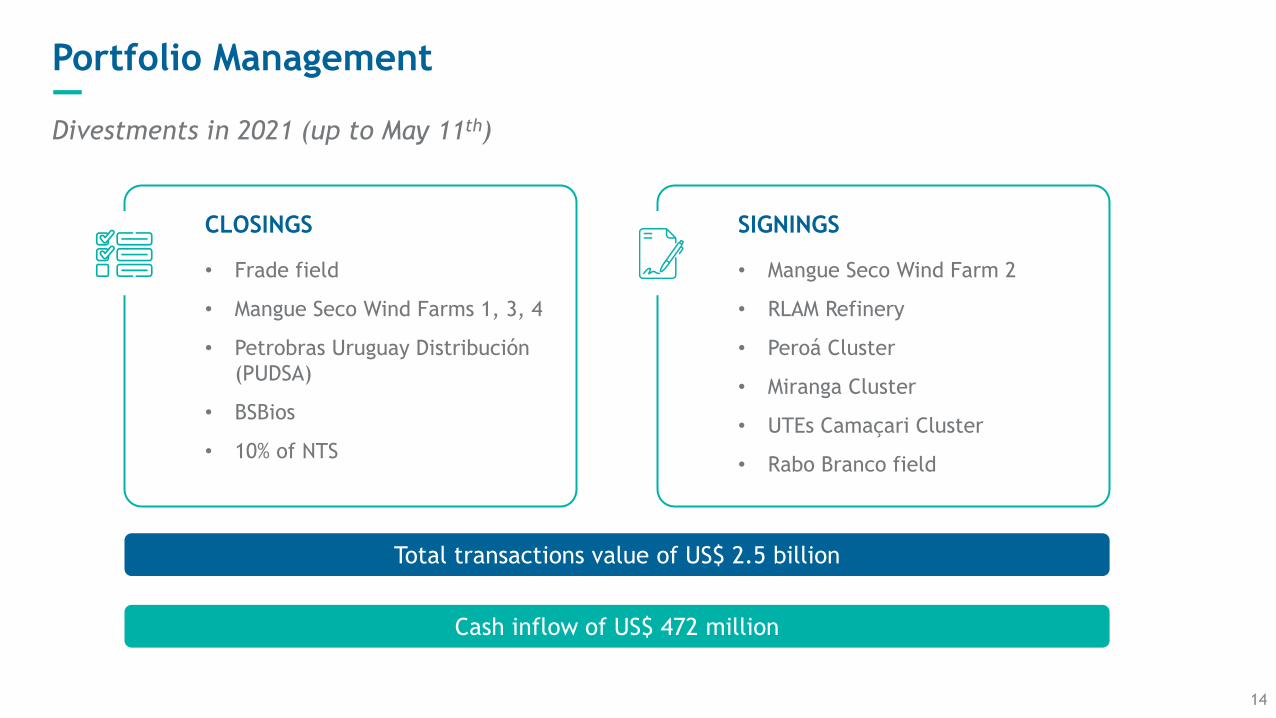
CLOSINGS
• Frade field
• Mangue Seco Wind Farms 1, 3, 4
• Petrobras Uruguay Distribución
(PUDSA)
• BSBios
• 10% of NTS
Portfolio Management—Divestments in 2021 (up to May 11th)
14
SIGNINGS
• Mangue Seco Wind Farm 2
• RLAM Refinery
• Peroá Cluster
• Miranga Cluster
• UTEs Camaçari Cluster
• Rabo Branco field
Cash inflow of US$ 472 million
Total transactions value of US$ 2.5 billion
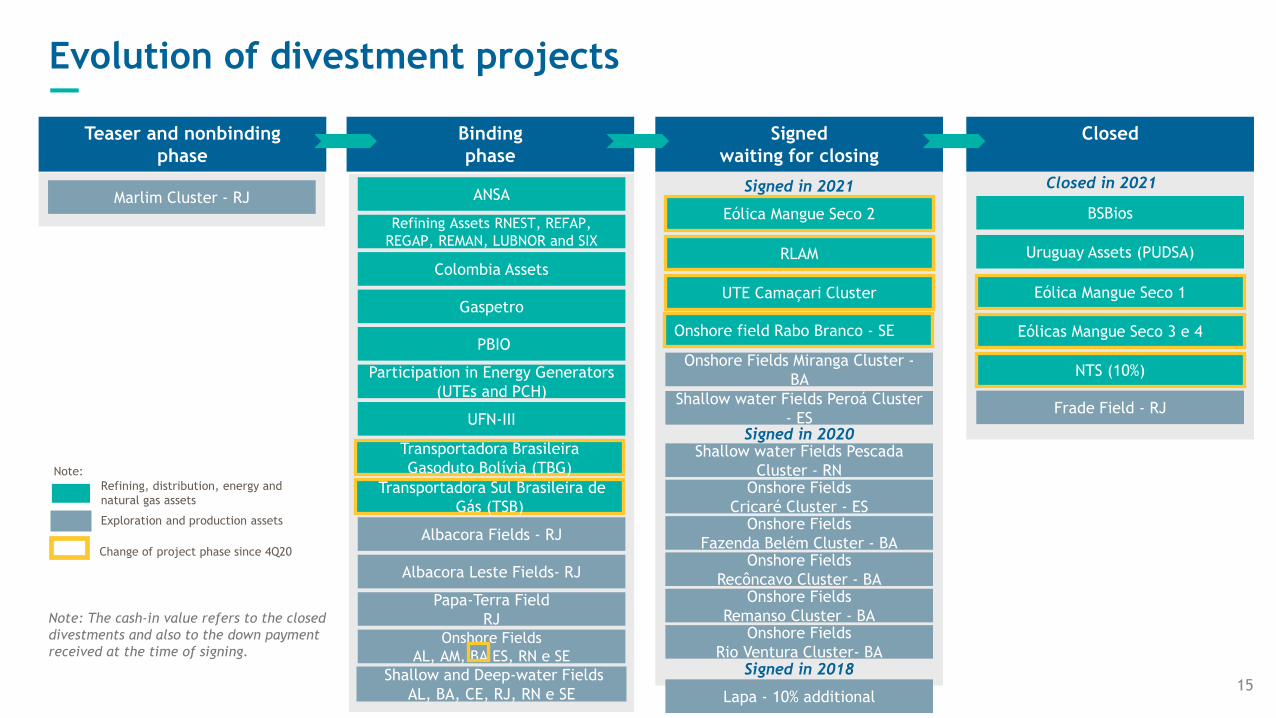
Evolution of divestment projects —
Closed Signed
waiting for closing
Lapa - 10% additional
Signed in 2020
Signed in 2018Shallow and Deep-water Fields
AL, BA, CE, RJ, RN e SE
Teaser and nonbinding
phase
Binding
phase
Uruguay Assets (PUDSA)
Note: The cash-in value refers to the closed
divestments and also to the down payment
received at the time of signing.
ANSA
Refining, distribution, energy and
natural gas assets
Exploration and production assets
Note:
Change of project phase since 4Q20
Gaspetro
NTS (10%)
Refining Assets RNEST, REFAP,
REGAP, REMAN, LUBNOR and SIX
Frade Field - RJ
Colombia Assets
Papa-Terra Field
RJ
Transportadora Brasileira
Gasoduto Bolívia (TBG)
Onshore Fields
AL, AM, BA ES, RN e SE
PBIO
Shallow water Fields Pescada
Cluster - RN
UFN-III
Albacora Fields - RJ
Participation in Energy Generators
(UTEs and PCH)
Onshore Fields
Cricaré Cluster - ES
Onshore Fields
Rio Ventura Cluster- BA
Onshore Fields
Fazenda Belém Cluster - BAOnshore Fields
Recôncavo Cluster - BAOnshore Fields
Remanso Cluster - BA
Shallow water Fields Peroá Cluster
- ES
Signed in 2021
Transportadora Sul Brasileira de
Gás (TSB)
Albacora Leste Fields- RJ
Marlim Cluster - RJClosed in 2021
BSBios
Onshore Fields Miranga Cluster -
BA
Eólica Mangue Seco 1
Eólica Mangue Seco 2
Eólicas Mangue Seco 3 e 4
RLAM
UTE Camaçari Cluster
Onshore field Rabo Branco - SE
15
16
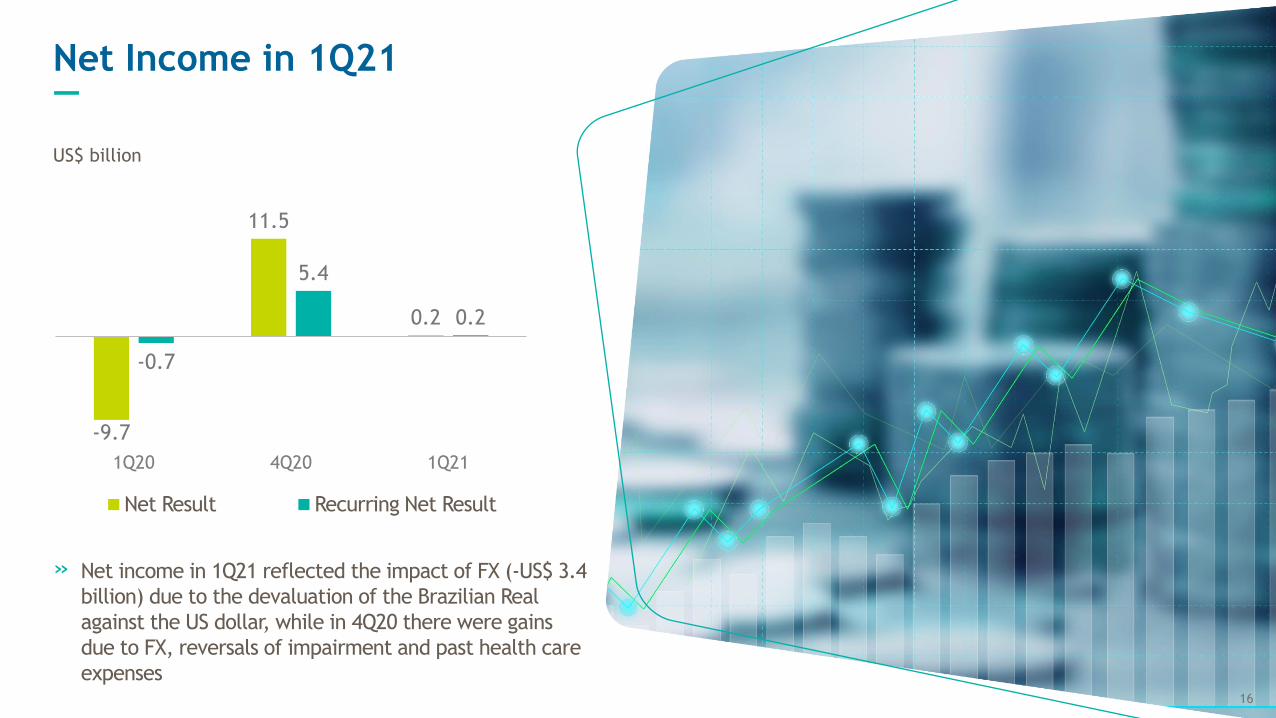
-9.7
11.5
0.2
-0.7
5.4
0.2
1Q20 4Q20 1Q21
Net Result Recurring Net Result
» Net income in 1Q21 reflected the impact of FX (-US$ 3.4
billion) due to the devaluation of the Brazilian Real
against the US dollar, while in 4Q20 there were gains
due to FX, reversals of impairment and past health care
expenses
US$ billion
Net Income in 1Q21—
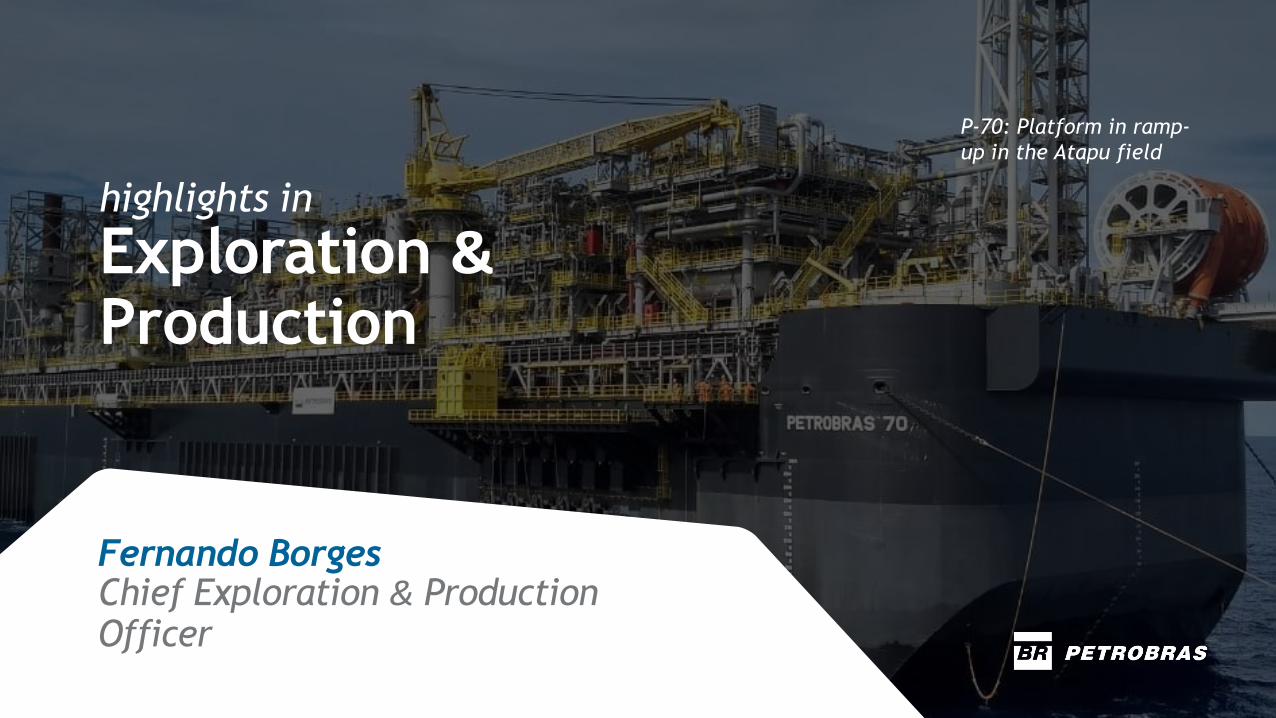
P-70: Platform in ramp-
up in the Atapu field
highlights in
Exploration &Production
Fernando BorgesChief Exploration & Production Officer

1.77 1.85
4Q20 1Q21
Pre-salt Productionmillion boed
2.38 2.45
4Q20 1Q21
Commercial Productionmillion boed
2.15 2.21
0.53 0.55
2.68 2.77
4Q20 1Q21
Oil Gas
Oil and Gas Productionmillion boed
+3.1% +2.8%+7.1%
Share on Total Production
66%69%
Increased production due to the ramp-up of P-70 and reduced downtime in the pre-salt layer—
18
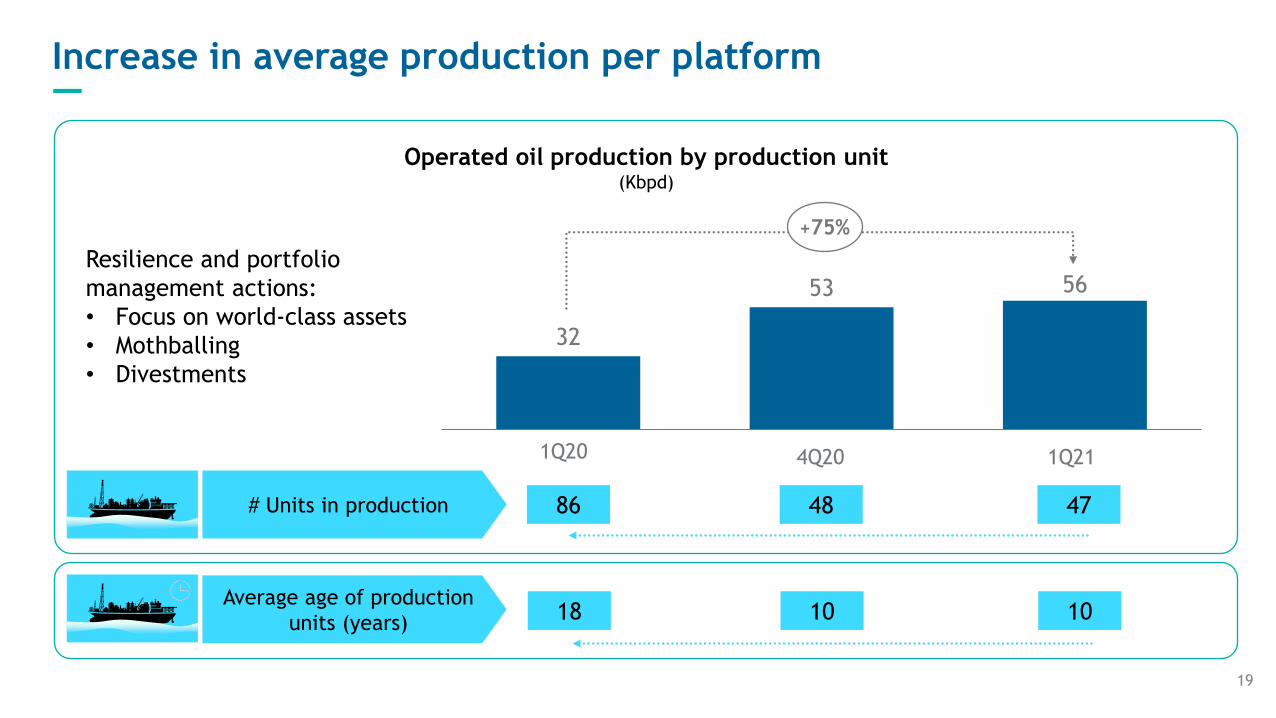
# Units in production
Average age of production
units (years)18 10 10
Operated oil production by production unit(Kbpd)
32
53 56
1T20 4T20 1T21
86 48 47
+75%
Resilience and portfolio
management actions:
• Focus on world-class assets
• Mothballing
• Divestments
Increase in average production per platform—
19
1Q20 4Q20 1Q21

13% reduction in the lifting cost—
1Q21 Oil
Production
%
5%
24%
71%
• This is a managerial metric that measures the cost of oil production, considering the level of spending throughout the production chain in the operating level.
Differences to the figures presented in the financial statements are due to the historical exchange rate of the asset construction, used to calculate this ratio.
+27%
6 5
7 11
12
1625
32
4Q20 1Q21
Lifting Cost Gov. Taxes DD&A
Total Cost of Oil Produced*US$/boe
» Reduction due to lower maintenance and
inspection expenses
2.7 2.7
11.2
9.4
12.3
12.4
5.64.9 Total
Deepwater
Onshore
and shallow
water
Pre-salt
4Q20 1Q21
Lifting Cost – Brazilper layer, US$/boe, without leasing cost
20

RJ
SantosBasin
Atapu
Sépia
We manifested interest to exercise the Preferential Rights in Atapu and Sépia, reinforcing our strategy of focusing on deep and ultradeep water
—
Field
Transfer
of Rights
stake
Production Sharing
stake
(new participant)
Net and Firm
Compensations
(100%)
Atapu 39.5% 60.5% US$ 3.25 bi
Sépia 31.3% 68.7% US$ 3.20 bi
Agreement with the Federal Government:
• Net and Firm Compensations
• Earn out
• Definition of the participation shares of the contracts
Preferential Rights:
• Acting as Operator
• Minimum share of 30%
• Signature Bonus: R$ 1.2 bi (Atapu) and R$ 2.1 bi
(Sépia), if our share is confirmed at 30%
21
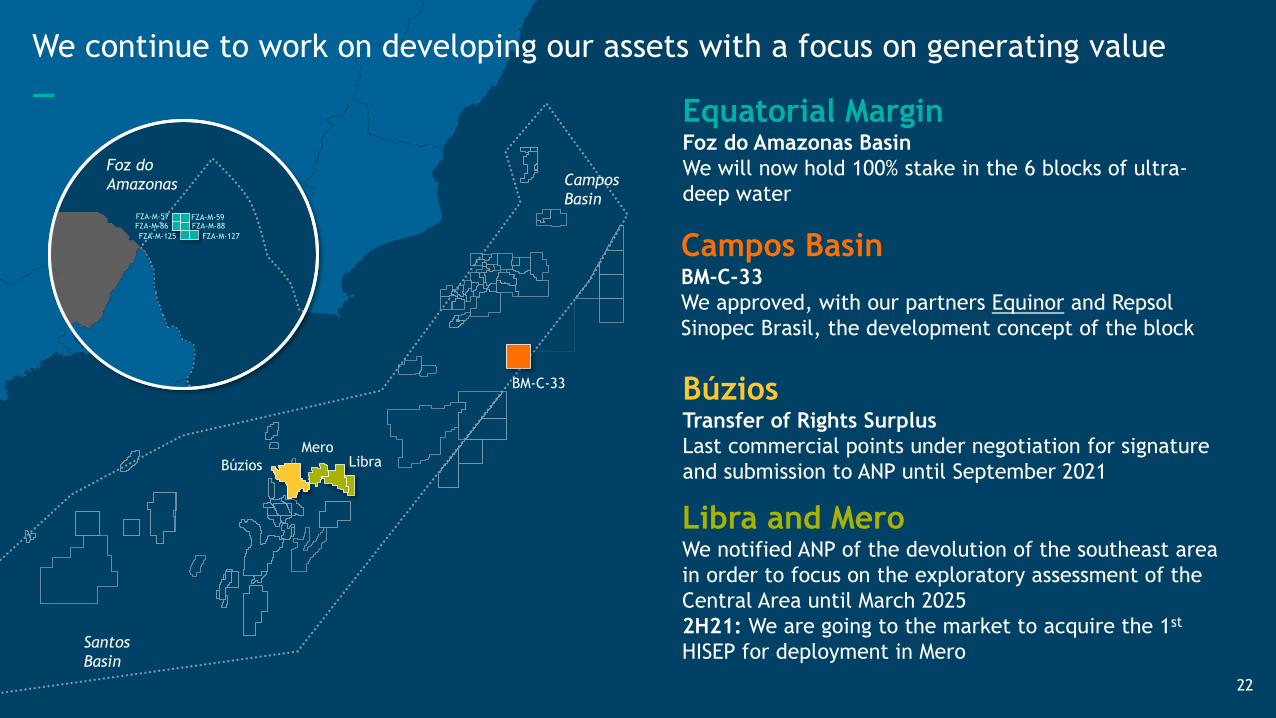
We continue to work on developing our assets with a focus on generating value
—
Campos
Basin
Santos
Basin
BM-C-33
Búzios
FZA-M-127FZA-M-125
FZA-M-88FZA-M-86FZA-M-57
Foz do
Amazonas
FZA-M-59
Libra
Campos BasinBM-C-33
We approved, with our partners Equinor and Repsol
Sinopec Brasil, the development concept of the block
Equatorial MarginFoz do Amazonas Basin
We will now hold 100% stake in the 6 blocks of ultra-
deep water
BúziosTransfer of Rights Surplus
Last commercial points under negotiation for signature
and submission to ANP until September 2021
Libra and Mero We notified ANP of the devolution of the southeast area
in order to focus on the exploratory assessment of the
Central Area until March 2025
2H21: We are going to the market to acquire the 1st
HISEP for deployment in Mero
Mero
22
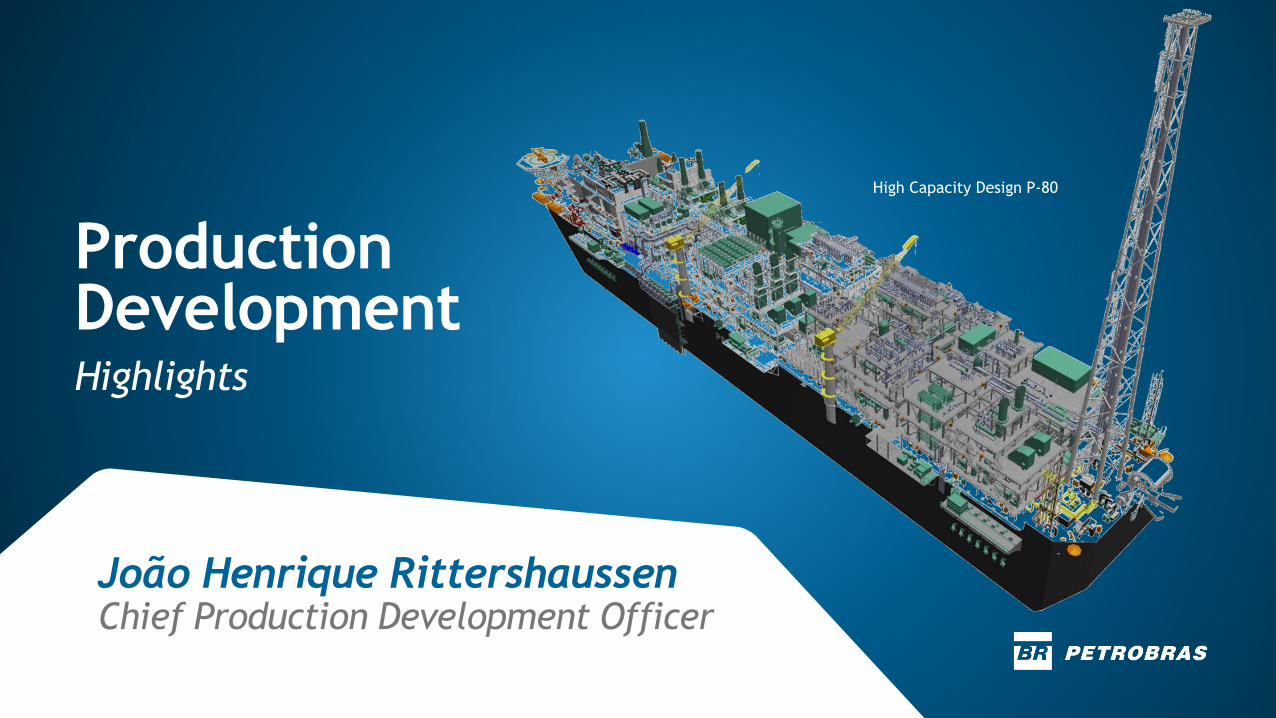
João Henrique RittershaussenChief Production Development Officer
Production DevelopmentHighlights
High Capacity Design P-80

RJ
SÉPIAFPSO
Carioca*180kbpd
24
2021 2022 2023 2024 2025
MERO 1FPSO
Guanabara*180kbpd
BÚZIOS 5FPSO Alm.
Barroso*150kbpd
ITAPÚP-71
150kbpd
MERO 2FPSO
Sepetiba*180kbpd
MARLIM 1FPSO
A. Garibaldi*80kbpd
MARLIM 2FPSO
Anna Nery*70kbpd
IPB*100kbpd
BÚZIOS 6ºFPSO Alm. Tamandaré*
225kbpd
MERO 3FPSO
Mal. Duquede Caxias*180kbpd
BÚZIOS 7º P-78
180kbpd
BÚZIOS 8ºP-79
180kbpd
MERO 4*180kbpd
Santos Basin
Campos Basin
Búzios
Mero
Sépia
Integrado
Parque das Baleias
Marlim
Itapu
Pre-salt under construction
Pos-salt under construction
Pre-salt under procurement
*Chartered unit
We began the procurement process of the ninth unit in Búzios, in addition to the 13 units scheduled to start the operation by 2025—
Start of procurement process of Búzios 9 (P-80)

Higher capacities
Learnings from the Transfer of
Rights and Replicant Projects
Companies with proven experience
and capability
Intensified use of digital technologies
180 kbpd
225 kbpd
Lessons
learned
Companies
pre-
qualified
Data-driven
Project
Typical image of Petrobras
Reference Design
Reference basic design and high-capacity design: new generation of platforms, more production and more innovation—
Higher operational efficiency
Problem anticipation in the construction and pre-operational phase
Emissions reduction
25

Marketing and Logistics Highlights
Cláudio MastellaChief Trading and Logistics Officer

Sales of oil products in Brazil and exports—
27
SALES VOLUME IN BRAZIL
kbpd
EXPORTS
kbpd
429 342 311
220 232 226
330 386 342
610 754732
4156
1,630
4Q201Q20
51
1Q21
1,7651,667
DIESEL FOLPGGASOLINE OTHERS
» April/21 already shows recovery, with diesel
sales of 824 kbpd and record sales of S-10
Diesel reaching 437 kbpd
806618 511
225
234226
1,031
1Q20
737
1Q214Q20
852
OIL PRODUCTS OIL
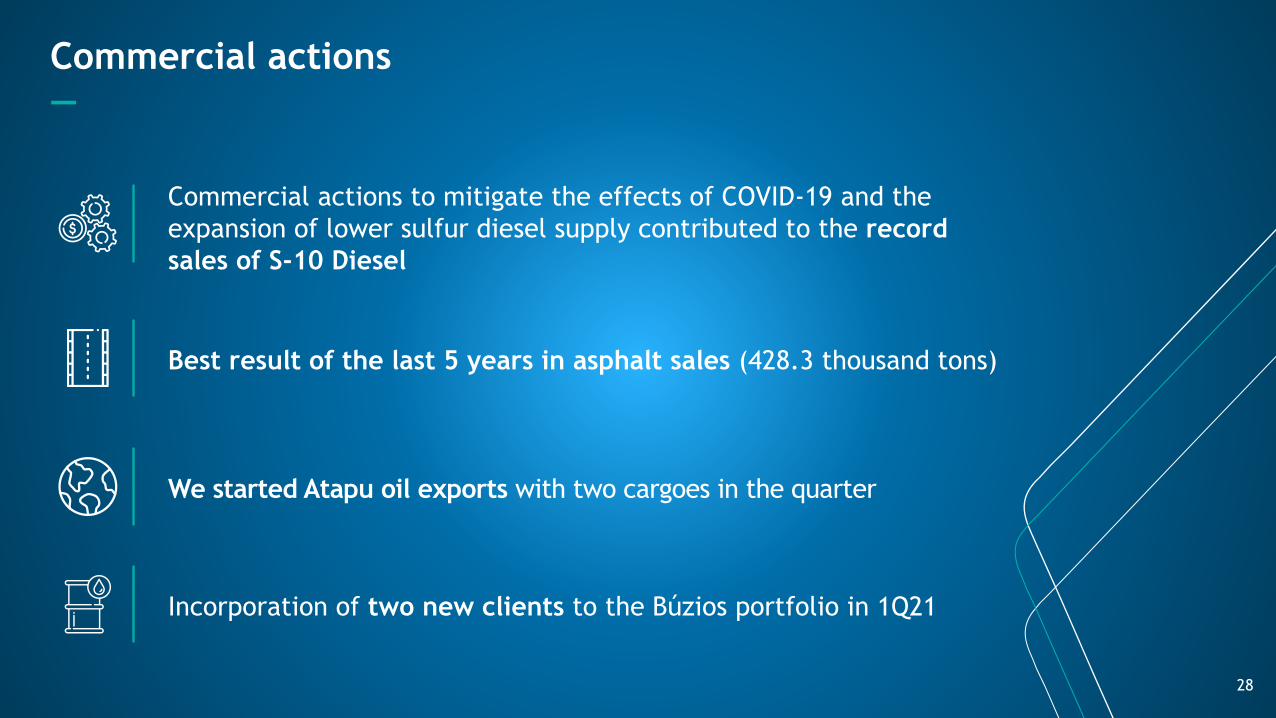
Commercial actions
—
28
Commercial actions to mitigate the effects of COVID-19 and the
expansion of lower sulfur diesel supply contributed to the record
sales of S-10 Diesel
We started Atapu oil exports with two cargoes in the quarter
Incorporation of two new clients to the Búzios portfolio in 1Q21
Best result of the last 5 years in asphalt sales (428.3 thousand tons)
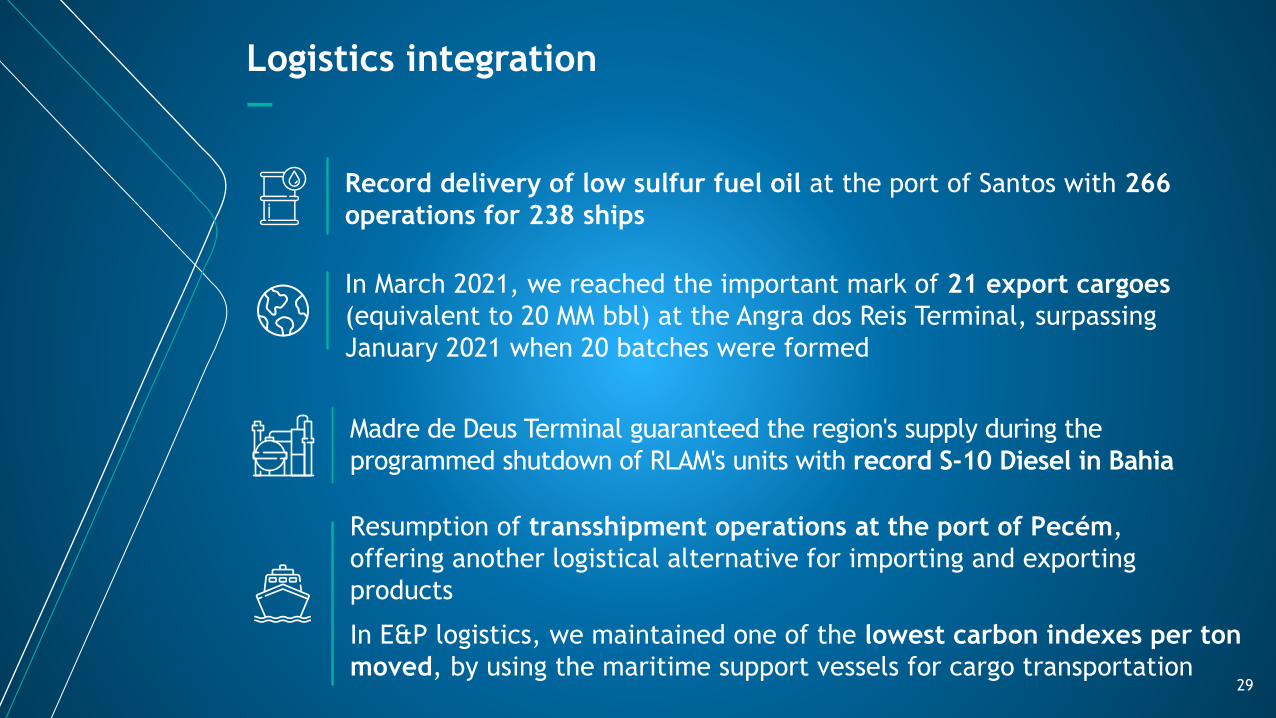
Logistics integration
—
In March 2021, we reached the important mark of 21 export cargoes
(equivalent to 20 MM bbl) at the Angra dos Reis Terminal, surpassing
January 2021 when 20 batches were formed
Record delivery of low sulfur fuel oil at the port of Santos with 266
operations for 238 ships
Madre de Deus Terminal guaranteed the region's supply during the
programmed shutdown of RLAM's units with record S-10 Diesel in Bahia
In E&P logistics, we maintained one of the lowest carbon indexes per ton
moved, by using the maritime support vessels for cargo transportation29
Resumption of transshipment operations at the port of Pecém,
offering another logistical alternative for importing and exporting
products

Greater market competitiveness with margin captured
by Petrobras
In March/21, we launched a new model for commercialization of
green petroleum coke, increasing from 2 to 11 sales contracts in
Brazil with:
Expansion of direct sales to large consumers
Selection of regional business partners for
commercialization
Customer portfolio diversification also happens through exports,
where we focus on selling anode grade, a product recognized for
its high-quality and differentiated price
Value capture with the new coke marketing model—
30
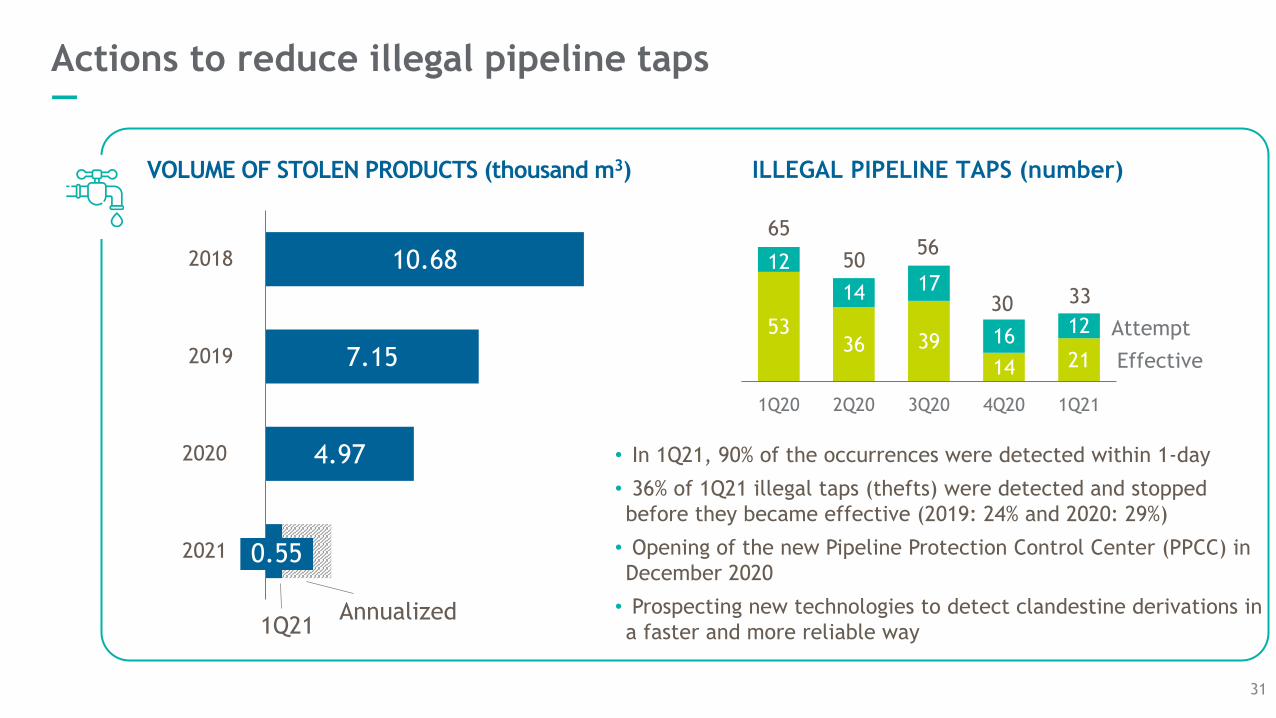
Actions to reduce illegal pipeline taps —
VOLUME OF STOLEN PRODUCTS (thousand m3) ILLEGAL PIPELINE TAPS (number)
10.68
7.15
4.97
2018
2019
2020
2021 0.55
Annualized1Q21
5336 39
14 21
12
14 17
1612
1Q20 2Q20 3Q20 4Q20 1Q21
33
Attempt
50
30
6556
Effective
• In 1Q21, 90% of the occurrences were detected within 1-day
• 36% of 1Q21 illegal taps (thefts) were detected and stopped
before they became effective (2019: 24% and 2020: 29%)
• Opening of the new Pipeline Protection Control Center (PPCC) in
December 2020
• Prospecting new technologies to detect clandestine derivations in
a faster and more reliable way
31

Refining and Natural GasHighlights
Rodrigo Costa Lima e SilvaChief Refining and Natural Gas Officer
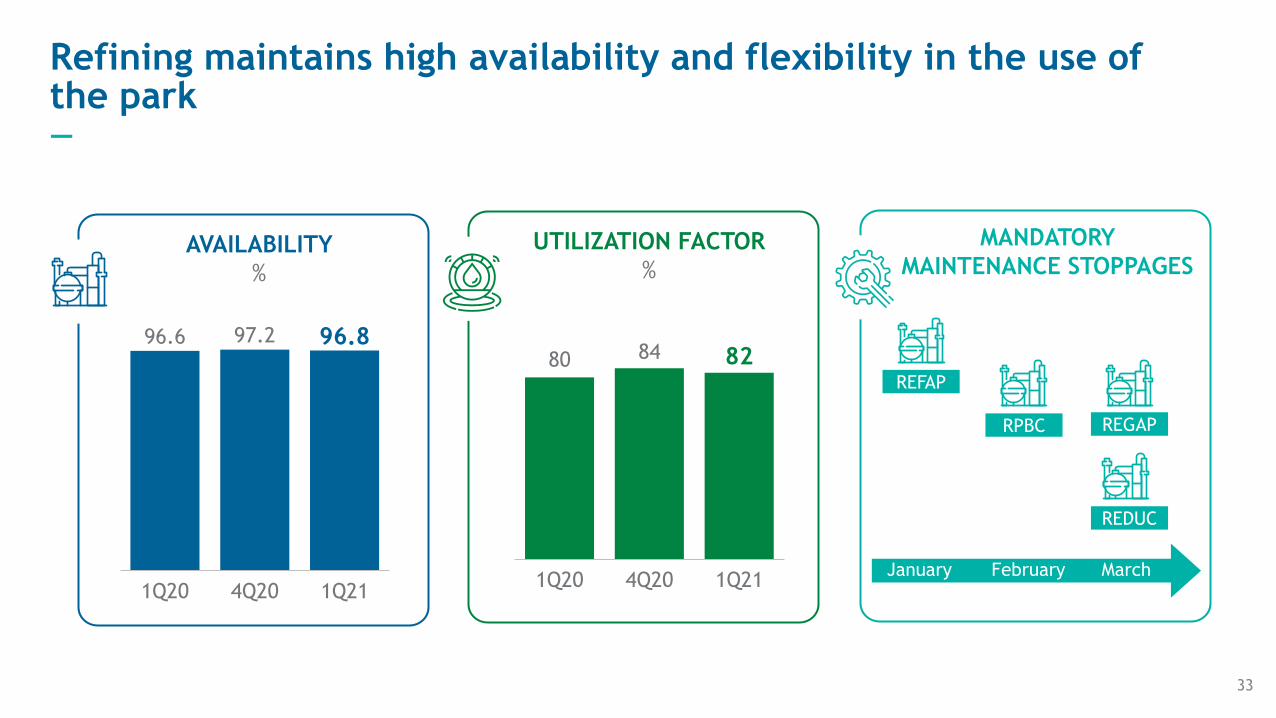
AVAILABILITY
%
UTILIZATION FACTOR
%
80 84 82
4Q201Q20 1Q21
96.6 97.2 96.8
1Q20 1Q214Q20January February March
REFAP
REDUC
REGAPRPBC
33
Refining maintains high availability and flexibility in the use of the park—
MANDATORY
MAINTENANCE STOPPAGES

Recorde OC BTE na RPBC e RNEST /
Recorde Bunker BTE na REPLAN e na
REGAP em mar/21
OIL PRODUCTS PRODUCTION
kbpd
DIESEL
kbpd
LSC FUEL OIL AND BUNKER
kbpd
391 340 325
295 299 284
360 388 378
666 752 717
Gasoline
1Q21
124
1Q20
Diesel
119FUEL OIL
4Q20
118LPG
Others
1,836 1,898 1,821
328 343 312
295368 352
4Q20
43
1Q20
41 53
S-500Diesel
1Q21
S-10Diesel
MaritimeDiesel
666752 717
48 62 64
148 135 139
99 102 81
4Q20
Others
1Q20 1Q21
LSCBunker
299
LSC Fuel Oil for export
295 284
S-10 record in REFAP
and REVAP in Mar/21
Focus on products with higher added value—
34
LSC: Low sulfur content

More cost-effective refining—
4Q20
1.31.6
1Q20 1Q21
1.4
R$/bbl
R$ billion
US$/bbl
-10%
35
9.877.80 8.82
2.261.47 1.61
REFINING OPERATIONAL COST

NATURAL GAS DEMAND
million m3/day
Natural gas market at high levels in 1Q21—
14 13 13
36 37 37
2332 30
73
4Q201Q20 1Q21
84 81
Thermal
NATURAL GAS SUPPLY
million m3/day
N-Thermal
Refining
47 41 43
2021 20
7 22 19
4Q201Q20
84
1Q21
73
81
LNG
Bolivia
E&P
36

1st quarter 2021 Performance—www.petrobras.com.br/ir