fcx conference call 1st quarter 2021 results
TRANSCRIPT

Click to edit Master title style
fcx.com
FCX Conference Call
1st Quarter 2021 ResultsApril 22, 2021

Click to edit Master title styleCautionary StatementRegarding Forward-Looking Statements
This presentation contains forward-looking statements in which FCX discusses its potential future performance. Forward-looking statements are all statements other than statements of historical
facts, such as plans, projections, or expectations relating to ore grades and milling rates; business outlook; production and sales volumes; unit net cash costs; cash flows; capital expenditures; liquidity;
operating costs; operating plans; FCX's financial policy; FCX's expectations regarding PT-FI's ramp-up of underground mining activities and future cash flows through 2022; PT-FI's development,
financing, construction and completion of a greenfield smelter in Indonesia and possible expansion of the smelter at PT Smelting; FCX’s commitments to deliver responsibly produced copper, including
plans to implement and validate all of its operating sites under specific frameworks; improvements in operating procedures and technology; exploration efforts and results; development and production
activities, rates and costs; tax rates; export quotas and duties; the impact of copper, gold and molybdenum price changes; the impact of deferred intercompany profits on earnings; mineralization and
reserve estimates; execution of the settlement agreements associated with the Louisiana coastal erosion cases and talc-related litigation; and future dividend payments, share purchases and sales.
The words “anticipates,” “may,” “can,” “plans,” “believes,” “estimates,” “expects,” “projects,” "targets," “intends,” “likely,” “will,” “should,” “could,” “to be,” ”potential," “assumptions,” “guidance,” “future”
and any similar expressions are intended to identify those assertions as forward-looking statements. The declaration of future dividends is at the discretion of the Board of Directors (Board) and will
depend on FCX's financial results, cash requirements, future prospects, global economic conditions, and other factors deemed relevant by the Board.
FCX cautions readers that forward-looking statements are not guarantees of future performance and actual results may differ materially from those anticipated, expected, projected or assumed in
the forward-looking statements. Important factors that can cause FCX's actual results to differ materially from those anticipated in the forward-looking statements include, but are not limited to, changes
in the credit ratings of FCX; changes in FCX's cash requirements, financial position, financing plans or investment plans; changes in general market, economic, tax, regulatory or industry conditions; the
duration and scope of and uncertainties associated with the COVID-19 pandemic, and the impact thereof on commodity prices, FCX’s business and the global economy and any related actions taken
by governments and businesses; FCX’s ability to contain and mitigate the risk of spread or major outbreak of COVID-19 at its operating sites, including at PT-FI’s remote operating site in Papua; supply
of and demand for, and prices of, copper, gold and molybdenum; mine sequencing; changes in mine plans or operational modifications, delays, deferrals or cancellations; production rates; timing of
shipments; results of feasibility studies; potential inventory adjustments; potential impairment of long-lived mining assets; the potential effects of violence in Indonesia generally and in the province of
Papua; the Indonesia government's extension of PT-FI's export license after March 15, 2022; risks associated with underground mining; satisfaction of requirements in accordance with PT-FI's special
mining license to extend mining rights from 2031 through 2041; the Indonesia government's approval of a deferred schedule for completion of the greenfield smelter in Indonesia; expected results from
improvements in operating procedures and technology, including innovation initiatives; industry risks; regulatory changes; political and social risks; labor relations, including labor-related work
stoppages; weather- and climate-related risks; environmental risks; litigation results; cybersecurity incidents; changes in general market, economic and industry conditions; financial condition of FCX’s
customers, suppliers, vendors, partners and affiliates, particularly during weak economic conditions and extended periods of volatile commodity prices; reductions in liquidity and access to capital;
FCX’s ability to comply with its responsible production commitments under specific frameworks and any changes to such frameworks; and other factors described in more detail under the heading “Risk
Factors” in FCX's Annual Report on Form 10-K for the year ended December 31, 2020, filed with the U.S. Securities and Exchange Commission (SEC).
Investors are cautioned that many of the assumptions upon which FCX's forward-looking statements are based are likely to change after the date the forward-looking statements are made,
including for example commodity prices, which FCX cannot control, and production volumes and costs, some aspects of which FCX may not be able to control. Further, FCX may make changes to its
business plans that could affect its results. FCX cautions investors that it undertakes no obligation to update any forward-looking statements, which speak only as of the date made, notwithstanding any
changes in its assumptions, changes in business plans, actual experience or other changes.
This presentation also includes forward-looking statements regarding mineralized material not included in proven and probable mineral reserves. Mineralized material is a mineralized body that
has been delineated by appropriately spaced drilling and/or underground sampling to support the estimated tonnage and average metal grades. Such a deposit cannot qualify as recoverable proven
and probable reserves until legal and economic feasibility are confirmed based upon a comprehensive evaluation of development costs, unit costs, grades, recoveries and other material factors.
Significant additional drilling is required and no assurance can be given that the potential quantities of metal will be produced. Accordingly, no assurances can be given that estimated mineralized
material not included in reserves will become proven and probable mineral reserves.
This presentation also contains certain financial measures such as unit net cash costs per pound of copper, net debt and adjusted EBITDA (earnings before interest, taxes, depreciation and
amortization), which are not recognized under U.S. generally accepted accounting principles. As required by SEC Regulation G, FCX's calculation and reconciliation of unit net cash costs per pound of
copper to amounts reported in FCX's consolidated financial statements is in the supplemental schedules of FCX’s 1Q21 press release, which is available on FCX's website, "fcx.com.” Net debt equals
consolidated debt less consolidated cash. A reconciliation of adjusted EBITDA to amounts reported in FCX’s consolidated financial statements is included on slide 36.
2

33
Our 2020 Sustainability Report
marks Freeport’s 20th year of
reporting on its sustainability
progress and Freeport’s first year
reporting in alignment with the
Sustainability Accounting Standards
Board (SASB) Metals & Mining
Framework.
Our 2020 Annual Report highlights the
momentum Freeport achieved through
resiliency, strong operating performance and
project execution during 2020 to establish a
solid foundation for future growth.
2020 Annual Reports
NOTE: To date, six Freeport sites have been awarded the Copper Mark: Morenci, Cerro Verde, El Abra, Atlantic Copper,
the Miami smelter and mine, and the El Paso refinery.

Click to edit Master title style
4
1Q21 Highlights
Solid execution of operating plans
Production volumes and costs in line with targets
Ramp-up of Grasberg underground mines advancing on schedule
Favorable operational and market outlook
Strong financial results and cash flow generation
Adopted a performance-based payout framework for increasing cash returns to shareholders
Addition of two new independent directors to FCX Board
Operating
Cash
Flow CAPEX
$0.4 (2)
$1.1 (1)
$6.1
$5.2
Cash Flows Net Debt (3)
1Q21 YE 2020 1Q21
($ bns)
1Q20
$8.5
(1) Includes working capital uses of $0.3 bn
(2) Includes $0.3 bn for major projects.
(3) Net debt equals consolidated debt less consolidated cash.
See Cautionary Statement.
Advancing organic growth opportunities
Key Stats Actual
Copper Sales (mm lbs) 825
Copper Realization ($/lb) $3.94
Gold Sales (k ozs) 258
Unit Net Cash Costs ($/lb) $1.39

Click to edit Master title styleCopper – Metal of the FutureCritical to Global Decarbonization
5
Electric vehicles use
up to four times more
copper than internal
combustion engines. (1)
Renewable energy
technologies use four to
five times more copper
than fossil fuel power
generation. (1)
Copper consumption
associated with electric
vehicles and renewable
energy technologies is
expected to grow rapidly
over the next several years.
More than 70% of the
world’s copper is used
in applications that
deliver electricity. (1)
See Cautionary Statement.
(1) International Copper Association
Freeport is strategically positioned as a leading copper producer
Intensity of Use is Increasing with Decarbonization
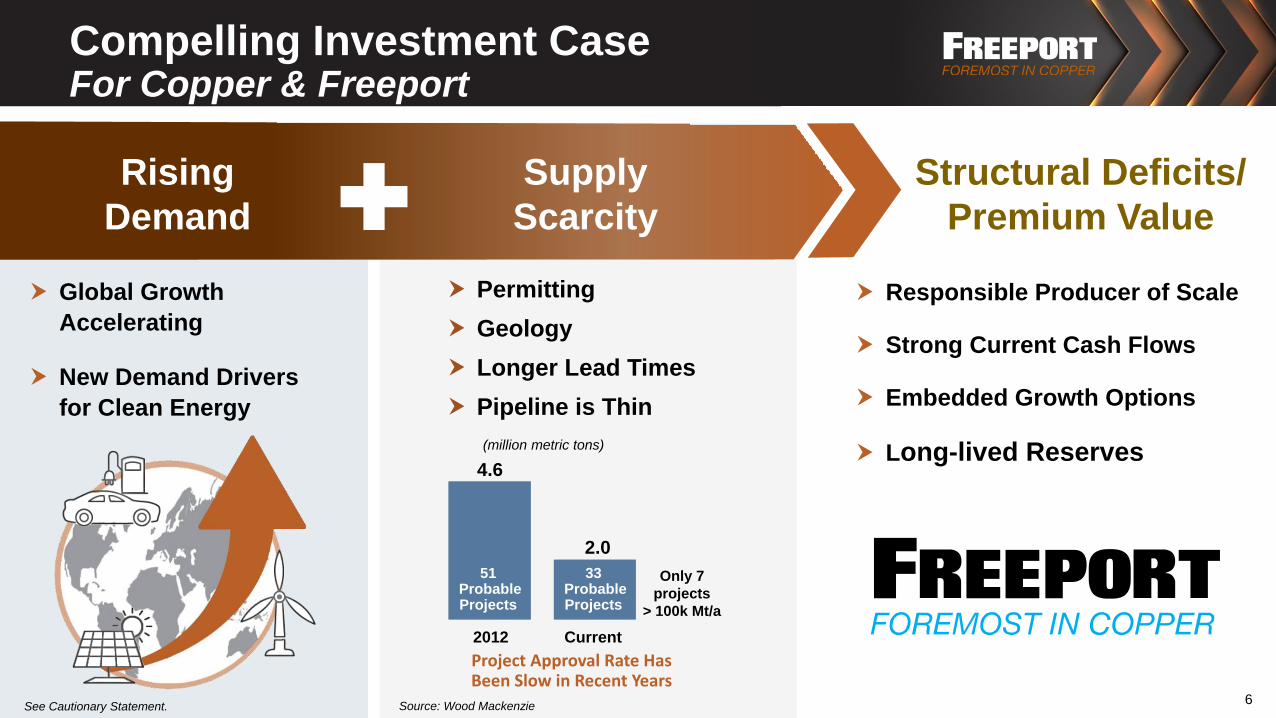
Click to edit Master title styleCompelling Investment CaseFor Copper & Freeport
Responsible Producer of Scale
Strong Current Cash Flows
Embedded Growth Options
Long-lived Reserves
Structural Deficits/
Premium Value
6
Permitting
Geology
Longer Lead Times
Pipeline is Thin
4.6
2.0
Project Approval Rate Has Been Slow in Recent Years
Only 7
projects
> 100k Mt/a
2012 Current
Rising
Demand
Supply
Scarcity
33Probable Projects
51ProbableProjects
Global Growth
Accelerating
New Demand Drivers
for Clean Energy
(million metric tons)
See Cautionary Statement. Source: Wood Mackenzie

Click to edit Master title styleGrowing Margins & Cash Flow
2022e/2023e Avg
($ in billions)Annual EBITDA Estimates (1)
(1) Based on April 2021e sales estimates. 2021e EBITDA approximates $9.8 bn assuming $4.00/lb Cu and$1,750/oz Au for 2Q21e - 4Q21e.
Note: EBITDA equals operating income plus depreciation, depletion and amortization.
e = estimate. See Cautionary Statement
Assuming
$1,750/oz Gold and
$11/lb Molybdenum
$4.00/lb Cu $5.00/lb Cu
Volume Growth
Attractive Cost Structure
Expanding Margins
Laser Focused on Execution
Additional Embedded Growth Options
in Portfolio
7
2021e v. 2020 2022e v 2021e
Copper ~20% ~15%
Gold ~55% ~20%
~$12.5
~$17

Click to edit Master title styleFinancial Policy
8
Policy aligned with strategic objectives of maintaining a strong balance
sheet, increasing cash returns to shareholders and advancing opportunities
for future growth
In February 2021, Board reinstated annual base dividend of $0.30/share* per
annum; first quarterly base dividend to be paid in May
Also adopted a Performance-Based Payout Policy
After net debt target of $3 bn - $4 bn is achieved (excluding smelter CAPEX),
up to 50% of Free Cash Flow for shareholder returns
➢ Determine at least annually taking into account market conditions, operational/financial
outlook, future investments, etc.
Maintain flexibility for debt reduction, future investments
* FCX’s previous cash dividend on its common stock was $0.20/share per annum, which was suspended in March 2020 in connection with its comprehensive response to the COVID-19 pandemic.
Organic
Growth
Balance
Sheet Strength
Up to 50% for
Cash Returns to
Shareholders
See Cautionary Statement
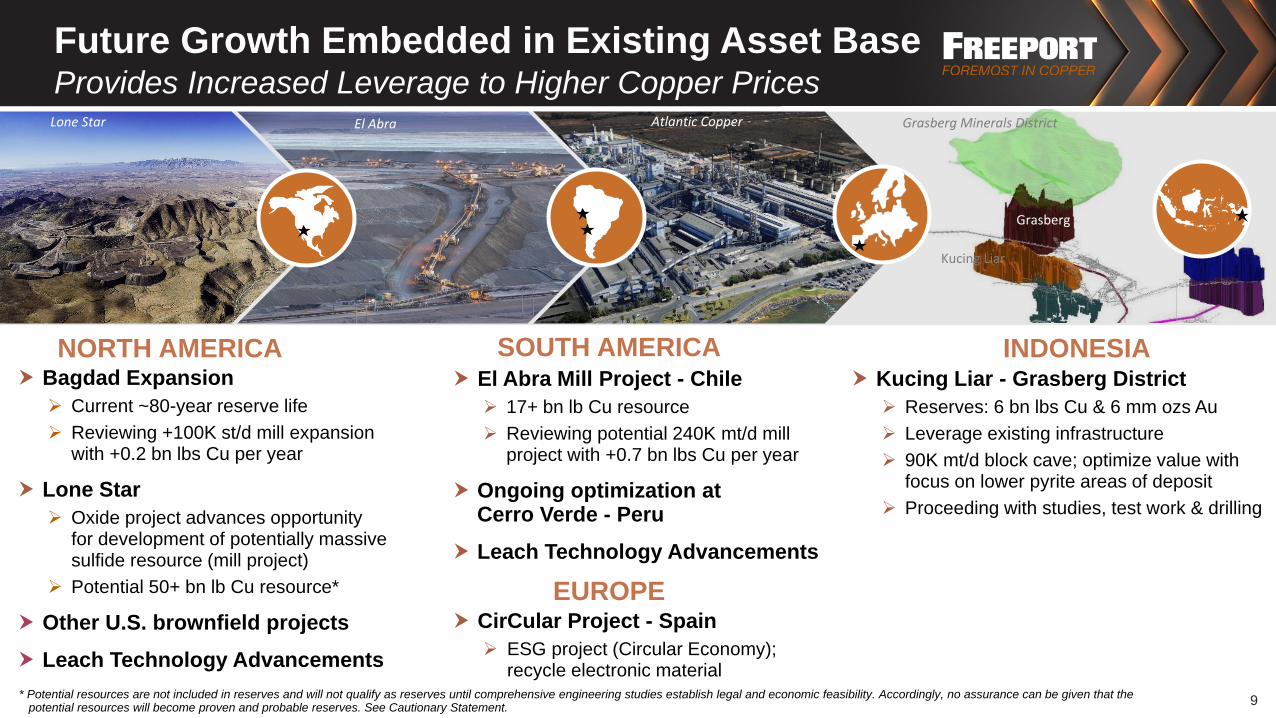
Click to edit Master title styleFuture Growth Embedded in Existing Asset Base Provides Increased Leverage to Higher Copper Prices
Bagdad Expansion
➢ Current ~80-year reserve life
➢ Reviewing +100K st/d mill expansion with +0.2 bn lbs Cu per year
Lone Star
➢ Oxide project advances opportunity for development of potentially massive sulfide resource (mill project)
➢ Potential 50+ bn lb Cu resource*
Other U.S. brownfield projects
Leach Technology Advancements
El Abra Mill Project - Chile
➢ 17+ bn lb Cu resource
➢ Reviewing potential 240K mt/d mill project with +0.7 bn lbs Cu per year
Ongoing optimization atCerro Verde - Peru
Leach Technology Advancements
CirCular Project - Spain
➢ ESG project (Circular Economy); recycle electronic material
Kucing Liar - Grasberg District
➢ Reserves: 6 bn lbs Cu & 6 mm ozs Au
➢ Leverage existing infrastructure
➢ 90K mt/d block cave; optimize value with focus on lower pyrite areas of deposit
➢ Proceeding with studies, test work & drilling
9
NORTH AMERICA INDONESIASOUTH AMERICA
EUROPE
* Potential resources are not included in reserves and will not qualify as reserves until comprehensive engineering studies establish legal and economic feasibility. Accordingly, no assurance can be given that thepotential resources will become proven and probable reserves. See Cautionary Statement.
Lone Star El Abra Atlantic Copper
Kucing Liar
Grasberg Minerals District
Grasberg

Click to edit Master title style
Indonesia
29%
North America
42%
Long-Lived Reserve Base30+ Year Implied Reserve Life for Copper, Excluding Mineralized Material
Copper (bn lbs) 113 120
Gold (mm ozs) 29 58
Molybdenum (bn lbs) 3.7 3.6
Reserves (1)
(recoverable)
Mineralized Material (2)
(contained)
(2) Estimate of consolidated mineralized material (contained copper) using a long-term average copper price of $3.00/lb, gold price of $1,200/oz and molybdenum price of $12/lb. Mineralized material is not included in reserves and will not qualify as reserves until comprehensive engineering studies establish legal and economic feasibility. Accordingly, no assurance can be given that the estimated mineralized material will become proven and probable reserves.
(1) Estimate of recoverable proven and probable consolidated reserves using long-term average prices of $2.50/lb for copper,
$1,200/oz for gold and $10/lb for molybdenum; FCX’s net equity interest of copper reserves totaled 82 bn lbs as of 12/31/2020.
ConsolidatedAs of 12/31/2020
South
America
29%
Copper Reserves (1)By Region
10
See Cautionary Statement.

11
Global Industry LeaderOne of the world’s largest publicly traded
copper producers; Seasoned and value-
driven global team; 30+ year reserve life
with substantial additional resources
Trusted OperatorStrong reputation and franchise in
4 countries; Synergistic operation
of all assets
World-Class DeveloperIndustry leading track record for major
project execution in complex
jurisdictions
Block Cave LeaderIndustry leading technical capabilities;
Decades of block caving experience
Responsible ProducerLong-standing commitment to all of our
stakeholders including our employees,
communities, host countries, customers
and suppliers
“Charging Ahead”Responsibly. Reliably. Relentlessly.
11See Cautionary Statement.

12
“Charging Ahead” As One Freeport
TEAM
12

Click to edit Master title style
Financial Review & Outlook

Click to edit Master title style1Q 2021 Operations UpdateContinue to Focus on Strong Execution
Lone Star - Arizona
➢ Successfully completed initial development in 2H20
➢ Annual Cu production expected to approximate 200 mm lbs
➢ Advancing studies for potential incremental oxide expansions/long-term development options
Chino - New Mexico
➢ Restarted mining activities during 1Q21
Morenci - Arizona
➢ Increasing mining rates by 10%
Grasberg Underground
➢ Production was 40 mm lbs of Cu and 38k ozs of Au higher than sales because of shipping deferrals from 1Q21 to 2Q21e
➢ 1Q21 annualized metal sales reached 75% of post ramp-up targets; expected to approach 90% by mid-2021e
➢ 50 new drawbells added; over 420 cum.
➢ DMLZ/Grasberg Block CaveOperating Rates
1Q21 Avg: ~98k t/d; 16% above 4Q20 rates
Cerro Verde - Peru
➢ Mill avg: 390k mt/d (+17k mt/d higher than 4Q20)
➢ 2021e plan assumes 360k mt/d for remainder of 2021e
➢ Plan to return to pre-COVID-19 levels of ~400k mt/d in 2022
El Abra - Chile
➢ Implementing plans to increase operating rates during 2021e to pre-COVID-19 levels, subject to public health conditions in Chile
➢ Incremental copper production: 70 mm lbs per annum* beginning in 2022e
*~50% of increase is expected in 2021e with full rates to be achieved in 2022e14e = estimate. See Cautionary Statement.
SOUTH AMERICANORTH AMERICA INDONESIACu Sales: 308 mm lbs Cu Sales: 259 mm lbs Cu Sales: 258 mm lbs
Au Sales: 256 k ozs

Click to edit Master title styleIndonesian Smelter Update
PT-FI committed in 2018 IUPK to construct 2 mm tpy
in-country processing facility of Cu concentrate by
December 2023
➢ Project has been delayed by COVID-19
Advancing commercial and financial arrangements for
30% expansion of existing smelter (PT Smelting)
Consideration of alternative new smelter developed by
a third-party
➢ To date, commercial discussions have not resulted in a mutually acceptable agreement
PT-FI continuing plans for development of a greenfield
smelter and related refinery in East Java near
PT Smelting
Expect to finance smelter investments with debt at PT-FI
➢ Shared 51%/49% (PT Inalum/FCX)
PT Smelting
15e = estimate. See Cautionary Statement.
~$180
$88
~$200
~$98
Estimated Annual CostsAfter Tax Debt Service (1)
(2023e – 2041e)
Estimated Annual Savings(5% Export Duty) (2)
(1) Assumes debt service over life of project (2) Assumes prices of $4.00/lb copper and $1,700/oz gold
Annual Debt Service Cost Expected to be
Essentially Offset by Phase Out of Export Duty
($ in mms)
100%
FCX’s
Equity
Share 100%
FCX’s
Equity
Share

Click to edit Master title styleAnnual Sales ProfileApril 2021 Estimate
(1) Consolidated copper sales include 608 mm lbs in 2020, 740 mm lbs in 2021e, 860 mm lbs in 2022e and 1,460 mm lbs in 2023e for noncontrolling interests; excludes purchased copper.
(2) Consolidated gold sales include 158k ozs in 2020, 248k ozs in 2021e, 300k ozsin 2022e and 810k ozs in 2023e for noncontrolling interests.
e = estimate. See Cautionary Statement.
0
1
2
3
4
5
2020 2021e 2022e 2023e
3.2
3.85
4.4 4.4
0
1
2
2020 2021e 2022e 2023e
0.9
1.3
1.61.8
0
25
50
75
100
2020 2021e 2022e 2023e
8085
80 80
16
(million ozs)(billion lbs)Copper Sales(1) Gold Sales(2)
(million lbs)Molybdenum Sales

17
Reconciliation of 2021e Unit Net Cash Cost Guidance
January 2021
GuidancePrice Assumptions
$3.50 Cu / $1,850 Au / $9 Mo
April 2021
GuidancePrice Assumptions
$4.00 Cu / $1,750 Au / $11 Mo
Energy Freight Other*
Site Production & Delivery $1.78 +3¢ +1¢ +1¢ $1.83
Lower Gold Price Higher Moly Price
By-product Credits (0.81) +3¢ -2¢ (0.80)
Treatment Charges 0.16 No Change 0.16
Higher Copper Prices (+50¢)
Royalties & Duties 0.12 +2¢ 0.14
Higher Costs: +5¢
Net Unit Cash Costs 2021e $1.25 Lower By-product: +1¢ $1.33Higher Cu Price: +2¢
e = estimate. See Cautionary Statement.
Impact of
Updated Assumptions
* Higher mining rates/ profit sharing, net of higher volumes
($ and ¢ per pound of copper)

Click to edit Master title style
NOTE: EBITDA equals operating income plus depreciation, depletion and amortization. e = estimate. See Cautionary Statement.
(1) At $9/lb moly, the sensitivity would approximate $45 mm for EBITDA and $35 mm for operating cash flow.
(2) U.S. Dollar Exchange Rates: 725 Chilean peso, 14,400 Indonesian rupiah, $0.78 Australian dollar, $1.19 Euro, 3.69 Peruvian Nuevo Sol base case assumption. Each +10% equals a
10% strengthening of the U.S. dollar; a strengthening of the U.S. dollar against forecasted expenditures in these foreign currencies equates to a cost benefit of noted amounts.
$0
$5
$10
$15
$20
Cu $4.00/lb Cu $4.50/lb Cu $5.00/lb
Average’22e/’23e
$0
$3
$6
$9
$12
$15
Cu $4.00/lb Cu $4.50/lb Cu $5.00/lb
Average’22e/’23e
($ in bns except copper, gold and molybdenum prices)
Operating cash flow l Excludes working capital changes ($1,750/oz gold, $11/lb molybdenum)
EBITDA l ($1,750/oz gold, $11/lb molybdenum)
EBITDA and Cash Flow at Various Copper Prices
SensitivitiesAverage ’22e/’23e(US$ in mms)
EBITDA
Operating Cash Flow
Copper +/-$0.10/lb $330
Molybdenum +/-$1.00/lb $ 70 (1)
Gold +/-$50/oz $ 55
Currencies (2) +/-10% $140
Diesel +/-10% $ 40
Copper +/-$0.10/lb $435
Molybdenum +/-$1.00/lb $ 80 (1)
Gold +/-$50/oz $ 80
Currencies(2) +/-10% $200
Diesel +/-10% $ 55
18

Click to edit Master title style
2020 2021e 2022e
Consolidated Capital ExpendituresEstimates Excluding Potential Indonesian Smelter CAPEX (1)
MajorProjects
(1) See slide 15 regarding alternatives under consideration; smelter investments expected to be funded by PT-FI with debt financing.
(2) Net of scheduled contributions from PT Inalum for expansion capital spending that will be reflected in financing on the cash flow statement.
(3) Major projects include CAPEX associated with Grasberg underground development and supporting mill and power capital costs ($1.0 bn in 2020, $1.3 bn in 2021e,
and $0.9 bn in 2022e) and Lone Star ($0.2 bn in 2020).
NOTE: Amounts include capitalized interest.
e= estimate. See Cautionary Statement.
$1.2(3)
$2.0
$0.8
Other
$1.4(3)
$2.3
$0.9
Net of Scheduled
Contributions
$1.8(2)
($ in bns)
$2.1(2)
19
$2.0(2)
$2.2
$1.0(3)
$1.2
$

20
Strong Financial PerformanceDriven by Growing Volumes and Pricing
Copper Realizations ($/lb)
2Q20 3Q20 4Q20 1Q21
$1.5
$2.4
$3.7
$4.6
(US$ bns)
Consolidated Cash$
Financial Policy Provides Framework for Cash Returns to Shareholders, Investments & Balance Sheet Management
$ 2.55 $3.01 $3.40 $3.94
See Cautionary Statement.

21
World’s Premier Publicly Traded Copper Producer
Industry Leader with Size, Scale and Durability
Copper Supported by Positive
Long-Term Fundamentals
Strong Track Record and Commitment to Communities /
Environmental Responsibility
Growing Productionand Cash Flow Profile
Portfolio of High-Quality Copper / Gold Assets with Embedded Growth Options Difficult to Replicate
Technically ProficientProven Capabilities
Experienced Management Team

Click to edit Master title style
Reference Slides

Click to edit Master title style
23
Our COVID-19 Response
Providing monetary and
in-kind contributions of
medical supplies and food
in areas where we operate
Active and preventive
management, through
the implementation of
global health guidelines,
including testing,
screening and tracking
As a leading supplier
of copper to the global
economy, FCX
continues to meet the
needs of its customers
WE ARE IN THIS TOGETHER
Serving
Our Customers
Supporting
Our Communities
Prioritizing the Health & Well-Being of Our
Workforce

Click to edit Master title style
Focused on advancing responsibility in our value chains by:
1) managing risks in our own supply chain;
2) managing risks of our products and by-products in use; and
3) understanding life cycle impacts of our products along the value chain
Recently published a Responsible Sourcing of Minerals Policy and
inaugural OECD* Step 5 Due Diligence Report
FCX is committed to validating its Cu production sites against the
Copper Mark - 6 sites awarded to date, including Morenci in April 2021
Responsible Value ChainsDedicated to Delivering Responsibly Produced Copper to Markets Around the World
The Copper Mark is a new assurance framework
developed to demonstrate the copper industry’s
responsible production practices
24
The Copper Life Cycle
* The Organisation for Economic Co-operation and Development (OECD)
See Cautionary Statement.
NOTE: To date, six Freeport sites have been awarded the Copper Mark: Morenci, Cerro Verde, El Abra, Atlantic Copper,
the Miami smelter and mine, and the El Paso refinery.

Click to edit Master title style
25
Financial Highlights
CopperConsolidated Volumes (mm lbs) 825 729
Average Realization (per lb) $ 3.94 $ 2.43
Site Production & Delivery Costs (per lb) $ 1.86 $ 2.19
Unit Net Cash Costs (per lb) $ 1.39 $ 1.90
GoldConsolidated Volumes (000’s ozs) 258 144
Average Realization (per oz) $1,713 $1,606
MolybdenumConsolidated Volumes (mm lbs) 21 21
Average Realization (per lb) $11.62 $11.10
1Q21
(1) Includes working capital (uses) sources of $(0.3) bn for 1Q21 and $0.1 bn for 1Q20.
Revenues $ 4.9 $ 2.8
Net Income (Loss) Attributable to Common Stock $ 0.7 $ (0.5
Diluted Net Income (Loss) Per Share $ 0.48 $(0.34
Operating Cash Flows $ 1.1 $ (0.0
Capital Expenditures $ 0.4 $ 0.6
Total Debt $ 9.8 $ 10.1
Consolidated Cash $ 4.6 $ 1.6
(1)
(in billions, except per share amounts)
Sales Data
Financial Results
1Q20
)
)
)

Click to edit Master title style
26
1Q21 Mining Operating Summary
(1) Includes 5 mm lbs in 1Q21 and 4 mm lbs in 1Q20 from South America.
(2) Silver sales totaled 0.9 mm ozs in 1Q21 and 0.9 mm ozs in 1Q20.
(3) Silver sales totaled 1.2 mm ozs in 1Q21 and 0.6 mm ozs in 1Q20.
NOTE: For a reconciliation of unit net cash costs per pound to production and delivery costs applicable to sales reported in FCX’s consolidated financial statements, refer to “ProductRevenues and Production Costs” in the supplemental schedules of FCX’s 1Q21 press release, which is available on FCX’s website.
Cash Unit Costs
Site Production & Delivery $2.04 $2.01 $1.48 $1.86
By-product Credits (0.30) (0.21) (1.79) (0.74)
Treatment Charges 0.11 0.13 0.25 0.16
Royalties & Export Duties - 0.01 0.35 0.11
Unit Net Cash Costs $1.85 $1.94 $0.29 $1.39
North SouthAmerica America Indonesia Consolidated(per lb of Cu)1Q21 Unit Production Costs
North America
2121(1)(1)
Momm lbs
1Q21 1Q20
355308
1Q21 1Q20
Cumm lbs
Indonesia (3)
127
258
1Q21 1Q20
139
256
1Q21 1Q20
South America (2)
1Q21 1Q20
259 247
by Region
Au000 ozs
Sales From Mines for 1Q21 & 1Q20

Click to edit Master title style2021e Operational Data
27
(1)
(1) Includes molybdenum produced in South America.
(2) Includes gold produced in North America.
(3) Estimates assume average prices of $1,750/oz for gold and $11/lb for molybdenum for 2Q21e – 4Q21e. Quarterly unit costs will vary significantly with quarterly metal sales volumes.
(4) Production costs include profit sharing in South America and severance taxes in North America.
e = estimate. See Cautionary Statement.
(per lb of Cu)North South
America America Indonesia Consolidated
Site Production & Delivery, excl. adjs.(4) $2.09 $2.03 $1.40 $1.83
By-product Credits (0.27) (0.24) (1.81) (0.80)
Treatment Charges 0.10 0.14 0.24 0.16
Royalties & Export Duties - 0.01 0.38 0.14
Unit Net Cash Costs $1.92 $1.94 $0.21 $1.33
2021e Unit Net Cash Costs (3)
1,045
85
1,4651,340
1.3 (2)
North America IndonesiaSouth America
by Region2021e Sales
Momm lbs
Cumm lbs
Aumm ozs

Click to edit Master title style2021e Outlook
Copper: 3.85 billion lbs
Gold: 1.3 million ozs
Molybdenum: 85
million lbs
Sales
Outlook
Unit Net Cash
Cost of Copper
Operating
Cash Flows (2)
Capital
Expenditures
Site prod. & delivery
➢ 2021e: $1.83/lb
➢ 2Q21e: $1.90/lb
After by-product credits (1)
➢ 2021e: $1.33/lb
➢ 2Q21e: $1.42/lb
~$6.5 billion @
$4.00/lb copper for
2Q21e – 4Q21e
Each 10¢/lb change in
copper in 2Q21e –
4Q21e = $265 million
$2.3 billion (3)
(1) Assumes average prices of $1,750/oz gold and $11/lb molybdenum in 2Q21e – 4Q21e.
(2) Assumes average prices of $1,750/oz gold and $11/lb molybdenum in 2Q21e – 4Q21e; each $100/oz change in gold would have an
approximate $70 mm impact and each $2/lb change in molybdenum would have an approximate $90 mm impact.
(3) PT Inalum scheduled contributions in 2021e approximate $0.2 bn; excludes capital expenditures for greenfield smelter in Indonesia.
e = estimate. See Cautionary Statement.
28
➢ $1.4 billion for major
projects
➢ $0.9 billion for other mining

Click to edit Master title style2021e Quarterly Sales
0
200
400
600
800
1,000
1,200
1Q21 2Q21e 3Q21e 4Q21e
825
9751,005
1,045
Note: Consolidated gold sales include 48k ozs in 1Q21, 62k ozs
in 2Q21e, 67k ozs in 3Q21e and 71k ozs in 4Q21e for noncontrolling interests.
e = estimate. See Cautionary Statement.
Note: Consolidated copper sales include 170 mm lbs in 1Q21,
175 mm lbs in 2Q21e, 190 mm lbs in 3Q21e and 205 mm lbs in
4Q21e for noncontrolling interests; excludes purchased copper.
0
5
10
15
20
25
1Q21 2Q21e 3Q21e 4Q21e
21 21 21 22
0
100
200
300
400
500
1Q21 2Q21e 3Q21e 4Q21e
258
330 360 380
(million lbs)Copper Sales (thousand ozs)Gold Sales
(million lbs)Molybdenum Sales
29

Click to edit Master title style
30
Plan View
PB1S
N
PB2N
100 meters
PB1N
1
2
Plan View
N
100 meters
PB2N
PB1S
PB1N
PB3
CurrentCave
1
2
3PB2S
Grasberg - World Class Block Cave Design
9
31
74
103
127 129 130
Ramp-up Schedule(000’s t/d of Ore)
10
29
56
72 7277 80
5 Production Blocks,
3 Currently Active
3 Production Blocks,
2 Currently Active
▪ Continuation of Ore Mined in Open Pit (300 meters below)
▪ 874 mm t @ 1.08% Copper & 0.73 g/t Gold
▪ YE 2020 Reserves: 17 bn lbs Copper; 13 mm ozs Gold
▪ By 2023: 335,000 Sq Meter Footprint (over 80 acres)
▪ Life of Mine: 725,000 Sq Meter Footprint (180 acres)
▪ Fully Autonomous Underground Rail System
▪ Annual Production @ Avg. Reserve Grade(1)
• 950 mm lbs Copper & 700,000 ozs Gold
▪ Located Below DOZ Underground Block Cave Mine
▪ 1,500 meters below surface
▪ 439 mm t @ 0.89% Copper & 0.72 g/t Gold
▪ YE 2020 Reserves: 7 bn lbs Copper; 8 mm ozs Gold
▪ By 2022: 200,000 Sq Meter Footprint (~ 50 acres)
▪ Life of Mine: 450,000 Sq Meter Footprint (110 acres)
▪ Annual Production @ Avg. Reserve Grade(1)
• 500 mm lbs Copper & 540,000 ozs Gold
Grasberg Block Cave DMLZ
2019 2020 2021e 2022e 2023e 2024e 2025e
Ramp-up Schedule (2)
(000’s t/d of Ore)
(1) Access to higher ore grades expected in early years of production.
(2) DMLZ ramp-up adjustments in April 2020 plan reflect one year deferral in SAG mill installation.
e = estimate. See Cautionary Statement.
Substantial Infrastructure in Place to Support Large-Scale Production
3 Cave Fronts 2 Cave Fronts
2019 2020 2021e 2022e 2023e 2024e 2025e

Click to edit Master title styleProject Update Grasberg Transition Remains on Track
Deep MLZ (DMLZ)
& Grasberg Block
Cave (GBC)
averaged 98,500 t/d
in 1Q21: 16%
above 4Q20 rates
e = estimate. See Cautionary Statement.
4
10 1215
911 11
0
10
20
30
40
1Q 4Q 2Q 4Q 1Q 2Qe QtrAvg
2 2 3 3
DMLZ
10
24
3431
27
0
10
20
30
40
1Q 4Q 2Q 4Q 1Q 2Qe QtrAvg
GBC
90
143
186
235
0
100
200
300
400
2019 2020 2021e 2022eActive Production Blocks
76
229
337
0
100
200
300
400
2019 2020 2021e 2022e
3 3 4 5
GBC
DMLZ
DMLZ GBC
2021e Exit Rate: 89
2021e Exit Rate: 68
Forecast
Drawbelling
Open drawbells provide scale – cumulative blasted
Ore Extraction (000 t/d)
7
15
39
4752
0
20
40
60
1Q19 4Q19 4Q20 1Q21 2Q21e
5
11
46
52
0
20
40
60
1Q19 4Q19 4Q20 1Q21 2Q21e
2021e20202019 2021e20202019
409
41
66
31
41

Click to edit Master title style
0%
25%
50%
75%
100%
4Q19 4Q20 4Q21e 2022e
Grasberg Underground Ramp-up Accelerating
e = estimate. See Cautionary Statement.
Note: Includes production from Grasberg Block Cave, DMLZ, DOZ and Big Gossan
Qu
art
erl
y P
rod
uc
tio
n A
nn
ua
lize
d
as %
of
Ta
rgete
d A
vera
ge 2
02
1e-2
023e
32
2021e-2023e Annual Average
1.55 bn lbs Cu & 1.6 mm ozs Au
Reached 75%
in 1Q21

Click to edit Master title style
33
PT-FI Mine Plan Metal Sales, 2020 – 2025e
NOTE: Amounts are projections. Timing of annual sales will depend on a number of factors, including operational performance, continued progress of the ramp-up of
underground mining at PT-FI, impacts and duration of the COVID-19 pandemic, timing of shipments, and other factors. FCX's economic interest in PT-FI approximates
81.27% through 2022 and 48.76% thereafter. See Cautionary Statement. e = estimate.
0.8
1.34
1.61.7
1.61.5
0.84
1.3
1.6
1.81.7
1.6
2020 2021e 2022e 2023e 2024e 2025e
Transition Year
Cubn
lbs
Aumm
ozs
Total: 7.7 billion lbs copper
Annual Average: 1.55 billion lbs
2021e – 2025e Copper
Total: 8.0 million ozs gold
Annual Average: 1.6 million ozs
2021e – 2025e Gold

Click to edit Master title style
$0
$2
$4
$6
$8
2021 2022 2023 2024 2025 2026 Thereafter
FCX Debt Maturities as of 3/31/21
(US$ bns)
$6.9
5.00%,
4.125%,
4.375%,
5.25%,
4.25%,
4.625%,
5.40% &
5.45%
Sr. Notes
and
FMC
Sr. Notes
$1.0 $1.0
3.875%Sr. Notes
3.55%Sr. Notes
$0.9
4.55% Sr. Notes
CV Non-recourse
FCX Revolver $ -
Senior Notes 9.1
Cerro Verde Term Loan 0.5
Other 0.2
Total Debt $ 9.8
Consolidated Cash $ 4.6
Undrawn Credit Facility 3.5
Total Liquidity $ 8.1
$ -
at 3/31/21Total Debt & Cash
(1) For purposes of this schedule, maturities of uncommitted lines of credit and other short-term lines are included in FCX’s revolver balance, which matures in 2024.
(1) (1)
$ -$ -
34

Click to edit Master title style
35
1Q21 Copper Realization & 2Q21e Guidance
$3.86/lb1Q21 LME Average
Copper Price
3-Mo. Fwd Price for Copper
at the End of March
FCX 1Q21 Consolidated
Copper Price Realization
FCX 1Q21 Prior Period
Open Lb Adj.
(aka Provisional Price Adj.)
$3.99/lb
$3.94/lb(1)
(Generally, 50/50 weight of qtrly avg and
3-mo forward price at end of period)
Revenue/EBITDA: $146 mm
Net income: $57 mm
Earnings/share: $0.04
(1) Note that when quarter end forward pricing is above the average quarterly spot price, FCX’s consolidated quarterly copper realization can be expected to be above the quarterly average spot pricing. Conversely, the quarterly copper realization would be below the quarterly spot price average if quarter end forward curve pricing is below the quarterly average spot price. Quarterly copper realizations by region may vary from the consolidated average.
e = estimate. See Cautionary Statement.
Open lbs priced at $3.99/lb on 3/31/21
Each $0.05 change in avg copper price in 2Q21 = $8 mm impact to 2021e net income
LME copper settled at $4.26/lb on 4/21/21
2Q21e
Open Pound
Guidance

Click to edit Master title style
36
Adjusted EBITDA Reconciliation
(1) Other net charges primarily include a talc-related litigation accrual, partly offset by net favorable adjustments to environmental obligations ($96 mm) and costs directly associated with
the COVID-19 pandemic and revised operating plans, including employee separation costs ($215 mm).
(2) Adjusted EBITDA is a non-GAAP financial measure that is frequently used by securities analysts, investors, lenders and others to evaluate companies’ performance, including, among
other things, profitability before the effect of financing and similar decisions. Because securities analysts, investors, lenders and others use Adjusted EBITDA, management believes that
our presentation of Adjusted EBITDA affords them greater transparency in assessing our financial performance. Adjusted EBITDA should not be considered as a substitute for measures
of financial performance prepared in accordance with GAAP. Adjusted EBITDA may not necessarily be comparable to similarly titled measures reported by other companies, as different
companies calculate such measures differently.
($ in mm) 12 mos ended
1Q21 3/31/2021
Net income attributable to common stock $718 $1,808
Interest expense, net 145 616
Income tax provision 443 1,447
Depreciation, depletion and amortization 419 1,606
Metals inventory adjustments 1 (125)
Net gain on sales of assets - (484)
Accretion and stock-based compensation 58 201
Other net charges 33 389 (1)
Loss on early extinguishment of debt - 69
Other income, net (11) (50)
Net income attributable to noncontrolling interests 235 559
Equity in affiliated companies’ net losses (earnings) 2 (7)
FCX Adjusted EBITDA (2)
$2,043 $6,029

Click to edit Master title style