1997 caseload highlights
TRANSCRIPT
JUDICIAL BUSINESS
9
1997 Caseload HighlightsCriminal Filings
— Criminal case filings increased 5 percent and criminaldefendant filings grew 4 percent.
— Immigration case filings jumped 21 percent andaccounted for 13 percent of all criminal filings.
— Drug case filings grew 13 percent, and defendantscharged with drug offenses rose 8 percent.
U.S. Bankruptcy Courts
— Bankruptcy petitions climbed 23 percent to a recordlevel.
— Nonbusiness filings soared 24 percent to surpass onemillion; business filings rose 1 percent.
— Chapter 7 filings jumped 26 percent and chapter 13filings grew 18 percent.
Federal Probation System/Pretrial Services
— As of September 30, 1997, a total of 91,434 personswere under the supervision of the federal probationsystem, a 3 percent increase over 1996.
— The number of persons serving terms of supervisedrelease rose 11 percent, accounting for 56 percent of allpersons under supervision.
— The number of pretrial services defendants grew 9percent to 69,283.
U.S. Courts of Appeals
— Appeals filings rose 1 percent to reach an all-timehigh.
— Administrative agency appeals increased 56 percent,primarily because of an 81 percent surge in appeals ofImmigration and Naturalization Service decisions.
— Civil appeals filings declined 2 percent as prisonerpetition appeals dropped 5 percent.
— Criminal appeals filings fell 3 percent, with the mostsignificant reduction occurring in drug-related appeals(down 7 percent).
U.S. District Courts
— Total filings in U.S. district courts rose 2 percent.— Weighted filings increased 10 percent to 519 per
authorized judgeship.
Civil Filings
— Civil filings grew 1 percent, mostly because filingswith the United States as a party increased 23 percent.
— Civil filings per authorized judgeship reached 420, thehighest level in 10 years.
— Federal question litigation dropped 2 percent as stateprisoner petitions fell 31 percent.

10
ADMINISTRATIVE OFFICE OF THE UNITED STATES COURTS
JUDICIAL BUSINESS
11
Judicial Business
his report contains statistical data on the business of the federal
judiciary during fiscal year 1997, compares the caseload for this
year to those of prior fiscal years, and, wherever possible, ex-
plains why increases or decreases occurred in the courts�
caseload. Specific sections address the work of the appellate, district,
and bankruptcy courts; the probation/pretrial systems; and other compo-
nents of the federal judiciary. A table of judicial caseload indicators pre-
sents totals for all major segments of the federal courts.
date the previous year, and pre-trial services cases jumped 9percent.
The caseload and associ-ated workload of federal judgeshas risen significantly over thelast five years. From 1993 to1997, the following occurred:
— the total number of weightedcivil and criminal filings perdistrict judgeship (which arebased on weights thataccount for differences in thetime judges need to resolvevarious types of civil andcriminal actions) climbed 24percent from 419 to 519;
— the number of appealsterminated per three-judgepanel grew 7 percent;
— bankruptcy filings perauthorized judgeship rose 52percent.
Despite these increases,no new Article III judgeshipshave been created in sevenyears, and the number of bank-ruptcy judges authorized andfunded has not changed since1993.
U.S. Courts ofA p p e a l s
The number of appealsfiled in the 12 regional courts ofappeals rose 1 percent in 1997,attaining an all-time high of
Once again, the majortrend emerging from the 1997data (see Caseload Highlightssection) is that the federalcourts’ caseload increased ineach program area. Filings ofnew cases in the appellate andbankruptcy courts reachedrecord heights, rising 1 percentand 23 percent, respectively.Overall, 2 percent more caseswere filed in the district courtsthan in fiscal year 1996, withfilings of criminal cases and de-fendants attaining their highestlevels in more than 60 years. Asof September 30, 1997, the fed-eral probation system reportedhaving 3 percent more personsunder supervision than on that
12
ADMINISTRATIVE OFFICE OF THE UNITED STATES COURTS
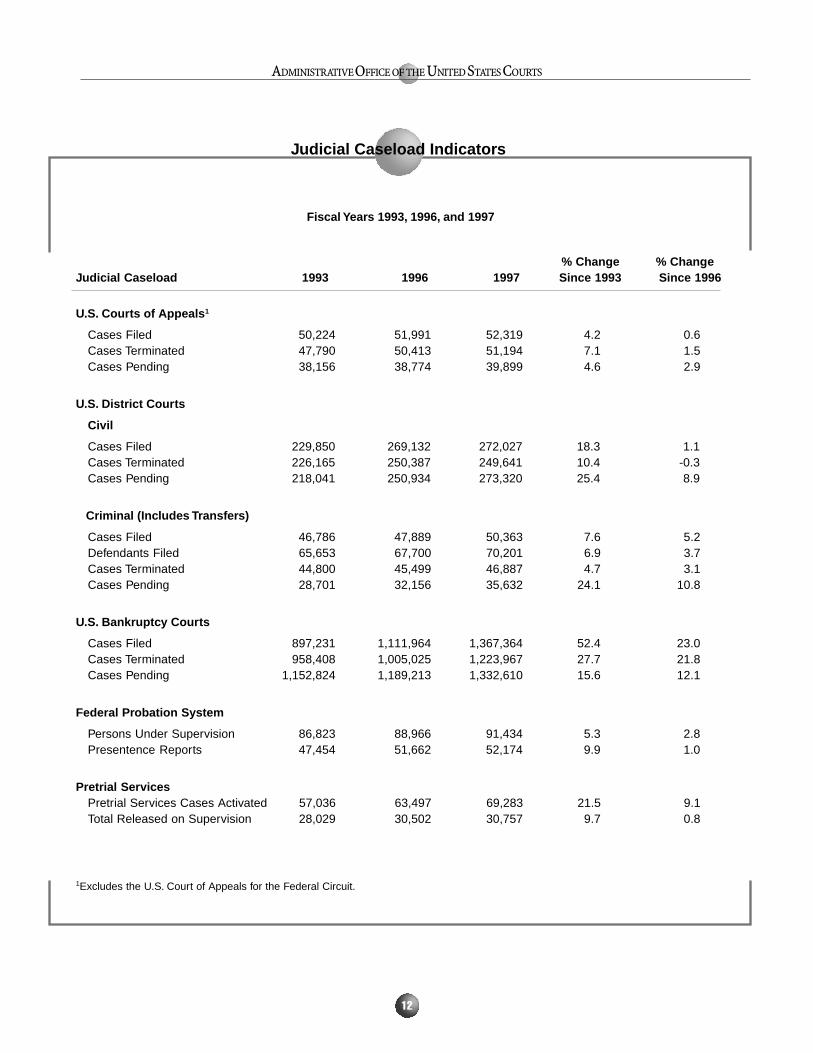
Judicial Caseload Indicators
Fiscal Years 1993, 1996, and 1997
% Change % ChangeJudicial Caseload 1993 1996 1997 Since 1993 Since 1996
U.S. Courts of Appeals 1
Cases Filed 50,224 51,991 52,319 4.2 0.6Cases Terminated 47,790 50,413 51,194 7.1 1.5Cases Pending 38,156 38,774 39,899 4.6 2.9
U.S. District Courts
Civil
Cases Filed 229,850 269,132 272,027 18.3 1.1Cases Terminated 226,165 250,387 249,641 10.4 -0.3Cases Pending 218,041 250,934 273,320 25.4 8.9
Criminal (Includes Transfers)
Cases Filed 46,786 47,889 50,363 7.6 5.2Defendants Filed 65,653 67,700 70,201 6.9 3.7Cases Terminated 44,800 45,499 46,887 4.7 3.1Cases Pending 28,701 32,156 35,632 24.1 10.8
U.S. Bankruptcy Courts
Cases Filed 897,231 1,111,964 1,367,364 52.4 23.0Cases Terminated 958,408 1,005,025 1,223,967 27.7 21.8Cases Pending 1,152,824 1,189,213 1,332,610 15.6 12.1
Federal Probation System
Persons Under Supervision 86,823 88,966 91,434 5.3 2.8Presentence Reports 47,454 51,662 52,174 9.9 1.0
Pretrial ServicesPretrial Services Cases Activated 57,036 63,497 69,283 21.5 9.1Total Released on Supervision 28,029 30,502 30,757 9.7 0.8
1Excludes the U.S. Court of Appeals for the Federal Circuit.
JUDICIAL BUSINESS
13
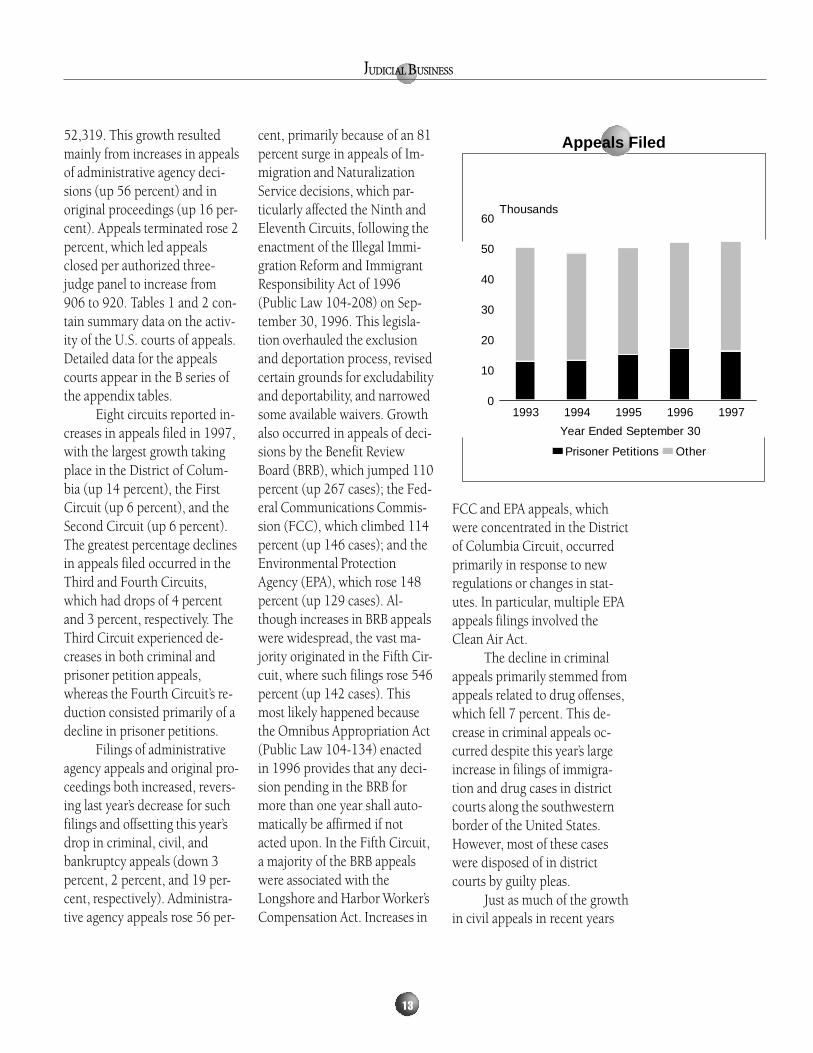
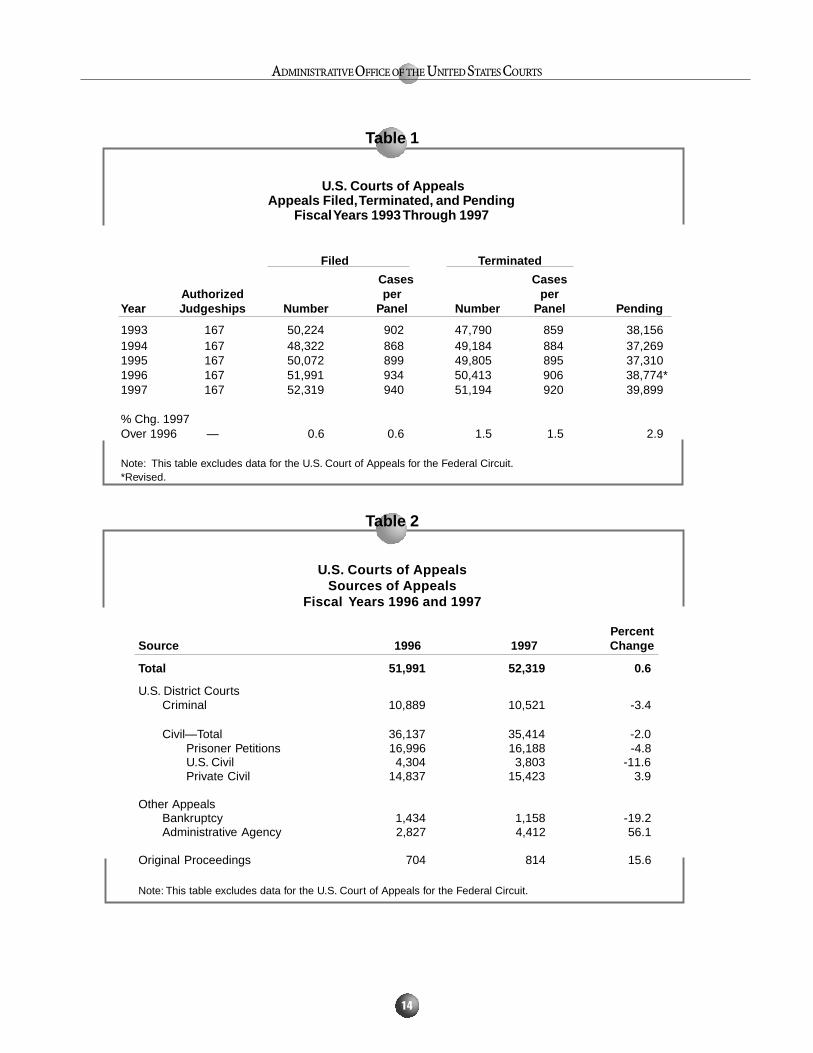
52,319. This growth resultedmainly from increases in appealsof administrative agency deci-sions (up 56 percent) and inoriginal proceedings (up 16 per-cent). Appeals terminated rose 2percent, which led appealsclosed per authorized three-judge panel to increase from906 to 920. Tables 1 and 2 con-tain summary data on the activ-ity of the U.S. courts of appeals.Detailed data for the appealscourts appear in the B series ofthe appendix tables.
Eight circuits reported in-creases in appeals filed in 1997,with the largest growth takingplace in the District of Colum-bia (up 14 percent), the FirstCircuit (up 6 percent), and theSecond Circuit (up 6 percent).The greatest percentage declinesin appeals filed occurred in theThird and Fourth Circuits,which had drops of 4 percentand 3 percent, respectively. TheThird Circuit experienced de-creases in both criminal andprisoner petition appeals,whereas the Fourth Circuit’s re-duction consisted primarily of adecline in prisoner petitions.
Filings of administrativeagency appeals and original pro-ceedings both increased, revers-ing last year’s decrease for suchfilings and offsetting this year’sdrop in criminal, civil, andbankruptcy appeals (down 3percent, 2 percent, and 19 per-cent, respectively). Administra-tive agency appeals rose 56 per-
cent, primarily because of an 81percent surge in appeals of Im-migration and NaturalizationService decisions, which par-ticularly affected the Ninth andEleventh Circuits, following theenactment of the Illegal Immi-gration Reform and ImmigrantResponsibility Act of 1996(Public Law 104-208) on Sep-tember 30, 1996. This legisla-tion overhauled the exclusionand deportation process, revisedcertain grounds for excludabilityand deportability, and narrowedsome available waivers. Growthalso occurred in appeals of deci-sions by the Benefit ReviewBoard (BRB), which jumped 110percent (up 267 cases); the Fed-eral Communications Commis-sion (FCC), which climbed 114percent (up 146 cases); and theEnvironmental ProtectionAgency (EPA), which rose 148percent (up 129 cases). Al-though increases in BRB appealswere widespread, the vast ma-jority originated in the Fifth Cir-cuit, where such filings rose 546percent (up 142 cases). Thismost likely happened becausethe Omnibus Appropriation Act(Public Law 104-134) enactedin 1996 provides that any deci-sion pending in the BRB formore than one year shall auto-matically be affirmed if notacted upon. In the Fifth Circuit,a majority of the BRB appealswere associated with theLongshore and Harbor Worker’sCompensation Act. Increases in
FCC and EPA appeals, whichwere concentrated in the Districtof Columbia Circuit, occurredprimarily in response to newregulations or changes in stat-utes. In particular, multiple EPAappeals filings involved theClean Air Act.
The decline in criminalappeals primarily stemmed fromappeals related to drug offenses,which fell 7 percent. This de-crease in criminal appeals oc-curred despite this year’s largeincrease in filings of immigra-tion and drug cases in districtcourts along the southwesternborder of the United States.However, most of these caseswere disposed of in districtcourts by guilty pleas.
Just as much of the growthin civil appeals in recent years
c vAppeals Filed
1993 1994 1995 1996 1997
Year Ended September 30
0
10
20
30
40
50
60Thousands
Prisoner Petitions Other
14
ADMINISTRATIVE OFFICE OF THE UNITED STATES COURTS
U.S. Courts of AppealsAppeals Filed, Terminated, and Pending
Fiscal Years 1993 Through 1997
Filed Terminated
Cases CasesAuthorized per per
Year Judgeships Number Panel Number Panel Pending
1993 167 50,224 902 47,790 859 38,1561994 167 48,322 868 49,184 884 37,2691995 167 50,072 899 49,805 895 37,3101996 167 51,991 934 50,413 906 38,774*1997 167 52,319 940 51,194 920 39,899
% Chg. 1997Over 1996 — 0.6 0.6 1.5 1.5 2.9
Note: This table excludes data for the U.S. Court of Appeals for the Federal Circuit.*Revised.
U.S. Courts of AppealsSources of Appeals
Fiscal Years 1996 and 1997
PercentSource 1996 1997 Change
Total 51,991 52,319 0.6
U.S. District CourtsCriminal 10,889 10,521 -3.4
Civil—Total 36,137 35,414 -2.0Prisoner Petitions 16,996 16,188 -4.8U.S. Civil 4,304 3,803 -11.6Private Civil 14,837 15,423 3.9
Other AppealsBankruptcy 1,434 1,158 -19.2Administrative Agency 2,827 4,412 56.1
Original Proceedings 704 814 15.6
Note: This table excludes data for the U.S. Court of Appeals for the Federal Circuit.
Table 1
Table 2
JUDICIAL BUSINESS
15
percent this year to their lowestlevel since 1990. Decreases infilings were reported for 9 of the12 circuits, with reductionsranging from 12 to 43 percent.
U.S. Court ofAppeals for theFederal Circuit
Filings in the U.S. Courtof Appeals for the Federal Cir-cuit rose 9 percent (up 121 ap-peals) to 1,458, reversing direc-tion after last year’s 28 percentdrop in filings, which was thelowest total since 1987. Just aslast year’s reduction in filings re-sulted primarily from a declinein appeals of Merit Systems Pro-tection Board (MSPB) decisions,this year’s growth stemmedlargely from a 15 percent jump(up 69 cases) in MSPB appeals.Increased filings of cases fromthe U.S. Court of InternationalTrade and the U.S. Court of Vet-erans Appeals, which climbed66 percent (up 33 cases) and 42percent (up 25 cases), respec-tively, also contributed to theoverall growth. The rise in ap-peals of U.S. Court of Interna-tional Trade decisions waslinked to last year’s filings ofmore than 2,000 actions in thatcourt challenging the consti-tutionality of the HarborMaintenance Tax. Filings ofappeals involving the Patentand Trademark Office, how-
ever, dropped 19 percent(down 17 cases). AppendixTable B-8 provides summarydata on the activity of the U.S.Court of Appeals for the FederalCircuit. More detailed data areavailable from the Office of theClerk of the U.S. Court of Ap-peals for the Federal Circuit.
U.S. DistrictC o u r t s
Filings in U.S. districtcourts in 1997 totaled 322,390,a 2 percent increase over 1996(up 5,369 filings) that led filingsper authorized judgeship toclimb from 490 to 498. Caseterminations remained relativelystable at 296,528 (a rise of lessthan 1 percent). Because filingsoutnumbered terminations, thepending caseload grew 9 per-cent to 308,952 on September30, 1997.
Civil Filings
In 1997, civil filings in theU.S. district courts increased 1percent to 272,027. Thismarked the fourth consecutiveyear in which the national civilcaseload rose. As a result, civilfilings per authorized judgeshipgrew from 416 to 420, the high-est total in 10 years. The in-crease in filings resulted prima-
was linked to growth in pris-oner petition appeals, the de-cline in civil appeals this yearwas associated with a 5 percentdecline in prisoner petitions.This reduction resulted from theenactment of the Prison Litiga-tion Reform Act in April 1996,which was intended to reducethe filing of frivolous petitionsby, in part, imposing filing fees.Last year, many inmates filedpetitions before the fee require-ment took effect. This producedan 8 percent jump in filings ofcivil rights prisoner petitionsbetween March and June 1996,followed by a marked decline of32 percent from June 1996 toSeptember 1997.
This year, the overallnumber of cases involving prose litigants (65 percent of whichwere filed by prisoners) de-clined 2 percent. Pro se casesconstituted 42 percent of all ap-peals filed in 1997, down from43 percent last year. The num-ber of pro se appeals increasedin 5 of the 12 circuits, with theFirst Circuit having the greatestincrease (up 24 percent). Al-though the number of pro selitigants filing prisoner petitionsfell 6 percent, the number filingemployment civil rights appealsrose 17 percent. SupplementalTable S-4 contains summarydata on pro se appeals.
Bankruptcy appeals,which accounted for 2 percentof all appeals filed, dropped 19

16
ADMINISTRATIVE OFFICE OF THE UNITED STATES COURTS
rily from growth in actions in-volving the United States as aplaintiff or defendant. Filingsunder federal question jurisdic-tion (i.e., the federal courts’ in-terpretation and application ofthe U.S. Constitution, acts ofCongress, or treaties) and diver-sity of citizenship declined.Summary data on civil filings inU.S. district courts appear inTables 3 and 4.
Actions with the UnitedStates as a plaintiff or defendantrose 23 percent from 48,755 to60,004. U.S. plaintiff cases
jumped 35 percent, mainly be-cause filings involving defaultedstudent loans more thandoubled from 4,460 to 9,043.All 12 circuits experiencedgrowth in such cases, and inmore than half of the circuitssuch filings climbed 100 percentor more. U.S. Department ofJustice officials attributed thisincrease to intensified efforts bythe Department of Education tosubmit defaulted student loansfor collection.
The number of filings withthe United States as defendant
grew 18 percent from 33,217 to39,038. This increase stemmedfrom a 46 percent surge in socialsecurity filings and a 14 percentrise in prisoner petitions, mostof which consisted of motions tovacate sentence. Higher num-bers of social security disabilityinsurance cases (up 47 percent)caused the total number of so-cial security filings to grow bymore than 2,400. In 10 of the12 circuits, filings of disabilityinsurance cases increased bymore than 100, with the Sec-ond, Fourth, Sixth, and Eighth
U.S. District CourtsCivil Cases Filed, Terminated, and Pending
Fiscal Years 1993 Through 1997
Cases Filed
Recoveryand
Cases Enforce- AllAuthorized per ment Prisoner Other Ter-
Year Judgeships Total Judgeship Cases Petitions Cases minated Pending
1993 649 229,850 354 4,519 53,451 171,880 226,165 218,041
1994 649 236,391 364 2,330 57,940 176,121 228,361 223,759
1995 649 248,335 383 1,822 63,550 182,963 229,820 234,008
1996 647 269,132 416 5,139 68,235 195,758 250,387 250,934*
1997 647 272,027 420 9,677 62,966 199,384 249,641 273,320
% Chg. 1997Over 1996 — 1.1 1.0 88.3 -7.7 1.9 -0.3 8.9
*Revised.
Table 3

JUDICIAL BUSINESS
17
Circuits each reporting morethan 300 new cases. For thesecond consecutive year, therise in social security filings re-sulted mostly from the speedierprocessing of backlogged casesby the Social Security Adminis-tration.
Motions to vacate sen-tence jumped 20 percent,partly because of the Bailey v.United States Supreme Courtruling and the enactment of theAntiterrorism and EffectiveDeath Penalty Act (AEDPA) in1996. The Bailey decision,which restricted the impositionof enhanced penalties for usingfirearms in violent crimes ordrug trafficking offenses, causedmany federal prisoners servingsuch sentences to seek to vacatethem. The AEDPA established aone-year limitation period forfiling prisoner petitions under28 U.S.C. 2255, leading nu-merous prisoners to file mo-tions to vacate sentence beforethe period expired. Anothercontributor to the overall rise inU.S. defendant prisoner peti-tions was a 12 percent increasein habeas corpus prisoner peti-tions.
Although total civil filingsincreased in 1997, private casesdeclined 4 percent. Federalquestion litigation fell 2 percentto 156,596, mostly as a resultof a 31 percent drop in stateprisoner petitions to 27,658(down more than 12,000 peti-tions), the lowest level since
1991. This reduction stemmedprimarily from the enactment ofthe Prison Litigation ReformAct. Despite the overall declinein federal question litigation, a90 percent surge occurred inpersonal injury/product liabilitycases, many of which involvedbreast implants. Civil filings inthe Eastern District of Michigansoared by more than 10,000cases as a result of a recent deci-sion of the U.S. Court of Ap-peals for the Sixth Circuit thatled to the transfer to that districtof preexisting cases or claimsfiled in other districts (or, insome instances, in state courts).The Eastern District of Michiganis where Chapter 11 federalbankruptcy proceedings involv-ing the Dow Corning Corpora-tion are now pending.
Diversity of citizenship fil-ings fell 9 percent (down morethan 5,400 filings). In theNorthern District of Alabama, adecrease in personal injury/product liability cases (down 14percent) arising from a reduc-tion in breast implant casesmade total civil filings in thatdistrict fall 59 percent (down7,250 cases).
Civil case terminations re-mained stable in 1997, declin-ing less than 1 percent from250,387 in 1996 to 249,641. Areduction of more than 6,000personal injury/product liabilitycase terminations in the South-ern District of Texas was thechief factor in the overall na-
tional decrease in civil termina-tions. In 1996, this district hadan unusually high number ofpersonal injury/product liabilityterminations as numerous breastimplant cases were either re-manded to state courts or trans-ferred to the Northern Districtof Alabama.
The median time intervalfrom filing to disposition forcivil cases was eight months in1997, an increase of one monthover 1996. Most of this increaseinvolved contract, civil rights,and social security cases.
The number of civil casespending rose 9 percent to273,320, largely based on thegrowing caseload in the EasternDistrict of Michigan, wherepending cases tripled (up nearly
Civil Filings
1993 1994 1995 1996 1997
Year Ended September 30
0
50
100
150
200
250
300Thousands
Prisoner Petitions Other Recovery and Enforcement

18
ADMINISTRATIVE OFFICE OF THE UNITED STATES COURTS
personal injury/product liabilitybreast implant cases pending inthe Northern District of Ala-bama.
The C series of the appen-dix tables provides detailed in-formation on civil matters.
Arbitration Cases
In May 1989, Public Law100-702 established a court-an-nexed arbitration program tosettle civil disputes without re-sorting to trial. This programprovides for the following twotypes of arbitration: voluntaryarbitration, whereby a court re-fers a case to arbitration with
11,000 cases) as a result of theincrease in personal injury/product liability breast implantfilings. In addition, five otherdistrict courts (the Eastern Dis-trict of Texas, the Eastern Dis-trict of Pennsylvania, the East-ern District of New York, theSouthern District of Florida,and the Central District of Cali-fornia) reported that their pend-ing caseloads each grew bymore than 1,000 cases. Personalinjury/product liability cases ac-counted for much of the in-crease in the Eastern District ofTexas and the Eastern District ofPennsylvania. The pendingcaseload in the Eastern District
of Texas rose as a result of filingsrelated to the Norplant birthcontrol device underMultidistrict Litigation DocketNumber 1038; the growth inthe Eastern District of Pennsyl-vania stemmed from filings re-lated to the ACROMED bonescrew device under MultidistrictLitigation Docket Number1014. The increases in the East-ern District of New York, theSouthern District of Florida, andthe Central District of Californiainvolved a mixture of cases. Thenumber of civil cases pendingfor three years or more rose 40percent to 22,642, mainly be-cause of the large number of
Table 4
U.S. District CourtsCivil Cases Filed, by Jurisdiction,Fiscal Years 1993 Through 1997
U.S. Cases Private Cases
Federal Diversity of LocalYear Total Plaintiff Defendant Question Citizenship Jurisdiction
1993 229,850 20,482 31,242 126,271 51,445 410
1994 236,391 15,805 29,605 135,853 54,886 242
1995 248,335 14,130 29,028 153,489 51,448 240
1996 269,132 15,538 33,217 159,513 60,685 179
1997 272,027 20,966 39,038 156,596 55,278 149
% Chg. 1997Over 1996 1.1 34.9 17.5 -1.8 -8.9 -16.8

JUDICIAL BUSINESS
19
both parties’ consent; and man-datory arbitration, whereby acourt orders arbitration for acase in which the plaintiff seeksno more than $150,000 inmoney damages. When a casegoes to arbitration, an outsideneutral party or panel of neutralparties presents the litigantswith an opinion of the likelyoutcome of a trial. Anarbitrator’s decision is not bind-ing; within 30 days after thedecision’s release, the parties canfile for a trial, which will causethe case to be treated as if itnever went through arbitration.The first districts authorized touse mandatory and voluntaryarbitration were California-Northern, Florida-Middle,Michigan-Western, New Jersey,New York-Eastern, NorthCarolina-Middle, Oklahoma-Western, Pennsylvania-East-ern, Missouri-Western, andTexas-Western. The JudicialConference later authorized 10additional districts to use vol-untary arbitration only.
During 1997, the seventhyear of arbitration reporting,3,827 cases were referred to ar-bitration in the 10 original dis-tricts, a 7 percent decrease(down 273 cases) over 1996.These cases represented 8 per-cent of total civil filings(48,341) in these courts, downslightly from the 9 percent theyaccounted for last year.
The Eastern District ofPennsylvania and the District of
New Jersey made the greatestuse of court-referred arbitration,reporting 1,169 cases and 1,033new cases, respectively. Thelargest numerical increases in ar-bitration referrals occurred inthe Western District of Okla-homa (up 249 referrals), theEastern District of Pennsylvania(up 94 referrals), and theNorthern District of California(up 90 referrals). Of the 10original courts, 4 reported risesin arbitration referrals, 2 re-ported declines, and 4 reportedthey had no arbitration referralsthis year. In previous years,court officials reported that theoverall decrease in arbitrationcases resulted from the fullimplementation of expense anddelay reduction plans under theCivil Justice Reform Act, which,in part, authorizes arbitrationcourts to use other means of al-ternative dispute resolution. Thefour districts that reported noarbitration referrals (Michigan-Western, Missouri-Western,North Carolina-Middle, andTexas-Western) now use federalmediation procedures to settlecases that would have been re-ferred to arbitration in the past.Mediation also involves litigants’meeting with outside neutralparties (often subject matter ex-perts) for discussion, but differsfrom arbitration in that it placesa greater emphasis on reaching asettlement rather than on pro-viding an opinion of the likelyoutcome at trial.
As in the past four years,the cases that the 10 courts re-ferred to arbitration in 1997primarily consisted of personalinjury cases (mostly motor ve-hicle cases), contract actions, la-bor suits, and civil rights ac-tions. Supplemental Table S-12summarizes the cases filed in1996 and 1997 in the 10 dis-tricts authorized to use bothvoluntary and mandatory arbi-tration.
Criminal FilingsIn 1997, filings of both
criminal cases and defendantsrose to their highest levels since1933, the year the ProhibitionAmendment was repealed. Casefilings grew 5 percent to50,363, which caused filingsper authorized judgeship to in-
20
ADMINISTRATIVE OFFICE OF THE UNITED STATES COURTS
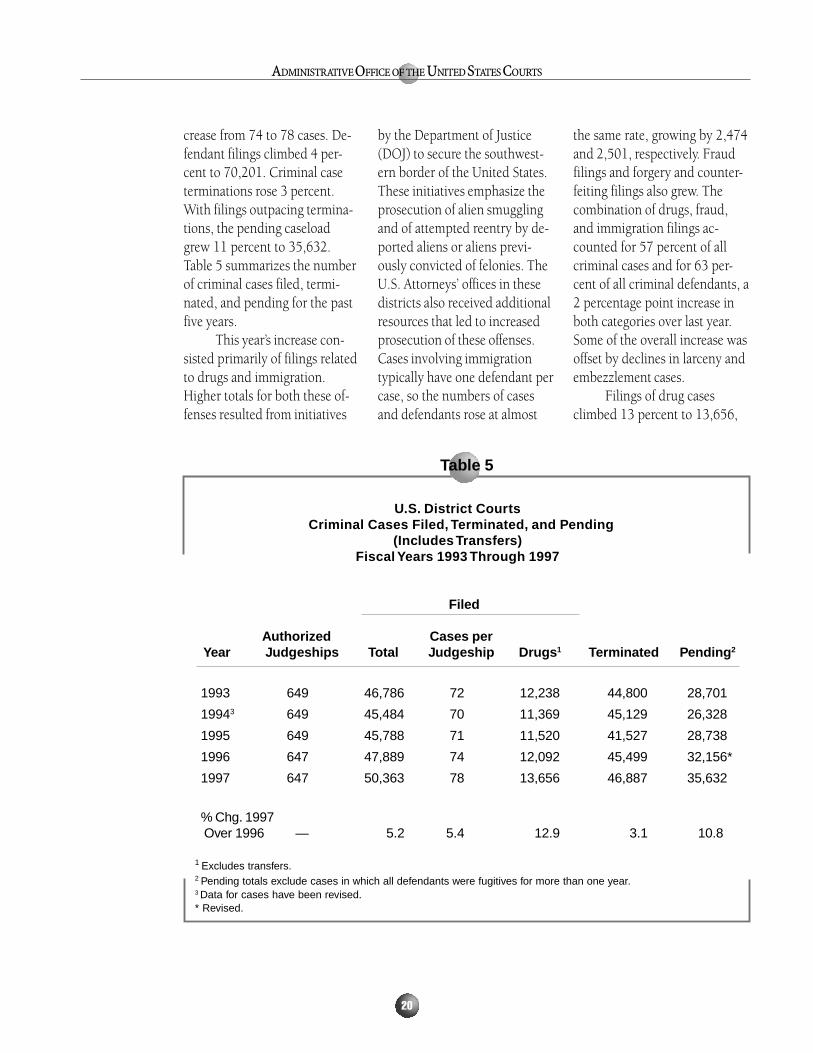
crease from 74 to 78 cases. De-fendant filings climbed 4 per-cent to 70,201. Criminal caseterminations rose 3 percent.With filings outpacing termina-tions, the pending caseloadgrew 11 percent to 35,632.Table 5 summarizes the numberof criminal cases filed, termi-nated, and pending for the pastfive years.
This year’s increase con-sisted primarily of filings relatedto drugs and immigration.Higher totals for both these of-fenses resulted from initiatives
by the Department of Justice(DOJ) to secure the southwest-ern border of the United States.These initiatives emphasize theprosecution of alien smugglingand of attempted reentry by de-ported aliens or aliens previ-ously convicted of felonies. TheU.S. Attorneys’ offices in thesedistricts also received additionalresources that led to increasedprosecution of these offenses.Cases involving immigrationtypically have one defendant percase, so the numbers of casesand defendants rose at almost
the same rate, growing by 2,474and 2,501, respectively. Fraudfilings and forgery and counter-feiting filings also grew. Thecombination of drugs, fraud,and immigration filings ac-counted for 57 percent of allcriminal cases and for 63 per-cent of all criminal defendants, a2 percentage point increase inboth categories over last year.Some of the overall increase wasoffset by declines in larceny andembezzlement cases.
Filings of drug casesclimbed 13 percent to 13,656,
U.S. District Courts Criminal Cases Filed, Terminated, and Pending
(Includes Transfers)Fiscal Years 1993 Through 1997
Filed
Authorized Cases perYear Judgeships Total Judgeship Drugs 1 Terminated Pending 2
1993 649 46,786 72 12,238 44,800 28,701
19943 649 45,484 70 11,369 45,129 26,328
1995 649 45,788 71 11,520 41,527 28,738
1996 647 47,889 74 12,092 45,499 32,156*
1997 647 50,363 78 13,656 46,887 35,632
% Chg. 1997 Over 1996 — 5.2 5.4 12.9 3.1 10.8
1 Excludes transfers.2 Pending totals exclude cases in which all defendants were fugitives for more than one year.3 Data for cases have been revised.* Revised.
Table 5

JUDICIAL BUSINESS
21
while filings of drug defendantsrose 8 percent to 25,885. Thesewere record high levels for thisoffense, which resulted from in-creased resources made avail-able to U.S. attorneys in dis-tricts along the nation’s south-western border. With the in-crease in drug cases exceedingthe increase in drug defendants,the defendants-to-case ratio forsuch cases declined from 2.0 to1.9; however, this ratio wasmuch higher than the ratio of1.4 defendants per case for allcriminal filings. The WesternDistrict of Texas led the nationin numbers of drug cases(1,140) and drug defendants(1,699). The Southern Districtof California, a frequent leaderin drug filings, was a close sec-ond with 1,079 cases and 1,461defendants. Together, these twodistricts contributed 45 percentof the increase in all drug casefilings.
Immigration case filingsrose 21 percent to 6,677, whilethe number of defendants grew20 percent to 7,328. Such fil-ings amounted to 13 percent ofall criminal cases and 11 per-cent of all criminal defendants,more than three times their pro-portions in 1992. The SouthernDistrict of California continuedto lead the nation for this of-fense, having 28 percent of allimmigration cases. This district’s1997 total of 1,860 immigrationcase filings was more than fivetimes (up 564 percent) its total
for 1992. Other southwesterndistricts with large numbers ofimmigration filings were theWestern District of Texas (727cases), the Southern District ofTexas (623 cases), and the Dis-trict of Arizona (578 cases).Combined, these four districtscontributed 80 percent of therise in immigration case filings.
Fraud case filings in-creased for the third consecutiveyear. This year’s 3 percentgrowth consisted primarily offraud filings associated withfalse claims and statements; fil-ings of such cases jumped 20percent to 2,031, while defen-dants rose 18 percent to 2,251.Some of these cases were relatedto immigration prosecutionsand some involved health carefraud. With 640 filings, theWestern District of Texas againled the nation in fraud casesfiled. Overall, however, defen-dants in fraud cases declined 2percent, primarily because of a21 percent decline in postal, in-terstate wire, and radio-relatedfraud defendants. This declinelowered the defendants-to-caseratio for this fraud categoryfrom 1.9 to 1.5, making it con-sistent with the levels recordedprior to 1996. The 1996 ratiowas unusually high because alarge number of multi-defendantcases were filed in the Districtof Nevada that year.
Weapons and firearms fil-ings remained unchanged thisyear after declining 13 percent
in 1996 following the Bailey v.United States decision. Drunkdriving and traffic violationsalso remained stable.
The number of criminaldefendants convicted this yearrose 6 percent (up 3,378) to55,648. This increase, whichraised the conviction rate from87 percent to 88 percent, con-sisted primarily of drug, immi-gration, and fraud defendantsin the Southern District of Cali-fornia, the Western District ofTexas, and the District of Ari-zona. Defendants charged withdrug and immigration offensesin these districts typically pleadguilty, so higher numbers ofthese defendants increased theoverall conviction rate.
In 1997, the median timefrom the filing of a criminal
1993 1994 1995 1996 1997
Year Ended September 30
0
10
20
30
40
50
60Thousands
Drugs Immigration Other
Criminal Case Filings

22
ADMINISTRATIVE OFFICE OF THE UNITED STATES COURTS
case to the disposition of thecriminal defendant remained5.8 months, the same as in1996. This stability in mediantime occurred despite a rise indrug cases, because the rise incases in districts along thenation’s southwest border con-sisted of actions that generallywere less complex and wereprocessed quickly. Historically,however, increases in drug caseshave lengthened the time fromfiling to conviction becausesuch cases often have multipledefendants and thus entailscheduling complexities result-ing from the interrelationshipsamong the defendants.
The D series of the appen-dix tables contain detailed dataon the criminal caseload by dis-trict.
bankruptcy matters (98 percentof which were filed in the bank-ruptcy courts), 41 were appeals(85 percent of which were filedin the courts of appeals), and 23were professional liability mat-ters (91 percent of which werefiled in the district courts).
Trials Completed
Trials include proceedingsresulting in verdicts by juries orin final judgments by thecourts, as well as other con-tested hearings at which evi-dence is presented. During1997, the number of civil andcriminal trials completed in theU.S. district courts fell 3 percentas district judges completed16,969 trials. Fifty-three courtsreported decreases in total com-pleted trials. The overall dropstemmed from reductions incompleted criminal jury andnonjury trials and in completedcivil nonjury trials.
A 5 percent drop in crimi-nal trials (down nearly 400 tri-als) accounted for most of thedownturn in total trials. De-creases in total criminal trialscompleted occurred in 51 dis-tricts, of which 7 districts re-ported declines of 25 or moretrials. Four of these courts (NewYork-Eastern, Texas-Southern,Texas-Northern, and Massachu-setts) reported decreases of 25or more nonjury criminal trials.Once again, court officials re-
Savings andLoan Caseload
In 1997, data on savingsand loan (S&L) cases furtherconfirmed that S&L filings na-tionwide probably peaked in1992. Criminal case filingsstemming from financial fraud atS&L institutions dropped to 26major cases (i.e., those involving$1 million or more) broughtagainst as many defendants be-fore federal courts by U.S. attor-neys. This was a 46 percent re-duction from the 48 defendantsin major S&L cases filed in1996. The number of defen-dants sentenced declinedslightly from 48 to 46. Nation-ally, S&L criminal case filingsconstituted one tenth of one per-cent of all criminal cases filed.
This year, the Federal De-posit and Insurance Corporation(FDIC) again reported low num-bers of noncriminal S&L filingsin the U.S. Supreme Court andin the U.S. appellate, district,bankruptcy, and federal claimscourts. According to FDIC offi-cials, major S&L filings nolonger are specifically trackedunder their new automated re-porting system because filings ofsuch cases have declined sharplyover the past five years. A totalof 434 new noncriminal S&Lcases were filed in the federalcourts in 1997. Of these filings,245 were litigation matters (72percent of which were filed inthe district courts), 125 were
JUDICIAL BUSINESS
23
weighted and unweighted fil-ings per authorized judgeship in1997.
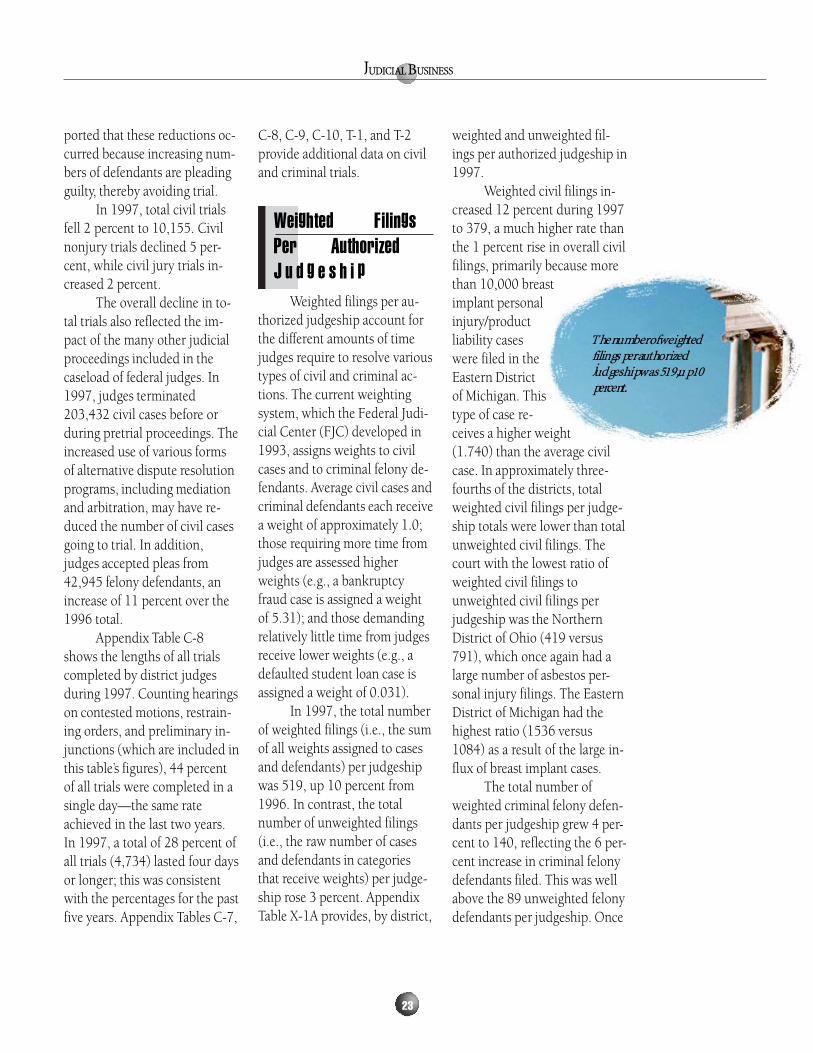
Weighted civil filings in-creased 12 percent during 1997to 379, a much higher rate thanthe 1 percent rise in overall civilfilings, primarily because morethan 10,000 breastimplant personalinjury/productliability caseswere filed in theEastern Districtof Michigan. Thistype of case re-ceives a higher weight(1.740) than the average civilcase. In approximately three-fourths of the districts, totalweighted civil filings per judge-ship totals were lower than totalunweighted civil filings. Thecourt with the lowest ratio ofweighted civil filings tounweighted civil filings perjudgeship was the NorthernDistrict of Ohio (419 versus791), which once again had alarge number of asbestos per-sonal injury filings. The EasternDistrict of Michigan had thehighest ratio (1536 versus1084) as a result of the large in-flux of breast implant cases.
The total number ofweighted criminal felony defen-dants per judgeship grew 4 per-cent to 140, reflecting the 6 per-cent increase in criminal felonydefendants filed. This was wellabove the 89 unweighted felonydefendants per judgeship. Once
ported that these reductions oc-curred because increasing num-bers of defendants are pleadingguilty, thereby avoiding trial.
In 1997, total civil trialsfell 2 percent to 10,155. Civilnonjury trials declined 5 per-cent, while civil jury trials in-creased 2 percent.
The overall decline in to-tal trials also reflected the im-pact of the many other judicialproceedings included in thecaseload of federal judges. In1997, judges terminated203,432 civil cases before orduring pretrial proceedings. Theincreased use of various formsof alternative dispute resolutionprograms, including mediationand arbitration, may have re-duced the number of civil casesgoing to trial. In addition,judges accepted pleas from42,945 felony defendants, anincrease of 11 percent over the1996 total.
Appendix Table C-8shows the lengths of all trialscompleted by district judgesduring 1997. Counting hearingson contested motions, restrain-ing orders, and preliminary in-junctions (which are included inthis table’s figures), 44 percentof all trials were completed in asingle day—the same rateachieved in the last two years.In 1997, a total of 28 percent ofall trials (4,734) lasted four daysor longer; this was consistentwith the percentages for the pastfive years. Appendix Tables C-7,
The number of weightedfilings per authorizedjudgeship was 519, up 10percent.
C-8, C-9, C-10, T-1, and T-2provide additional data on civiland criminal trials.
Weighted FilingsPer AuthorizedJ u d g e s h i p
Weighted filings per au-thorized judgeship account forthe different amounts of timejudges require to resolve varioustypes of civil and criminal ac-tions. The current weightingsystem, which the Federal Judi-cial Center (FJC) developed in1993, assigns weights to civilcases and to criminal felony de-fendants. Average civil cases andcriminal defendants each receivea weight of approximately 1.0;those requiring more time fromjudges are assessed higherweights (e.g., a bankruptcyfraud case is assigned a weightof 5.31); and those demandingrelatively little time from judgesreceive lower weights (e.g., adefaulted student loan case isassigned a weight of 0.031).
In 1997, the total numberof weighted filings (i.e., the sumof all weights assigned to casesand defendants) per judgeshipwas 519, up 10 percent from1996. In contrast, the totalnumber of unweighted filings(i.e., the raw number of casesand defendants in categoriesthat receive weights) per judge-ship rose 3 percent. AppendixTable X-1A provides, by district,
24
ADMINISTRATIVE OFFICE OF THE UNITED STATES COURTS
again, weighted criminal filingswere higher than unweightedcriminal filings in all districtcourts. Criminal filings generallyhave higher weights than civilfilings because they requiremore attention from judges andare more likely to go to trial (7percent of criminal defendantswent to trial compared to 3 per-cent of civil cases).
The federal judiciary hasemployed a weighted filing sys-tem since 1946. The currentsystem assigns weights onlywhen cases are first filed in dis-trict court. Thus, data on re-opens, remands, appeals frommagistrate judges’ judgments,and multidistrict litigation arenot included among the totalsfor weighted and unweighted fil-ings. Weights are not assigned tocivil cases and criminal defen-
dants in the Virgin Islands,Guam, and the NorthernMariana Islands.
U . S .M a g i s t r a t eJ u d g e s
Magistrate judges arestatutorily authorized to per-form a wide array of judicial du-ties as assigned by districtcourts. Courts continue to relyon the services of magistratejudges for help in confrontingthe challenges of scarce judicialresources and expandingcaseloads. Supplemental TableS-19 summarizes the magistratejudges’ workload.
In 1997, magistrate judgesperformed 5 percent more du-ties overall than in 1996. Magis-trate judges conducted 7 percentmore preliminary proceedings infelony cases—a time-consumingworkload category—than theydid last year. Petty offense adju-dications by magistrate judgesrose 16 percent in 1997 follow-ing a statutory change that forsome of these cases abolishedthe requirement that defendantsconsent to adjudication by amagistrate judge.
The consensual use ofmagistrate judges for civil casedispositions has continued toexpand, facilitated in manycourts by means such as includ-
ing magistrate judges in the ran-dom “draw” system for assigningcivil cases. In 1997, dispositionsof civil cases by magistratejudges exceeded 10,000 for thefirst time, a 1 percent increaseover 1996.
Magistrate judges con-ducted 23,549 settlement con-ferences in 1997, a rise of 5 per-cent over 1996. They also de-voted bench time to a largernumber of motion hearings andoral arguments, with increasesof 2 percent for civil cases and10 percent for felony cases. Thenumbers of reports and recom-mendations by magistrate judgesdeclined 20 percent for prisonercivil rights cases, but grew 6percent for habeas corpus mat-ters.
J u d i c i a lPanel onM u l t i d i s t r i c tL i t i g a t i o n
The Judicial Panel onMultidistrict Litigation acted on14,864 civil actions pursuant to28 U.S.C. 1407 during the 12-month period ending September30, 1997. The Panel transferred13,909 cases filed originally in92 different district courts to 38transferee districts for inclusionin coordinated or consolidatedpretrial proceedings; 955 actionsalready were pending in the

JUDICIAL BUSINESS
25
transferee districts. The Paneldenied the transfer of 192 ac-tions. This year, the Panel’s sig-nificant determinations in-cluded cases involving asbestos,the Norplant contraceptive de-vice, and breast implants.
Since its creation in 1968,the Panel has centralized124,274 civil actions for pretrialproceedings. A total of 3,781actions have been remanded fortrial, 279 have been reassignedwithin the transferee district,and 66,168 have been termi-nated in the transferee court.On September 30, 1997, a totalof 54,046 actions were pendingthroughout 45 transferee districtcourts.
Supplemental Tables S-21and S-22 provide statistics onthe number of cases transferredsince the Panel was created andreport data on the flow of casesinto and out of the districts thisyear and since 1968. All statisti-cal information on multidistrictlitigation traffic in the federalcourts is maintained by theClerk’s Office of the JudicialPanel on Multidistrict Litigation.Information on specific cases ordistricts may be obtained fromthat office.
C r i m i n a lJustice Act
In 1997, a total of 90,032appointments of counsel weremade under the Criminal Justice
Act (CJA), an increase of 8 per-cent over 1996. The CJA pro-vides funding for the represen-tation of individuals with lim-ited financial resources in fed-eral criminal proceedings. Ineach district, a plan exists forproviding such representationby private panel attorneys or byfederal public or community de-fender offices.
This year, representationsby the 63 federal defender orga-nizations (including representa-tions in appeals, habeas corpus,revocation, and criminal mat-ters) rose 9 percent to 52,195.Appointments of private panelattorneys grew 6 percent to37,837.
Supplemental Table S-23provides a summary of federaldefender appointments underthe CJA for the last five years.Appendix Table K-1 presents in-formation on the representa-tions each federal public andcommunity defender organiza-tion provided during 1997.
U . S .B a n k r u p t c yC o u r t s
Reaching an all-time high,filings in the U.S. bankruptcycourts soared 23 percent to1,367,364 in 1997. Once again,the surge in bankruptcy filingsmost likely was linked to therise in consumer debt as a per-
centage of personal income. Fil-ings rose in 93 of the 94 dis-tricts, with 82 courts experienc-ing growth greater than 15 per-cent. The largest numerical in-creases occurred in the CentralDistrict of California (up 18,375cases), the District of New Jer-sey (up 8,687), the Middle Dis-trict of Florida (up 8,414 cases),and the District of Maryland (up8,138 cases). Tables 6 and 7contain national data on bank-ruptcy cases. Detailed data onfilings, terminations, and pend-ing bankruptcy cases by districtappear in Appendix Tables Fand F-2.
This year’s appreciablegrowth primarily comprisednonbusiness filings, whichclimbed 24 percent. Nonbusi-ness filings have constituted an
1993 1994 1995 1996 1997
Year Ended September 30
0
200
400
600
800
1,000
1,200
1,400
1,600Thousands
Chapter 7 All Other
Bankruptcy Filings
26
ADMINISTRATIVE OFFICE OF THE UNITED STATES COURTS
increasingly larger percentage ofoverall bankruptcy filings formore than a decade, climbingfrom 82 percent in 1984 to 96percent in 1997. Business filingsaccounted for a small part of theoverall increase in 1997, risingjust over one percent.
The overall growth inbankruptcy filings this yearemanated from a 26 percentsurge in chapter 7 cases and an18 percent jump in chapter 13cases. Both nonbusiness andbusiness filings under these
chapters increased, but the over-all increase in filings resultedmainly from nonbusiness peti-tions, which rose 27 percent un-der chapter 7 and 18 percentunder chapter 13. Under chap-ter 7, which accounted for morethan 70 percent of all bank-ruptcy filings, individuals orbusinesses are allowed to retaincertain exempt property whiletheir remaining property is soldto repay creditors. Under chap-ter 13, which accounted for 29percent of all bankruptcy filings,
creditors may be repaid, in fullor in part, in installments over athree- to five-year period.
Filings of petitions underchapter 11 fell 11 percent as aresult of declines in both busi-ness and nonbusiness cases,which decreased 11 percent and6 percent, respectively. This re-duction most likely stemmedfrom an improved business envi-ronment with fewer financiallytroubled businesses, particularlylarge businesses. Chapter 11,which accounted for less than 1
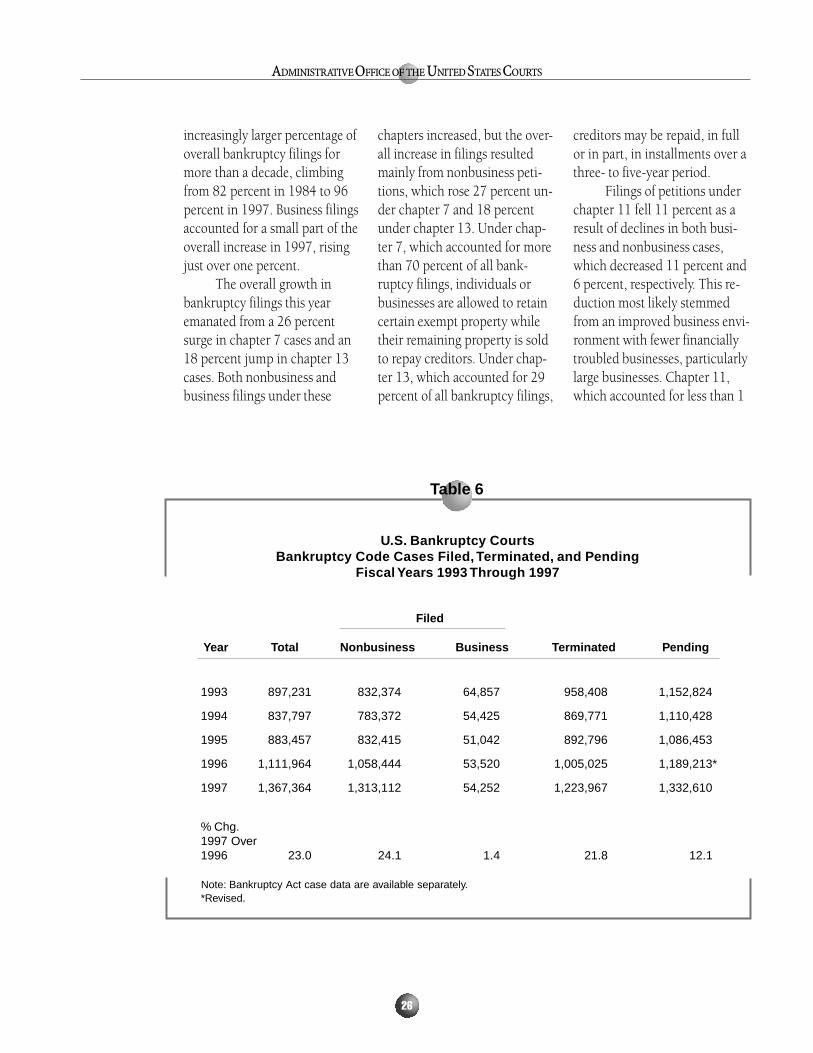
Table 6
U.S. Bankruptcy CourtsBankruptcy Code Cases Filed, Terminated, and Pending
Fiscal Years 1993 Through 1997
Filed
Year Total Nonbusiness Business Terminated Pending
1993 897,231 832,374 64,857 958,408 1,152,824
1994 837,797 783,372 54,425 869,771 1,110,428
1995 883,457 832,415 51,042 892,796 1,086,453
1996 1,111,964 1,058,444 53,520 1,005,025 1,189,213*
1997 1,367,364 1,313,112 54,252 1,223,967 1,332,610
% Chg.1997 Over1996 23.0 24.1 1.4 21.8 12.1
Note: Bankruptcy Act case data are available separately.*Revised.

JUDICIAL BUSINESS
27
percent of all bankruptcy filings,is generally used to allow abusiness to continue operationswhile formulating a plan to re-pay its creditors, although indi-viduals also may file under thischapter. Filings under chapter12 dropped 12 percent. Chapter12, which accounted for lessthan 0.1 percent of all bank-ruptcy filings, addresses theneeds of financially distressedfamily farmers.
Terminations of bank-ruptcy petitions jumped 22 per-cent to 1,223,967. Because fil-ings exceeded terminations bymore than 140,000 cases, thepending bankruptcy caseload
increased 12 percent to a totalof 1,332,610 cases pending asof September 30, 1997.
Filings of adversary pro-ceedings rose 3 percent to73,174 in 1997. Adversary pro-ceedings arise from bankruptcycases and include actions to ob-ject to or revoke discharges, ac-tions to determine thedischargeability of debts, andactions to obtain injunctions orother equitable relief. Althoughfilings of adversary proceedingsgrew overall, only 57 bank-ruptcy courts experienced in-creases, with 16 reporting risesgreater than 20 percent. Termi-nated adversary proceedings de-
clined 5 percent to 79,949, butbecause terminations exceededfilings, adversary cases pendingdropped 10 percent to 79,933as of September 30, 1997. Dataon adversary proceedings bydistrict appear in AppendixTable F-8.
P r o b a t i o nOn September 30, 1997, a
total of 91,434 persons wereunder the supervision of theU.S. probation system, a 3 per-cent increase over the numberreported for September 30,1996. This growth resulted pri-
U.S. Bankruptcy CourtsFilings by Chapter of the Bankruptcy Code
Fiscal Years 1993 Through 1997
Chapter
Year Total 7 11 12 13 Other
1993 897,231 621,071 20,111 1,355 254,667 27
1994 837,797 571,971 15,920 931 248,942 33
1995 883,457 598,250 12,639 883 271,650 35
1996 1,111,964 761,652 12,554 1,096 336,615 47
1997 1,367,364 958,045 11,221 966 397,097 35
% Chg.1997 Over1996 23.0 25.8 -10.6 -11.9 18.0 -25.5
Table 7

28
ADMINISTRATIVE OFFICE OF THE UNITED STATES COURTS
marily from an 11 percent jumpin the number of persons serv-ing terms of supervised releasefollowing their release fromprison. Persons serving terms ofsupervised release totaled51,036, up from 45,911 onSeptember 30, 1996. Overall,persons serving terms of super-vised release constituted 56 per-cent of all persons under super-vision, compared to 52 percentone year earlier. Cases involvingprobation imposed by district
judges declined 3 percent, thoseinvolving probation imposed bymagistrate judges declined 3percent, those involving parolefell 18 percent, and those in-volving mandatory releasedropped 17 percent.
The number of persons re-ceived for supervision (includ-ing transfers) fell 5 percent in1997 to 46,190, probably as aresult of a freeze in assistant U.S.district attorney positions fromApril 1993 to September 1994.
This freeze caused a 7 percentdecline from 1993 to 1995 inthe number of defendants im-prisoned after conviction. Be-cause nearly half of imprisoneddefendants receive prison termsof three years or less, the effectof this earlier decrease in per-sons imprisoned is now reflectedin the reduced numbers re-ceived for supervision. Unlikethe total for persons under su-pervision, the number of per-sons received for terms of super-
Table 8
Persons Under Supervision of the Federal Probation SystemFiscal Years 1993 Through 1997
Received Removed
Persons UnderTotal Less Total Less Supervision on
Year Total Transfers Total Transfers September 30
1993 48,722 41,275 48,032 40,568 86,823
1994 46,273 39,820 44,864 38,231 89,103
1995 45,163 38,745 45,041 38,879 85,822
1996 48,367 41,877 45,804 39,380 88,966
1997 46,190 40,117 44,757 39,024 91,434
% Chg. 1997Over 1996 -4.5 -4.2 -2.3 -.9 2.8
Note: The decrease in persons under supervision in 1995 resulted from a review of the probation statistical database, which identified and closed case records that had been coded incorrectly.

JUDICIAL BUSINESS
29
vised release remained stable at22,122. The number of personsreceived for all other forms ofsupervision declined 9 percent.Detailed probation data appearin Table 8 and in the E series ofthe appendix tables.
Investigative Reports
Probation officers pre-pared 172,806 investigative re-ports in 1997, nearly the samenumber they produced last year.The largest increases occurredfor reports addressing allegedviolations of probation and pa-role (up 3,088 reports), pre-
release investigations for fed-eral institutions (up 1,812 re-ports), and collateral reports forother districts (up 1,372 re-ports). Furlough/work-releasereports for Bureau of Prisons in-stitutions and supervision re-ports declined the most, drop-ping by 3,641 reports and1,996 reports, respectively. Thenumber of presentence reportsrose 1 percent (up 512 reports)despite a 6 percent increase incriminal convictions. This differ-ence mainly resulted from asubstantial increase in immigra-tion cases for which presentencereports are not normally pre-
pared. Table 9 presents data oninvestigative reports preparedby probation officers in 1996and 1997.
S u b s t a n c eA b u s eI d e n t i f i c a t i o nand TreatmentS e r v i c e s
Substance abuse servicesare available to federal offenderseither from local service provid-ers under contract to probationoffices or directly from proba-
Investigative Reports by Probation OfficersFiscal Years 1996 and 1997
PercentType of Investigation 1996 1997 Change
Total 173,054 172,806 -0.1
Presentence Report* 51,662 52,174 1.0
Collateral Report for Another District 33,589 34,961 4.1
Pretransfer (Probation and Parole) 6,590 6,088 -7.6
Alleged Violation (Probation and Parole) 26,759 29,847 11.5
Pre-Release for a Federal Institution 16,550 18,362 10.9
Special Regarding a Prisoner in Confinement 7,142 6,545 -8.4
Furlough/Work-Release
Report for Bureau of Prisons Institutions 8,792 5,151 -41.4
Supervision Report 20,473 18,477 -9.7
Parole Revocation 1,497 1,201 -19.8
*Presentence report includes postsentence-for-institution investigations.
Table 9

30
ADMINISTRATIVE OFFICE OF THE UNITED STATES COURTS
tion offices that can providethese services. The percentageof offenders receiving contractservices for drug and alcoholdependency rose to 60 percentin 1997, up from 57 percent in1996. Forty percent of all of-fenders receiving such servicesobtained them directly fromprobation offices. Of the drug-dependent clients, 62 percentreceived services from provid-ers under contract; 47 percentof the alcohol-dependent cli-ents received services from pro-viders under contract.
Supplemental Table S-16shows that the number of alco-hol- and drug-dependent of-fenders rose 3 percent in 1997to 23,604. The number of
drug-dependent offenders in-creased 7 percent to 20,713; thenumber of alcohol-dependentoffenders declined 15 percent to2,891.
Pre tr i a lS e r v i c e s
In 1997, the number ofdefendants activated in the pre-trial services system increased 9percent (up 5,786) to 69,283.This growth was consistent withthe rise in criminal defendantfilings in the district courts. Be-cause pretrial services officers(PSOs) collected, verified, andreported information on moredefendants, the number of inter-
views, bail hearings, bail re-ports, defendants supervised,and defendants detained alsorose. Judicial officers use thereports to decide whether torelease or detain defendants andto determine the least restrictiverelease conditions that offer rea-sonable assurance that defen-dants will honor future courtcommitments and will not en-danger community safety.
The PSOs interviewed 7percent more defendants (up3,553) and prepared 9 percentmore bail reports (up 5,620)than in 1996. Prebail reportsconstituted 92 percent of thebail reports prepared. The re-maining reports were providedto the courts for other hearings
Table 10
Summary of Pretrial CasesFiscal Years 1996 and 1997
Percent1996 1997 Change
Pretrial Cases Activated 63,497 69,283 9.1
Pretrial Diversion Cases Activated 2,198 2,402 9.3
Released on Supervision 30,502 30,757 .8
Type of Report
Prebail 55,331 60,892 10.1Postbail 4,005 3,939 -1.6Other 1,514 1,639 8.3No Report 2,647 2,813 6.3

JUDICIAL BUSINESS
31
in which pretrial services releasewas an issue, including hearingsheld for conviction and sentenc-ing. Table 10 presents data onpretrial services cases and re-ports for this year.
The courts released 37percent (25,343) of activateddefendants at initial hearingsand 13 percent (8,688) at de-tention hearings. This overall 50percent release rate was 2 per-centage points lower than therate for 1996. The decline isconsistent with the increase indistrict courts’ caseload involv-ing drugs and immigration, be-cause defendants charged withsuch offenses are more likely tobe detained. Of those released,30,757 defendants (90 percent)were placed into the custody ofPSOs; 27,785 of these defen-dants also received restrictiveconditions. For persons undersupervision, the PSOs moni-tored compliance with the re-lease conditions set by thecourts, provided necessary sup-port services, and informed thecourts and U.S. attorneys of allapparent violations of releaseconditions.
The most frequently or-dered restrictive conditions in-volved substance abuse andwere imposed on 16,536 defen-dants (up 6 percent). From1996 to 1997, the number ofdefendants receiving such con-ditions remained stable as a per-centage of all active defendants
(69,283 defendants), but rose 2percentage points as a percent-age of all defendants with re-strictive conditions (27,785 de-fendants).
House arrest and elec-tronic monitoring, which areless expensive alternatives to de-tention, were other restrictiveconditions ordered for 6 percent(4,747) of activated defendants,almost the same proportion aslast year. A defendant in thehouse arrest program must re-main in his or her residence be-tween specific hours. To ensurethat this requirement is hon-ored, some defendants mustwear ankle bracelets that areelectronically monitored by amonitoring center. If a defen-dant violates the confinementcondition, the center is notifiedautomatically and its staff inturn notifies the supervising of-ficers.
Pretrial diversion is an-other program intended to pre-serve prosecutorial and judicialresources for more seriouscriminal matters. Diversion is aperiod of supervision proposedby the U.S. attorney and agreedto by the defendant as an alter-native to prosecution of criminalcharges in federal court. In1997, a total of 2,402 defen-dants were placed in the pretrialdiversion program, equaling ap-proximately 3 percent of acti-vated cases, the same percentageas in 1996.
Defendants activated inthe pretrial servicessystem grew 9 percent.
The courts detained 34percent (23,863) of activateddefendants following de-tention hearings, onepercentage pointmore than in1996. In bothyears, detentionwas ordered for73 percent ofdefendants forwhom detentionhearings took place. Riskof flight was the primary reasoncited for 90 percent of defen-dants detained, the same as in1996.
Pretrial Services statisticsappear in the H series of the ap-pendix tables.
C o m p l a i n t sA g a i n s tJ u d i c i a lO f f i c e r s
Pursuant to 28 U.S.C.372(c), any person alleging thata circuit judge, a district judge,a bankruptcy judge, or a magis-trate judge has engaged in con-duct prejudicial to the effectiveand expeditious administrationof the business of the courts, oralleging that such an officer can-not discharge all the duties ofthe office because of physical ormental disability, may file acomplaint with the clerk of thecourt of appeals for that circuit

32
ADMINISTRATIVE OFFICE OF THE UNITED STATES COURTS
Judicial Complaints Filed, Concluded, and Pending
Percent Change
1995* 1996* 1997 1997 over 1996 1
Filed 567 529 679 28.4
Concluded 557 608 482 -20.7
By Chief Judges 401 359 270 -24.8Dismissed 387 349 263 -24.6Corrective Action Taken 12 3 2 —Withdrawn 2 7 5 —
By Judicial Councils 156 249 212 -14.9After Review of Chief Judge’s
Dismissal2
Dismissed 155 249 212 -14.9Action Taken 1 — — —Referred to Judicial Conference — — — —
After Report by Investigative CommitteeDismissed — — — —Action Taken — — — —Referred to Judicial Conference — — — —
Pending 188 109 306 180.7
1Percent not calculated for fewer than 10 cases.2Petition for review of a chief judge’s dismissal of a complaint.*Revised.
or for the applicable nationalcourt. The number of judicialcomplaints filed in 1997 totaled679, a 28 percent increase overthe previous year. Table 11 sum-marizes judicial complaints activ-ity from 1995 through 1997.
A single complaint may in-volve multiple allegations againstnumerous judicial officers. In1997, the Eighth and Ninth Cir-
cuits received an unusualnumber of complaints filedagainst multiple judges. Forthe judiciary as a whole, theallegations cited most oftenwere prejudice/bias, abuse ofjudicial power, and “other.”
Of the 482 complaintsterminated in 1997, chiefjudges dismissed 270 forwhich no petitions were filed
for review by judicial councils.Judicial councils terminated theremaining 212 complaints onpetitions for review, all of whichwere dismissed without any ac-tion taken. Eighty percent of thecomplaints dismissed by chiefjudges without the appointmentof a special committee werefound to be outside the jurisdic-tion of 28 U.S.C. 372(c) because
Table 11

JUDICIAL BUSINESS
33
they were directly related to themerits of the decisions or proce-dural rulings rendered by thejudges named in the com-plaints.
Status ofArticle IIIJ u d g e s h i p s
On September 30, 1997, atotal of 24 vacancies existedamong the 179 judgeships au-
thorized for the U.S. courts ofappeals, an increase of 33 per-cent over the previous year’s to-tal and more than twice thenumber of vacancies on Sep-tember 30, 1995. One of thesevacancies was in a position cre-ated on December 1, 1990, bythe Federal Judgeship Act of1990. That vacancy, along witheight others, had existed formore than 18 months. Table 12provides information on the sta-
tus of judgeship positions since1993.
On September 30, 1997,in the U.S. district courts, 69vacancies existed among the647 positions authorized, a riseof 57 percent over the total re-ported one year earlier. Of thesevacancies, 21 had existed for atleast 18 months; only 13 posi-tions had been vacant that longas of September 30, 1996. Twoof these vacancies once again in-volved new positions created by
Status of Judgeship Positions1993 Through 1997 1
U.S. Courts of Appeals 2 U.S. District Courts
Authorized Senior Authorized SeniorYear Judgeships Vacancies Judges 3 Judgeships Vacancies Judges 4
1993 179 20 72* 649 107 242
1994 179 18 81 649 60 292
1995 179 11 81 649 46 255
1996 179 18 82 647 44 274
1997 179 24 87 647 69 278
1 Data are as of September 30.2 Positions in the Court of Appeals for the Federal Circuit are included.3 Sitting senior judges who participated in appeals dispositions.4 Senior judges with staff.* Revised.
Table 12

34
ADMINISTRATIVE OFFICE OF THE UNITED STATES COURTS
the Federal Judgeship Act of1990.
In addition to activejudges, 87 senior appellatejudges and 278 senior districtjudges were serving to the judi-ciary on September 30, 1997.
Status ofB a n k r u p t c yJ u d g eA p p o i n t m e n t s
On September 30, 1997, atotal of 326 bankruptcy judge-ships were authorized andfunded. Of that number, 313bankruptcy judgeship positionswere filled and 13 were vacant.In addition to these positions,22 recalled bankruptcy judgeswere providing service to the ju-diciary on September 30, 1997.Table 13 summarizes the status
of bankruptcy judgeship posi-tions through September 30,1997.
A p p o i n t m e n tof MagistrateJ u d g e s
During fiscal year 1997, atotal of 35 full-time magistratejudges were appointed, 11 ofthem by reappointment. Of the24 new appointments, 12 werefor new positions. During thesame period, 19 individualswere appointed to part-timemagistrate judge positions, 14 ofthem by reappointment. Of thefive new part-time appoint-ments, two were new positions.
In 1997, the average ageof new appointees to full-timemagistrate judge positions was
48 years; the average age of newappointees to part-time magis-trate judge positions was 40years. New full-time appointeeshad been members of the bar foran average of 20 years at thetime of appointment; part-timemagistrate judges averaged 13years of bar membership. Of thenew full-time magistrate judges,15 had been in private practiceand 3 had been assistant U.S. at-torneys. Other new appointeesincluded a part-time U.S. magis-trate judge, a state superiorcourt judge, a state circuitjudge, a state district judge, astate common pleas court judge,and a federal public defender.
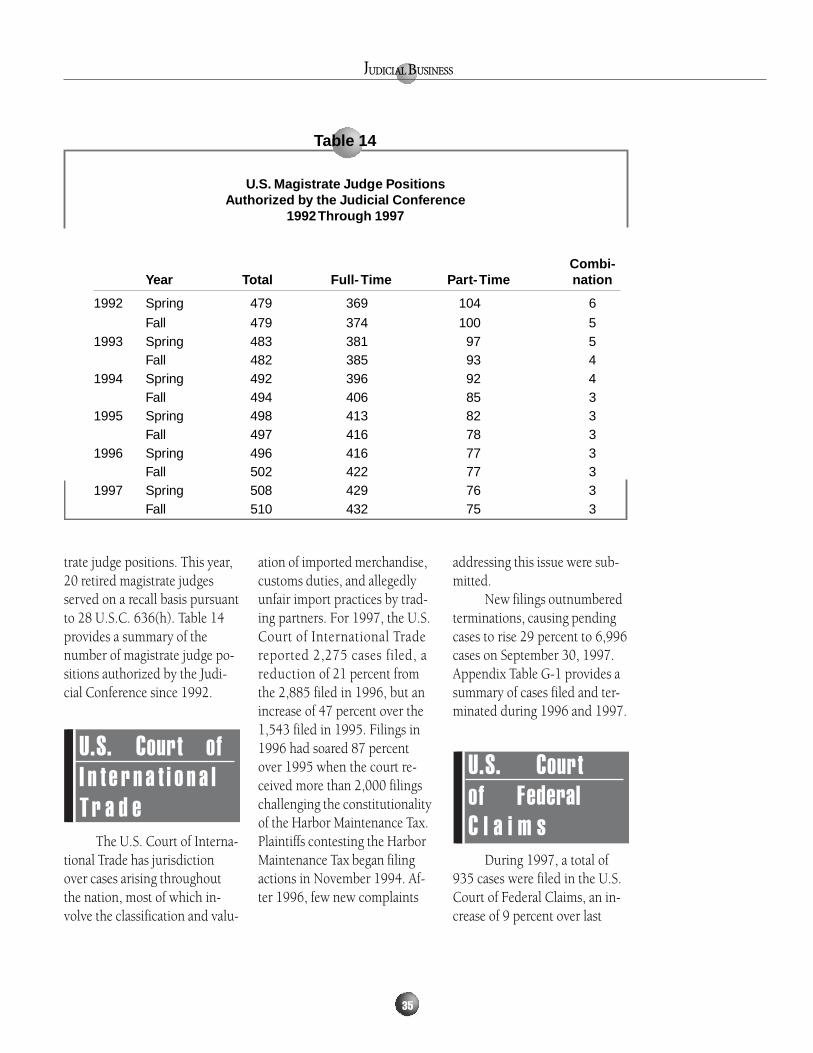
Through its September1997 session, the Judicial Con-ference authorized 432 full-timemagistrate judge positions, 75part-time positions, and 3 com-bination clerk of court/magis-
Status of Bankruptcy Judgeship Positions
Authorized RecalledYear Judgeships Vacancies Judges
1993 326 2 12
1994 326 12 22
1995 326 11 23
1996 326 13 23
1997 326 13 22
Table 13
JUDICIAL BUSINESS
35
U.S. Magistrate Judge PositionsAuthorized by the Judicial Conference
1992 Through 1997
Combi-Year Total Full- Time Part- Time nation
1992 Spring 479 369 104 6
Fall 479 374 100 51993 Spring 483 381 97 5
Fall 482 385 93 41994 Spring 492 396 92 4
Fall 494 406 85 31995 Spring 498 413 82 3
Fall 497 416 78 31996 Spring 496 416 77 3
Fall 502 422 77 31997 Spring 508 429 76 3
Fall 510 432 75 3
trate judge positions. This year,20 retired magistrate judgesserved on a recall basis pursuantto 28 U.S.C. 636(h). Table 14provides a summary of thenumber of magistrate judge po-sitions authorized by the Judi-cial Conference since 1992.
U.S. Court ofI n t e r n a t i o n a lT r a d e
The U.S. Court of Interna-tional Trade has jurisdictionover cases arising throughoutthe nation, most of which in-volve the classification and valu-
ation of imported merchandise,customs duties, and allegedlyunfair import practices by trad-ing partners. For 1997, the U.S.Court of International Tradereported 2,275 cases filed, areduction of 21 percent fromthe 2,885 filed in 1996, but anincrease of 47 percent over the1,543 filed in 1995. Filings in1996 had soared 87 percentover 1995 when the court re-ceived more than 2,000 filingschallenging the constitutionalityof the Harbor Maintenance Tax.Plaintiffs contesting the HarborMaintenance Tax began filingactions in November 1994. Af-ter 1996, few new complaints
addressing this issue were sub-mitted.
New filings outnumberedterminations, causing pendingcases to rise 29 percent to 6,996cases on September 30, 1997.Appendix Table G-1 provides asummary of cases filed and ter-minated during 1996 and 1997.
U.S. Courtof FederalC l a i m s
During 1997, a total of935 cases were filed in the U.S.Court of Federal Claims, an in-crease of 9 percent over last
Table 14

36
ADMINISTRATIVE OFFICE OF THE UNITED STATES COURTS
year’s 857 filings. This growthconsisted primarily of tax claimsand vaccine injury compensa-tion petitions. Tax filings rose to263 (up 69 cases). Vaccine in-
jury compensation actionsjumped from 88 in 1996 to 107in 1997, most likely becausethree additional vaccines wereadded to those covered underthe National Vaccine InjuryCompensation Act of 1988. The1,010 case terminations out-numbered filings, which helpedreduce the pending caseload 2percent from 3,023 on October1, 1996, to 2,948 one year later.
For actions terminated in1997, judgments rendered forclaimants totaled $757.8 mil-lion, of which $199.1 millioncarried interest. Judgments ren-dered for the United States oncounterclaims or offsets totaled$36.6 million. In nonmonetaryactions under its jurisdiction,the court disposed of 28 con-tract cases seeking injunctive ordeclaratory relief, a 15-case in-crease that more than doubled
the number disposed of lastyear. This growth occurred be-cause in 1997 Congress ex-panded the court’s jurisdictionto include procurement cases inwhich disappointed bidders forfederal contracts file post-awardactions. Previously, all federalpost-award actions were re-viewed by the U.S. districtcourts, and the Court of FederalClaims reviewed only those ac-tions brought before contractswere awarded.
Pursuant to 28 U.S.C.791(c), each January the clerkof the court transmits to theU.S. Congress a report of thebusiness of the court, whichnotes the names of the claim-ants, the nature of the claims,and their disposition. AppendixTables G-2A and G-2B providesummary data on the caseloadof Court of Federal Claims forthe year ending September 30,1997.