executive director’s report caseload as of january 31, 2015 1,767 total caseload as of december...
TRANSCRIPT

EXECUTIVE DIRECTOR’S REPORT FEBRUARY 2015
STATISTICAL REPORT: JANUARY 2015
A. DISPOSITION OF CASES
FULL INVESTIGATIONS 134 OTHER INVESTIGATIONS 124 MEDIATIONS 22 MEDIATIONS 0 OTHER 12 TOTAL 292
B. INTAKE
CIVILIAN COMPLAINT REVIEW BOARD 271 REFERRALS - CHIEF OF DEPARTMENT’S OFFICE 375 OTHER REFERRALS 57 TOTAL 703
C. DOCKET
TOTAL CASELOAD AS OF JANUARY 31, 2015 1,767 TOTAL CASELOAD AS OF DECEMBER 31, 2014 1,788 DECREASE IN TOTAL CASELOAD 21
D. AGE OF CCRB CASES BASED ON DATE OF REPORT # COUNT
THIS MONTH
% OF TOTAL
# COUNT LAST
MONTH % OF
TOTAL
THIS MTH. Vs. LAST
MTH. %
CHANGE CASES 0-4 MONTHS 1,028 58.2% 1,060 64.6% -32 -3.0% CASES 5-7 MONTHS 386 21.8% 413 17.9% -27 -6.5% CASES 8 MONTHS 98 5.5% 75 4.3% 23 30.7% CASES 9 MONTHS 64 3.6% 69 4.0% -5 -7.2% CASES 10 MONTHS 60 3.4% 56 1.5% 4 7.1% CASES 11 MONTHS 42 2.4% 53 0.8% -11 -20.8% CASES 12 MONTHS 44 2.5% 15 1.0% 29 193.3% CASES 13 MONTHS 14 0.8% 15 0.9% -1 -6.7% CASES 14 MONTHS 12 0.7% 10 1.7% 2 20.0% CASES 15 MONTHS 6 0.3% 13 1.2% -7 -53.8% CASES 16 MONTHS 5 0.3% 3 1.0% 2 66.7% CASES 17 MONTHS 2 0.1% 1 0.8% 1 100.0% CASES 18 MONTHS 0 0.0% 1 0.0% -1 -100.0% CASES OVER 18 6 0.3% 4 0.3% 2 50.0% TOTAL 1,767 100.0% 1,788 100.0% -21 -1.2%
1

E. AGE OF CCRB CASES BASED ON DATE OF OCCURRENCE # COUNT
THIS MONTH % OF TOTAL
# COUNT LAST
MONTH % OF
TOTAL
THIS MTH. Vs. LAST
MTH. %
CHANGE CASES 0-4 MONTHS 926 52.4% 963 53.9% -37 -3.8% CASES 5-7 MONTHS 415 23.5% 440 24.6% -25 -5.7% CASES 8 MONTHS 110 6.2% 85 4.8% 25 29.4% CASES 9 MONTHS 72 4.1% 70 3.9% 2 2.9% CASES 10 MONTHS 61 3.5% 60 3.4% 1 1.7% CASES 11 MONTHS 44 2.5% 70 3.9% -26 -37.1% CASES 12 MONTHS 60 3.4% 21 1.2% 39 185.7% CASES 13 MONTHS 18 1.0% 25 1.4% -7 -28.0% CASES 14 MONTHS 21 1.2% 15 0.8% 6 40.0% CASES 15 MONTHS 11 0.6% 13 0.7% -2 -15.4% CASES 16 MONTHS 9 0.5% 7 0.4% 2 28.6% CASES 17 MONTHS 4 0.2% 6 0.3% -2 -33.3% CASES 18 MONTHS 2 0.1% 0 0.0% 2 100.0% CASES OVER 18 6 0.3% 5 0.3% 1 20.0% UNDETERMINED 8 0.5% 8 0.4% 0 0.0% TOTAL 1,767 100% 1,788 100% -21 -1.2%
F. STATUS OF OPEN CASES
NUMBER % OF TOTAL INVESTIGATIONS DIVISION 961 54.4% MEDIATION UNIT 146 8.3% PENDING BOARD REVIEW 660 37.4%
TOTAL 1,767 100%
2

CCRB COMPLAINT DATA JANUARY 2015
3

252 244
157
24
450
153 152
74
18
271
0
50
100
150
200
250
300
350
400
450
500
Force (F) Abuse of Authority (A) Discourtesy (D) Offensive Language (O) Total Complaints
Chart 1: Complaints and FADO Allegations, Jan 2014 vs Jan 2015
J 2014 J 2015
4

450
417
444
467
439
483
426
386
348 343
295 284
271
250
300
350
400
450
500
550
Jan Feb March April May June July Aug Sept Oct Nov Dec Jan
Chart 2: Complaints per Month, Jan 2014 - Jan 2015
5

6.60
7.10
6.20
3.40
5.60
0.00
1.00
2.00
3.00
4.00
5.00
6.00
7.00
8.00
Manhattan Bronx Brooklyn Queens Staten Island
Chart 3: Complaints per 10,000 Residents, By Borough, Jan 2014 - Jan 2015
6

Manhattan, 1,128, 23%
Bronx, 1,083, 22%
Brooklyn, 1,673, 33%
Queens, 835, 17%
Staten Island, 278, 5%
Chart 4: Complaints by Borough, Jan 2014 - Jan 2015
7

Number Percent of total Number Percent of totalNumber
differencePercent
difference
Force (F) 434 32.2% 234 34.4% -200 -46.1%Abuse of Authority (A) 678 50.3% 340 49.9% -338 -49.9%Discourtesy (D) 209 15.5% 82 12.0% -127 -60.8%Offensive Language (O) 26 1.9% 25 3.7% -1 -3.8%Total Allegations 1,347 100.0% 681 100.0% -666 -49.4%Total Complaints 450 271 -179 -39.8%Total Intake 978 703 -275 -28.1%
Number Percent of total Number Percent of totalNumber
differencePercent
difference
Force (F) 252 56.0% 153 56.5% -99 -39.3%Abuse of Authority (A) 244 54.2% 152 56.1% -92 -37.7%Discourtesy (D) 157 34.9% 74 27.3% -83 -52.9%Offensive Language (O) 24 5.3% 18 6.6% -6 -25.0%Total Complaints 450 271 -179 -39.8%
Total Allegations Received Year-to-DateJanuary 2014 v. January 2015
Jan-14 Jan-15 CHANGE
Total Allegations Received this MonthJanuary 2014 v. January 2015
Jan-14 Jan-15 CHANGE
Jan-15
Types of Allegations in Complaints Received*January 2014 v. January 2015
CHANGEJan-14
*Cases that include one or more of a specific FADO allegation type. For example, 56% of cases received in 2015 included one or more allegations of force.
8

Initially Reported
December 2014
Updated December 2014
Complaint Filings
Change in number of complaints Percent difference
Total Complaints 283 284 1 0.4%
Initially Reported
December 2014
Updated December 2014
Complaint Filings
Change in number of complaints Percent difference
Total Complaints 4,779 4,779 0 0.0%
Number Percent of total Number Percent of totalNumber
difference Percent difference
Force (F) 295 30.4% 240 30.3% -55 -18.6%Abuse of Authority (A) 482 49.7% 418 52.8% -64 -13.3%Discourtesy (D) 168 17.3% 101 12.8% -67 -39.9%Offensive Language (O) 24 2.5% 33 4.2% 9 37.5%Total Allegations 969 100.0% 792 100.0% -177 -18.3%Total Complaints 384 284 -100 -26.0%Total Intake 872 772 -100 -11.5%
Number Percent of total Number Percent of totalNumber
difference Percent difference
Force (F) 4,691 31.7% 4,469 30.1% -222 -4.7%Abuse of Authority (A) 7,068 47.7% 7,484 50.4% 416 5.9%Discourtesy (D) 2,570 17.4% 2,387 16.1% -183 -7.1%Offensive Language (O) 475 3.2% 498 3.4% 23 4.8%Total Allegations 14,804 100.0% 14,838 100.0% 34 0.2%Total Complaints 5,388 4,779 -609 -11.3%Total Intake 11,536 12,544 1,008 8.7%
Number Percent of total Number Percent of totalNumber
difference Percent difference
Force (F) 2,793 51.8% 2,435 51.0% -358 -12.8%Abuse of Authority (A) 3,069 57.0% 2,915 61.0% -154 -5.0%Discourtesy (D) 2,074 38.5% 1,809 37.9% -265 -12.8%Offensive Language (O) 430 8.0% 429 9.0% -1 -0.2%Total Complaints 5,388 4,779 -609 -11.3%
Jan-December 2013 v. Jan-December 2014
Jan-Dec 2013 Jan-Dec 2014 CHANGE
*Cases that include one or more of a specific FADO allegation type. For example, 52% of cases received YTD 2014 included one or more allegations of force.
Types of Allegations in Complaints Received*Jan-December 2013 v. Jan-December 2014
Jan-Dec 2013 Jan-Dec 2014 CHANGE
Total Allegations Received Year-to-Date
Dec-14
Updated December and Jan-December 2014 Complaint Statistics
Updated Statistical ComparisonTotal Allegations Received this Month
December 2013 v. December 2014
Dec-13 CHANGE
9

CCRB OPEN DOCKET ANALYSIS JANUARY 2015
10
NumberDate of incident Date received
Difference between received
and incident (days) SOL Month Status
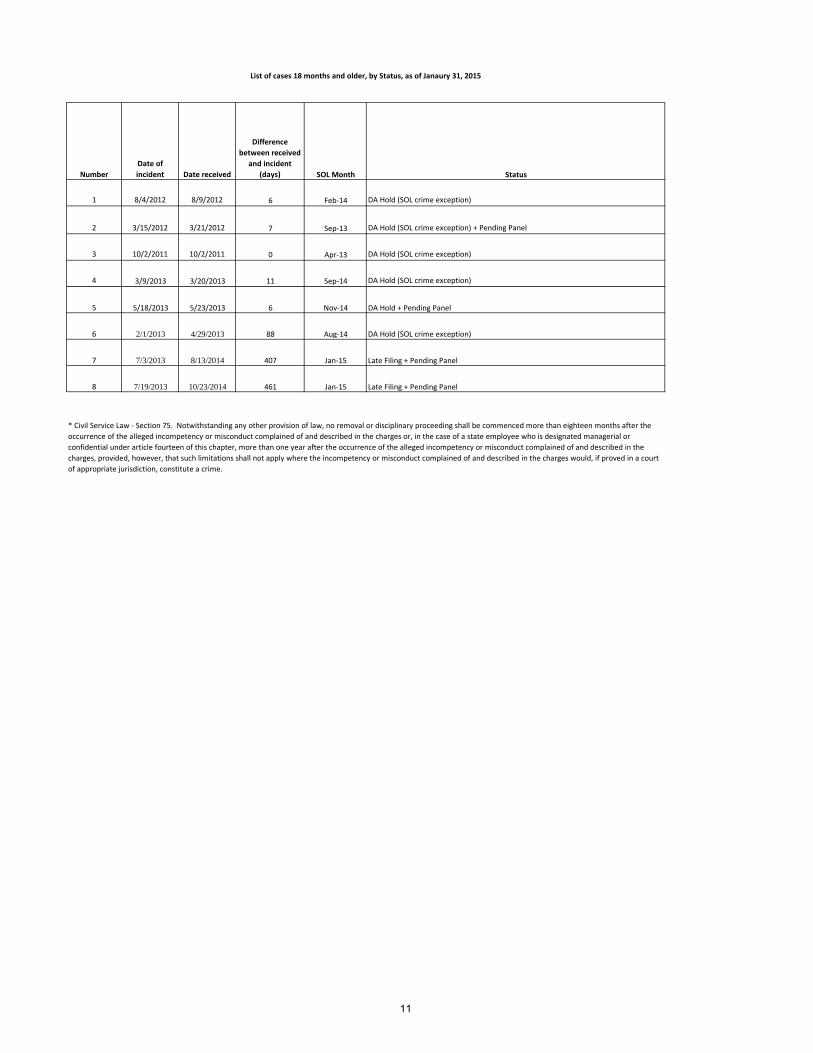
1 8/4/2012 8/9/2012 6 Feb-14 DA Hold (SOL crime exception)
2 3/15/2012 3/21/2012 7 Sep-13 DA Hold (SOL crime exception) + Pending Panel
3 10/2/2011 10/2/2011 0 Apr-13 DA Hold (SOL crime exception)
4 3/9/2013 3/20/2013 11 Sep-14 DA Hold (SOL crime exception)
5 5/18/2013 5/23/2013 6 Nov-14 DA Hold + Pending Panel
6 2/1/2013 4/29/2013 88 Aug-14 DA Hold (SOL crime exception)
7 7/3/2013 8/13/2014 407 Jan-15 Late Filing + Pending Panel
8 7/19/2013 10/23/2014 461 Jan-15 Late Filing + Pending Panel
List of cases 18 months and older, by Status, as of Janaury 31, 2015
* Civil Service Law - Section 75. Notwithstanding any other provision of law, no removal or disciplinary proceeding shall be commenced more than eighteen months after theoccurrence of the alleged incompetency or misconduct complained of and described in the charges or, in the case of a state employee who is designated managerial or confidential under article fourteen of this chapter, more than one year after the occurrence of the alleged incompetency or misconduct complained of and described in the charges, provided, however, that such limitations shall not apply where the incompetency or misconduct complained of and described in the charges would, if proved in a court of appropriate jurisdiction, constitute a crime.
11

1586
478
146 100 91
54 52 35 26 43 30 31 15 12
926
415
110 72 61 44 60
18 21 11 9 4 2 6 0
200
400
600
800
1000
1200
1400
1600
1800
CASES 0-4MONTHS
CASES 5-7MONTHS
CASES 8MONTHS
CASES 9MONTHS
CASES 10MONTHS
CASES 11MONTHS
CASES 12MONTHS
CASES 13MONTHS
CASES 14MONTHS
CASES 15MONTHS
CASES 16MONTHS
CASES 17MONTHS
CASES 18MONTHS
CASESOVER 18
Chart 5: Open Docket Change, Jan 2014 vs Jan 2015
Jan-14 Jan-15
12

1,858 1,869 1,899
1,966 1,964
1,838 1,833 1,834
1,586 1,546
1,311
1,125
961
800
1000
1200
1400
1600
1800
2000
2200
Jan Feb March April May June July Aug Sept Oct Nov Dec Jan
Chart 6: Open Docket, Investigations Division, Jan 2014 vs Jan 2015
13

CCRB DISPOSITION DATA JANUARY 2015*
* Board case dispositions may occasionally change. If a complainant or other civilian, police officer, or the police department has new evidence or reasons to reconsider a finding, they may write to the Board to request that a case be reopened and re-evaluated, giving the reasons for the reevaluation. The CCRB will adjust statistics accordingly and note any changes that may result from such reconsiderations.

Full Investigations 37%
Mediation 7%
Truncated investigations 56%
Chart 7a: Case Dispositions, 2014
15

Full Investigations 48%
Mediation 8%
Truncated investigations 44%
Chart 7b: Case Dispositions, Jan 2015
16
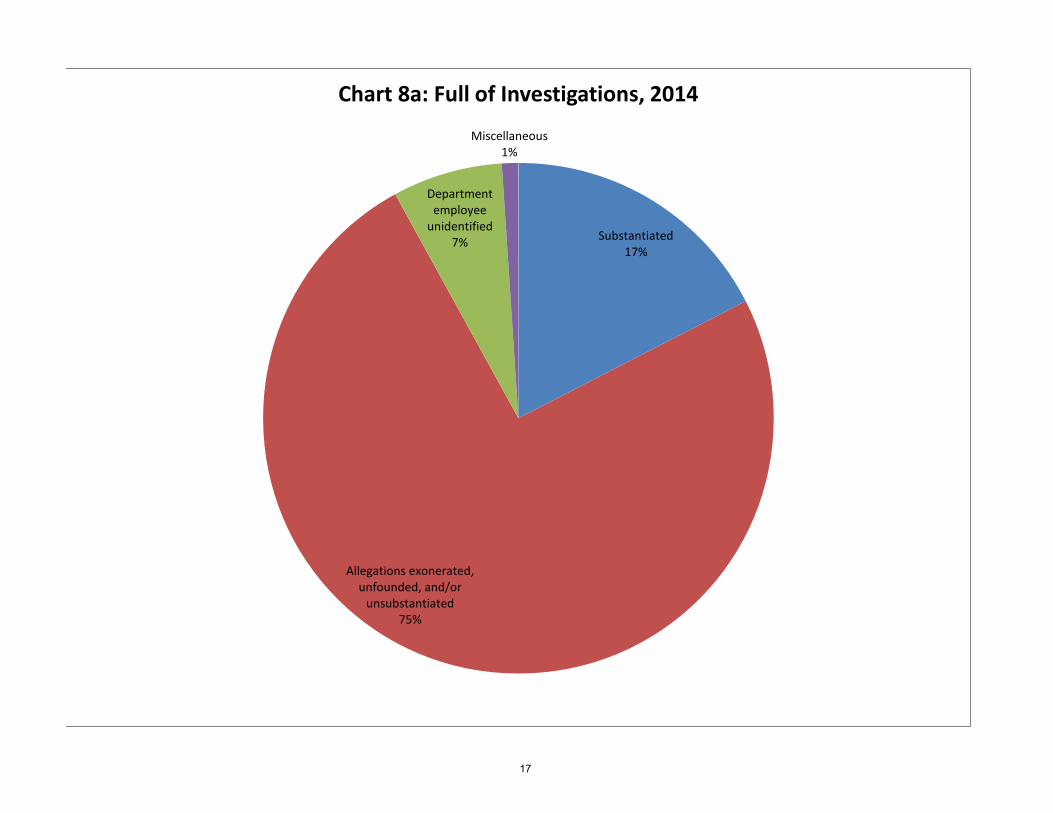
Substantiated 17%
Allegations exonerated, unfounded, and/or
unsubstantiated 75%
Department employee
unidentified 7%
Miscellaneous 1%
Chart 8a: Full of Investigations, 2014
17

Substantiated 16%
Allegations exonerated, unfounded, and/or
unsubstantiated 80%
Department employee unidentified
4% Miscellaneous
0%
Chart 8b: Full of Investigations, Jan 2015
18

Case disposition
Full Investigations Number Percent Number PercentOne or more allegations substantiated 21 15.7% 335 17.4%Allegations exonerated, unfounded, and/or unsubstantiated 107 79.9% 1,433 74.6%Department employee unidentified 6 4.5% 134 7.0%Refer to IAB 0 0.0% 0 0.0%Miscellaneous 0 0.0% 20 1.0%Total - Full Investigations 134 100% 1,922 100%
Mediation Closures Number Percent Number PercentMediated 22 100.0% 182 47.0%Mediation attempted 0 0.0% 205 53.0%Total - ADR Closures 22 100% 387 100%
Case Resolution Rate 156 55.7% 2,309 43.7%
Other Case DispositionsComplaint withdrawn 2 0.7% 483 9.1%Complainant/victim/witness uncooperative 88 31.4% 1,893 35.8%Complainant/victim/witness unavailable 34 12.1% 577 10.9%Victim unidentified 0 0.0% 19 0.4%
Total Closed Cases 280 5,281
Jan-15 Jan-Dec 2014
Jan-Dec 2014
Jan-Dec 2014
Percents Below are Percentages of all Cases Closed after Full Investigation
Jan-15
Jan-15
19

Full Investigations Number Percent Number PercentSubstantiated - Charges 15 3.0% 442 5.9%Substantiated - Command discipline 11 2.2% 209 2.8%Substantiated - Instructions 13 2.6% 109 1.4%Substantiated - No recommendations 0 0.0% 5 0.1%Subtotal - Substantiated Allegations 39 7.9% 765 10.2%Unfounded 48 9.8% 604 8.0%Employee exonerated 114 23.2% 1,714 22.8%Subtotal - Findings on the Merits 201 40.9% 3,083 40.9%Unsubstantiated 237 48.2% 3,333 44.3%Department employee unidentified 52 10.6% 981 13.0%Miscellaneous 2 0.4% 135 1.8%Refer to IAB 0 0.0% 0 0.0%Total 492 100% 7,532 100%
Mediation Closures Number Percent Number PercentMediated 44 100.0% 377 47.1%Mediation attempted 0 0.0% 424 52.9%
Total 44 100% 801 100%
Other DispositionsComplaint withdrawn 2 0.2% 903 6.0%Complainant/victim/witness uncooperative 227 27.8% 4,705 31.2%Complainant/victim/witness unavailable 47 5.8% 1,077 7.1%Victim unidentified 4 0.5% 67 0.4%
Total Closed Allegations 816 15,085
Jan-15 Jan-Dec 2014
Percents Below are Percentages of all Closed Allegations
Jan-Dec 2014Jan-15
Percents Below are Percentages of all Allegations Closed after Full Investigation
Percents Below are Percentages of all Mediation Allegations
Jan-15 Jan-Dec 2014
20

Disposition of Substantiated Cases
Substantiated Cases Number Percent Number PercentSubstantiated - Charges 19 36.5% 169 50.4%Substantiated - Command Discipline 22 42.3% 99 29.6%Substantiated - Instructions 11 21.2% 65 19.4%Substantiated - No Recommendation 0 0.0% 2 0.6%Total 52 100% 335 100%
Percents Below are Percentages of all Substantiated CasesJan-15 Jan-Dec 2014
21

Disposition of Force Allegations, 2014
Number Rate Number Rate Number Rate Number Rate Number Rate Number RateGun fired 0 0.0% 1 50.0% 1 50.0% 0 0.0% 0 0.0% 0 0.0%Gun pointed 4 2.0% 120 60.0% 39 19.5% 18 9.0% 17 8.5% 2 1.0%Nightstick as club (incl asp & baton) 1 1.1% 35 37.2% 19 20.2% 20 21.3% 17 18.1% 2 2.1%Gun as club 0 0.0% 0 0.0% 5 45.5% 4 36.4% 2 18.2% 0 0.0%Police shield 0 0.0% 0 0.0% 3 60.0% 0 0.0% 1 20.0% 1 20.0%Vehicle 3 20.0% 3 20.0% 6 40.0% 2 13.3% 1 6.7% 0 0.0%Other blunt instrument as a club 2 8.7% 2 8.7% 8 34.8% 8 34.8% 3 13.0% 0 0.0%Hit against inanimate object 5 8.1% 10 16.1% 26 41.9% 11 17.7% 9 14.5% 1 1.6%Chokehold 6 4.7% 0 0.0% 58 45.7% 39 30.7% 23 18.1% 1 0.8%Pepper spray 6 6.3% 59 61.5% 12 12.5% 9 9.4% 8 8.3% 2 2.1%Physical force 46 3.2% 529 37.0% 495 34.6% 184 12.9% 158 11.0% 19 1.3%Radio as club 0 0.0% 1 16.7% 1 16.7% 3 50.0% 1 16.7% 0 0.0%Flashlight as club 0 0.0% 1 16.7% 4 66.7% 0 0.0% 1 16.7% 0 0.0%Handcuffs too tight 1 3.6% 0 0.0% 20 71.4% 3 10.7% 4 14.3% 0 0.0%Nonlethal restraining device 1 4.8% 17 81.0% 0 0.0% 3 14.3% 0 0.0% 0 0.0%Animal 0 0.0% 1 50.0% 0 0.0% 0 0.0% 0 0.0% 1 50.0%Other 0 0.0% 5 23.8% 6 28.6% 7 33.3% 3 14.3% 0 0.0%Total 75 3.5% 784 36.5% 703 32.7% 311 14.5% 248 11.5% 29 1.3%
* "Physical force" includes: dragged/pulled, pushed/shoved/threw, punch/kicked/kneed, slapped and bit.
Unfounded Officer Unidentified MiscellaneousType of Force Allegation
Substantiated Exonerated Unsubstantiated
22

Disposition of Abuse of Authority Allegations, 2014
Number Rate Number Rate Number Rate Number Rate Number Rate Number RateQuestion 17 19.1% 34 38.2% 24 27.0% 2 2.2% 11 12.4% 1 1.1%Stop 103 21.9% 138 29.4% 169 36.0% 4 0.9% 48 10.2% 8 1.7%Search 61 14.5% 36 8.6% 237 56.3% 7 1.7% 73 17.3% 7 1.7%Frisk 99 27.7% 64 17.9% 126 35.3% 4 1.1% 58 16.2% 6 1.7%Vehicle search 59 19.2% 72 23.5% 133 43.3% 2 0.7% 33 10.7% 8 2.6%Vehicle stop 18 10.8% 39 23.4% 87 52.1% 0 0.0% 19 11.4% 4 2.4%Premises entered and/or searched 74 15.3% 262 54.2% 113 23.4% 4 0.8% 24 5.0% 6 1.2%strip-searched 7 5.9% 18 15.1% 68 57.1% 5 4.2% 17 14.3% 4 3.4%Gun Drawn 0 0.0% 36 52.2% 17 24.6% 5 7.2% 10 14.5% 1 1.4%Seizure of property 3 13.6% 8 36.4% 8 36.4% 1 4.5% 2 9.1% 0 0.0%Property damaged 4 4.9% 9 11.0% 40 48.8% 7 8.5% 22 26.8% 0 0.0%Threat to notify ACS 2 8.7% 11 47.8% 9 39.1% 0 0.0% 1 4.3% 0 0.0%Threat of force 11 4.8% 30 13.0% 126 54.5% 19 8.2% 40 17.3% 5 2.2%Threat to damage/seize property 4 10.3% 6 15.4% 22 56.4% 0 0.0% 7 17.9% 0 0.0%Threat of arrest 22 7.4% 72 24.2% 140 47.1% 10 3.4% 44 14.8% 9 3.0%Threat of summons 2 11.8% 7 41.2% 5 29.4% 1 5.9% 2 11.8% 0 0.0%Retaliatory arrest 8 88.9% 0 0.0% 1 11.1% 0 0.0% 0 0.0% 0 0.0%Retaliatory summons 24 85.7% 0 0.0% 3 10.7% 0 0.0% 0 0.0% 1 3.6%Refusal to process civilian complaint 10 30.3% 0 0.0% 17 51.5% 0 0.0% 5 15.2% 1 3.0%Refusal to provide name/shield number 36 9.0% 2 0.5% 271 67.6% 40 10.0% 43 10.7% 9 2.2%Refusal to obtain medical treatment 14 10.7% 0 0.0% 76 58.0% 15 11.5% 22 16.8% 4 3.1%Failure to show search warrant 2 7.4% 0 0.0% 18 66.7% 3 11.1% 4 14.8% 0 0.0%Improper dissemination of medical info 0 0.0% 0 0.0% 0 0.0% 0 0.0% 0 0.0% 0 0.0%Other 17 34.0% 4 8.0% 22 44.0% 0 0.0% 7 14.0% 0 0.0%Total 597 15.4% 848 21.9% 1732 44.7% 129 3.3% 492 12.7% 74 1.9%
Unfounded Officer Unidentified MiscellaneousType of Abuse of Authority Allegation Substantiated Exonerated Unsubstantiated
23

Disposition of Discourtesy Allegations, 2014
Number Rate Number Rate Number Rate Number Rate Number Rate Number RateWord 68 5.9% 82 7.1% 688 59.3% 117 10.1% 183 15.8% 23 2.0%Gesture 1 9.1% 0 0.0% 8 72.7% 0 0.0% 1 9.1% 1 9.1%Demeanor/tone 0 0.0% 0 0.0% 1 25.0% 3 75.0% 0 0.0% 0 0.0%Action 9 9.0% 0 0.0% 62 62.0% 10 10.0% 17 17.0% 2 2.0%Other 0 0.0% 0 0.0% 0 0.0% 0 0.0% 0 0.0% 0 0.0%Total 78 6.1% 82 6.4% 759 59.5% 130 10.2% 201 15.8% 26 2.0%
Disposition of Offensive Language Allegations, 2014
Number Rate Number Rate Number Rate Number Rate Number Rate Number RateRace 4 3.7% 0 0.0% 67 62.0% 17 15.7% 17 15.7% 3 2.8%Ethnicity 3 8.6% 0 0.0% 20 57.1% 6 17.1% 6 17.1% 0 0.0%Religion 1 9.1% 0 0.0% 6 54.5% 1 9.1% 1 9.1% 2 18.2%Sex 5 12.8% 0 0.0% 21 53.8% 3 7.7% 9 23.1% 1 2.6%Sexual Orientation 2 8.7% 0 0.0% 15 65.2% 3 13.0% 3 13.0% 0 0.0%Physical Disability 0 0.0% 0 0.0% 5 83.3% 0 0.0% 1 16.7% 0 0.0%Other 0 0.0% 0 0.0% 5 41.7% 4 33.3% 3 25.0% 0 0.0%Total 15 6.4% 0 0.0% 139 59.4% 34 14.5% 40 17.1% 6 2.6%
Officer Unidentified
Officer Unidentified
MiscellaneousType of Discourtesy Allegation
Substantiated Exonerated Unsubstantiated Unfounded
MiscellaneousType of Offensive Language Allegation
Substantiated Exonerated Unsubstantiated Unfounded
24

Disposition of Force Allegations, 2014
Number Rate Number Rate Number Rate Number RateGun fired 0 0.0% 2 66.7% 1 33.3% 0 0.0%Gun pointed 7 6.9% 85 83.3% 8 7.8% 2 2.0%Nightstick as club (incl asp & baton) 5 5.2% 58 60.4% 30 31.3% 3 3.1%Gun as club 0 0.0% 6 100.0% 0 0.0% 0 0.0%Police shield 0 0.0% 2 100.0% 0 0.0% 0 0.0%Vehicle 1 7.1% 9 64.3% 4 28.6% 0 0.0%Other blunt instrument as a club 0 0.0% 11 64.7% 6 35.3% 0 0.0%Hit against inanimate object 6 7.9% 58 76.3% 12 15.8% 0 0.0%Chokehold 9 8.3% 78 71.6% 20 18.3% 2 1.8%Pepper spray 2 2.8% 53 74.6% 15 21.1% 1 1.4%Physical force 144 8.4% 1092 64.0% 457 26.8% 13 0.8%Radio as club 0 0.0% 11 100.0% 0 0.0% 0 0.0%Flashlight as club 1 20.0% 3 60.0% 1 20.0% 0 0.0%Handcuffs too tight 3 8.8% 29 85.3% 2 5.9% 0 0.0%Nonlethal restraining device 3 8.6% 23 65.7% 9 25.7% 0 0.0%Animal 0 0.0% 0 0.0% 0 0.0% 0 0.0%Other 3 15.8% 9 47.4% 7 36.8% 0 0.0%Total 184 8.0% 1529 66.3% 572 24.8% 21 0.9%
* "Physical force" includes: dragged/pulled, pushed/shoved/threw, punch/kicked/kneed, slapped and bit.
civilian unidentifiedType of Force Allegation Withdrawn Uncooperative Unavailable
25

Disposition of Abuse of Authority Allegations, 2014
Number Rate Number Rate Number Rate Number RateQuestion 10 16.7% 43 71.7% 6 10.0% 1 1.7%Stop 65 14.5% 310 69.2% 65 14.5% 8 1.8%Search 50 13.5% 273 73.8% 43 11.6% 4 1.1%Frisk 23 12.4% 129 69.4% 26 14.0% 8 4.3%Vehicle search 25 14.3% 138 78.9% 12 6.9% 0 0.0%Vehicle stop 24 15.3% 109 69.4% 23 14.6% 1 0.6%Premises entered and/or searched 61 17.6% 257 74.1% 29 8.4% 0 0.0%strip-searched 9 9.3% 79 81.4% 9 9.3% 0 0.0%Gun Drawn 12 18.8% 45 70.3% 7 10.9% 0 0.0%Seizure of property 2 15.4% 11 84.6% 0 0.0% 0 0.0%Property damaged 16 13.0% 93 75.6% 14 11.4% 0 0.0%Threat to notify ACS 4 25.0% 11 68.8% 1 6.3% 0 0.0%Threat of force 26 13.0% 147 73.5% 25 12.5% 2 1.0%Threat to damage/seize property 4 14.8% 23 85.2% 0 0.0% 0 0.0%Threat of arrest 54 20.0% 184 68.1% 27 10.0% 5 1.9%Threat of summons 5 23.8% 12 57.1% 4 19.0% 0 0.0%Retaliatory arrest 0 0.0% 0 0.0% 0 0.0% 0 0.0%Retaliatory summons 1 100.0% 0 0.0% 0 0.0% 0 0.0%Refusal to process civilian complaint 4 15.4% 20 76.9% 2 7.7% 0 0.0%Refusal to provide name/shield number 67 18.9% 266 75.1% 21 5.9% 0 0.0%Refusal to obtain medical treatment 6 9.4% 54 84.4% 3 4.7% 1 1.6%Failure to show search warrant 2 5.0% 36 90.0% 2 5.0% 0 0.0%Improper dissemination of medical info 0 0.0% 0 0.0% 0 0.0% 0 0.0%
Other 1 20.0% 3 60.0% 1 20.0% 0 0.0%
Total 471 15.4% 2243 73.2% 320 10.4% 30 1.0%
civilian unidentifiedType of Abuse of Authority Allegation Withdrawn Uncooperative Unavailable
26

Disposition of Discourtesy Allegations, 2014
Number Rate Number Rate Number Rate Number RateWord 169 17.6% 651 67.9% 126 13.1% 13 1.4%Gesture 1 11.1% 7 77.8% 1 11.1% 0 0.0%Demeanor/tone 0 0.0% 3 100.0% 0 0.0% 0 0.0%Action 17 22.1% 52 67.5% 8 10.4% 0 0.0%Other 1 25.0% 1 25.0% 2 50.0% 0 0.0%Total 188 17.9% 714 67.9% 137 13.0% 13 1.2%
Disposition of Offensive Language Allegations, 2014
Number Rate Number Rate Number Rate Number RateRace 18 15.3% 78 66.1% 22 18.6% 0 0.0%Ethnicity 14 42.4% 13 39.4% 5 15.2% 1 3.0%Religion 2 50.0% 2 50.0% 0 0.0% 0 0.0%Sex 2 4.2% 36 75.0% 10 20.8% 0 0.0%Sexual Orientation 3 15.0% 14 70.0% 2 10.0% 1 5.0%Physical Disability 0 0.0% 6 100.0% 0 0.0% 0 0.0%Other 1 33.3% 2 66.7% 0 0.0% 0 0.0%Total 40 17.2% 151 65.1% 39 16.8% 2 0.9%
Type of Discourtesy Allegation Withdrawn Uncooperative Unavailable
civilian unidentifiedType of Offensive Language Allegation Withdrawn Uncooperative Unavailable
civilian unidentified
27

Disposition of Force Allegations, YTD 2015
Number Rate Number Rate Number Rate Number Rate Number Rate Number RateGun fired 0 0.0% 0 0.0% 0 0.0% 0 0.0% 0 0.0% 0 0.0%Gun pointed 0 0.0% 13 81.3% 0 0.0% 1 6.3% 2 12.5% 0 0.0%Nightstick as club (incl asp & baton) 0 0.0% 1 25.0% 2 50.0% 1 25.0% 0 0.0% 0 0.0%Gun as club 0 0.0% 0 0.0% 1 50.0% 0 0.0% 1 50.0% 0 0.0%Police shield 0 0.0% 0 0.0% 0 0.0% 0 0.0% 0 0.0% 0 0.0%Vehicle 0 0.0% 0 0.0% 0 0.0% 0 0.0% 0 0.0% 0 0.0%Other blunt instrument as a club 0 0.0% 0 0.0% 0 0.0% 0 0.0% 0 0.0% 0 0.0%Hit against inanimate object 0 0.0% 0 0.0% 2 33.3% 4 66.7% 0 0.0% 0 0.0%Chokehold 1 6.7% 0 0.0% 9 60.0% 4 26.7% 1 6.7% 0 0.0%Pepper spray 0 0.0% 8 100.0% 0 0.0% 0 0.0% 0 0.0% 0 0.0%Physical force 5 5.7% 28 32.2% 33 37.9% 11 12.6% 9 10.3% 1 1.1%Radio as club 0 0.0% 0 0.0% 0 0.0% 0 0.0% 0 0.0% 0 0.0%Flashlight as club 0 0.0% 0 0.0% 0 0.0% 1 100.0% 0 0.0% 0 0.0%Handcuffs too tight 0 0.0% 0 0.0% 3 75.0% 1 25.0% 0 0.0% 0 0.0%Nonlethal restraining device 0 0.0% 3 100.0% 0 0.0% 0 0.0% 0 0.0% 0 0.0%Animal 0 0.0% 0 0.0% 0 0.0% 0 0.0% 0 0.0% 0 0.0%Other 0 0.0% 0 0.0% 2 50.0% 2 50.0% 0 0.0% 0 0.0%Total 6 4.0% 53 35.3% 52 34.7% 25 16.7% 13 8.7% 1 0.7%
* "Physical force" includes: dragged/pulled, pushed/shoved/threw, punch/kicked/kneed, slapped and bit.
MiscellaneousType of Force Allegation
Substantiated Exonerated Unsubstantiated Unfounded Officer Unidentified
28

Disposition of Abuse of Authority Allegations, YTD 2015
Number Rate Number Rate Number Rate Number Rate Number Rate Number RateQuestion 0 0.0% 7 100.0% 0 0.0% 0 0.0% 0 0.0% 0 0.0%Stop 3 10.0% 8 26.7% 14 46.7% 0 0.0% 5 16.7% 0 0.0%Search 1 5.9% 2 11.8% 12 70.6% 0 0.0% 2 11.8% 0 0.0%Frisk 4 22.2% 3 16.7% 8 44.4% 0 0.0% 3 16.7% 0 0.0%Vehicle search 6 20.7% 9 31.0% 11 37.9% 0 0.0% 3 10.3% 0 0.0%Vehicle stop 1 16.7% 2 33.3% 2 33.3% 0 0.0% 1 16.7% 0 0.0%Premises entered and/or searched 1 3.4% 18 62.1% 9 31.0% 0 0.0% 1 3.4% 0 0.0%strip-searched 0 0.0% 4 25.0% 9 56.3% 2 12.5% 0 0.0% 1 6.3%Gun Drawn 0 0.0% 0 0.0% 0 0.0% 1 100.0% 0 0.0% 0 0.0%Seizure of property 0 0.0% 0 0.0% 1 100.0% 0 0.0% 0 0.0% 0 0.0%Property damaged 0 0.0% 2 22.2% 4 44.4% 2 22.2% 1 11.1% 0 0.0%Threat to notify ACS 0 0.0% 1 100.0% 0 0.0% 0 0.0% 0 0.0% 0 0.0%Threat of force 1 5.3% 0 0.0% 15 78.9% 1 5.3% 2 10.5% 0 0.0%Threat to damage/seize property 0 0.0% 1 100.0% 0 0.0% 0 0.0% 0 0.0% 0 0.0%Threat of arrest 0 0.0% 1 11.1% 6 66.7% 0 0.0% 2 22.2% 0 0.0%Threat of summons 0 0.0% 0 0.0% 0 0.0% 0 0.0% 0 0.0% 0 0.0%Retaliatory arrest 0 0.0% 0 0.0% 0 0.0% 0 0.0% 0 0.0% 0 0.0%Retaliatory summons 3 100.0% 0 0.0% 0 0.0% 0 0.0% 0 0.0% 0 0.0%Refusal to process civilian complaint 0 0.0% 0 0.0% 1 100.0% 0 0.0% 0 0.0% 0 0.0%Refusal to provide name/shield number 3 12.5% 0 0.0% 16 66.7% 2 8.3% 3 12.5% 0 0.0%Refusal to obtain medical treatment 0 0.0% 0 0.0% 3 50.0% 3 50.0% 0 0.0% 0 0.0%Failure to show search warrant 1 33.3% 0 0.0% 2 66.7% 0 0.0% 0 0.0% 0 0.0%Improper dissemination of medical info 0 0.0% 0 0.0% 0 0.0% 0 0.0% 0 0.0% 0 0.0%Other 3 50.0% 1 16.7% 2 33.3% 0 0.0% 0 0.0% 0 0.0%Total 27 11.4% 59 25.0% 115 48.7% 11 4.7% 23 9.7% 1 0.4%
MiscellaneousType of Abuse of Authority Allegation Substantiated Exonerated Unsubstantiated Unfounded Officer Unidentified
29

Disposition of Discourtesy Allegations, YTD 2015
Number Rate Number Rate Number Rate Number Rate Number Rate Number RateWord 5 6.0% 2 2.4% 53 63.9% 7 8.4% 16 19.3% 0 0.0%Gesture 0 0.0% 0 0.0% 0 0.0% 0 0.0% 0 0.0% 0 0.0%Demeanor/tone 0 0.0% 0 0.0% 0 0.0% 0 0.0% 0 0.0% 0 0.0%Action 1 20.0% 0 0.0% 2 40.0% 2 40.0% 0 0.0% 0 0.0%Other 0 0.0% 0 0.0% 0 0.0% 0 0.0% 0 0.0% 0 0.0%Total 6 6.8% 2 2.3% 55 62.5% 9 10.2% 16 18.2% 0 0.0%
Disposition of Offensive Language Allegations, YTD 2015
Number Rate Number Rate Number Rate Number Rate Number Rate Number RateRace 0 0.0% 0 0.0% 5 83.3% 1 16.7% 0 0.0% 0 0.0%Ethnicity 0 0.0% 0 0.0% 4 100.0% 0 0.0% 0 0.0% 0 0.0%Religion 0 0.0% 0 0.0% 0 0.0% 0 0.0% 0 0.0% 0 0.0%Sex 0 0.0% 0 0.0% 5 71.4% 2 28.6% 0 0.0% 0 0.0%Sexual Orientation 0 0.0% 0 0.0% 1 100.0% 0 0.0% 0 0.0% 0 0.0%Physical Disability 0 0.0% 0 0.0% 0 0.0% 0 0.0% 0 0.0% 0 0.0%Other 0 0.0% 0 0.0% 0 0.0% 0 0.0% 0 0.0% 0 0.0%Total 0 0.0% 0 0.0% 15 83.3% 3 16.7% 0 0.0% 0 0.0%
Miscellaneous
Type of Offensive Language AllegationSubstantiated Exonerated Unsubstantiated Unfounded Officer Unidentified Miscellaneous
Type of Discourtesy AllegationSubstantiated Exonerated Unsubstantiated Unfounded Officer Unidentified
30

POLICE DEPARTMENT DISPOSITIONS OF SUBSTANTIATED CASES
DECEMBER 2014
31

Police Department Dispositions of Substantiated Cases by Year of NYPD Closure*
Police Department Disposition December 2014 2014Guilty after trial 0 2Pleaded guilty To charges and specifications 1 5
To negotiated as command discipline 0 0Command discipline 9 29Instructions/Training 14 66Subtotal: Disciplinary Action 24 102Not guilty after trial 0 0Dismissed 0 0Department Declined to Prosecute 2 29Statute of limitations expired 0 9Department employee unidentified 0 0Subtotal: No Disciplinary Action 2 38Filed** 0 0Total Closed Cases 26 140Discipline rate 92.3% 72.9%DUP rate 7.7% 20.7%
* Cases resolved by the police department in a particular year often stem from CCRB referrals from earlier years.** "Filed" is a term used by the Police Departmenty when charges are served but not adjudicated before the respondentleaves the NYPD. The charges become part of the respondent's permanent record and will be adjudicated if therespondent returns to the NYPD.
Police Department Disciplinary Penalties Imposed by Year of NYPD Closure*
Penalty December 2014 2014Terminated 0 0Suspension for or loss of vacation time of 31 or more days and/or 1-year of probation 0 3Suspension for or loss vacation time of 21 to 30 days and/or 1-year of probation 1 1Suspension for or loss of vacation time of 11 to 20 days 0 2Suspension for or loss of vacation time of 1 to 10 days 0 1Command discipline A 3 17Command discipline B 6 12Instructions/Training 14 66Warned and admonished 0 0Total 24 102
Number of Officers
Number of Officers
* Cases resolved by the police department in a particular year often stem from CCRB referrals from earlier years.
32

ADMINISTRATIVE PROSECUTION OF CCRB SUBSTANTIATED CASES WITH CHARGES
JANUARY 2015
33

Administrative Prosecution Unit Open Docket as of January 31, 2015
Stage Officers PercentDisposition modified by Police Commissioner, awaiting final disposition 2 1%Plea entered, awaiting approval by Police Commissioner 29 8%Trial verdict rendered, awaiting approval by Police Commissioner 31 8%Trial completed, awaiting verdict 16 4%Trial commenced but not completed 6 2%Trial scheduled 70 19%Calendared for court appearance 27 7%Charges served, awaiting initial appearance 129 35%Charges filed, awaiting service 33 9%Awaiting filing of charges 26 7%Total 369 100%
34

APU Cases Closed
Type January 2015 Jan - Dec 2014Guilty after trial 4 9Not guilty after trial 3 11Resolved by plea 1 13Plea set aside, charges dismissed, Command Discipline B 0 10Plea set aside, charges dismissed, Command Discipline A 0 0Plea set aside, charges dismissed, Formalized training imposed 0 3Plea set aside, charges dismissed, Instructions imposed 0 3
Plea set aside, charges dismissed, without disciplinary action 0 3Previously adjudicated with disciplinary action 0 1Previously adjudicated without disciplinary action 0 0Retained by NYPD with disciplinary action 0 21Retained by NYPD without disciplinary action 0 12Charges dismissed Pre-Trial by APU 1 2Charges not filed 0 4Statute of limitations expired 0 5Total 9 97
Police Department Disciplinary Penalties for APU & Retained Cases by Date of NYPD Closure
Penalty* January 2015 Jan - Dec 2014Terminated 0 0Suspension for or loss of vacation time of 31 or moredays and/or Dismissal ProbationSuspension for or loss of vacation time of 21 to 30 daysand/or Dismissal ProbationSuspension for or loss of vacation time of 11 to 20 days 1 1Suspension for or loss of vacation time of 1 to 10 days 2 17Command Discipline B 0 11Command Discipline A 0 4Formalized Training† 0 17Instructions†† 1 6Warned & admonished/Reprimanded 1 4Total 5 61
† Formalized training is conducted by the Police Academy, the NYPD Legal Bureau, or other NYPD unit.†† Instructions are conducted at the command level.
*Where the officer is found guilty of charges, and the penalty imposed would fall into more than one of the above listed categories, it is reported under themore serious category.
Number of Officers
0 0
0 1
35

Casenum Command Allegation Action taken Final Disposition Date of Final Disposition
2015010101 106th Precinct Chokehold ADCT found respondent not guilty ADCT recommendation approved 1/26/2015
2015010102 106th PrecinctImproper frisk & search of a person
ADCT found respondent guilty and recommended penalty of forfeiture of three vacation days ADCT recommendation approved 1/26/2015
2015010201 46th Precinct Improper question ADCT found respondent not guilty ADCT recommendation approved 1/30/2015
2015010301 52nd Precinct Improper vehicle searchADCT found respondent guilty and recommended penalty of reprimand ADCT recommendation approved 1/30/2015
2015010401Narcotics Boro Bronx Improper vehicle stop
ADCT found respondent guilty and recommended penalty of forfeiture of ten vacation days ADCT recommendation approved 1/30/2015
2015010402Narcotics Boro Bronx
Improper vehicle stop and improper frisk & search of a person
ADCT found respondent guilty and recommended penalty of forfeiture of fifteen vacation days ADCT recommendation approved 1/30/2015
2015010501 34th PrecinctImproper stop, frisk & search of a person ADCT found respondent not guilty ADCT recommendation approved 1/29/2015
2015010601 69th PrecinctImproper search of personal property Dismissed by APU APU request approved 1/22/2015
2015010602 69th Precinct Improper frisk of a person DAO imposed instructions on the respondent APU request approved 1/22/2015
January 2015
Final Disposition of APU Cases
From January 1, 2015 through January 31, 2015, the Police Commissioner finalized five trials involving seven respondents in APU cases.From January 1, 2015 through January 31, 2015, the Department finalized one plea in an APU cases.
From January 1, 2015 through January 31, 2015, the Department dismissed one case upon the request of the APU.
36

CCRB MEDIATION MONTHLY REPORT
JANUARY 2015
37
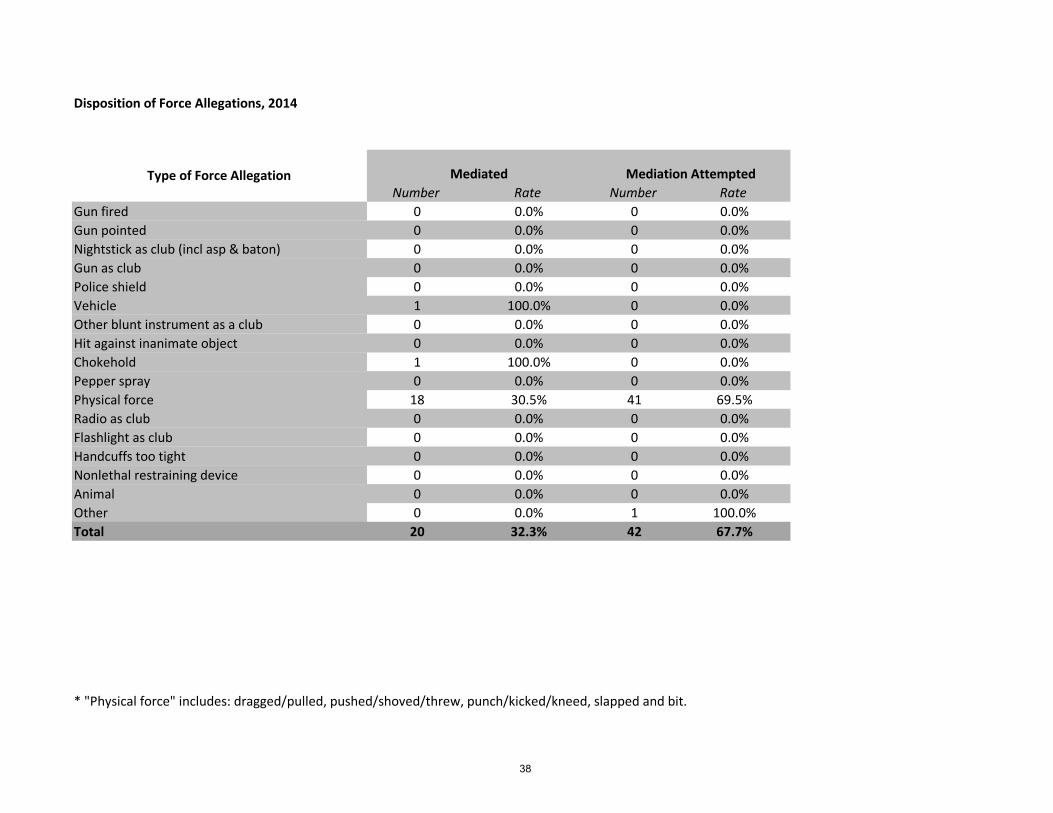
Disposition of Force Allegations, 2014
Number Rate Number RateGun fired 0 0.0% 0 0.0%Gun pointed 0 0.0% 0 0.0%Nightstick as club (incl asp & baton) 0 0.0% 0 0.0%Gun as club 0 0.0% 0 0.0%Police shield 0 0.0% 0 0.0%Vehicle 1 100.0% 0 0.0%Other blunt instrument as a club 0 0.0% 0 0.0%Hit against inanimate object 0 0.0% 0 0.0%Chokehold 1 100.0% 0 0.0%Pepper spray 0 0.0% 0 0.0%Physical force 18 30.5% 41 69.5%Radio as club 0 0.0% 0 0.0%Flashlight as club 0 0.0% 0 0.0%Handcuffs too tight 0 0.0% 0 0.0%Nonlethal restraining device 0 0.0% 0 0.0%Animal 0 0.0% 0 0.0%Other 0 0.0% 1 100.0%Total 20 32.3% 42 67.7%
* "Physical force" includes: dragged/pulled, pushed/shoved/threw, punch/kicked/kneed, slapped and bit.
Type of Force Allegation Mediated Mediation Attempted
38

Disposition of Abuse of Authority Allegations, 2014
Number Rate Number RateQuestion 5 31.3% 11 68.8%Stop 28 43.8% 36 56.3%Search 21 43.8% 27 56.3%Frisk 20 54.1% 17 45.9%Vehicle search 17 54.8% 14 45.2%Vehicle stop 24 54.5% 20 45.5%Premises entered and/or searched 8 38.1% 13 61.9%strip-searched 0 0.0% 0 0.0%Gun Drawn 1 33.3% 2 66.7%Seizure of property 0 0.0% 1 100.0%Property damaged 0 0.0% 0 0.0%Threat to notify ACS 0 0.0% 2 100.0%Threat of force 11 44.0% 14 56.0%Threat to damage/seize property 1 50.0% 1 50.0%Threat of arrest 46 54.1% 39 45.9%Threat of summons 10 55.6% 8 44.4%Retaliatory arrest 0 0.0% 0 0.0%Retaliatory summons 0 0.0% 0 0.0%Refusal to process civilian complaint 7 87.5% 1 12.5%Refusal to provide name/shield number 39 48.1% 42 51.9%Refusal to obtain medical treatment 0 0.0% 0 0.0%Failure to show search warrant 0 0.0% 0 0.0%Improper dissemination of medical info 0 0.0% 0 0.0%Other 1 100.0% 0 0.0%Total 239 49.1% 248 50.9%
Type of Abuse of Authority Allegation Mediated Mediation Attempted
39
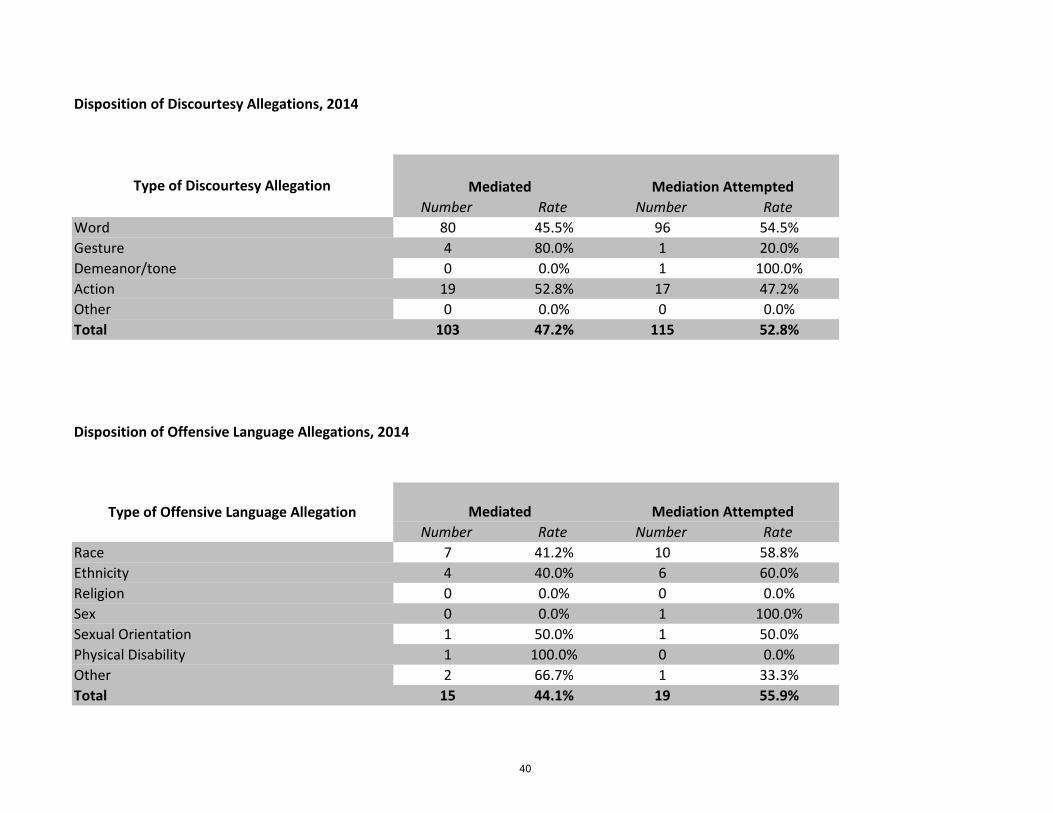
Disposition of Discourtesy Allegations, 2014
Number Rate Number RateWord 80 45.5% 96 54.5%Gesture 4 80.0% 1 20.0%Demeanor/tone 0 0.0% 1 100.0%Action 19 52.8% 17 47.2%Other 0 0.0% 0 0.0%Total 103 47.2% 115 52.8%
Disposition of Offensive Language Allegations, 2014
Number Rate Number RateRace 7 41.2% 10 58.8%Ethnicity 4 40.0% 6 60.0%Religion 0 0.0% 0 0.0%Sex 0 0.0% 1 100.0%Sexual Orientation 1 50.0% 1 50.0%Physical Disability 1 100.0% 0 0.0%Other 2 66.7% 1 33.3%Total 15 44.1% 19 55.9%
Type of Discourtesy Allegation Mediated Mediation Attempted
Type of Offensive Language Allegation Mediated Mediation Attempted
40

Disposition of Force Allegations, YTD 2015
Number Rate Number RateGun fired 0 0.0% 0 0.0%Gun pointed 0 0.0% 0 0.0%Nightstick as club (incl asp & baton) 0 0.0% 0 0.0%Gun as club 0 0.0% 0 0.0%Police shield 0 0.0% 0 0.0%Vehicle 0 0.0% 0 0.0%Other blunt instrument as a club 0 0.0% 0 0.0%Hit against inanimate object 1 100.0% 0 0.0%Chokehold 0 0.0% 0 0.0%Pepper spray 0 0.0% 0 0.0%Physical force 2 100.0% 0 0.0%Radio as club 0 0.0% 0 0.0%Flashlight as club 0 0.0% 0 0.0%Handcuffs too tight 0 0.0% 0 0.0%Nonlethal restraining device 0 0.0% 0 0.0%Animal 0 0.0% 0 0.0%Other 0 0.0% 0 0.0%Total 3 100.0% 0 0.0%
* "Physical force" includes: dragged/pulled, pushed/shoved/threw, punch/kicked/kneed, slapped and bit.
Type of Force Allegation Mediated Mediation Attempted
41

Disposition of Abuse of Authority Allegations, YTD 2015
Number Rate Number RateQuestion 3 100.0% 0 0.0%Stop 5 100.0% 0 0.0%Search 4 100.0% 0 0.0%Frisk 2 100.0% 0 0.0%Vehicle search 0 0.0% 0 0.0%Vehicle stop 0 0.0% 0 0.0%Premises entered and/or searched 2 100.0% 0 0.0%strip-searched 0 0.0% 0 0.0%Gun Drawn 0 0.0% 0 0.0%Seizure of property 1 100.0% 0 0.0%Property damaged 0 0.0% 0 0.0%Threat to notify ACS 0 0.0% 0 0.0%Threat of force 0 0.0% 0 0.0%Threat to damage/seize property 0 0.0% 0 0.0%Threat of arrest 6 100.0% 0 0.0%Threat of summons 1 100.0% 0 0.0%Retaliatory arrest 0 0.0% 0 0.0%Retaliatory summons 0 0.0% 0 0.0%Refusal to process civilian complaint 1 100.0% 0 0.0%Refusal to provide name/shield number 4 100.0% 0 0.0%Refusal to obtain medical treatment 0 0.0% 0 0.0%Failure to show search warrant 0 0.0% 0 0.0%Improper dissemination of medical info 0 0.0% 0 0.0%Other 0 0.0% 0 0.0%Total 29 100.0% 0 0.0%
Type of Abuse of Authority Allegation Mediated Mediation Attempted
42

Disposition of Discourtesy Allegations, YTD 2015
Number Rate Number RateWord 9 100.0% 0 0.0%Gesture 2 100.0% 0 0.0%Demeanor/tone 0 0.0% 0 0.0%Action 0 0.0% 0 0.0%Other 0 0.0% 0 0.0%Total 11 100.0% 0 0.0%
Disposition of Offensive Language Allegations, 2014
Number Rate Number RateRace 1 100.0% 0 0.0%Ethnicity 0 0.0% 0 0.0%Religion 0 0.0% 0 0.0%Sex 0 0.0% 0 0.0%Sexual Orientation 0 0.0% 0 0.0%Physical Disability 0 0.0% 0 0.0%Other 0 0.0% 0 0.0%Total 1 100.0% 0 0.0%
Type of Discourtesy Allegation Mediated Mediation Attempted
Type of Offensive Language Allegation Mediated Mediation Attempted
43