1993-dodger, a diagnostic expert system for the evaluation ... · ... a diagnostic expert system...
TRANSCRIPT
Dodger, a Diagnostic Expert System for the Evaluation of Nondestructive Test Data
Arthur J. Levy, Jane E. Oppenlander, David M. Brudnoy, James M. Englund, Kent C. Loomis, Arnold M. Barsky
General Electric Company Box 1072
Schenectady, New York 12301-1072
Abstract
Identification and characterization of indications in eddy current (ET) signals can be highly subjective in nature, with varying diagnoses made by different analysts or by a single analyst at different times. Consistent analyses of an indication over time are required in order to accurately assess trends in material condition. A rule-based expert system, with a well designed set of interpretation guidelines, can provide the consistent and repeatable analysis that is desired. An expert system was developed that analyzes eddy current signals allowing interactive or unattended operation, or a mixture of the two. Measurements are derived from the data using automatic machine recognition of ET impedance plane patterns. Uncertain and conflicting measurements are treated in a rigorous, probabilistic manner using the Dempster-Shafer theory of evidence. The expert system identifies the nature of an indication and the confidence in that diagnosis. The system is also able to automatically reference past measurements of the same indication and analyze them using the same criteria. Finally, it determines the trend in the indication and allows the analyst to make an informed decision about its severity. This paper describes the expert system (Dodger) and its process of analyzing eddy current signals.’
Introduction Eddy current testing (ET) is a widely used non-
destructive testing (NDT) method, particularly for inspection of tubing material. ET’s speed, sensitivity, and ease of use make it an ideal choice particularly for heat exchanger tubing which may be
1. Knolls Atomic Power Laboratory is operated for the U.S. Department of Energy by the General Electric Company under contract no. DE-AC12- 76SN00052. This article was supported by the Assistant Secretary for Nuclear Energy.
non-ferromagnetic and thin-walled. For all its benefits, however, ET can also be among the most frustrating of NDT methods. Although the technique itself is simple and reliable, inspection data and results frequently are contradictory and misleading due to the many material variables which influence the ET measurements. Inspection results are often not consistent with prior inspections or are inconsistent among different analysts. As a result, confidence in the technique suffers.
Most difficulties with ET arise from analysis of data. ET by its nature is sensitive to any change in the electrical or magnetic properties of the test part. For heat exchanger tubing, this includes not only defects, but also support structures, electrically conductive deposits, permeability variations, dents and bulges, roll expansions, and other phenomena. Indications from these other effects frequently combine with indications from defects such that both detection and sizing of flaws is compromised. Through the use of multiple frequency ET systems, modern equipment is capable of acquiring the necessary data to correctly diagnosis these indications. Application of consistent analysis techniques, however, is required to achieve improved test results. Human nature itself will cause some variance in analysis to occur. More important, the expertise to analyze data most proficiently is very often distributed among several individuals.
To overcome these obstacles, an eddy current expert system has been developed. It is specifically designed to analyze bobbin probe data from heat exchanger tubing, although application to other areas is possible. The expert system was developed to satisfy the following functional requirements.
1. Con&tencv of interpretatiow Given the same indication, the system should always arrive at the same diagnosis. Additionally, all indications should be evaluated thoroughly such that interpretation is consistent and repeatable. The system should also have access to a library of historical ET data to perform trend assessments using the same methods
Levy 107
From: IAAI-93 Proceedings. Copyright © 1993, AAAI (www.aaai.org). All rights reserved.

of analysis. 2.Comprehensive knowledge base: The system
should contain a comprehensive knowledge base representing the accumulated expertise of several ET experts. This knowledge base would then allow an expert-level review for all diagnoses.
Figure l-Dodger’s use of Al technologies in analyzing ET data.
3. Flexibilitv for growth: The system should be designed such that as new knowledge is developed, it can be incorporated into the system without major changes to existing software.
4. Decreased reliance on an onerator: The system should have as little reliance on an operator as possible. However, interaction with and consideration of an analyst’s opinion should be a part of the system.
. 5. Quantifv uncertaxntv : The system should provide not only a diagnosis, but also quantify the degree of uncertainty in the diagnosis.
A rule based expert system was selected to implement these objectives. This approach afforded the desired flexibility not inherent in traditionally coded systems, and also took advantage of existing expertise resident in several ET experts. This paper describes an expert system called Dodger. It includes the overall system design and operation, the application of various artificial intelligence technologies used in the implementation, and provides a summary of current system performance.
The Dodger Expert System
Expert System Design The design of the expert system is based on the
premise that the best evaluation results from cooperation of a team of analysts with diverse knowledge. To achieve the performance objectives of an eddy current expert system as defined above, the experience and skills of the best evaluators and engineers should be incorporated. This knowledge is often lost when the experts leave their positions. It is desirable to emulate the capability of such a team. It is clear that successful evaluators depend on a mixture of empirical response to visual displays of impedance plots (Lissajous patterns) and knowledge of some properties of the heat exchanger under test. Some analysts are expert in evaluating some aspects of eddy current signals while others are skillful in other technical areas. The techniques common to most experts are incorporated into Dodger to capitalize on the existing ET evaluation language and culture. The system combines the specialized expertise of several evaluators.
Three aspects of ET evaluation stand out as being important to the performance of experts and are therefore emulated in Dodger. First, ET evaluators recognize signal characteristics in terms
Figure 2-Architecture of the Dodger expert system.
of visual Lissajous pattern features. While many parameters are rarely articulated, the shape, size and
10s IAAI
orientation are certainly important. Lissajous parameters do not lead to clear-cut diagnoses of damage mechanisms, but rather suggest a number of possibilities. This is characteristic of what is known as a “fuzzy set.” This concept was employed in Dodger.
Second, experts apply several different types of reasoning. They are able to weigh weak and strong evidence and recognize when there is insufficient information to make a diagnosis. In fat t contradictory evidence is common and must be resolved to understand the nature of an indication. They know, or have guidelines, as to what signals are useful to discriminate between certain defect causes. Evaluators rely on “rules of thumb” to guide them through a diagnosis, accumulating or rejecting evidence. These rules of thumb vary from person to person and an evaluator may use one rule in different ways at different times.
Finally, calibrating the system is a primary concern since instrumentation drift during a test may otherwise introduce bias. This is especially important, when comparing results with previous inspections. Since calibration is a tedious process much effort was expended to make calibration a rigorous and automatic process.
Several technologies used in artificial intelligence (AI) were integrated into Dodger to provide the required observational and
Reasoning with Uncertainty Automatic Calibration Each of these components is briefly described
below.
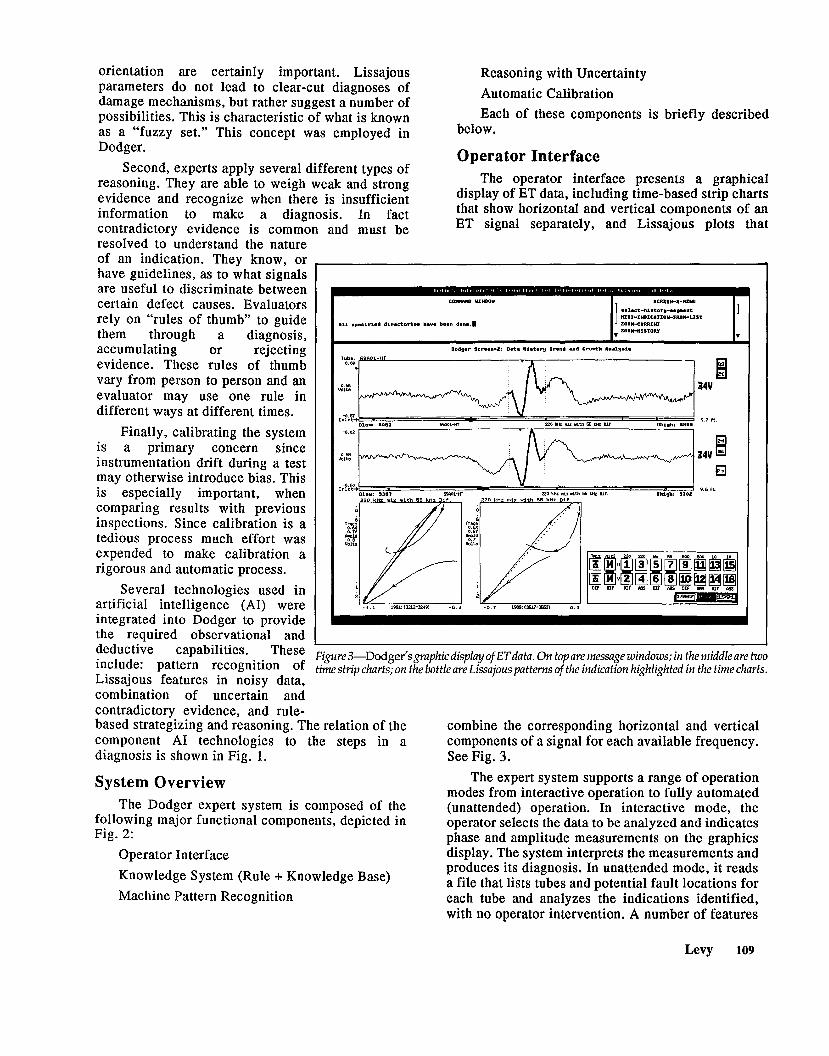
Operator Interface The operator interface presents a graphical
display of ET data, including time-based strip charts that show horizontal and vertical components of an ET signal separately, and Lissajous plots that
r
deductive capabilities. These include: pattern recognition of
Figure 3-Dodger’s graphic display of ET data. On top are message windows; in the mddle are two
Lissajous features in noisy data, time strip charts; on the bottle are Lissajous patterns of the indication highlighted in the time charts.
combination of uncertain and
based strategizing and reasoning. The relation of the contradictory evidence, and rule-
component AI technologies to the steps in a diagnosis is shown in Fig. 1.
System Overview The Dodger expert system is composed of the
following major functional components, depicted in Fig. 2:
Operator Interface Knowledge System (Rule + Knowledge Base) Machine Pattern Recognition
The expert system supports a range of operation modes from interactive oneration to fully automated
combine the corresponding horizontal and vertical components of a signal for each available frequency. See Fig. 3.
(unattended) operation. *In interactive- mode, the operator selects the data to be analyzed and indicates phase and amplitude measurements on the graphics display. The system interprets the measurements and produces its diagnosis. In unattended mode, it reads a file that lists tubes and potential fault locations for each tube and analyzes -the indications identified, with no operator intervention. A number of features
Levy 109
can be set for interactive or automatic operation individually, depending on the degree of participation an operator wishes to have in the analysis. These include the calibration process, selection of an indication, phase and amplitude measurements from the pattern recognition system, and analysis of historical data.
Knowledge System The knowledge system is composed of a
knowledge base and a rule base. The knowledge base consists of a collection of facts and observations derived from the data being analyzed. The rule base consists of a set of rules that embody the interpretation guidelines and practical experience of several expert ET analysts. A rule defines the procedures to be performed when all the conditions required by the rule are true. The results generated by the pattern recognition, reasoning with uncertainty, and automatic calibration components are added to the knowledge base as facts when they are computed. The rule base follows a strategy and makes a diagnosis based on the data available in the knowledge base.
Machine Pattern Recognition The machine pattern recognition component
emulates the visual skills of an analyst. It analyzes ET signals, in the form of impedance plots, to extract significant geometric characteristics such as phase and amplitude. It also supplies qualitative parameters such as the “fatness” of the figure and indications of how well-formed it is.
Reasoning With Uncertainty The reasoning with uncertainty system gathers
parameters representing phase and amplitude measurements from ET signals at several frequencies and combines them in order to develop a strategy for the expert system to follow in pursuing a diagnosis. Fuzzy set theory is used to associate the parameters with one or more possible material conditions.
Automatic Calibration The automatic calibration system processes ET
data from ASME standard tubes to calibrate the operation of the rest of the system.
In addition, the expert system creates a report detailing all relevant information used in analyzing the identified indication(s). This includes details about the calibration tube that was used, signal mixing parameters, measurements made from the indication, input from the operator, and the system’s diagnosis. When historical data is also analyzed,
significant details from that analysis are included in the report along with any trends identified.
The Dodger system is implemented using the Automated Reasoning Tool (ART),’ a Lisp-based software toolkit for building expert systems. It also incorporates several analytical subsystems written in Fortran.
Artificial Intelligence Technologies Applied In Dodger
Machine Pattern Recognition Much of the information derived from eddy
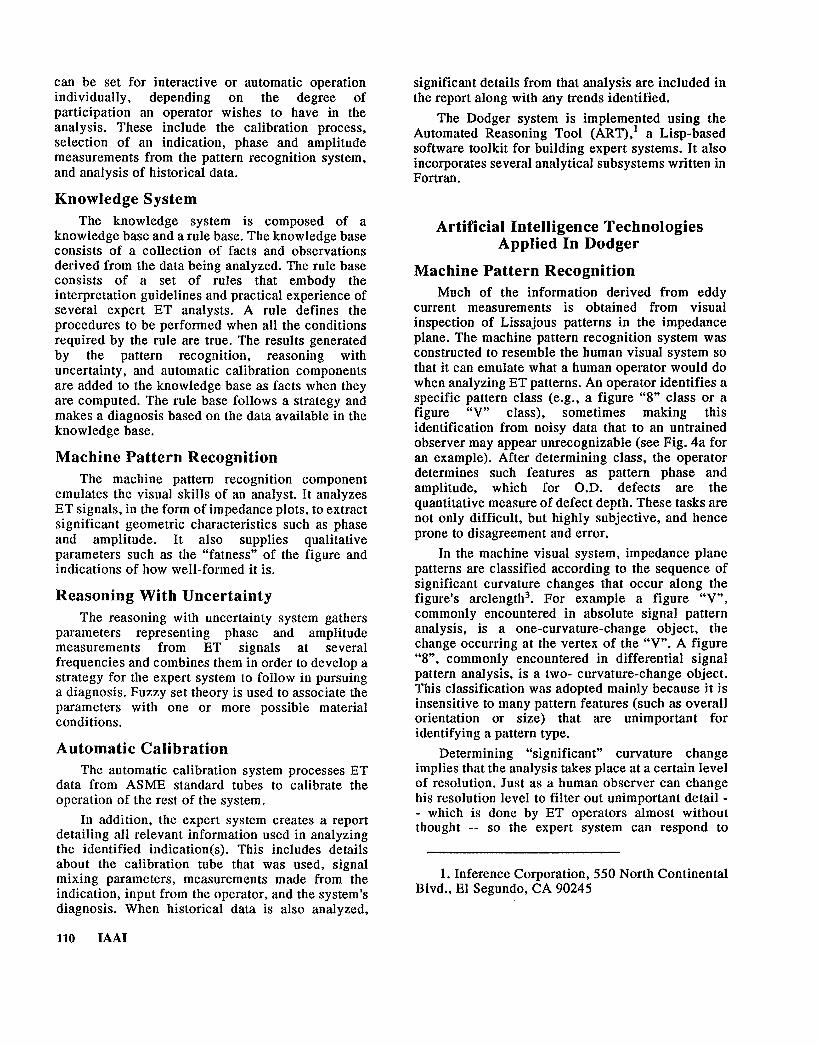
current measurements is obtained from visual inspection of Lissajous patterns in the impedance plane. The machine pattern recognition system was constructed to resemble the human visual system so that it can emulate what a human operator would do when analyzing ET patterns. An operator identifies a specific pattern class (e.g., a figure “8” class or a figure “V” class), sometimes making this identification from noisy data that to an untrained observer may appear unrecognizable (see Fig. 4a for an example). After determining class, the operator determines such features as pattern phase and amplitude, which for O.D. defects are the quantitative measure of defect depth. These tasks are not only difficult, but highly subjective, and hence prone to disagreement and error.
In the machine visual system, impedance plane patterns are classified according to the sequence of significant curvature changes that occur along the figure’s arclength 3. For example a figure “V”, commonly encountered in absolute signal pattern analysis, is a one-curvature-change object, the change occurring at the vertex of the “V”. A figure “8”, commonly encountered in differential signal pattern analysis, is a two- curvature-change object. This classification was adopted mainly because it is insensitive to many pattern features (such as overall orientation or size) that are unimportant for identifying a pattern type.
Determining “significant” curvature change implies that the analysis takes place at a certain level of resolution. Just as a human observer can change his resolution level to filter out unimportant detail - - which is done by ET operators almost without thought -- so the expert system can respond to
1. Inference Corporation, 550 North Continental Blvd., El Segundo, CA 90245
110 IAAI
differing levels of visual resolution. Indeed the machine analysis is carried out at multiple levels of resolution, from so-called fine to coarse levels in order to optimize detectability and localizability of significant curvature changes in a pattern4.
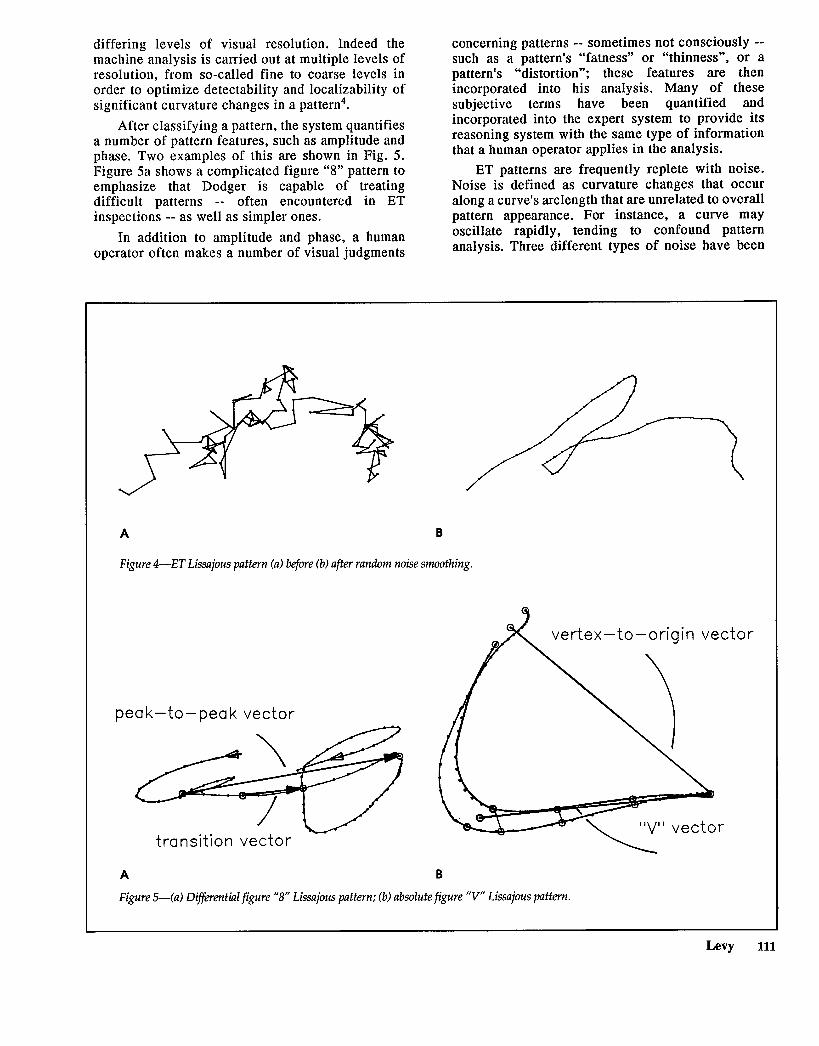
After classifying a pattern, the system quantifies a number of pattern features, such as amplitude and phase. Two examples of this are shown in Fig. 5. Figure Sa shows a complicated figure “8” pattern to emphasize that Dodger is capable of treating difficult patterns -- often encountered in ET inspections -- as well as simpler ones.
In addition to amplitude and phase, a human operator often makes a number of visual judgments
concerning patterns -- sometimes not consciously -- such as a pattern’s “fatness” or “thinness”, or a pattern’s “distortion”; these features are then incorporated into his analysis. Many of these subjective terms have been quantified and incorporated into the expert system to provide its reasoning system with the same type of information that a human operator applies in the analysis.
ET patterns are frequently replete with noise. Noise is defined as curvature changes that occur along a curve’s arclength that are unrelated to overall pat tern appearance. For instance, a curve may oscillate rapidly, tending to confound pattern analysis. Three different types of noise have been
A B
Figure &ET Lissajous pattern (a) before (b) after random noise smoothing.
peak-to-peak vector
transition vector
Figure 54a) DiljCerential figure “8” Lissajous pattern; (b) absolute
vertex-to-origin vector
B
figure “v” Lissajous pattern.
Levy 111
identified. The first type is random, which is a consequence of fluctuations that occur during the measurement process. This noise is removed by an iterative smoothing routine prior to pattern analysis. An extreme example of random noise, together with its smoothed pattern, is shown in Fig. 4. The second type, called endpoint noise, is the consequence of the imprecise determination of indication limits in the data; points not associated with the indication may be included at the ends of the curves. This noise is removed by imposing smoothness constraints on the curve ends. The third type may occur anywhere along a pattern curve where a small loop appears. These loops are believed to be unrelated to physical characteristics, but nonetheless display large curvature change at all levels of resolution. .These loops are identified and excised from the pattern. Pattern analysis begins after all three types of noise have been removed from the data.
The result of operating on a pattern with Dodger’s machine pattern recognition system is a set of size and shape parameters. These parameters are incorporated into Dodger’s knowledge base in pursuit of a diagnosis of the indication.
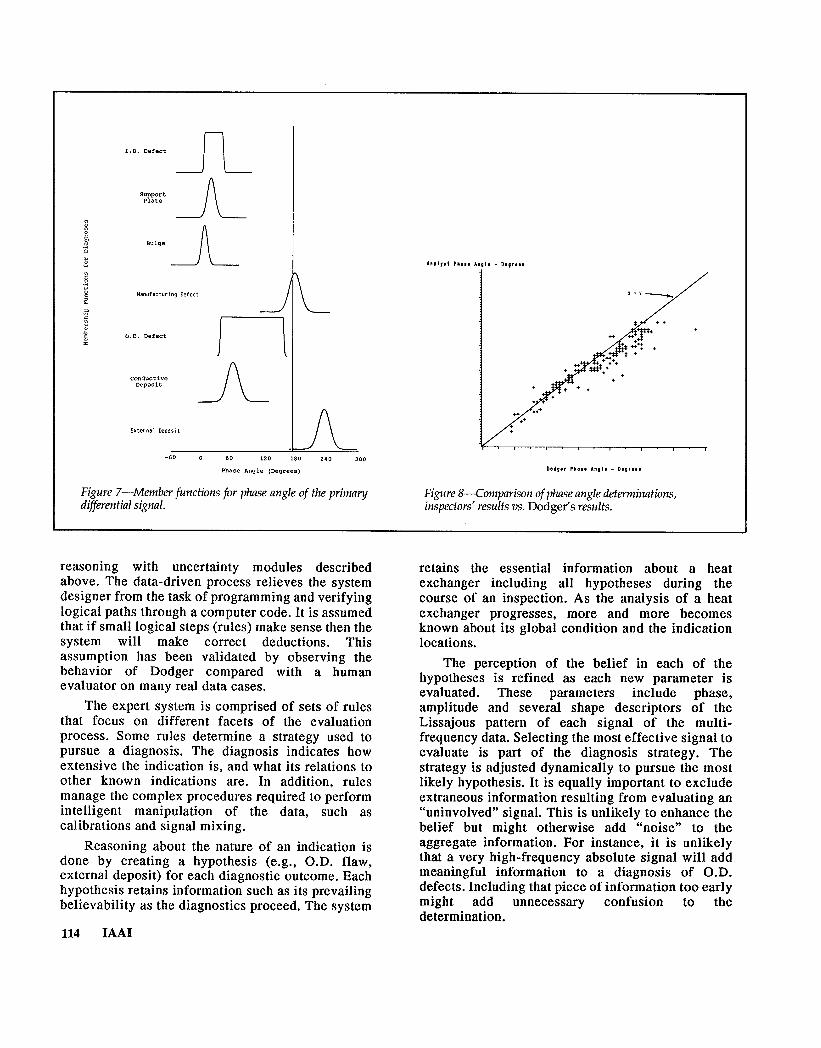
Reasoning with Uncertainty The phase angle and amplitude measurements
from the pattern recognition system provide important evidence for the diagnosis of an ET indication. A single measurement however, may suggest more than one possible diagnosis. For example, a phase angle of 175 degrees from a low frequency signal suggests that both external deposit and manufacturing defect are possible diagnoses. Typically, signals from several frequencies must be evaluated in order to arrive at a diagnosis. The various frequencies are sensitive to different types of effects and will therefore have different value in a diagnosis. Two technologies - fuzzy sets and the Dempster-Shafer theory of evidence have been incorporated in Dodger to create a “reasoning with uncertainty” system to characterize and combine these diverse measurements.
Fuzzy sets5v6 are used to quantify the degree of belief in various diagnoses for each eddy current measurement. In the conventional notion of a set (called a crisp set) an element is either completely contained in the set or completely outside of the set. A fuzzy set allows an element to have partial membership in a set. The degree of membership is measured on a scale of zero to one. For example, consider a fuzzy set that defines the notion of tall. A person who is 6’ 5” would certainly be considered tall and would therefore be assigned a membership value of 1.0, while a person who is 5’ 11” may be
112 IAAI
considered somewhat tall and would be assigned a membership value of 0.8. In the context of eddy current analysis, a physical measurement will have a degree of membership in each of the possible diagnosis categories. For example, the phase angle of 175 degrees may be defined to have a membership of 0.8 in the manufacturing anomaly (e.g. ‘dent’) category as a possible diagnosis and a membership of 0.9 in the external deposit category as a diagnosis.
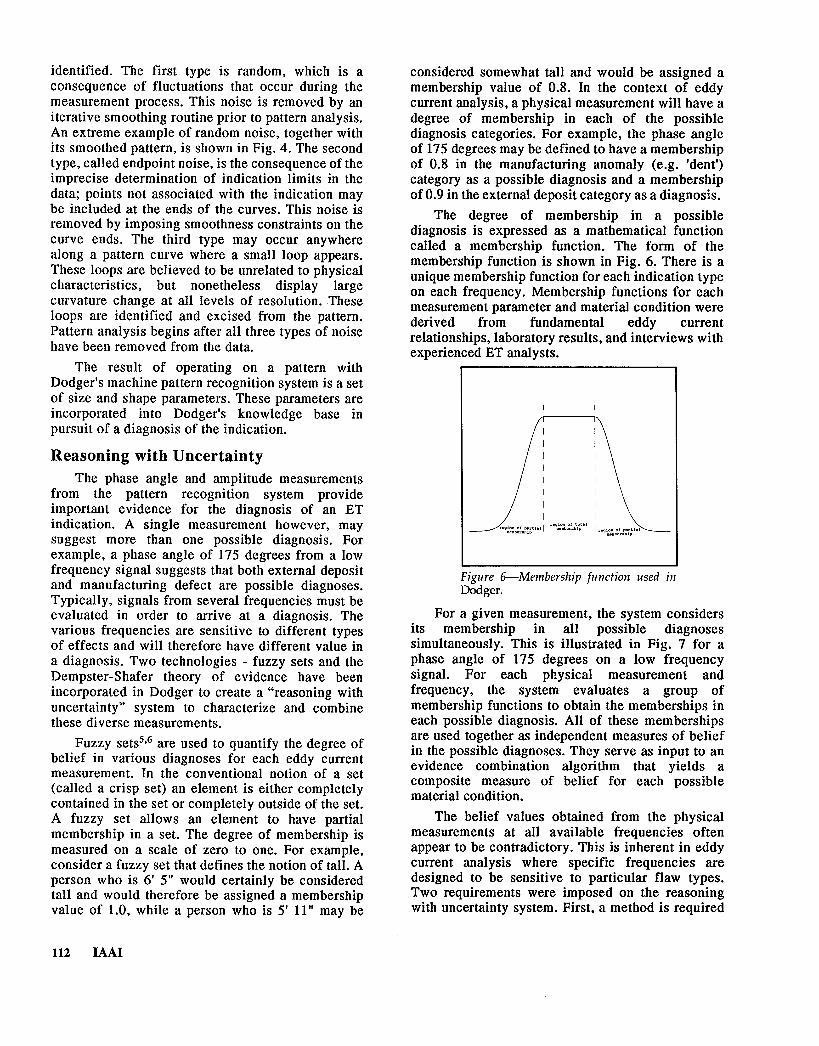
The degree of membership in a possible diagnosis is expressed as a mathematical function called a membership function. The form of the membership function is shown in Fig. 6. There is a unique membership function for each indication type on each frequency. Membership functions for each measurement parameter and material condition were derived from fundamental eddy current relationships, laboratory results, and interviews with experienced ET analysts.
Figure 6-Membership function used in Dodger.
For a given measurement, the system considers its membership in all possible diagnoses simultaneously. This is illustrated in Fig. 7 for a phase angle of 175 degrees on a low frequency signal. For each physical measurement and frequency, the system evaluates a group of membership functions to obtain the memberships in each possible diagnosis. All of these memberships are used together as independent measures of belief in the possible diagnoses. They serve as input to an evidence combination algorithm that yields a composite measure of belief for each possible material condition.
The belief values obtained from the physical measurements at all available frequencies often appear to be contradictory. This is inherent in eddy current analysis where specific frequencies are designed to be sensitive to particular flaw types. Two requirements were imposed on the reasoning with uncertainty system. First, a method is required
that narrows the set of possible diagnoses as evidence is accumulated. This models how a human analyst arrives at a diagnosis. Second, the method must be able to discriminate between conflicting evidence and lack of information.
After physical measurements are transformed into beliefs in each diagnostic category by the membership functions, they are combined using the Dempster-Shafer theory of evidence7v8 to obtain belief intervals. These intervals express the composite belief from all the available evidence for each particular material condition. Belief intervals are of the form [b,p], where b gives the total amount of belief in a diagnosis and p gives an upper bound on the belief; b is called belief and p is called “plausibility”. The width of the belief interval is a measure of the uncertainty in the diagnosis.
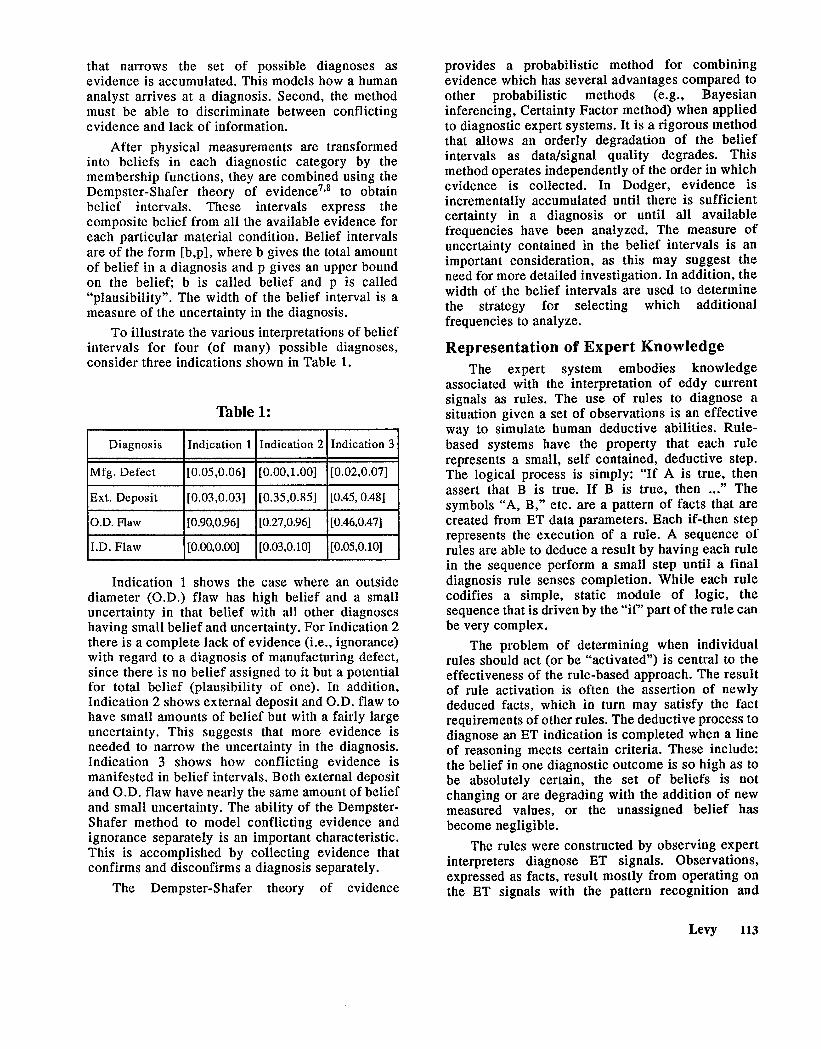
To illustrate the various interpretations of belief intervals for four (of many) possible diagnoses, consider three indications shown in Table 1.
Table 1:
Diagnosis Indication 1 Indication 2 Indication 3
Mfg. Defect [0.05,0.06] [O.OO,l.OO] [0.02,0.07]
Ext. Deposit
O.D. Flaw
[0.03,0.03] [0.35,0.85] [0.45,0.48]
[0.90,0.96] [0.27,0.96] [0.46,0.47]
I I.D. Flaw ([0.00,0.00] ~[0.03,0.10] ~[0.05,0.10] 1
Indication 1 shows the case where an outside diameter (O.D.) flaw has high belief and a small uncertainty in that belief with all other diagnoses having small belief and uncertainty. For Indication 2 there is a complete lack of evidence (i.e., ignorance) with regard to a diagnosis of manufacturing defect, since there is no belief assigned to it but a potential for total belief (plausibility of one). In addition, Indication 2 shows external deposit and O.D. flaw to have small amounts of belief but with a fairly large uncertainty. This suggests that more evidence is needed to narrow the uncertainty in the diagnosis. Indication 3 shows how conflicting evidence is manifested in belief intervals. Both external deposit and O.D. flaw have nearly the same amount of belief and small uncertainty. The ability of the Dempster- Shafer method to model conflicting evidence and ignorance separately is an important characteristic. This is accomplished by collecting evidence that confirms and disconfirms a diagnosis separately.
The Dempster-S hafer theory of evidence
provides a probabilistic method for combining evidence which has several advantages compared to other probabilistic methods (e.g., Bayesian inferencing, Certainty Factor method) when applied to diagnostic expert systems. It is a rigorous method that allows an orderly degradation of the belief intervals as data/signal quality degrades. This method operates independently of the order in which evidence is collected. In Dodger, evidence is incrementally accumulated until there is sufficient certainty in a diagnosis or until all available frequencies have been analyzed. The measure of uncertainty contained in the belief intervals is an important consideration, as this may suggest the need for more detailed investigation. In addition, the width of the belief intervals are used to determine the strategy for selecting which additional frequencies to analyze.
Representation of Expert Knowledge The expert system embodies knowledge
associated with the interpretation of eddy current signals as rules. The use of rules to diagnose a situation given a set of observations is an effective way to simulate human deductive abilities. Rule- based systems have the property that each rule represents a small, self contained, deductive step. The logical process is simply: “If A is true, then assert that B is true. If B is true, then . ..” The symbols “A, B,” etc. are a pattern of facts that are created from ET data parameters. Each if-then step represents the execution of a rule. A sequence of rules are able to deduce a result by having each rule in the sequence perform a small step until a final diagnosis rule senses completion. While each rule codifies a simple, static module of logic, the sequence that is driven by the “if” part of the rule can be very complex.
The problem of determining when individual rules should act (or be “activated”) is central to the effectiveness of the rule-based approach. The result of rule activation is often the assertion of newly deduced facts, which in turn may satisfy the fact requirements of other rules. The deductive process to diagnose an ET indication is completed when a line of reasoning meets certain criteria. These include: the belief in one diagnostic outcome is so high as to be absolutely certain, the set of beliefs is not changing or are degrading with the addition of new measured values, or the unassigned belief has become negligible.
The rules were constructed by observing expert interpreters diagnose ET signals. Observations, expressed as facts, result mostly from operating on the ET signals with the pattern recognition and
Levy 113
I.D. Defect
J-l-
support Plate
A-
Bulge
A-
2 2 :: B
Manufacturing Defect
.;
E
P
g
0.0. Defect
Conductive Deposit
ii
ExtWnal DeDOSit k
-60 0 60 120 180
Phase Angle (Degrees)
240 300
Figure 7-Member functions for phase angle of the prima y differential signal.
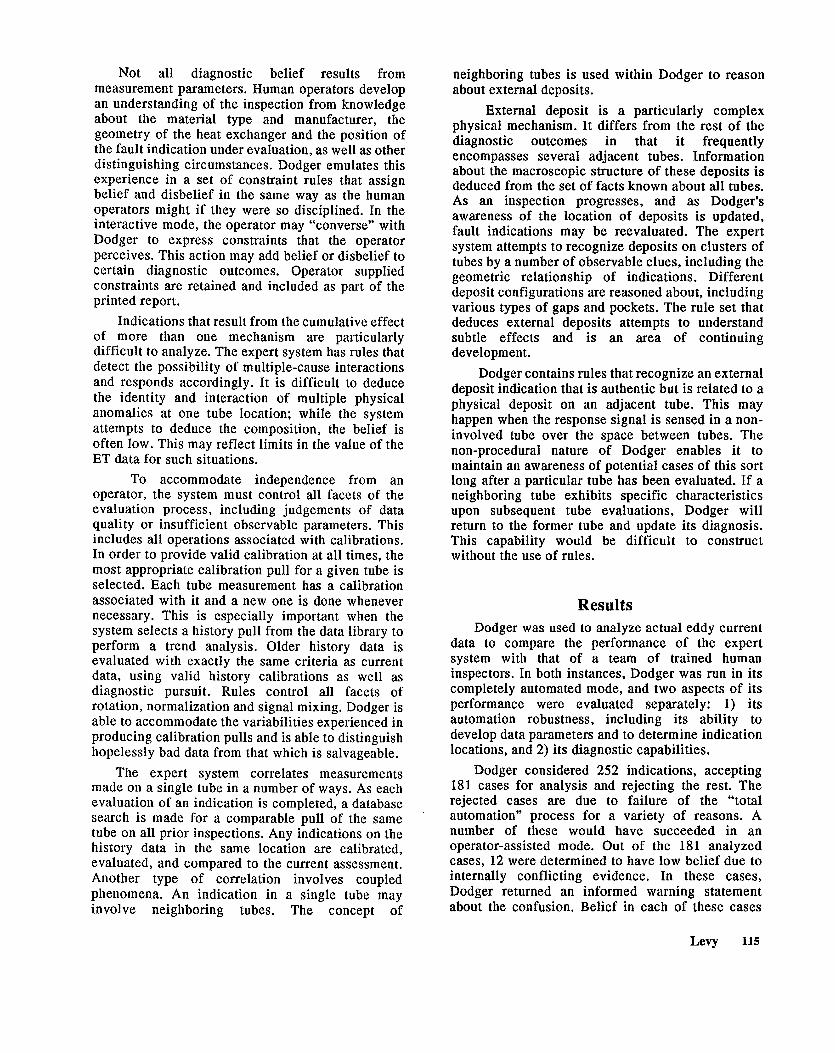
Figure 8-Comparison of phase angle determinations, inspectors’ results vs. Dodger’s results.
reasoning with uncertainty modules described above. The data-driven process relieves the system designer from the task of programming and verifying logical paths through a computer code. It is assumed that if small logical steps (rules) make sense then the system will make correct deductions. This assumption has been validated by observing the behavior of Dodger compared with a human evaluator on many real data cases.
The expert system is comprised of sets of rules that focus on different facets of the evaluation process. Some rules determine a strategy used to pursue a diagnosis. The diagnosis indicates how extensive the indication is, and what its relations to other known indications are. In addition, rules manage the complex procedures required to perform intelligent manipulation of the data, such as calibrations and signal mixing.
Reasoning about the nature of an indication is done by creating a hypothesis (e.g., O.D. flaw, external deposit) for each diagnostic outcome. Each hypothesis retains information such as its prevailing believability as the diagnostics proceed. The system
retains the essential information about a heat exchanger including all hypotheses during the course of an inspection. As the analysis of a heat exchanger progresses, more and more becomes known about its global condition and the indication locations.
The perception of the belief in each of the hypotheses is refined as each new parameter is evaluated. These parameters include phase, amplitude and several shape descriptors of the Lissajous pattern of each signal of the multi- frequency data. Selecting the most effective signal to evaluate is part of the diagnosis strategy. The strategy is adjusted dynamically to pursue the most likely hypothesis. It is equally important to exclude extraneous information resulting from evaluating an “uninvolved” signal. This is unlikely to enhance the belief but might otherwise add “noise” to the aggregate information. For instance, it is unlikely that a very high-frequency absolute signal will add meaningful information to a diagnosis of O.D. defects. Including that piece of information too early might add unnecessary confusion to the determination.
114 IAAI
Not all diagnostic belief results from measurement parameters. Human operators develop an understanding of the inspection from knowledge about the material type and manufacturer, the geometry of the heat exchanger and the position of the fault indication under evaluation, as well as other distinguishing circumstances. Dodger emulates this experience in a set of constraint rules that assign belief and disbelief in the same way as the human operators might if they were so disciplined. In the interactive mode, the operator may “converse” with Dodger to express constraints that the operator perceives. This action may add belief or disbelief to certain diagnostic outcomes. Operator supplied constraints are retained and included as part of the printed report.
Indications that result from the cumulative effect of more than one mechanism are particularly difficult to analyze. The expert system has rules that detect the possibility of multiple-cause interactions and responds accordingly. It is difficult to deduce the identity and interaction of multiple physical anomalies at one tube location; while the system attempts to deduce the composition, the belief is often low. This may reflect limits in the value of the ET data for such situations.
To accommodate independence from an operator, the system must control all facets of the evaluation process, including judgements of data quality or insufficient observable parameters. This includes all operations associated with calibrations. In order to provide valid calibration at all times, the most appropriate calibration pull for a given tube is selected. Each tube measurement has a calibration associated with it and a new one is done whenever necessary. This is especially important when the system selects a history pull from the data library to perform a trend analysis. Older history data is evaluated with exactly the same criteria as current data, using valid history calibrations as well as diagnostic pursuit. Rules control all facets of rotation, normalization and signal mixing. Dodger is able to accommodate the variabilities experienced in producing calibration pulls and is able to distinguish hopelessly bad data from that which is salvageable.
The expert system correlates measurements made on a single tube in a number of ways. As each evaluation of an indication is completed, a database search is made for a comparable pull of the same tube on all prior inspections. Any indications on the history data in the same location are calibrated, evaluated, and compared to the current assessment. Another type of correlation involves coupled phenomena. An indication in a single tube may involve neighboring tubes. The concept of
neighboring tubes is used about external deposi ss.
within Dodger to reason
External deposit is a particularly complex physical mechanism. It differs from the rest of the diagnostic outcomes in that it frequently encompasses several adjacent tubes. Information about the macroscopic structure of these deposits is deduced from the set of facts known about all tubes. As an inspection progresses, and as Dodger’s awareness of the location of deposits is updated, fault indications may be reevaluated. The expert system attempts to recognize deposits on clusters of tubes by a number of observable clues, including the geometric relationship of indications. Different deposit configurations are reasoned about, including various types of gaps and pockets. The rule set that deduces external deposits attempts to understand subtle effects and is an area of continuing development.
Dodger contains rules that recognize an external deposit indication that is authentic but is related to a physical deposit on an adjacent tube. This may happen when the response signal is sensed in a non- involved tube over the space between tubes. The non-procedural nature of Dodger enables it to maintain an awareness of potential cases of this sort long after a particular tube has been evaluated. If a neighboring tube exhibits specific characteristics upon subsequent tube evaluations, Dodger will return to the former tube and update its diagnosis. This capability would be difficult to construct without the use of rules.
Results Dodger was used to analyze actual eddy current
data to compare the performance of the expert system with that of a team of trained human inspectors. In both instances, Dodger was run in its completely automated mode, and two aspects of its performance were evaluated separately: 1) its automation robustness, including its ability to develop data parameters and to determine indication locations, and 2) its diagnostic capabilities.
Dodger considered 252 indications, accepting 181 cases for analysis and rejecting the rest. The rejected cases are due to failure of the “total automation” process for a variety of reasons. A number of these would have succeeded in an operator-assisted mode. Out of the 181 analyzed cases, 12 were determined to have low belief due to internally conflicting evidence. In these cases, Dodger returned an informed warning statement about the confusion. Belief in each of these cases
J-Jew 115

was less than 0.3, and these were excluded from the comparative statis tical analysis.
The remaining 169 indications turned out to be primarily O.D. defects. Table 2 shows the differences between Dodger’s and the inspectors’ evaluations of pattern amplitude and phase, as well as computed depth of penetration (for the O.D. defects) in the primary differential signal.
Table 2:
Phase [Degrees] 3.09 4.13 0.94
Depth [%] -3.86 4.35 0.92
This table provides mean differences, standard deviations, and correlations. It should be noted that these statistics represent the combined variations of the Dodger- and analyst-generated results. Fig. 8 shows in more detail the results of phase angle comparison.
The distribution of belief for the Dodger results showed that 88% of the cases analyzed had beliefs exceeding 0.9, meaning that for the preponderance of indications (primarily for O.D. defects), the different ET signals contain little conflicting evidence. A conclusion such as this is the consequence of the objectivity of an expert system analysis together with a quantitative method of combining evidence.
In general, the results obtained from these two combined inspections demonstrate a close agreement between the diagnostic results obtained by Dodger and those obtained by trained inspectors. Confidence in the Dodger system is, thus, greatly enhanced. Modifications in the totally-unattended mode of operation are being made to improve robustness.
Deployrnent And Maintainability The Dodger expert system is being used by a
project engineering team. It is used for the complete analysis of heat exchanger eddy current inspection data. Each inspection is a large data acquisition and evaluation undertaking, probing heat exchanger tubing with the resolution of one part in several million. The enormous quantities of data require meticulous examination and evaluation. The inspection requires system shutdown and a dedicated maintenance team to provide access and inspection
services. Primary and overcheck analyses are performed by a team of evaluators. Primary analyses are conducted in parallel with data acquisition, so that results can be used to adjust the data acquisition strategy. The expert system, running on a VAXstation, is capable of “real time” operation by deploying it on several workstations simultaneously under the direction of a single user.
The current production deployment of Dodger is used to overcheck a primary evaluation. Independent overchecks of data have always been used to assure the accuracy of the analysis. Before the deployment of the expert system, less than 5% of the data were overchecked. The use of the experts system enables 100% overcheck to be performed in a timely, cost effective manner supporting facility schedules and restart of operations. Human evaluators are now free to interpret the most difficult cases in greater detail.
The environment in which these inspections are done is one where errors in interpretation are not tolerated. This requires that all indications must be fully evaluated while the heat exchanger is accessible and that zero evaluation errors must be assured at the conclusion of the inspection. The payoff from using Dodger is that it maximizes assurance that data has been interpreted thoroughly, that trends are evaluated consistently, and if necessary, corrective actions are taken. This 100% overcheck precludes redeployment of the maintenance team with the associated facility downtime and cost of an unplanned reinspection.
The integration of machine pattern recognition, reasoning with uncertainty, and automatic calibration as independent subsystems requires a design that can be easily maintained and expanded. The functions to be performed by each subsystem were clearly defined along with it’s interface to the expert system. This allowed each subsystem to be developed and tested independently prior to incorporation into the system. Any enhancements that are made to a subsystem are tested independently before integration into the system.
Dodger has been designed to allow the incremental addition of new application knowledge and diagnostic categories. This is possible because the evidence accumulation process is separate from evidence combination. A single list of possible diagnoses guides the evidence combination process. The addition of a new diagnosis requires adding that diagnosis to the list. In addition, new membership functions may be added for those measurements that provide information about the new diagnosis. The rules responsible for producing a final diagnosis examine the same list of possible diagnoses in light of the combined evidence for each one, in order to
116 IAAI
select the best diagnosis. Dodger is currently maintained by the
developers. The current thrust is to redeploy the system on a UNIX workstation as well as provide maintenance for the original VAXstation platform. Periodic updates to the knowledge base are anticipated as eddy current technology continues to develop.
Conclusions The application of expert system technology to
eddy current interpretation has provided distinct advantages in achieving the objectives set forth. Eddy current analysts could be included in all stages of development because close correlation was maintained between rule formulations and ET methodology. In addition, it was easy to ascertain the effect of including new guidelines to an operational system.
The expert system described here demonstrates the desired consistency of interpretation. Given an indication represented by repeated data sets, the system has provided uniform diagnoses. This enables more precise growth assessments. The system is sufficiently stable to yield similar diagnoses even as the data exhibits small variations. Dodger has demonstrated robustness in gradually reducing belief in an outcome as input data quality degrades. Historical data, when they exist, are analyzed in the same manner as current data, thereby providing consistent trend assessments.
It has been possible to embody much of the aggregate experience of the experts in a comprehensive knowledge base. Since the inception of this effort a number of the experts have left the NDT working groups; yet their expertise has been retained in a functional form.
The use of modular systems has resulted in an expert system that is extremely maintainable. Much new information was learned and was incorporated into Dodger’s body of knowledge with only minor modifications.
Although the system can operate in a fully automated mode, it is not a “black box” type of operation. It provides a comprehensive trace of its reasoning to justify its conclusions. The complete report of analysis for all indications and calibrations was useful in understanding reasons for those cases where diagnoses were uncertain. Human operators overchecked the small number of cases where conclusions were in doubt.
The analysis presented by Dodger provided a
well-defined quantitative measure of belief and confidence in the diagnoses, even in those cases where the data contained conflicting evidence. In contrast to other statistical methods, the methods used here distinguished between ignorance and disagreement in evaluating the data.
Many tee hnical hurdles are involved in modelling the expertise of a qualified ET analyst. The most important of these have been addressed in the development of Dodger. The results achieved to date encourage further development in treating increasingly complex indications.
References i Clayton, Bruce D., “ART Programming
Tutorial”, Vols 1,3,4., 1987 Inference Corp., Los Angeles, CA.
2 Marr, D., w.1982, W.H.Freeman, San Francisco, CA; Richter, J., and S. Ullman, “Non- Linearities in Cortical Simple Cells and the Possible Detection of Zero-Crossings”, Biological Cvbernetics, Vol. 53, 1986, pp. 195202.
3 Asada, H., and M. Brady, “The Curvature Primal Sketch”, IEEE Transactions on Patte n, . . achxne Intellrgence , Vol. 8, No. ‘1,
4 Canny, J.F., “Finding Edges and Lines in Images”, MIT AI Laboratorv Renort No. 720, June, 1983.
. 5 Zadah, L.A., “Fuzzy Sets,” ,Inform@on and Control, Vol. 8, 1965, pp 338-353.
6 Klir, G.J. and T.A. Folger, Fuzzv Sets, Uncertaintv. and Information, 1988, Prentice-Hall, Englewood Cliffs, NJ.
7 Shafer, G., A Mathematical Theorv of Evidence, 1976, Princeton University Press, Princeton, NJ.
* Barnett, J.A., “Computational Methods for a Mathematical Theory of Evidence,” In Proceedin= . . of the 7th Inter- Joint Conference on
cral Intelligence, Vancouver, B.C., 1981, pp 868-875.
Levy 117