18.03.2013 economic impact of draft minerals law, dr. brian fisher
TRANSCRIPT
Economic assessment of the impact of Mongolia’s foreign investment environment
and the proposed new mineral law
Dr Brian Fisher
Presentation to the Business Council of Mongolia, 18 March, Kempinski Hotel, Ulaanbaatar

Economic assessment of the impact of Mongolia’s proposed new mineral law
Purpose of the analysis: The analysis seeks to estimate the total impact (direct and indirect) of proposed new mineral
law implementation on the Mongolian economy (domestic and external sectors, households and government)
Purpose and contents of the analysis
1 • Role of the mining sector in the Mongolian economy
2 • Proposed new mineral law
3 • Methodology and assumptions used in the analysis
4 • Implications of the proposed new mineral law on the economy (model insights)
5 • Conclusions
Contents:

The contribution of mining to the Mongolian economy
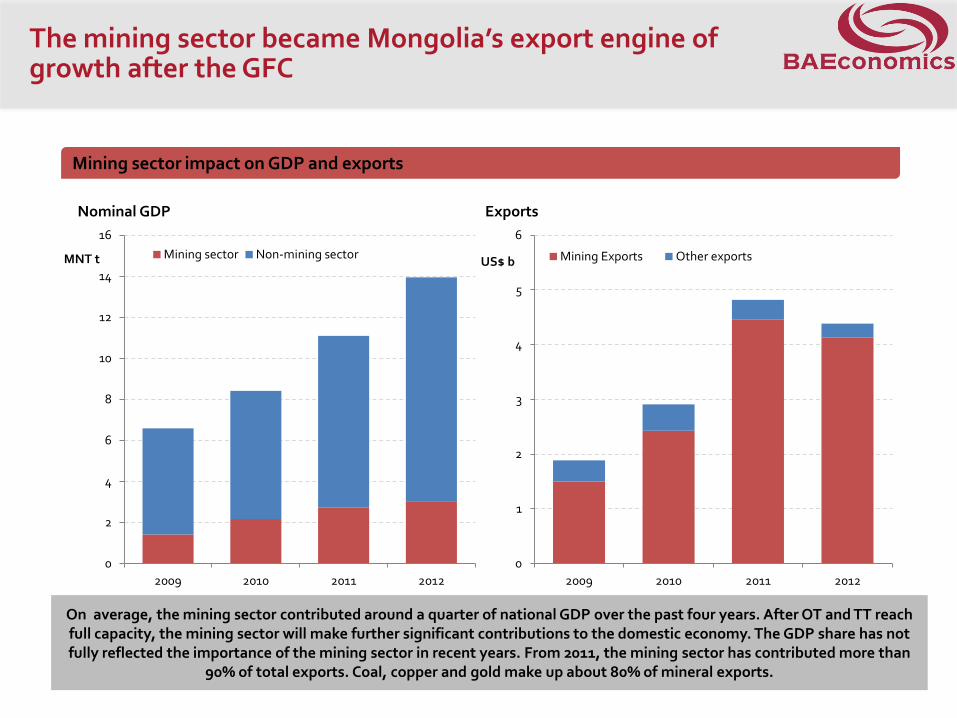
The mining sector became Mongolia’s export engine of growth after the GFC
On average, the mining sector contributed around a quarter of national GDP over the past four years. After OT and TT reach full capacity, the mining sector will make further significant contributions to the domestic economy. The GDP share has not fully reflected the importance of the mining sector in recent years. From 2011, the mining sector has contributed more than
90% of total exports. Coal, copper and gold make up about 80% of mineral exports.
Mining sector impact on GDP and exports
0
2
4
6
8
10
12
14
16
2009 2010 2011 2012
MNT t
Nominal GDP
Mining sector Non-mining sector
0
1
2
3
4
5
6
2009 2010 2011 2012
US$ b
Exports
Mining Exports Other exports

The growing demand for mining commodities and a favourable business environment in the past have attracted foreign direct investment into Mongolia
Of the total FDI inflow, US$8.6 billion or approximately 81 per cent has been injected into the mining sector in Mongolia in the past four years. Of this percentage, OT alone has invested US$6.2 billion of CAPEX in its first phase. In 2012 the
Mongolian Mining Corporation (MMC), which owns one of the largest coking coal mines, Ukhaa Khudag, planned for its capital expenditure on infrastructure to rise by approximately US$1.3 billion.
Mining sector impact on investment
0.0
0.5
1.0
1.5
2.0
2.5
3.0
3.5
4.0
4.5
5.0
2009 2010 2011 2012
US$ b
Foreign direct investment
Mining FDI Non-mining FDI
0
1
1
2
2
3
3
4
2010 2011 2012
US$ b
Major foreign investment in the mining sector
MMC's IPO and Bond OT CAPEX
MAK loan from EBRD

Income from the growing mining sector is a vital source of finance for the Mongolian government
The government’s reliance on mining sector income has grown higher in recent years via both tax and non-tax income collection. In the past four years the government earned MNT 4.2 trillion in tax income and MNT 0.75 trillion of prepayment
from the mining sector. Not only is direct tax income from the mining sector important, tax income from mining service companies is also growing significantly. For example, a total of MNT 283.9 billion has been paid to local suppliers from Oyu
Tolgoi LLC in the past three years.
Mining sector impact on government revenue
Income Tax
(10%-25%)
VAT
Withholding Tax
(20%*)
Depreciation
(Mainly 10 years)
Progressive Royalty
(0%-15%) Loss Carry Forward
(4-8 years)
Royalties
(5%)
Tax Holiday
(none)
Import Duties
(5%)
Export Duties (none)
Mining Tax
System
*Subject to double taxation treaties
Key taxes that apply to mining in Mongolia
25% 35% 27%
31%
37% 23%
0
1
2
3
4
5
6
2007 2008 2009 2010 2011 2012
Budget revenue (MNT trillion)
Revenue from sources other than mining
Revenue from mining (including prepayment)

If the business environment is favourable a number of mining companies are expected to commission operations in the near future
Strategic Resource Classification
0
5
10
15
20
25
30
35
40
2000 2008 2010 2011 2012 2013 2014 2015
Number of projects
copper coal gold iron ore
9 NEW PROJECTS
In the coming three years mining companies may implement nine new projects if business conditions are favourable. Coal projects are likely to constitute the majority of new projects. It is estimated that the total investment in these new mining
projects could be US$6.3 billion by 2015.

Mineral law

The Mineral law is the main regulation affecting the mining sector but there are many other laws that have an impact on mining
Foreign Labour Force
Laws^
Mining Health and Equipment
Certification
Water Law
Public Admin Law
Nuclear Energy Law
General Law on
Environment Protection
Law on Explosives
Law on Land Fees
Competition Law
Mineral Law
Land Law
Law on Protected
Areas
Corporate Law
Labour Law
Law on Taxation
^Sending Labor Force Abroad and Receiving Labor Force and Specialists from Abroad *Law to Prohibit Mineral Exploration and Mining Operations at the Headwaters of Rivers, Protected Zones of Water Reservoirs and Forested Areas
Foreign Investment
Law
Law on Land Subsoil
Long Named Environment
Law*
Legislation relevant to mining projects
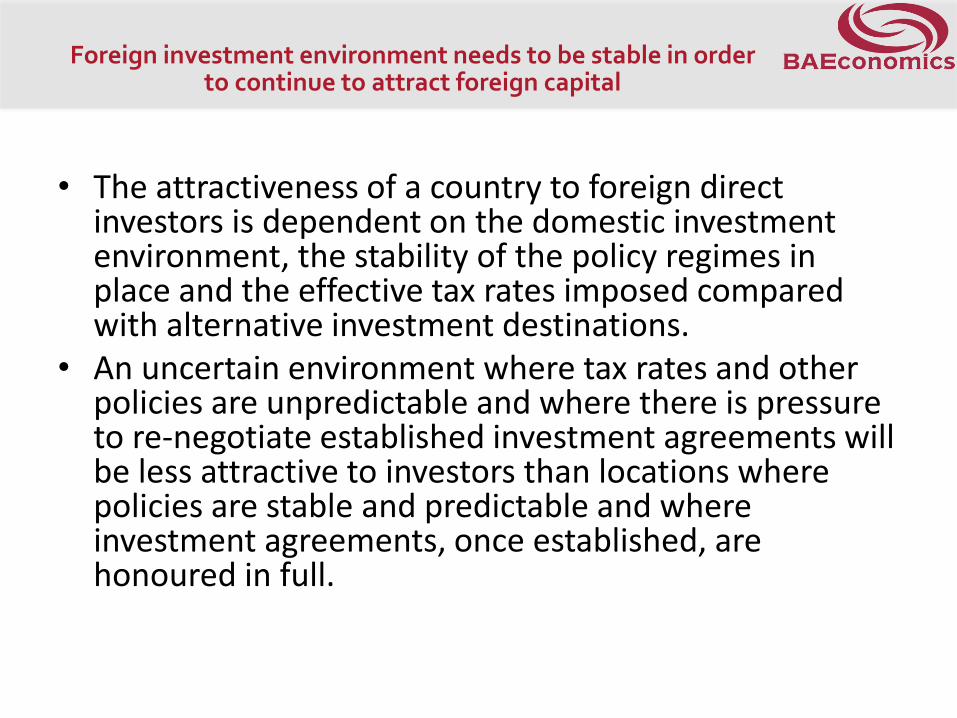
Foreign investment environment needs to be stable in order to continue to attract foreign capital
• The attractiveness of a country to foreign direct investors is dependent on the domestic investment environment, the stability of the policy regimes in place and the effective tax rates imposed compared with alternative investment destinations.
• An uncertain environment where tax rates and other policies are unpredictable and where there is pressure to re-negotiate established investment agreements will be less attractive to investors than locations where policies are stable and predictable and where investment agreements, once established, are honoured in full.

Impact of proposed new mineral law on exploration companies is very negative
Big mining projects: OT, TT, EMC
Medium and small projects
Exploration companies
Types of mining companies Summary of law implication
• Higher ownership requirement (up to 75% vs up to 50%)
• Impractical requirement for local involvement (at 60% procurement, mandatory cooperation agreement with the community in prospecting and exploration)
• Prohibition of high grading (required to extract entire ore without regard to the commercial value)
• Reduced financial incentive for investment (stabilization agreement is only available to strategic deposits, upfront closure cost payment tying up the capital investment)
• Reduced security of tenure (if the stabilization agreement ceases to comply with the interest of Mongolia, reopens the agreement and the equity is transferred to Mongolia free of charge)
• Prohibitive minimum exploration expenditure requirements (US$100k)
• Lack of transparency in the licensing process (Where a tender is rejected or blocked, it locks up potentially prospective ground for up to 4 years)
Relevant law article to the mining projects
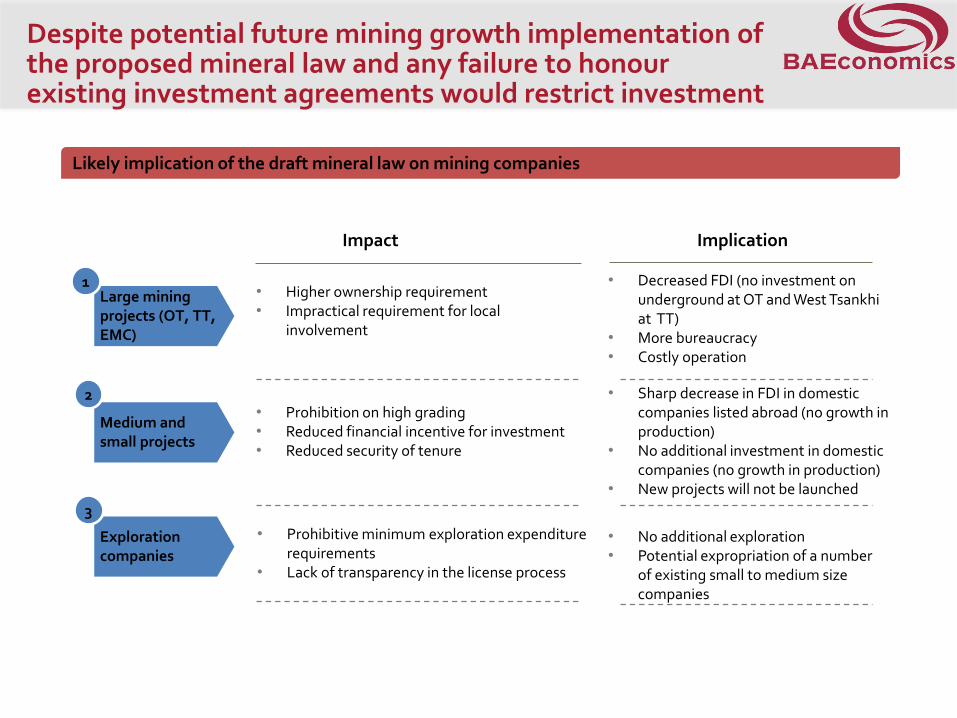
Despite potential future mining growth implementation of the proposed mineral law and any failure to honour existing investment agreements would restrict investment
Large mining projects (OT, TT, EMC)
Medium and small projects
Exploration companies
• Prohibitive minimum exploration expenditure requirements
• Lack of transparency in the license process
• Prohibition on high grading • Reduced financial incentive for investment • Reduced security of tenure
• Higher ownership requirement • Impractical requirement for local
involvement
1
2
3
Impact Implication
• No additional exploration • Potential expropriation of a number
of existing small to medium size companies
• Sharp decrease in FDI in domestic companies listed abroad (no growth in production)
• No additional investment in domestic companies (no growth in production)
• New projects will not be launched
• Decreased FDI (no investment on underground at OT and West Tsankhi at TT)
• More bureaucracy • Costly operation
Likely implication of the draft mineral law on mining companies

Methodology and assumptions used in the economic assessment of the new mineral law

*see detail in appendix ,
MINCGEMv2: A dynamic general equilibrium model with detailed sectoral, national and government accounts
CGE models have several features making them the most appropriate tool for policy and scenario analysis
CGE models are structured on the basics of supply and demand. Each sector of the economy is linked by supply and use of factors and intermediate inputs.
CGE models account for the industrial flow-on effects triggered by shocks in other parts of the economy and the economic feedback effects that are neglected in many government policy analyses
Database: GTAP8 database (MINCGEMv2)
XXX: 2025 Highest Impact:2020 Methodology: Dynamic CGE (Computable General
Equilibrium)
Key features
GTAP v8 database with a base year of 2007 and covers 129 countries/regions across the world and 57 commodity groups
1
The MINCGEMv2 expands the GTAP commodity groups to 71 and was aggregated into 10 economies (Mongolia, China, Russia, India and others*) and 20 commodities
Mining (thermal coal, met coal, copper, gold, oil, gas, coke, petroleum and other minerals)
Agriculture (crops, livestock, fishing and forestry)
Manufacture (Processed Food, Copper refining and manufacturing, other manufacturing)
Electricity
Transport
Construction
Public Administration, Defense, Health and Education
Other services
2
Dynamic multi-region, multi-sector CGE model developed by BAEconomics
Capable of simulating economic scenarios over a long time horizon. Each time step is one year
Demand for commodities in the model is determined by the social accounting matrices of the modeling regions, the prevailing economic conditions and policy settings
CGE models are structured on the basics of supply and demand. Each sector of the economy is linked by supply and use of factors and intermediate inputs.
CGE models account for the industrial flow-on effects triggered by shocks in other parts of the economy and the economic feedback effects that are neglected in many government policy analyses
1
2
3
4
5
CGE models ensure that the most important economic identities and constraints (extremely important for simulating long-term scenarios):
• GDP measured by the expenditure approach and the income approach;
• Supply of capital, labour and natural resources;
• Market clearance of individual markets;
• The relationship between the current account and the capital account;
• The relationship between government expenditure and taxes;
are respected during each simulation time step.
CGE models contain detailed industry cost structure and bilateral trade information in their databases such that substitution between commodities and competition between economies can be modelled explicitly
Methodology of the economic analysis of proposed new mineral law

RunDynam software: for recursive dynamic models
Mining production
Mining prices
Mining FDI (exploration & expansion)
Infrastructure projects
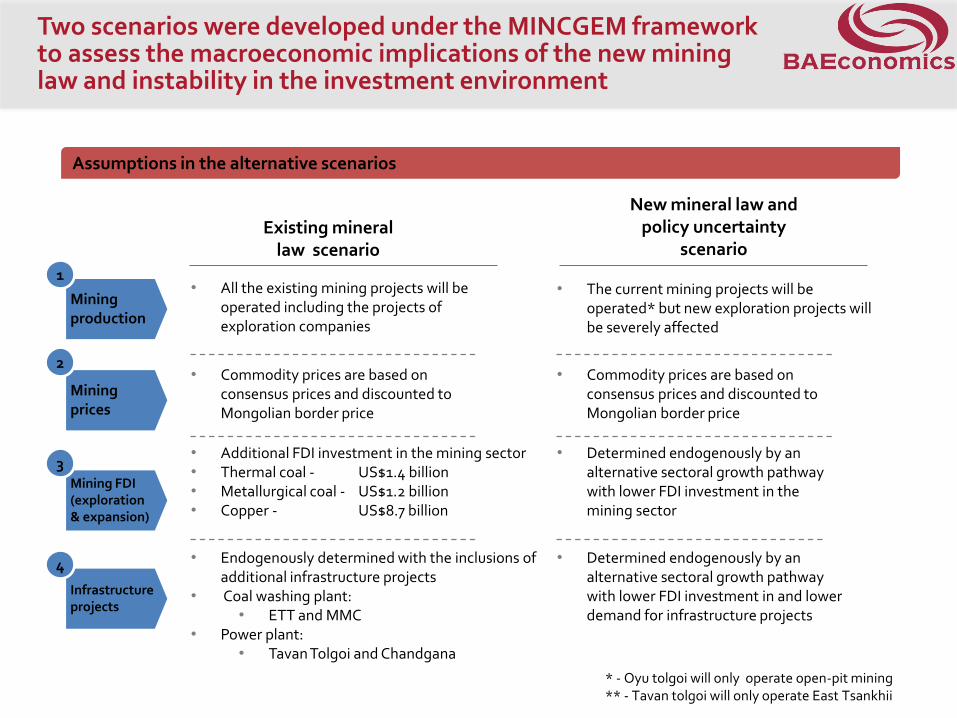
Two scenarios were developed under the MINCGEM framework to assess the macroeconomic implications of the new mining law and instability in the investment environment
• Endogenously determined with the inclusions of additional infrastructure projects
• Coal washing plant: • ETT and MMC
• Power plant: • Tavan Tolgoi and Chandgana
• All the existing mining projects will be operated including the projects of exploration companies
1
2
3
4
Existing mineral law scenario
New mineral law and policy uncertainty
scenario
• Determined endogenously by an alternative sectoral growth pathway with lower FDI investment in the mining sector
• Determined endogenously by an alternative sectoral growth pathway with lower FDI investment in and lower demand for infrastructure projects
* - Oyu tolgoi will only operate open-pit mining ** - Tavan tolgoi will only operate East Tsankhii
• Commodity prices are based on consensus prices and discounted to Mongolian border price
• Additional FDI investment in the mining sector • Thermal coal - US$1.4 billion • Metallurgical coal - US$1.2 billion • Copper - US$8.7 billion
Assumptions in the alternative scenarios
• The current mining projects will be operated* but new exploration projects will be severely affected
• Commodity prices are based on consensus prices and discounted to Mongolian border price
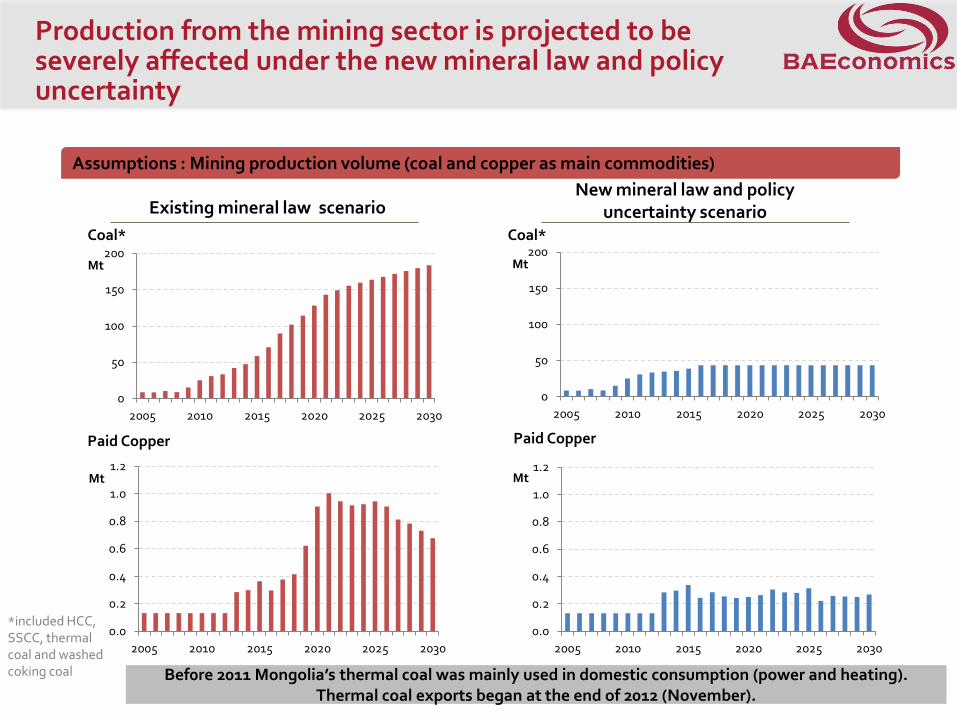
Production from the mining sector is projected to be severely affected under the new mineral law and policy uncertainty
0
50
100
150
200
2005 2010 2015 2020 2025 2030
Mt
Coal*
Assumptions : Mining production volume (coal and copper as main commodities)
Existing mineral law scenario New mineral law and policy
uncertainty scenario
0
50
100
150
200
2005 2010 2015 2020 2025 2030
Mt
Coal*
0.0
0.2
0.4
0.6
0.8
1.0
1.2
2005 2010 2015 2020 2025 2030
Mt
Paid Copper
0.0
0.2
0.4
0.6
0.8
1.0
1.2
2005 2010 2015 2020 2025 2030
Mt
Paid Copper
*included HCC, SSCC, thermal coal and washed coking coal, Bef0re 2011 Mongolia’s thermal coal was mainly used in domestic consumption (power and heating).
Thermal coal exports began at the end of 2012 (November).

Price assumptions are based on latest consensus prices from economists around the world
Coal price is discounted to Mongolian border price in the model
0
10
20
30
40
50
60
70
80
2012 2014 2016 2018 2020 2022 2024 2026 2028 2030
US$/t
0
50
100
150
200
250
300
350
400
2012 2014 2016 2018 2020 2022 2024 2026 2028 2030
USc/lb
0
200
400
600
800
1,000
1,200
1,400
1,600
1,800
2012 2014 2016 2018 2020 2022 2024 2026 2028 2030
US$/oz
Thermal coal Coking coal
Copper Gold
Assumptions : consensus prices (2013 real prices)
0
20
40
60
80
100
120
2012 2014 2016 2018 2020 2022 2024 2026 2028 2030
US$/t

Modeling results
20 БҮХ ЭРХ ХУУЛИАР ХАМГААЛАГДСАН © 2012, ОЮУ ТОЛГОЙ ХХК COPYRIGHT © 2012 OYU TOLGOI , ALL RIGHTS RESERVED
0
20
40
60
80
100
120
2012 2014 2016 2018 2020 2022 2024 2026 2028 2030
Real GDP (MNT trillion, 2013 price)
Existing mineral law scenario
New mineral law scenario
^Domestic suppliers, employees and government’s import purchase based on revenue from OT
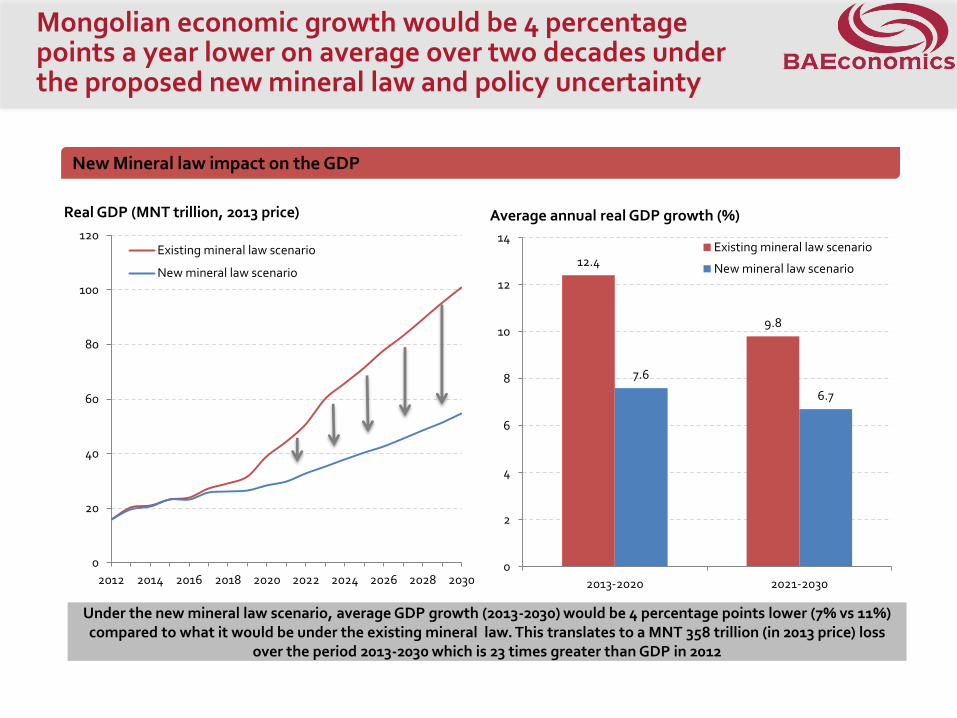
New Mineral law impact on the GDP
Under the new mineral law scenario, average GDP growth (2013-2030) would be 4 percentage points lower (7% vs 11%) compared to what it would be under the existing mineral law. This translates to a MNT 358 trillion (in 2013 price) loss
over the period 2013-2030 which is 23 times greater than GDP in 2012
12.4
9.8
7.6
6.7
0
2
4
6
8
10
12
14
2013-2020 2021-2030
Average annual real GDP growth (%)
Existing mineral law scenario
New mineral law scenario
Mongolian economic growth would be 4 percentage points a year lower on average over two decades under the proposed new mineral law and policy uncertainty
21 БҮХ ЭРХ ХУУЛИАР ХАМГААЛАГДСАН © 2012, ОЮУ ТОЛГОЙ ХХК COPYRIGHT © 2012 OYU TOLGOI , ALL RIGHTS RESERVED
0
5
10
15
20
25
30
35
2012 2014 2016 2018 2020 2022 2024 2026 2028 2030
Real GDP per person (MNT million, 2013 price)
Existing mineral law scenario
New mineral law scenario
^Domestic suppliers, employees and government’s import purchase based on revenue from OT
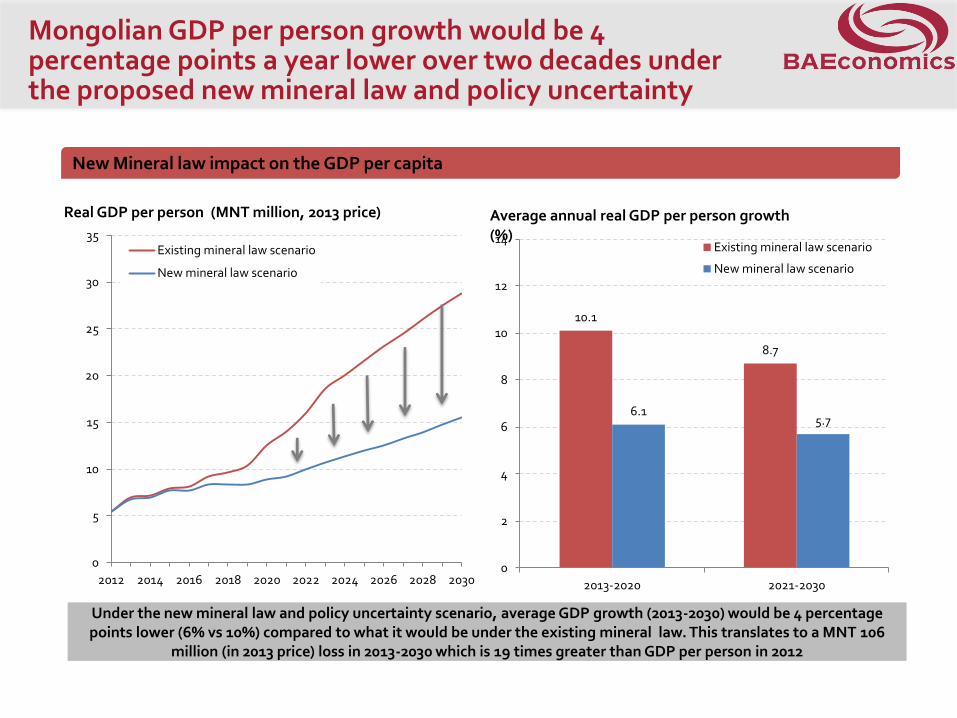
New Mineral law impact on the GDP per capita
Under the new mineral law and policy uncertainty scenario, average GDP growth (2013-2030) would be 4 percentage points lower (6% vs 10%) compared to what it would be under the existing mineral law. This translates to a MNT 106
million (in 2013 price) loss in 2013-2030 which is 19 times greater than GDP per person in 2012
10.1
8.7
6.1 5.7
0
2
4
6
8
10
12
14
2013-2020 2021-2030
Average annual real GDP per person growth (%)
Existing mineral law scenario
New mineral law scenario
Mongolian GDP per person growth would be 4 percentage points a year lower over two decades under the proposed new mineral law and policy uncertainty

22 БҮХ ЭРХ ХУУЛИАР ХАМГААЛАГДСАН © 2012, ОЮУ ТОЛГОЙ ХХК COPYRIGHT © 2012 OYU TOLGOI , ALL RIGHTS RESERVED
GDP by sectors (MNT trillion, 2013 price)
Domestic Sectors
All production sectors would experience significant growth under the existing mineral law despite the competition for labour and capital from the mining sector
0
20
40
60
80
100
120
2013 2015 2017 2019 2021 2023 2025 2027 2029
Existing mineral law scenario
Agriculture Mining
Manufacturing Transport
Services
0
20
40
60
80
100
120
2013 2015 2017 2019 2021 2023 2025 2027 2029
New mineral law and policy uncertainty scenario
Agriculture Mining
Manufacturing Transport
Services
The size of the mining sector would at least 50% smaller under the scenario with the new mineral law and policy uncertainty. The size of the other production sectors would also be significantly smaller. The positive effects generated by the mining
sector is far greater than the potential ‘Dutch disease’ effect.

23 БҮХ ЭРХ ХУУЛИАР ХАМГААЛАГДСАН © 2012, ОЮУ ТОЛГОЙ ХХК COPYRIGHT © 2012 OYU TOLGOI , ALL RIGHTS RESERVED
0
5
10
15
20
25
30
35
2012 2014 2016 2018 2020 2022 2024 2026 2028 2030
Impact on exports
New mineral lawscenario
Existing minerallaw scenario
^only goods import (not included service import)
Impact on international trade (MNT trillion, 2013 price)
External Sectors
0
5
10
15
20
25
30
35
2012 2014 2016 2018 2020 2022 2024 2026 2028 2030
Impact on imports
New mineral lawscenario
Existing minerallaw scenario
The proposed new mining law would have significant impacts on international trade
By 2020, the total exports would exceed 12 trillion MNT (in today’s prices) under the existing mineral law. This is about threefold what it would be under the new mineral law and policy uncertainty. Strong economic growth and
appreciation in the real exchange rate under the existing mineral law increases the purchasing power of domestic households and thus increases the demand for imported goods.

24 БҮХ ЭРХ ХУУЛИАР ХАМГААЛАГДСАН © 2012, ОЮУ ТОЛГОЙ ХХК COPYRIGHT © 2012 OYU TOLGOI , ALL RIGHTS RESERVED
0.0
0.2
0.4
0.6
0.8
1.0
1.2
1.4
1.6
1.8
2.0
2012 2014 2016 2018 2020 2022 2024 2026 2028 2030
Impact on terms of trade
New mineral law scenario
Existing mineral law scenario
^only goods import (not included service import)
Impact on terms of trade and exchange rate (index, 2012=1)
External Sectors
New mining law and policy uncertainty weakens the domestic exchange rate of Mongolia in the short run and reduces the purchasing power of domestic households
Strong export growth, coupled with steady increases in commodity prices before 2020, triggers a rise in the terms of trade under the existing mineral law scenario. Rising terms of trade is strongly connected to the appreciation of the real
exchange rate before 2020. Rising terms of trade increase the purchasing power of domestic households and the welfare of consumers.
0.0
0.2
0.4
0.6
0.8
1.0
1.2
1.4
1.6
1.8
2.0
2012 2014 2016 2018 2020 2022 2024 2026 2028 2030
Impact on exchange rate
Existing mineral law scenario
New mineral law scenario
MN
T d
epre
ciat
ion
25 БҮХ ЭРХ ХУУЛИАР ХАМГААЛАГДСАН © 2012, ОЮУ ТОЛГОЙ ХХК COPYRIGHT © 2012 OYU TOLGOI , ALL RIGHTS RESERVED
1.0
1.5
2.0
2.5
3.0
3.5
4.0
4.5
5.0
2012 2014 2016 2018 2020 2022 2024 2026 2028 2030
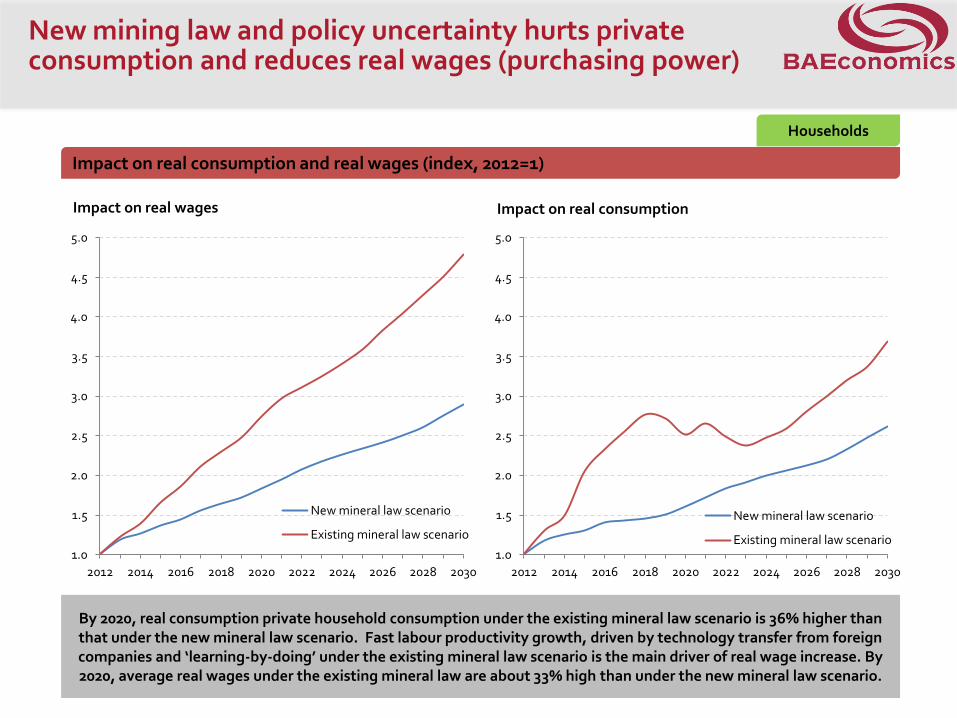
Impact on real consumption
New mineral law scenario
Existing mineral law scenario
^only goods import (not included service import)
Impact on real consumption and real wages (index, 2012=1)
By 2020, real consumption private household consumption under the existing mineral law scenario is 36% higher than that under the new mineral law scenario. Fast labour productivity growth, driven by technology transfer from foreign companies and ‘learning-by-doing’ under the existing mineral law scenario is the main driver of real wage increase. By 2020, average real wages under the existing mineral law are about 33% high than under the new mineral law scenario.
New mining law and policy uncertainty hurts private consumption and reduces real wages (purchasing power)
Households
1.0
1.5
2.0
2.5
3.0
3.5
4.0
4.5
5.0
2012 2014 2016 2018 2020 2022 2024 2026 2028 2030
Impact on real wages
New mineral law scenario
Existing mineral law scenario

26 БҮХ ЭРХ ХУУЛИАР ХАМГААЛАГДСАН © 2012, ОЮУ ТОЛГОЙ ХХК COPYRIGHT © 2012 OYU TOLGOI , ALL RIGHTS RESERVED
0
5
10
15
20
25
30
2012 2014 2016 2018 2020 2022 2024 2026 2028 2030
Total tax revenue
New mineral law scenario
Existing mineral law scenario
0.0
0.5
1.0
1.5
2.0
2.5
3.0
3.5
4.0
4.5
5.0
2012 2014 2016 2018 2020 2022 2024 2026 2028 2030
Tax revenue from mining
New mineral law scenario
Existing mineral law scenario
^only goods import (not included service import)
Impact on state budget (MNT trillion, 2013 price)
Under the new mining law, the government will receive considerably less tax from the mining sector and from other parts of the economy. Over the projection period from 2013-2030, the government will receive 37 trillion MNT (in today’s
prices) less from the mining sector and 110 trillion MNT (in today’s prices) from the whole economy under the new mining law with policy uncertainty, in comparison with the existing mineral law scenario. Note that dividends from
mining projects have not been included in these figures.
The proposed new mining law and policy uncertainty would weaken the government’s financial position and its capability to raise debt in the international market
Government

27 БҮХ ЭРХ ХУУЛИАР ХАМГААЛАГДСАН © 2012, ОЮУ ТОЛГОЙ ХХК COPYRIGHT © 2012 OYU TOLGOI , ALL RIGHTS RESERVED
-14
-12
-10
-8
-6
-4
-2
0
2012 2013 2014 2015 2016 2017* 2018 2019 2020 2021 2022^ 2023 2024 2025 2026 2027 2028 2029 2030
Total tax revenue loss under the new mineral law and policy uncertainty scenario
^only goods import (not included service import)
Impact on state budget (MNT trillion, 2013 price)
GoM raised US$1.5 billion in bonds from the international market in 2012 for the economic development of Mongolia. If we assume there will not be any budget expenditure change (decrease based on revenue decrease), budget deficit
will be US$1.5 billion more than otherwise by 2017 and US$13.5 billion more than otherwise by 2022 under the proposed new mineral law implementation and policy uncertainty in Mongolia
Chinggis bond repayments in 2017 and 2022 would be threatened by total revenue loss under the new mining law implementation under policy uncertainty
Government
*Period of 5yr Chinggis bond payment (US$0.5 billion)
^Period of 10yr Chinggis bond payment (US$1 billion)
US$1.5 billion
US$13.5 billion

28 БҮХ ЭРХ ХУУЛИАР ХАМГААЛАГДСАН © 2012, ОЮУ ТОЛГОЙ ХХК COPYRIGHT © 2012 OYU TOLGOI , ALL RIGHTS RESERVED
Economic Sectors
Households
Government
•Average GDP growth over the projection period (2013-30) will be 4 percentage points lower (7% vs 11%) compared to what it otherwise would have been under the existing mineral law. •Under the proposed mineral law all sectors of the economy would be significantly smaller than they would be under the existing mineral law. Strong growth in the minerals sector has significant positive spillover effects on other sectors of the economy. •From 2020 to 2030, total exports will be around 60% lower than what they otherwise would have been under the existing mineral law. Total imports and Mongolian trading firms will suffer a similar fate. •By 2030, real private household consumption would be around 30% lower under the proposed law with policy uncertainty. Average real wages would be around 35% lower than otherwise. •Lower labour productivity growth is driven by fewer opportunities for Mongolians to learn the latest technology from world leading companies. Technology transfer and ‘learning-by-doing’ are the two key factors driving the economic success in East Asian countries. •Over the projection period from 2013-2030, the government would receive 37 trillion MNT (in today’s prices) less in taxes from the mining sector and 110 trillion MNT (in today’s prices) from the whole economy, in comparison with the existing mineral law scenario thus poising a significant threat to the budget and the government’s ability to implement its programs.
Under the new mining law and policy uncertainty:
The negative impacts of the proposed new mineral law and policy uncertainty on Mongolia are significant
Conclusions

Appendix

30 БҮХ ЭРХ ХУУЛИАР ХАМГААЛАГДСАН © 2012, ОЮУ ТОЛГОЙ ХХК COPYRIGHT © 2012 OYU TOLGOI , ALL RIGHTS RESERVED
The Mongolian economy has grown significantly since the GFC based on mining and service sector output
10.2
8.8
-1.2
6.4
17.5
12.3
-5
0
5
10
15
20
2007 2008 2009 2010 2011 2012
Real GDP growth (%, y-o-y)
*Net tax included VAT, excise tax from vodka & tobacco and taxes on foreign trade ^Directly: most of mining sector’s suppliers in service sector. Indirectly: most of consumption is contributed to service sector (whole and retail trade mostly) based on money inflow from abroad (mining export revenue and investment to mining) ^^Infrastructure development based on mining ^^^Mining export contributed around 90% of export and mining equipment and trucks import’ share is high in total import of Mongolia
Mining sector impact on GDP
Before 2010, Erdenet was the main contributor to the mining sector. Since 2010, coal sales have increased significantly based on exports from MAK Chinhua, SGS Ovoot Tolgoi, Mini TT, ETT (East Tsankhi) and Ukhaa Khudag. Mining sector’s impact
on service^, construction^^ and external sector^^^ is high. As the result net tax increased significantly
1.8 1.7 1.8 1.9 2.1 2.2
2.4 2.8 2.8 3.0
3.5
4.0
0
2
4
6
8
10
12
2007 2008 2009 2010 2011 2012
Real GDP (MNT trillion, 2010 prices)
Agriculture Mining
Manufacturing Construction
Transport Service
Net tax*
GFC
Coal growth
China downturn impact
Domestic Sectors
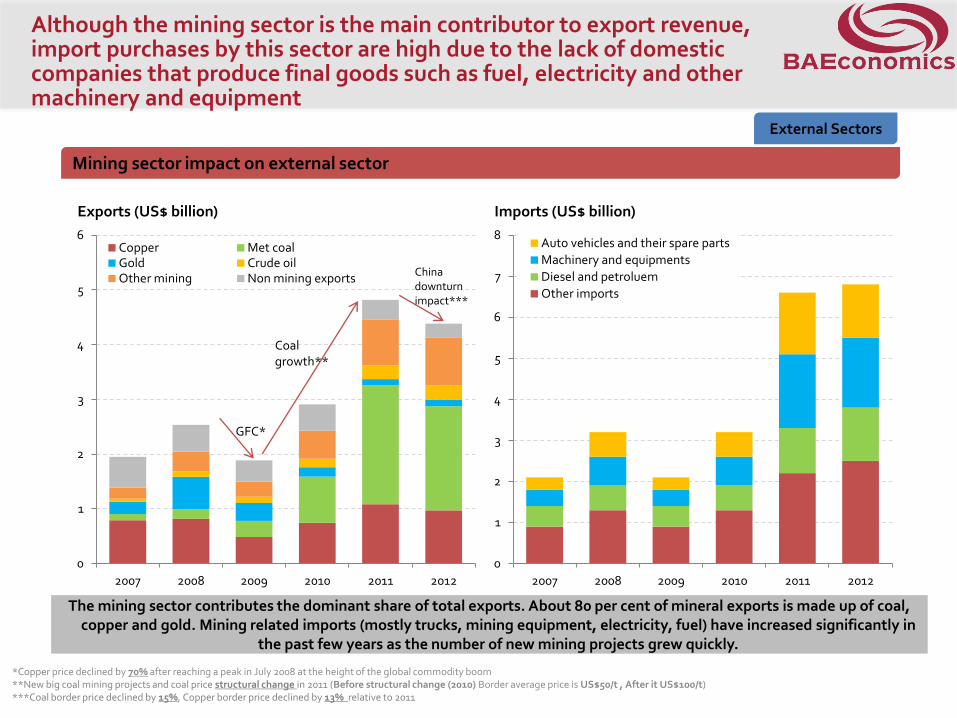
Although the mining sector is the main contributor to export revenue, import purchases by this sector are high due to the lack of domestic companies that produce final goods such as fuel, electricity and other machinery and equipment
Mining sector impact on external sector
The mining sector contributes the dominant share of total exports. About 80 per cent of mineral exports is made up of coal, copper and gold. Mining related imports (mostly trucks, mining equipment, electricity, fuel) have increased significantly in
the past few years as the number of new mining projects grew quickly.
0
1
2
3
4
5
6
2007 2008 2009 2010 2011 2012
Exports (US$ billion)
Copper Met coalGold Crude oilOther mining Non mining exports
GFC*
Coal growth**
China downturn impact***
0
1
2
3
4
5
6
7
8
2007 2008 2009 2010 2011 2012
Imports (US$ billion)
Auto vehicles and their spare parts
Machinery and equipments
Diesel and petroluem
Other imports
*Copper price declined by 70% after reaching a peak in July 2008 at the height of the global commodity boom **New big coal mining projects and coal price structural change in 2011 (Before structural change (2010) Border average price is US$50/t , After it US$100/t) ***Coal border price declined by 15%, Copper border price declined by 13% relative to 2011
External Sectors

Although the mining sector is not a labour intensive sector, impact on average wages is high
Mining sector impact on households
0.0
0.2
0.4
0.6
0.8
1.0
1.2
1.4
2007 2008 2009 2010 2011 2012*
Number of employees (million persons)
Agriculture Mining Manufacturing
Construction Trade Transport
Otherservice
0.0
0.1
0.2
0.3
0.4
0.5
0.6
0.7
0.8
0.9
1.0
2007 2008 2009 2010 2011 2012
Monthly average wage (MNT million)
Agriculture Mining Manufacturing
Construction Transport Service*
Households
**Electricity, whole sale and retail trade, hotels and restaurant, financial and insurance, public administration, education, health , community and personal service and other services
Average salary in the public service increased by ~60% compared to 2011 (highest growth in education and health sector). Average salary in the mining sector fell in 2012 due to the China downturn impact on coal prices.

Only mining projects already operating will continue to operate and all exploration projects will be closed given the new mineral law and policy uncertainty’s impact on FDI
0
2
4
6
8
10
12
14
16
18
20
2005 2010 2015 2020 2025 2030
By project type
Explorations and other
Not started big projects**
Started other projects
Started big projects*
Mining production
1 Existing mineral law scenario New mineral law and policy
uncertainty scenario
Assumptions : Mining production value (US$ billion, 2007 prices), by commodity and project type
Mining prices
2
02468
101214161820
2005 2010 2015 2020 2025 2030
By commodities
Other
Copper
Met coal
Thermal coal
02468
101214161820
2005 2010 2015 2020 2025 2030
By commodity type
Other
Copper
Met coal
Thermal coal
Mongolia’s thermal coal was used in domestic consumption (power and heating) only before 2012. Exports of this product commenced in November 2012
*EMC, OT open pit, TT East Tsankhi **OT underground, TT West Tsankhi
0
2
4
6
8
10
12
14
16
18
20
2005 2010 2015 2020 2025 2030
By project type
Started other projects
Started big projects*

34 БҮХ ЭРХ ХУУЛИАР ХАМГААЛАГДСАН © 2012, ОЮУ ТОЛГОЙ ХХК COPYRIGHT © 2012 OYU TOLGOI , ALL RIGHTS RESERVED
Existing mineral law scenario
New mineral law and policy uncertainty scenario
By 2020 we expect:
11.7 8.3
36.5 27.1
4.2 1.3 Tax revenue from mining
1.1 (index) 0.7 (index)
2.5 (index) 1.8 (index) Real wage (purchasing power)
38.9 28.2 Real GDP
26.7 11.2 Imports
Real exchange rate
Total tax revenue
Real GNP
21.2 8.4 Exports
2012
4.7
14.5
1.1
1.0 (index)
1.0 (index)
15.7
9.4
6.0
Now:
Economic Indicators (MNT trillion 2013 prices)
Summary Findings

The world is divided into 10 economies in MINCGEM Mongolia v2
1. Mongolia 6. Russia
2. China 7. Rest of Europe
3. Japan, Korea and Taiwan 8. North America
4. India 9. South America
5. Rest of Asia and Oceania 10. Middle East and Africa

Each economy is divided into 20 production sectors in MINCGEM Mongolia v2
1. Thermal Coal 11. Livestock
2. Coking Coal 12. Fishing and Forestry
3. Oil 13. Processed Food
4. Gas 14. Copper refining and manufacturing
5. Copper concentrate 15. Other Manufacturing
6. Gold 16. Electricity
7. Other minerals 17. Transport
8. Coke 18. Construction
9. Nuclear & petroleum fuel 19. Public Administration, Defense, Health and Education
10. Crops 20. Services

Summary description of new mining law implications
• HIGHER OWNERSHIP REQUIREMENT_ (1) 75%, 51% or 34% of the shared capital of the company holding a Mining Licence, must be a Mongolian Citizen
• IMPRACTICAL REQUIREMENT FOR LOCAL INVOLVEMENT_ (1) 60% local procurement required – unable to be supported by existing market; (2)Community cooperation agreements required for prospecting and exploration tenements
• PROHIBITION OF HIGH GRADE MINING _(1) If companies are required to mine the entire reserve without regard to the commercial value of the extracted mineral it will act as a deterrent to investment in the industry. The definition should include an economic/commercial cutoff.
• REDUCED FINANCIAL INCENTIVE FOR INVESTMENT_ (1) The new legislation provides for DDAs to be negotiated for strategic deposits only; (2) Upfront payment of closure costs - requires a deposit of a huge sum of the money tying up capital for the life of the project; (3) Royalty structure (separate piece of legislature)
• REDUCED SECURITY OF TENURE_ (1)Minerals of strategic importance/percentage of state equity/equity obtained free of charge (An investor may incur significant costs in exploration and appraisal risk that the GOM will take an unspecified interest in the project)
• PROHIBITIVE MINIMUM EXPLORATION EXPENDITURE REQUIREMENTS _ (1) prohibitive min expenditure (US$ 100K) for all but the most successful projects. Mongolian and international juniors not likely to be able to meet min spend requirements.
• LACK OF TRANSPARENCY IN THE LICENSE PROCESS_ (1) tender process – prone to corruption. Ability to increase royalties; may be tendency to place this above other criteria such as capacity and experience. Where a tender is rejected or blocked, it locks up potentially prospective ground for up to 4 years.