17 change detection using landsat imagery final
TRANSCRIPT
Chapter 17: Change Detection Using Landsat Imagery
Remote Sensing Analysis
in an
ArcMap Environment
Tammy E. Parece
Remote Sensing in an ArcMap Environment
Tammy Parece James Campbell
John McGee
This workbook is available online as text (.pdf’s) and short video tutorials via: http://www.virginiaview.net/education.html
Image source: landsat.usgs.gov
NSF DUE 0903270; 1205110

The project described in this publication was supported by Grant Number G14AP00002 from the Department of the Interior, United States Geological Survey to AmericaView. Its contents are solely the responsibility of the authors; the views and conclusions contained in this document are those of the authors and should not be interpreted as representing the opinions or policies of the U.S. Government. Mention of trade names or commercial products does not constitute their endorsement by the U.S. Government.
Remote Sensing in an ArcMap Environment 17. Change Detection using Landsat Imagery
The instructional materials contained within these documents are copyrighted property of VirginiaView, its partners and other participating AmericaView consortium members. These
materials may be reproduced and used by educators for instructional purposes. No permission is granted to use the materials for paid consulting or instruction where a fee is collected.
Reproduction or translation of any part of this document beyond that permitted in Section 107 or 108 of the 1976 United States Copyright Act without the permission of the copyright owner(s) is
unlawful.
Introduction Change detection is the use of remotely sensed imagery of a single region, acquired on at least two dates, to identify changes that might have occurred in the interval between the two dates. Those two dates can be years apart, for example to track changes in urbanization, or days apart, for example to track changes from a volcanic eruption.
Change detection has been applied to examine effects such as land use changes caused by urban and suburban growth, effects of natural disasters (such as floods, forest and range fires), and impacts of insect infestations upon forest cover, for example. Change detection requires application of algorithms that are specifically designed to detect meaningful changes in the context of false alarms— ostensible changes that are, in reality, simply artifacts of the imaging process. A critical prerequisite for application of change detection by remote sensing is the identification of suitable pairs of images representing the same region. The analyst must assure that (1) the two images register (that they match exactly when superimposed), (2) that they were acquired during the same season, especially if use to track changes in vegetation, and (3) that there are no significant atmospheric effects. In brief, the two images must be compatible in every respect-- scale, geometry, resolution – otherwise the change detection algorithm will interpret incidental differences in image characteristics as changes on the landscape. There has been much research devoted to evaluating alternative change detection algorithms. A basic distinction between pre-classification and post-classification comparisons captures a primary division in the natures of the approach. Post-classification change detection defines changes by comparing pixels in a pair of classified images (in which pixels have already been assigned to classes). Post-classification change detection typically reports changes as a summary of the “from-to” changes of categories between the two dates. Pre-classification change detection examines differences in two images prior to any classification process. Pre-classification algorithms typically permit the analyst to set thresholds for the magnitude of changes to be detected and highlighted. This tutorial will introduce a simple procedure using ArcGIS Image Analysis for pre-classification change detection— other approaches are available for the more experienced student, and to examine other kinds of changes. We will be using two images acquired over Pakistan to evaluate the changes due to river flooding. You will need to download these images prior to starting this tutorial.
195 | P a g e

Remote Sensing in an ArcMap Environment 17. Change Detection using Landsat Imagery
Additional information about Pakistan images (path151/row40): The Pakistan floods began in July 2010. Two thousand people have died and over a million homes were destroyed by these severe floods. The study area is near KHAN City. The two Landsat 5 TM images were acquired on July 11 (before flooding) and Aug. 28 (after flooding).
When you are in GloVis, you can actually see the flooding within the Landsat Scene displayed in the GloVis window. Download both scenes.
July 11 August 28
Change Detection using Image Analysis in ArcGIS
Once you have downloaded the scenes, open ArcMap with a new map document, the Image
Analysis window, set your Workspaces, and add all bands for each image.
Composite the images for each scene. (Remember when you create images using the Image
Analysis window, these are temporary, so if you cannot complete this Tutorial in one sitting, please
save your composite images as permanent files). In ArcGIS, we don’t use the composite images for
the change detection but they are useful to see the differences that have occurred in the region after the
flooding. Again when doing any remote sensing analysis, you need to be familiar with your data and
your region.
196 | P a g e

Remote Sensing in an ArcMap Environment 17. Change Detection using Landsat Imagery
Your composite images are displayed on top of each other -- the July should be on top. In
this example, two images of the region in Pakistan show before and after the flood. By using the
flicker button,
you can visually see the
differences between the two
images.
July
Flicker Line
August
197 | P a g e

Remote Sensing in an ArcMap Environment 17. Change Detection using Landsat Imagery
Applying image differencing (i.e. subtracting corresponding pixels values at each pixel, and
then displaying the differences as colors) the areas that differ in brightness can be easily identified.
The analyst must apply an understanding of both the region represented on the image, and the subject
of the analysis, to generate useful results. Note that, when correctly applied, this approach will not
identify the area of the river in the second image as flooded, as it identifies areas that have changed,
not areas that were already covered by water. We do not use the composite image to calculate the
differences, so it is important that you know which Landsat bands are best suited for distinguishing
which features. When we calculate the differences, it just the differences between the same bands, not
the composite images. Remember which bands are useful for which analysis:
We are going to use Band 4 from each image and calculate the difference between the two. If
you highlight the two B4 images in the top of the Image Analysis window, it will enable the
Difference button in the Processing section of
the window.
198 | P a g e
Remote Sensing in an ArcMap Environment 17. Change Detection using Landsat Imagery
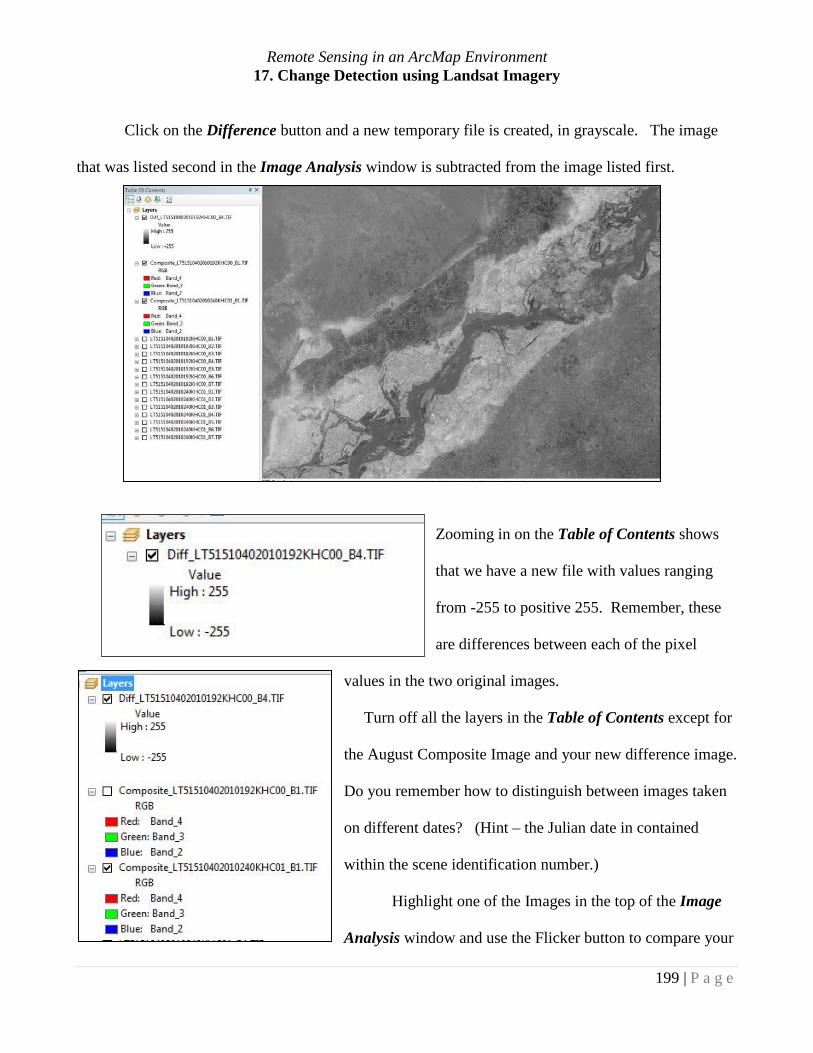
Click on the Difference button and a new temporary file is created, in grayscale. The image
that was listed second in the Image Analysis window is subtracted from the image listed first.
Zooming in on the Table of Contents shows
that we have a new file with values ranging
from -255 to positive 255. Remember, these
are differences between each of the pixel
values in the two original images.
Turn off all the layers in the Table of Contents except for
the August Composite Image and your new difference image.
Do you remember how to distinguish between images taken
on different dates? (Hint – the Julian date in contained
within the scene identification number.)
Highlight one of the Images in the top of the Image
Analysis window and use the Flicker button to compare your
199 | P a g e

Remote Sensing in an ArcMap Environment 17. Change Detection using Landsat Imagery
new image to the July and August composite images. In the August image, you could see the flooded
area but it was difficult to see the original river within the image. With change detection, the original
river is darker and the area of land that has been flooded is extremely bright. (Remember from prior
tutorials, you can change the symbology to different colors to see how if it highlights the changes more
definitively.)
August image to change detection image is shown here.
200 | P a g e

Remote Sensing in an ArcMap Environment 17. Change Detection using Landsat Imagery
July image to change detection image is shown here
Let’s change the symbology on the change detection image and see what happens.
201 | P a g e

Remote Sensing in an ArcMap Environment 17. Change Detection using Landsat Imagery
In this symbology, darker colors represent both extremes on the change in pixel value. The
lighter color represents those areas with little or no change. Here, we chose blue to highlight where
water is now located. Why is there a change in color within the river itself? (Answer – flooding
caused sediment to flow into the main river channel and thus changed the spectral quality of the river.)
202 | P a g e

Remote Sensing in an ArcMap Environment 17. Change Detection using Landsat Imagery
Now look at your original July and August images, and compare them to the change detection
image. We also see other significant changes in the image, not due to the flooding. Why?
Hints – we are looking at an image in mid-July and comparing it to an image in late August.
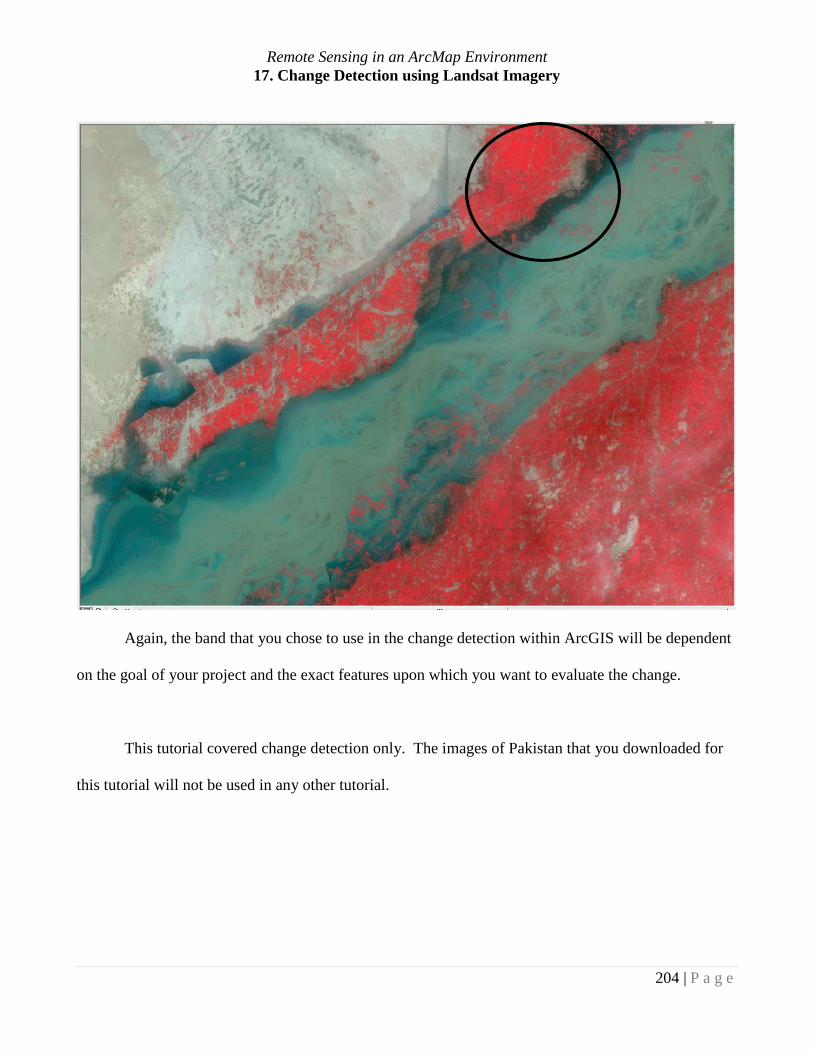
What do the red areas of this 4 - 3 - 2 band combination represent? Why would these areas show a
change? Think about the latitude and longitude of Pakistan. Is this time period consistent with the
growing season?
203 | P a g e
Remote Sensing in an ArcMap Environment 17. Change Detection using Landsat Imagery
Again, the band that you chose to use in the change detection within ArcGIS will be dependent
on the goal of your project and the exact features upon which you want to evaluate the change.
This tutorial covered change detection only. The images of Pakistan that you downloaded for
this tutorial will not be used in any other tutorial.
204 | P a g e