land use and land cover change detection through spatial ... · landsat-5 and landsat-8 satellite...
TRANSCRIPT
Journal of Geomatics Vol 12 No. 2 October 2018
© Indian Society of Geomatics
Land use and land cover change detection through spatial approach: A case study of
Mangaluru Taluk, Karnataka
Sanjith S Anchan1, Ateeth Shetty2, H Gangadhara Bhat2 and Mohandas Chadaga3
1Department of Civil Engineering, Sahyadri College of Engineering & Management, Mangalore 2Department of Marine Geology, Mangalore University, Mangalore
3Civil Engineering Department, Manipal Institute of Technology, Manipal
Email: [email protected]
(Received: Apr 03, 2018; in final form: Oct 22, 2018)
Abstract: Land cover is a physical appearance of land and represents its ecological status. Land use/land cover changes
are due to human intervention, natural disturbance and succession. The present study aimed at monitoring the land
cover changes in Mangalore region during the period 1997 to 2017. Remote sensing and Geographical Information
System (GIS) techniques were used to determine the land use and land cover changes based on the analysis of temporal
Landsat-5 and Landsat-8 satellite imagery. Ground truth observations were performed to check the accuracy of the
classification. The present study brought to light that the forest area that occupied 37% of the Taluk’s area in 1997 has
reduced to 31% in 2017. Other classes like agricultural land, built up area, water bodies and barren land have also
experienced changes. Built-up lands (settlements) have increased from 6 per cent to 23 per cent of the total area. The
high land vegetation and forest cover areas are disappearing rapidly; water bodies like lakes are also diminishing.
Mangalore city is one of the fastest developing cities in India. Proper land use planning is essential for a sustainable
development of Mangalore Taluk.
Keywords: Land use, Land cover, Change Analysis, GIS, Mangaluru
1. Introduction
Land Use/Land Cover (LU/LC) is an important
component in understanding the interactions of the
human activities with the environment and thus it is
necessary to understand the changes in it. The land
use/land cover pattern of any region is influenced by
natural and socio-economic factors and their utilization
by human in time and space (Aspinal and Hills, 2008;
Feranec et al., 2007). Degradation of land is mainly due
to population pressure that leads to intense land use
without proper management practices. Over population
makes people to relocate themselves towards sensitive
areas like highlands. Usually such areas lack planning
strategies. The influence of road and other constructions
in such terrain will disturb the landscape that intern may
lead to landslides/other mass movements. These changes
have to be analysed for better understanding of
interactions and relationships between human activities
and natural phenomena. It also helps us to understand the
necessity for improving resource management and
decision making (Lu et al., 2004; Seif and Mokarram,
2012).
Proper information on land use/cover and outcome for
their optimal use is essential at planning phase to meet
the increasing demands of basic human needs and welfare
very effectively. Land use and Land cover are inter
related i.e., Land use affects land cover and changes in
land cover affect land use. Every time changes in land
cover by land use do not necessarily imply that there will
be degradation of the land. However, many changing land
use patterns driven by a variety of social causes, result in
land cover changes that affects biodiversity, water and
radiation budgets, trace gas emissions and other processes
that come together to affect climate and biosphere
(Riebsame et al., 1994). Remote sensing and GIS can be
effectively used as a source or tool for rational planning
of any area or region. With the invent of these techniques,
land use/cover mapping has given a useful, economical
and detailed way to improve the selection of areas
designed to agricultural, urban and/or industrial areas of a
region (Selcuk et al., 2003). Remote Sensing tool has
been used to classify and map land use and land cover
changes with different techniques and data sets. Remotely
sensed data has made it possible to study changes in land
cover in less time, at low cost and better accuracy
(Kachhwaha, 1985). Various methods of supervised
classifications have been applied widely for the land use
change analysis throughout the world. These techniques
depend on a combination of background knowledge and
personal experience with the study area to a greater extent
than other areas. Information on LU/LC is important in
regional and urban planning and management (Chen et
al., 2006; Crainic et al., 2009; Flotterod et al., 2011). An
attempt is made in this study to map status and changes in
LU/LC of Mangalore region, Dakshina Kannada district
of the Karnataka State.
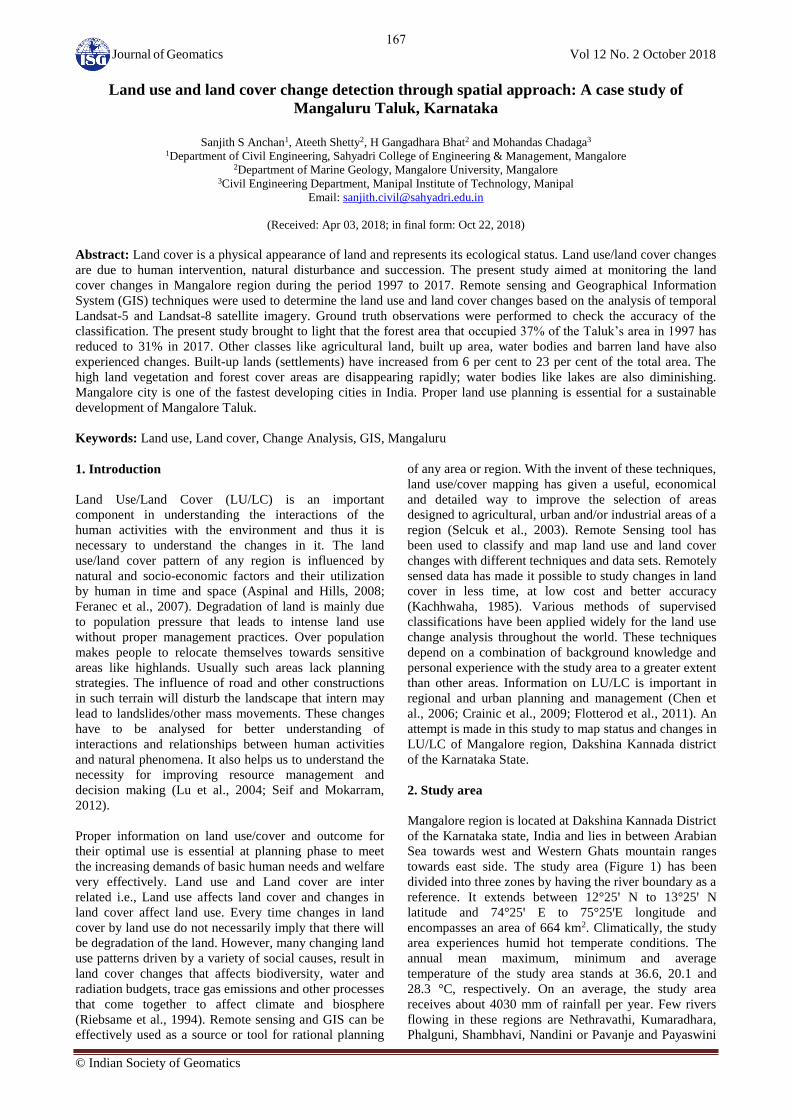
2. Study area
Mangalore region is located at Dakshina Kannada District
of the Karnataka state, India and lies in between Arabian
Sea towards west and Western Ghats mountain ranges
towards east side. The study area (Figure 1) has been
divided into three zones by having the river boundary as a
reference. It extends between 12°25ꞌ N to 13°25ꞌ N
latitude and 74°25ꞌ E to 75°25ꞌE longitude and
encompasses an area of 664 km2. Climatically, the study
area experiences humid hot temperate conditions. The
annual mean maximum, minimum and average
temperature of the study area stands at 36.6, 20.1 and
28.3 °C, respectively. On an average, the study area
receives about 4030 mm of rainfall per year. Few rivers
flowing in these regions are Nethravathi, Kumaradhara,
Phalguni, Shambhavi, Nandini or Pavanje and Payaswini
167
Journal of Geomatics Vol 12 No. 2 October 2018
Rivers. The region has a total population of 20,89,649
(Census of India, 2011).
Source: https://dk.nic.in/en/map-of-district/
Figure 1: Study area showing the three zones along
Mangalore, Dakshina Kannada District.
3. Objectives
The main objective of the present paper is to analyse the
nature and the extent of land use/land cover changes in
the study area over the past 20 years and to identify the
main causes behind the changes.
4. Material and methods
4.1. Satellite data pre-processing
Landsat-5 (Thematic Mapper) and Landsat-8
(Operational Land Imager) satellite imagery with the
resolution of 30 m, covering the path-146 and row-51
during February 1997 and January 2017 were used for
land use/cover mapping. It was downloaded from the
USGS Earth Explorer image database (Landsat Imagery
Archive). It has a solar elevation angle of 63.13 degrees
and a cloud cover lower than 10%.
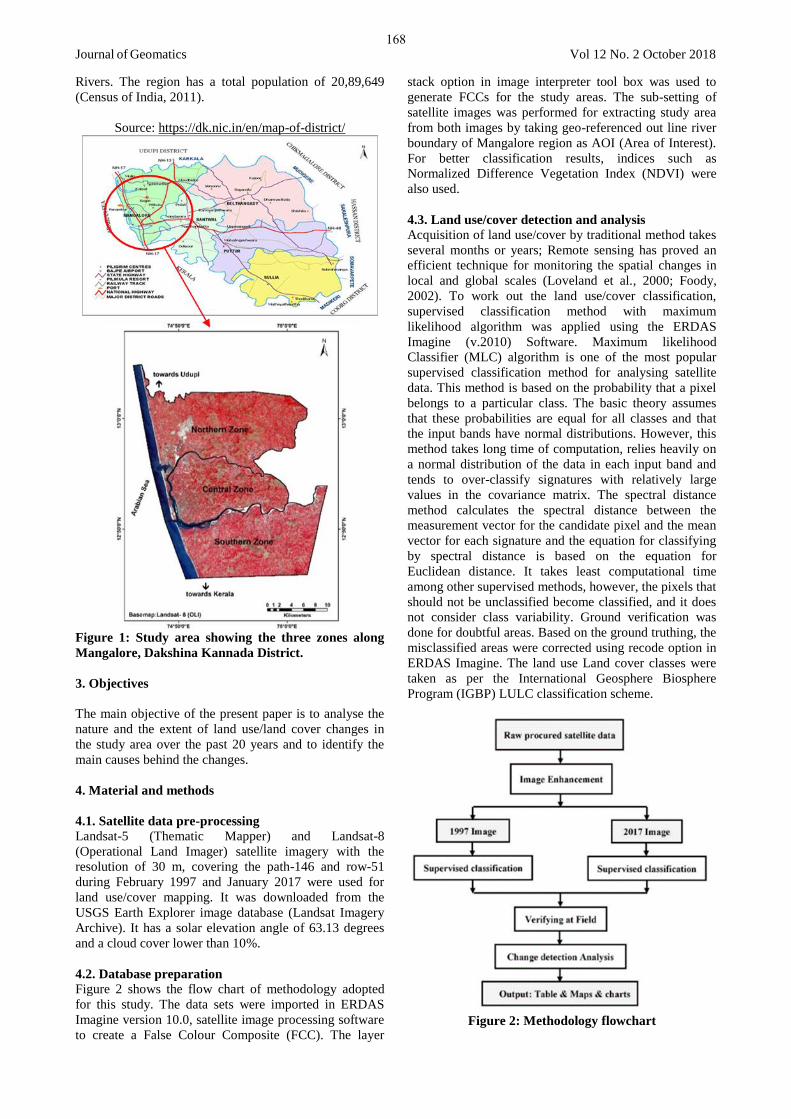
4.2. Database preparation
Figure 2 shows the flow chart of methodology adopted
for this study. The data sets were imported in ERDAS
Imagine version 10.0, satellite image processing software
to create a False Colour Composite (FCC). The layer
stack option in image interpreter tool box was used to
generate FCCs for the study areas. The sub-setting of
satellite images was performed for extracting study area
from both images by taking geo-referenced out line river
boundary of Mangalore region as AOI (Area of Interest).
For better classification results, indices such as
Normalized Difference Vegetation Index (NDVI) were
also used.
4.3. Land use/cover detection and analysis
Acquisition of land use/cover by traditional method takes
several months or years; Remote sensing has proved an
efficient technique for monitoring the spatial changes in
local and global scales (Loveland et al., 2000; Foody,
2002). To work out the land use/cover classification,
supervised classification method with maximum
likelihood algorithm was applied using the ERDAS
Imagine (v.2010) Software. Maximum likelihood
Classifier (MLC) algorithm is one of the most popular
supervised classification method for analysing satellite
data. This method is based on the probability that a pixel
belongs to a particular class. The basic theory assumes
that these probabilities are equal for all classes and that
the input bands have normal distributions. However, this
method takes long time of computation, relies heavily on
a normal distribution of the data in each input band and
tends to over-classify signatures with relatively large
values in the covariance matrix. The spectral distance
method calculates the spectral distance between the
measurement vector for the candidate pixel and the mean
vector for each signature and the equation for classifying
by spectral distance is based on the equation for
Euclidean distance. It takes least computational time
among other supervised methods, however, the pixels that
should not be unclassified become classified, and it does
not consider class variability. Ground verification was
done for doubtful areas. Based on the ground truthing, the
misclassified areas were corrected using recode option in
ERDAS Imagine. The land use Land cover classes were
taken as per the International Geosphere Biosphere
Program (IGBP) LULC classification scheme.
Figure 2: Methodology flowchart
168
Journal of Geomatics Vol 12 No. 2 October 2018
5. Results and discussion
5.1. Land use mapping and distribution
A supervised maximum likelihood classification was
implemented for the three images and the final
classification products provided an overview of the major
land use / land cover features of Mangalore region for the
years 1997 and 2017. Six categories of land use / land
cover were identified are described in Table 1.
Table 1: Classification scheme used for preparing the
decadal land use and land cover datasets
Level - 1 Level - 2 Description
Built-up
Built-up (both
urban & rural)
BU
Urban, rural,
residential, and
industrial areas.
Agriculture Crop Land
These include
agriculture area
delineable on satellite
images in different
seasons and the areas
which are primarily
agriculture but may be
fallow.
Mixed
Forest
Shrub land
(SL)
Grass Land
(GL)
Permanent
wetland (PW)
Stunted height
degraded forest.
Land covered with
grasses, notified or
otherwise.
Water saturated area
having land-water
interface.
Dense
Forest
Forest (FO)
Plantation (PL)
Included evergreen
broad leaf forest (EBF),
Deciduous Broad leaf
forest (DBF), mangrove
forest (MF).
Primarily commercial
plantation outside
forest, protected areas
and wildlife
sanctuaries.
Barren Land
Barren Land
(BL)
Mining (MN)
Rocky or exposed
rocky areas, Soil filled
surfaces.
Mining areas
Water
bodies
Water bodies
(WB)
Surface water
delineable on satellite
data in the form of
river, lakes, pond,
reservoirs/dams, canals.
Based mainly on International Geosphere Biosphere
Program (IGBP)
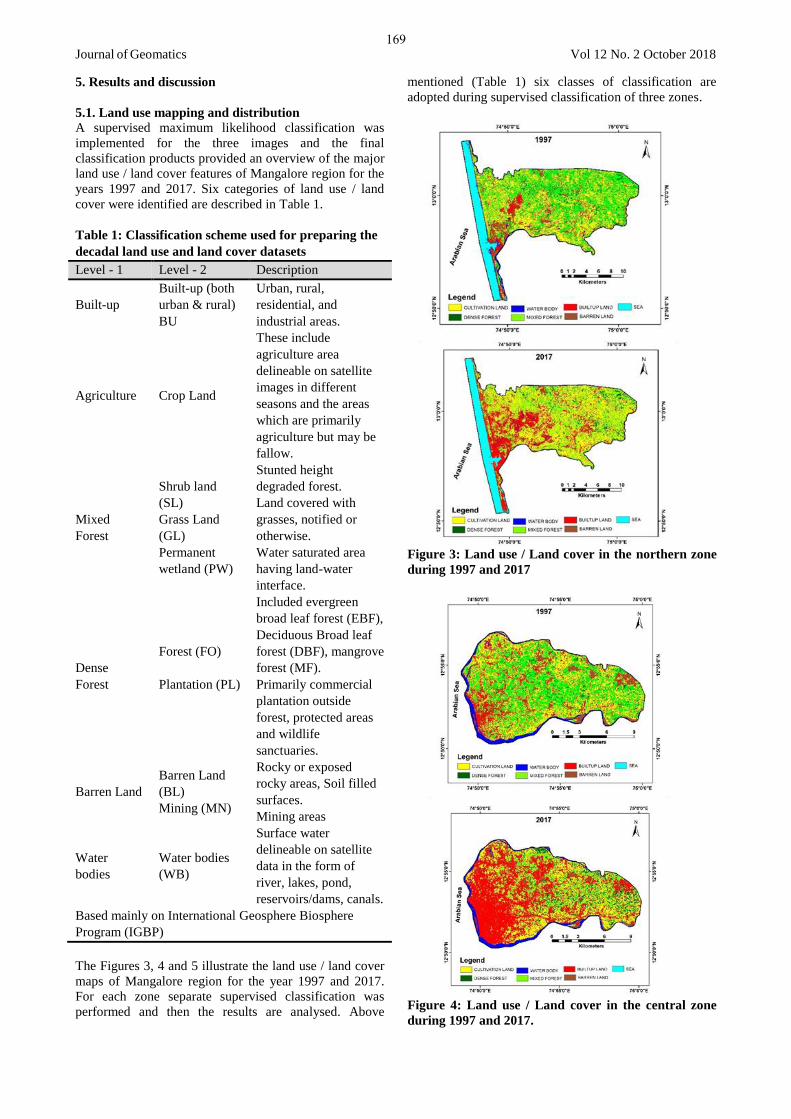
The Figures 3, 4 and 5 illustrate the land use / land cover
maps of Mangalore region for the year 1997 and 2017.
For each zone separate supervised classification was
performed and then the results are analysed. Above
mentioned (Table 1) six classes of classification are
adopted during supervised classification of three zones.
Figure 3: Land use / Land cover in the northern zone
during 1997 and 2017
Figure 4: Land use / Land cover in the central zone
during 1997 and 2017.
169
Journal of Geomatics Vol 12 No. 2 October 2018
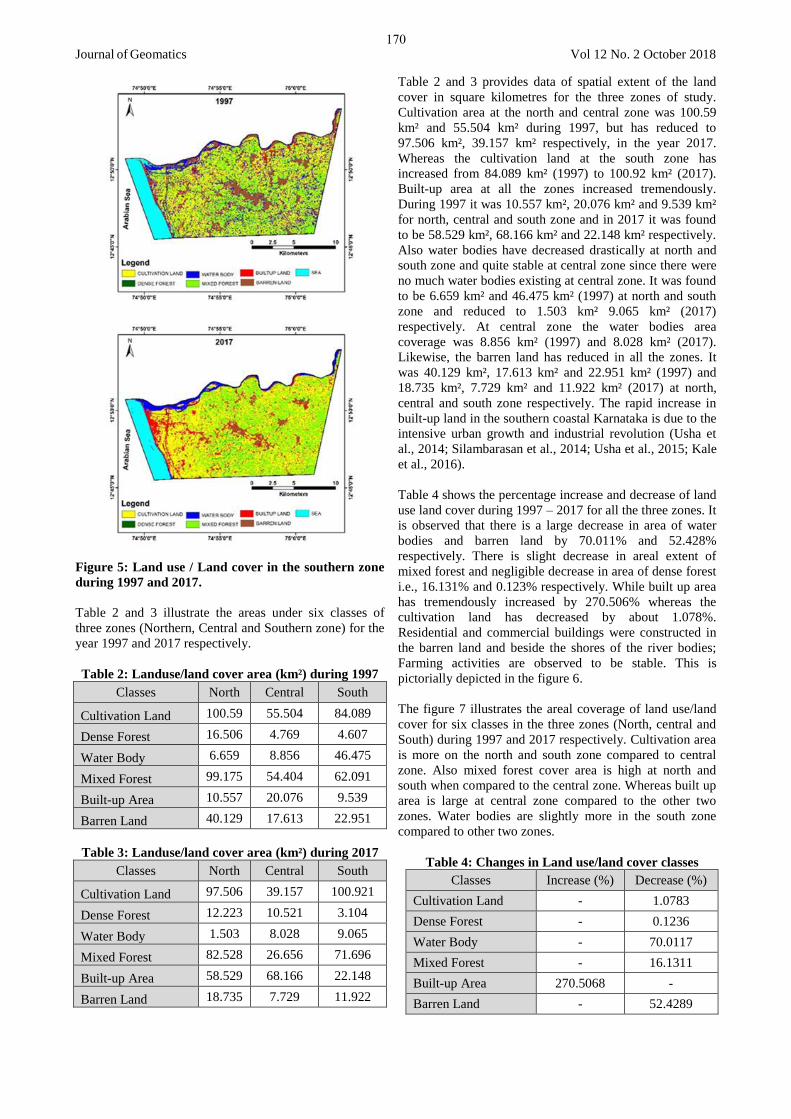
Figure 5: Land use / Land cover in the southern zone
during 1997 and 2017.
Table 2 and 3 illustrate the areas under six classes of
three zones (Northern, Central and Southern zone) for the
year 1997 and 2017 respectively.
Table 2: Landuse/land cover area (km²) during 1997
Classes North Central South
Cultivation Land 100.59 55.504 84.089
Dense Forest 16.506 4.769 4.607
Water Body 6.659 8.856 46.475
Mixed Forest 99.175 54.404 62.091
Built-up Area 10.557 20.076 9.539
Barren Land 40.129 17.613 22.951
Table 3: Landuse/land cover area (km²) during 2017
Classes North Central South
Cultivation Land 97.506 39.157 100.921
Dense Forest 12.223 10.521 3.104
Water Body 1.503 8.028 9.065
Mixed Forest 82.528 26.656 71.696
Built-up Area 58.529 68.166 22.148
Barren Land 18.735 7.729 11.922
Table 2 and 3 provides data of spatial extent of the land
cover in square kilometres for the three zones of study.
Cultivation area at the north and central zone was 100.59
km² and 55.504 km² during 1997, but has reduced to
97.506 km², 39.157 km² respectively, in the year 2017.
Whereas the cultivation land at the south zone has
increased from 84.089 km² (1997) to 100.92 km² (2017).
Built-up area at all the zones increased tremendously.
During 1997 it was 10.557 km², 20.076 km² and 9.539 km²
for north, central and south zone and in 2017 it was found
to be 58.529 km², 68.166 km² and 22.148 km² respectively.
Also water bodies have decreased drastically at north and
south zone and quite stable at central zone since there were
no much water bodies existing at central zone. It was found
to be 6.659 km² and 46.475 km² (1997) at north and south
zone and reduced to 1.503 km² 9.065 km² (2017)
respectively. At central zone the water bodies area
coverage was 8.856 km² (1997) and 8.028 km² (2017).
Likewise, the barren land has reduced in all the zones. It
was 40.129 km², 17.613 km² and 22.951 km² (1997) and
18.735 km², 7.729 km² and 11.922 km² (2017) at north,
central and south zone respectively. The rapid increase in
built-up land in the southern coastal Karnataka is due to the
intensive urban growth and industrial revolution (Usha et
al., 2014; Silambarasan et al., 2014; Usha et al., 2015; Kale
et al., 2016).
Table 4 shows the percentage increase and decrease of land
use land cover during 1997 – 2017 for all the three zones. It
is observed that there is a large decrease in area of water
bodies and barren land by 70.011% and 52.428%
respectively. There is slight decrease in areal extent of
mixed forest and negligible decrease in area of dense forest
i.e., 16.131% and 0.123% respectively. While built up area
has tremendously increased by 270.506% whereas the
cultivation land has decreased by about 1.078%.
Residential and commercial buildings were constructed in
the barren land and beside the shores of the river bodies;
Farming activities are observed to be stable. This is
pictorially depicted in the figure 6.
The figure 7 illustrates the areal coverage of land use/land
cover for six classes in the three zones (North, central and
South) during 1997 and 2017 respectively. Cultivation area
is more on the north and south zone compared to central
zone. Also mixed forest cover area is high at north and
south when compared to the central zone. Whereas built up
area is large at central zone compared to the other two
zones. Water bodies are slightly more in the south zone
compared to other two zones.
Table 4: Changes in Land use/land cover classes
Classes Increase (%) Decrease (%)
Cultivation Land - 1.0783
Dense Forest - 0.1236
Water Body - 70.0117
Mixed Forest - 16.1311
Built-up Area 270.5068 -
Barren Land - 52.4289
170

Journal of Geomatics Vol 12 No. 2 October 2018
Figure 6: Land use / Land cover in the study area
during 1997 and 2017
Figure 7: Areal extent (km2) of land use and land
cover in the three zones during 1997 and 2017
Each zones discrete study was conducted to understand
evidently the land use/land cover change in respective
three zones of interest. The data list of the increase and
decrease in area of land use/land cover classification for
the 20 years span of study is given in Table 5. It is clearly
observed that the built up area have increased
tremendously in all the three zones (North, Central and
South). There is enormous increase in built up area at
North zone by 454.45%. The noticeable change is
increase in dense forest area at central zone region by
120.63%. North and south zone regions have significant
decrease in water body’s area of 77.43% and 80.49%
respectively compared to central which is almost same
for year 1997 and 2017. At all zones the barren land area
in 2017 has decreased by half in its occurrence of 1997.
Mixed forest has decreased by 16.79% and 51.01% at
North and central zone and 15.47% a slight increase in
area at south zone region.
The effect of increasing human population on land cover
can be clearly noticed in the study. More the populations
mean more the changes taking places in order to support
the human activities and needs. Hence these activities
will lead to land cover changes that was also similar to
the result of this study. The population of Mangalore
Taluk was 2,73,304 in 1991 and 4,25,725 in 2001 and
recent Census of India, (2011) says it was 9,94,602 with
an average Annual growth rate of ~ 4.55% and ~ 8.85%
per year during the years 1991-2001 and 2001-2011
respectively. It could be suggested that population has an
effect on land cover change to meet their need for pace
and land in order to support human life such as
development settlements and agricultural lands including
rice fields. The figure 8 illustrates the decrease and
increase in land use/land cover area with graphical
representation for the year 1997 and 2017 respectively.
Figure 8: Areal extent (km2) of land use and land
cover in north, central and south zones during 1997
and 2017
171

Journal of Geomatics Vol 12 No. 2 October 2018
The mean changes per year was also analysed to examine
how fast the increase or decrease took place each year
(Table 6). The mean increase per year of cultivation land,
dense forest, water body, built-up area and barren land
were analysed for the three respective zones. In north
zone mean increase of built-up area was 2.40 km2/year
and mean reduction of land cover class of cultivation
land, dense forest, water bodies, mixed forest and barren
land were 0.15 km2/year, 0.21 km2/year, 0.26 km2/year,
0.83 km2/year and 1.07 km2/year respectively. Similarly,
in central zone mean increase of dense forest and built-up
area were 0.29 km2/year and 2.40 km2/year respectively
and mean reduction of land cover class of cultivation
land, water bodies, barren land were 0.82 km2/year, 0.04
km2/year and 1.39 km2/year respectively. In South zone
the mean increase of land cover of cultivation land,
mixed forest and built-up land were 0.84 km2/year, 0.48
km2/year and 0.63 km2/year respectively while the mean
reduction of land cover class of dense forest, water bodies
and barren land were 0.08 km2/year, 1.87 km2/year and
0.55 km2/year respectively.
The graphical representations of the mean changes per
year was also examined to understand how fast the
increase or decrease took place every year (Figure 9). The
representation of mean was obtained by considering all
six classifications in the same order as mention in table 6.
The six classes represented in x-Axis are 1- CL, 2 - DF, 3
- WB, 4 - MF, 5 - BL, 6-BA. The peak variations in areal
extent and the mean changes per year in built up area and
barren land could be clearly observed through this
representation.
Figure 9: Mean changes in areal extent (km2) of land
use and land cover per year at north, central and
southern zones during 1997 and 2017
Table 5: Increase and decrease in land use and land cover classes in all the three zones (km²)
NORTH CENTRAL SOUTH
Class
. 1997 2017 I (%) D (%) 1997 2017 I (%) D (%) 1997 2017 I (%) D (%)
CL 100.59 97.51 - 3.07 55.50 39.16 - 29.45 84.09 100.9 20.10 -
DF 16.51 12.22 - 25.94 4.77 10.52 120.63 - 4.61 3.10 - 32.62
WB 6.66 1.50 - 77.43 8.86 8.03 - 9.35 46.48 9.07 - 80.49
MF 99.18 82.53 - 16.79 54.40 26.66 - 51.01 62.09 71.7 15.47 -
BL 40.13 18.74 - 53.31 17.61 7.73 - 56.12 22.95 11.92 - 48.05
BA 10.56 58.53 454.45 - 20.08 68.17 239.53 - 9.54 22.2 132.2 -
CL- Cultivation Land, DF- Dense forest, WB- Water bodies, MF- Mixed forest, BL- Barren Land, BA- Built up area,
I – Increase, D – Decrease.
Table 6: Rate of land cover change per year (1997-2017)
1997 2017
1997 2017
1997 2017
ZONES N AREA
(km²)
N AREA
(km²)
Rate of Change
(km²/Year)
C AREA
(km²)
C AREA
(km²)
Rate of Change
(km²/Year)
S AREA
(km²)
S AREA
(km²)
Rate of Change
(km²/Year)
Overall Changes in
entire Area
CULTIVATION
LAND 100.59 97.51 -0.15 55.50 39.16 -0.82 84.09 100.92 0.84 -1.0783
DENSE FOREST 16.51 12.22 -0.21 4.77 10.52 0.29 4.61 3.10 -0.08 -0.1236
WATER BODY 6.66 1.50 -0.26 8.86 8.03 -0.04 46.48 9.07 -1.87 -70.0117
MIXED FOREST 99.18 82.53 -0.83 54.40 26.66 -1.39 62.09 71.70 0.48 -16.1311
BUILTUP AREA 10.56 58.53 2.40 20.08 68.17 2.40 9.54 22.15 0.63 270.5068
BARREN LAND 40.13 18.74 -1.07 17.61 7.73 -0.49 22.95 11.92 -0.55 -52.4289
172
Journal of Geomatics Vol 12 No. 2 October 2018
6. Conclusion
The study has revealed that remotely sensed data
(imageries) are important and extremely useful in
mapping and monitoring the dynamics of land use / land
cover changes. GIS analysis has shown the capabilities to
analyse spatial data and to provide information that aid in
the decision making. Northern and central zone of the
study area has experienced drastic increase in built up
area thereby decreasing the mixed and dense forest.
Southern zone has very slow rate of change in land use /
land cover. Necessary action has to be taken in order to
restrict the rapid growth of built up area leading to the
distraction of fertile Agriculture / Forest land.
7. Recommendation
Settlement expansion, subsistence farming and illegal
logging are the major factors behind the land use/land
cover changes observed in the area. These findings
highlight the need for comprehensive assessment of
human activities and adaptation of sustainable forest
management practices such as close supervision of forest
reserves and making more arable lands available through
restoration of already degraded and impoverished lands.
References
Aspinal, R.J. and M.J. Hill (2008). Land use change:
science, policy and management. Boca Raton: CRC
Press.
Census of India, (2011). Primary Census Abstract Data
Source.
Chen, X.L., H.M. Zhao, P.X. Li and Z.Y. Yin (2006).
Remote sensing image-based analysis of the relationship
between urban heat island and land use/cover changes.
Remote Sensing of Environment 104 (2), 133–146.
Crainic, T. G., N. Ricciardi and G. Storchi (2009).
Models for evaluating and planning city logistics
systems. Transportation Science 43 (4), 432–454.
Feranec, J., G. Hazeu, S. Christensen et al. (2007). Corine
land cover change detection in Europe (case studies of the
Netherlands and Slovakia). Land Use Policy 2007, 24(1),
pp. 234-247.
Flotterod, G., M. Bierlaire and K. Nagel (2011). Bayesian
demand calibration for dynamic traffic simulations.
Transportation Science 45 (4), pp. 541–561.
Foody, G. M. (2002). Status of land cover classification
accuracy assessment. Remote Sensing of Environment 80
(1), pp. 185–201.
Kachhwaha, T.S. (1985). Temporal monitoring of forest
land for change detection and forest cover mapping
through satellite remote sensing. In: Proceedings of the
6th Asian Conf. on Remote Sensing. Hyderabad, pp. 77–
83.
Kale. M.P., M. Chavan, S. Pardeshi C. Joshi, P.A. Verma,
P.S. Roy, S.K. Srivastav, et al. (2016). Land-use and
land-cover change in Western Ghats of India.
Environmental monitoring and assessment 188 (7), pp.
387.
Lu, D., P. Mausel, E. Brondı´zio and E. Moran. (2004).
Change detection techniques. Int. J. Remote Sens. 25, pp.
2365–2407.
Loveland, T.R., B.C. Reed, J.F. Brown, D.O. Ohlen, Z.
Zhu, L. Yang and J.W. Merchant. (2000). Development
of a global land cover characteristics database and IGBP
Discover from 1 Km AVHRR Data. International Journal
of Remote Sensing 21 (6–7), pp. 1303–1330.
Riebsame, W.E., W.B. Meyer and B.L. Turner. (1994).
Modeling land-use and cover as part of global
environmental change. Clim. Change 28, pp. 45–64.
Selcuk, R., R. Nisanci, B. Uzun, A. Yalcin, H. Inan and
T. Yomralioglu (2003). Monitoring land-use changes by
GIS and remote sensing techniques: case study of
Trabzon. 2nd FIG Regional Conference Marrakech,
Morocco, December 2-5.
Seif and Mokarram (2012). Change detection of Gil Playa
in the Northeast of Fars Province, Iran Am. J. Sci. Res.,
86(1), pp. 122-130.
Silambarasan, K., M.S. Vinaya and S. Suresh Babu
(2014). Urban sprawl mapping and landuse change
detection in and around Udupi Town: A remote sensing
based approach. International Journal of Scientific
Research Engineering & Technology 2 (12), 815-820.
Usha, M. Thukaram, M. Chadaga and B. Naveenchandra
(2014). An integrated approach of Satellite Remote
Sensing technology and Geographical Information system
for the land use land cover change detection studies for
urban planning of Mangalore taluk of Karnataka -
published at: International Journal of Scientific and
Research Publications 4 (5), 1-7.
Usha, B. Naveenchandra, M. Thukaram and M. Chadaga
(2015). The study of impact of urbanization on urban heat
island with temperature variation analysis of MODIS data
using remote sensing and GIS technology. International
Journal of Advanced Remote Sensing and GIS 4(1), 944-
952.
173