1 of 31 © 2014 pearson education, inc.. 2 of 31 © 2014 pearson education, inc
TRANSCRIPT

1 of 31© 2014 Pearson Education, Inc.
2 of 31© 2014 Pearson Education, Inc.
3 of 31© 2014 Pearson Education, Inc.
C H A P T E R O U T L I N E
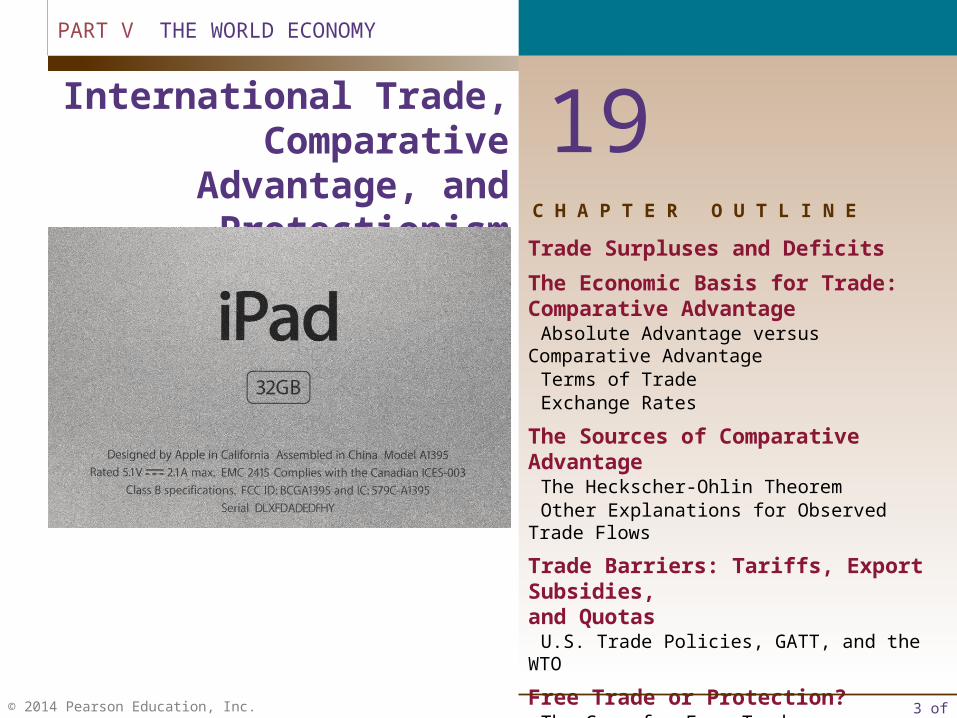
19International Trade, Comparative
Advantage, and Protectionism
Trade Surpluses and Deficits
The Economic Basis for Trade: Comparative Advantage
Absolute Advantage versus Comparative AdvantageTerms of TradeExchange Rates
The Sources of Comparative AdvantageThe Heckscher-Ohlin TheoremOther Explanations for Observed Trade Flows
Trade Barriers: Tariffs, Export Subsidies, and Quotas
U.S. Trade Policies, GATT, and the WTO
Free Trade or Protection?The Case for Free TradeThe Case for Protection
An Economic Consensus
PART V THE WORLD ECONOMY
4 of 31© 2014 Pearson Education, Inc.
The “internationalization” or “globalization” of the U.S. economy has occurred in the private and public sectors, in input and output markets, and in firms and households.
To get you more acquainted with the international economy, this chapter discusses the economics of international trade.
We will observe the recent tendency of the United States to import more than it exports before exploring the basic logic of trade. We will also address the controversial issue of protectionism.
5 of 31© 2014 Pearson Education, Inc.
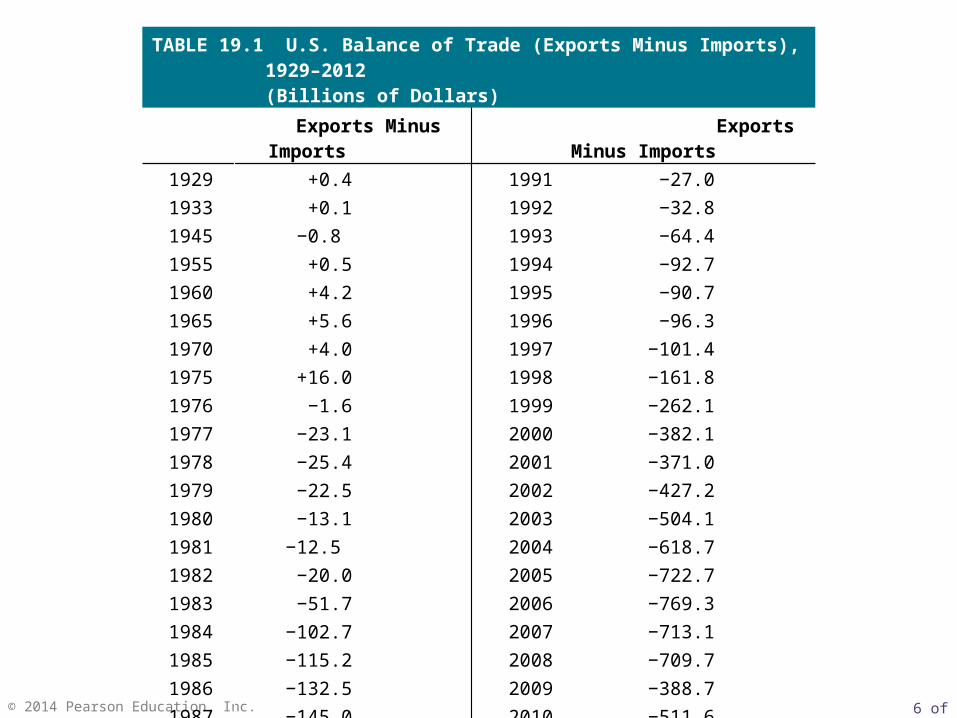
trade surplus The situation when a country exports more than it imports.
trade deficit The situation when a country imports more than it exports.
Trade Surpluses and Deficits
6 of 31© 2014 Pearson Education, Inc.
TABLE 19.1 U.S. Balance of Trade (Exports Minus Imports), 1929–2012(Billions of Dollars)
Exports Minus Imports Exports Minus Imports1929 +0.4 1991 −27.01933 +0.1 1992 −32.81945 −0.8 1993 −64.41955 +0.5 1994 −92.71960 +4.2 1995 −90.71965 +5.6 1996 −96.31970 +4.0 1997 −101.41975 +16.0 1998 −161.81976 −1.6 1999 −262.11977 −23.1 2000 −382.11978 −25.4 2001 −371.01979 −22.5 2002 −427.21980 −13.1 2003 −504.11981 −12.5 2004 −618.71982 −20.0 2005 −722.71983 −51.7 2006 −769.31984 −102.7 2007 −713.11985 −115.2 2008 −709.71986 −132.5 2009 −388.71987 −145.0 2010
2011−511.6−568.11988 −110.1
1989 −87.9 2012 −566.7
1990 −77.6

7 of 31© 2014 Pearson Education, Inc.
Corn Laws The tariffs, subsidies, and restrictions enacted by the British Parliament in the early nineteenth century to discourage imports and encourage exports of grain.
theory of comparative advantage Ricardo’s theory that specialization and free trade will benefit all trading partners (real wages will rise), even those that may be absolutely less efficient producers.
The Economic Basis for Trade: Comparative Advantage
absolute advantage The advantage in the production of a good enjoyed by one country over another when it uses fewer resources to produce that good than the other country does.
comparative advantage The advantage in the production of a good enjoyed by one country over another when that good can be produced at lower cost in terms of other goods than it could be in the other country.
Absolute Advantage versus Comparative Advantage
8 of 31© 2014 Pearson Education, Inc.
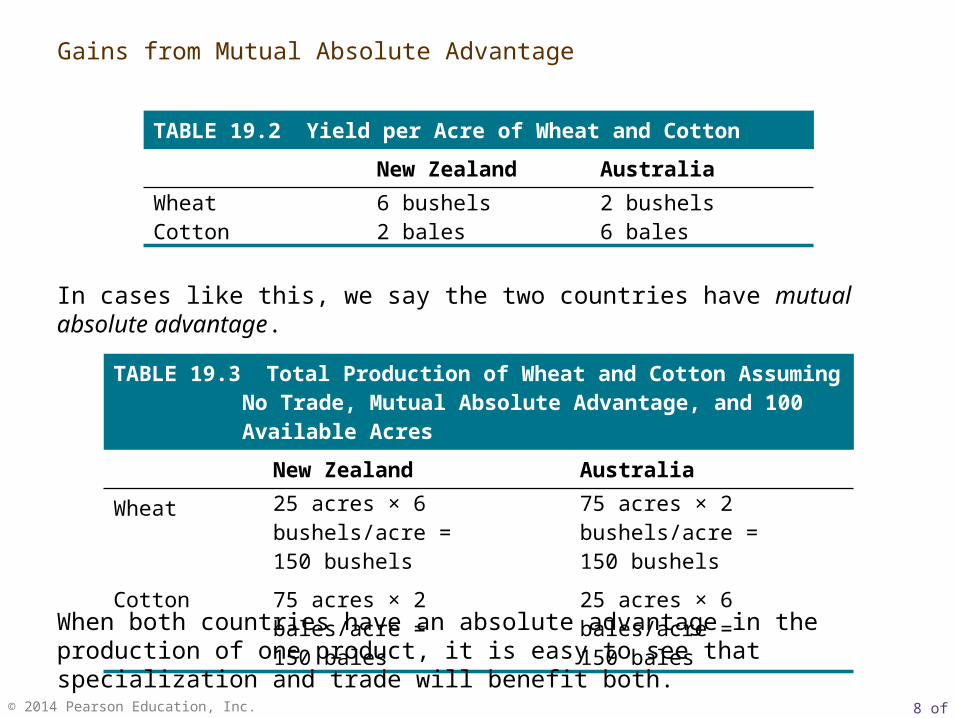
TABLE 19.2 Yield per Acre of Wheat and Cotton
New Zealand Australia
Wheat 6 bushels 2 bushelsCotton 2 bales 6 bales
TABLE 19.3 Total Production of Wheat and Cotton Assuming No Trade, Mutual Absolute Advantage, and 100 Available Acres
New Zealand Australia
Wheat 25 acres × 6 bushels/acre =150 bushels
75 acres × 2 bushels/acre =150 bushels
Cotton 75 acres × 2 bales/acre =150 bales
25 acres × 6 bales/acre =150 bales
Gains from Mutual Absolute Advantage
In cases like this, we say the two countries have mutual absolute advantage.
When both countries have an absolute advantage in the production of one product, it is easy to see that specialization and trade will benefit both.
9 of 31© 2014 Pearson Education, Inc.
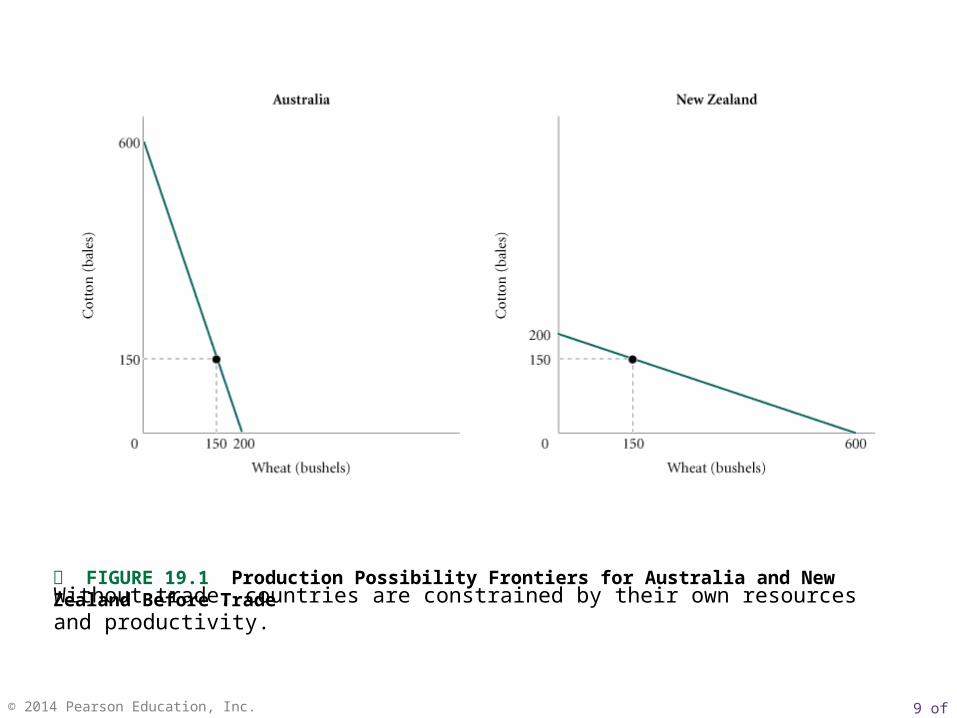
FIGURE 19.1 Production Possibility Frontiers for Australia and New Zealand Before Trade
Without trade, countries are constrained by their own resources and productivity.
10 of 31© 2014 Pearson Education, Inc.
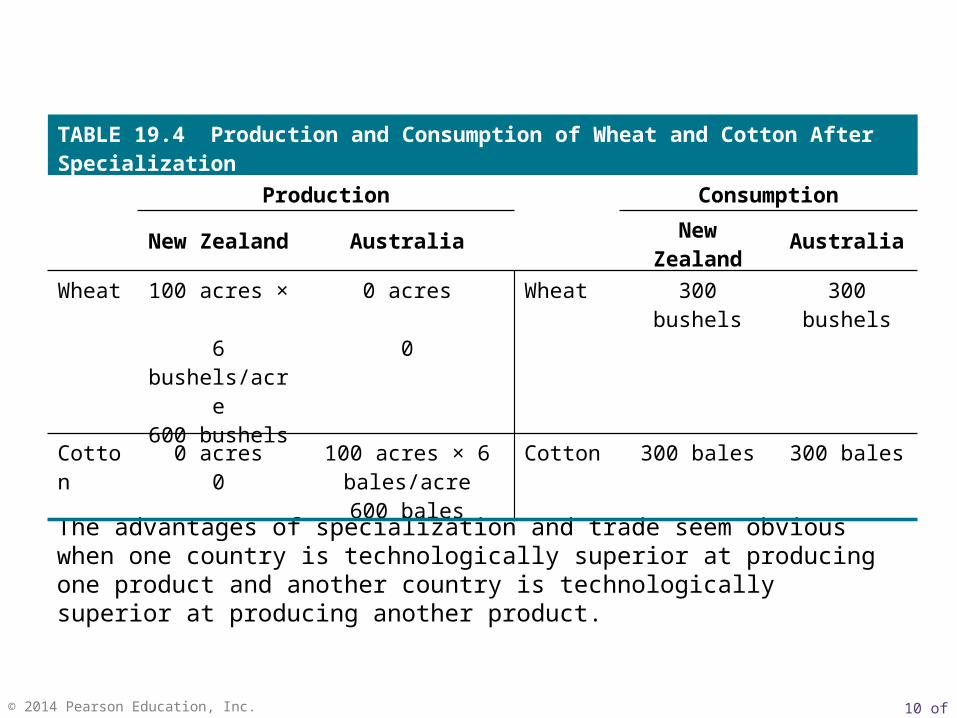
The advantages of specialization and trade seem obvious when one country is technologically superior at producing one product and another country is technologically superior at producing another product.
TABLE 19.4 Production and Consumption of Wheat and Cotton After Specialization
Production Consumption
New Zealand Australia New Zealand Australia
Wheat 100 acres × 6 bushels/acre
600 bushels
0 acres
0
Wheat 300 bushels 300 bushels
Cotton 0 acres0
100 acres × 6 bales/acre600 bales
Cotton 300 bales 300 bales
11 of 31© 2014 Pearson Education, Inc.
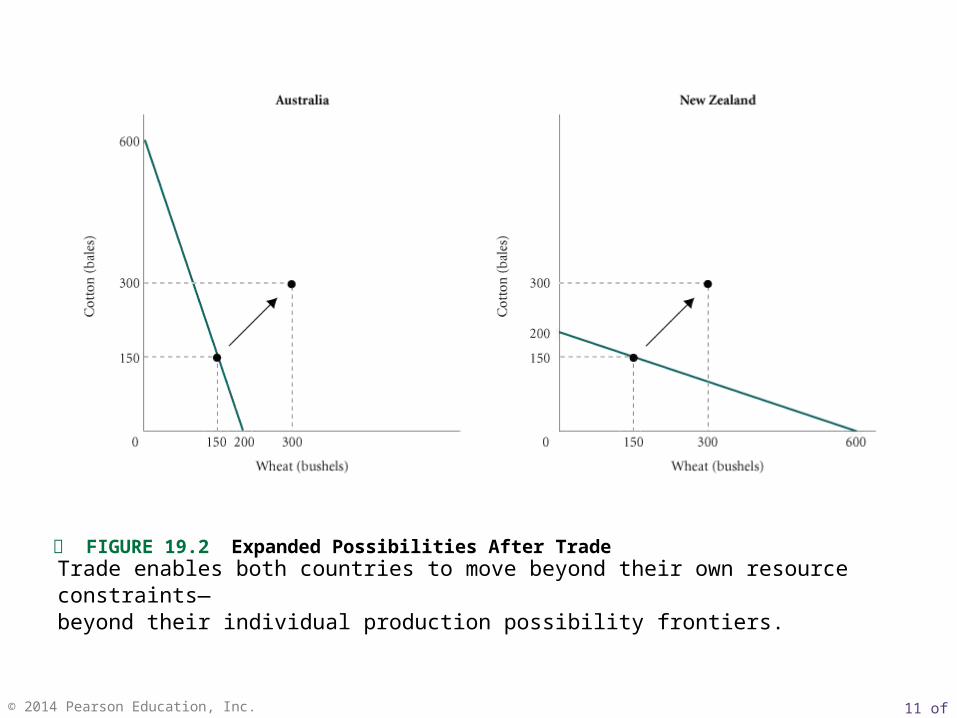
FIGURE 19.2 Expanded Possibilities After Trade
Trade enables both countries to move beyond their own resource constraints—beyond their individual production possibility frontiers.
12 of 31© 2014 Pearson Education, Inc.
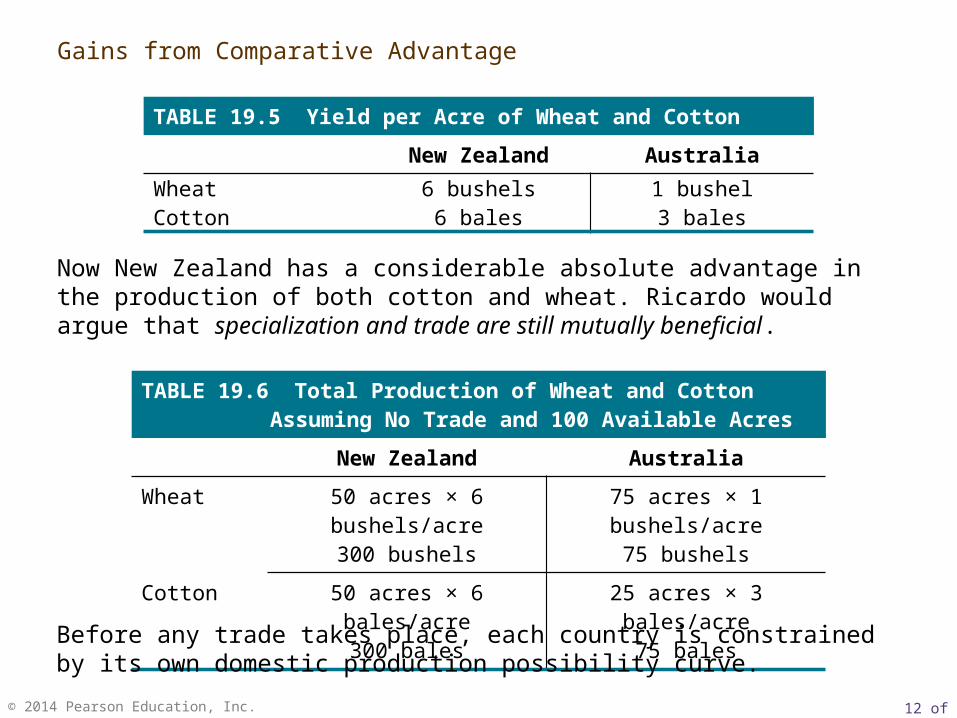
TABLE 19.5 Yield per Acre of Wheat and Cotton
New Zealand Australia
Wheat 6 bushels 1 bushelCotton 6 bales 3 bales
TABLE 19.6 Total Production of Wheat and Cotton Assuming No Trade and 100 Available Acres
New Zealand Australia
Wheat 50 acres × 6 bushels/acre300 bushels
75 acres × 1 bushels/acre75 bushels
Cotton 50 acres × 6 bales/acre300 bales
25 acres × 3 bales/acre75 bales
Gains from Comparative Advantage
Now New Zealand has a considerable absolute advantage in the production of both cotton and wheat. Ricardo would argue that specialization and trade are still mutually beneficial.
Before any trade takes place, each country is constrained by its own domestic production possibility curve.

13 of 31© 2014 Pearson Education, Inc.
TABLE 19.7 Realizing a Gain from Trade When One Country Has a Double Absolute Advantage
STAGE 1 STAGE 2
New Zealand Australia New Zealand Australia
Wheat 50 acres × 6 bushels/acre
300 bushels
0 acres
0
Wheat 75 acres ×6 bushels/acre
450 bushels
0 acres
0
Cotton 50 acres × 6 bales/acre
300 bales
100 acres × 3 bales/acre
300 bales
Cotton 25 acres × 6 bales/acre
150 bales
100 acres ×3 bales/acre
300 bales
STAGE 3New Zealand Australia
100 bushels (trade)
Wheat 350 bushels 100 bushels(after trade)
200 bales (trade)
Cotton 350 bales 100 bales
(after trade)
For Ricardo to be correct about the gains from specialization, it must be true that moving resources around in the two countries generates more than the 375 bushels of wheat and bales of cotton that we had before specialization.
14 of 31© 2014 Pearson Education, Inc.
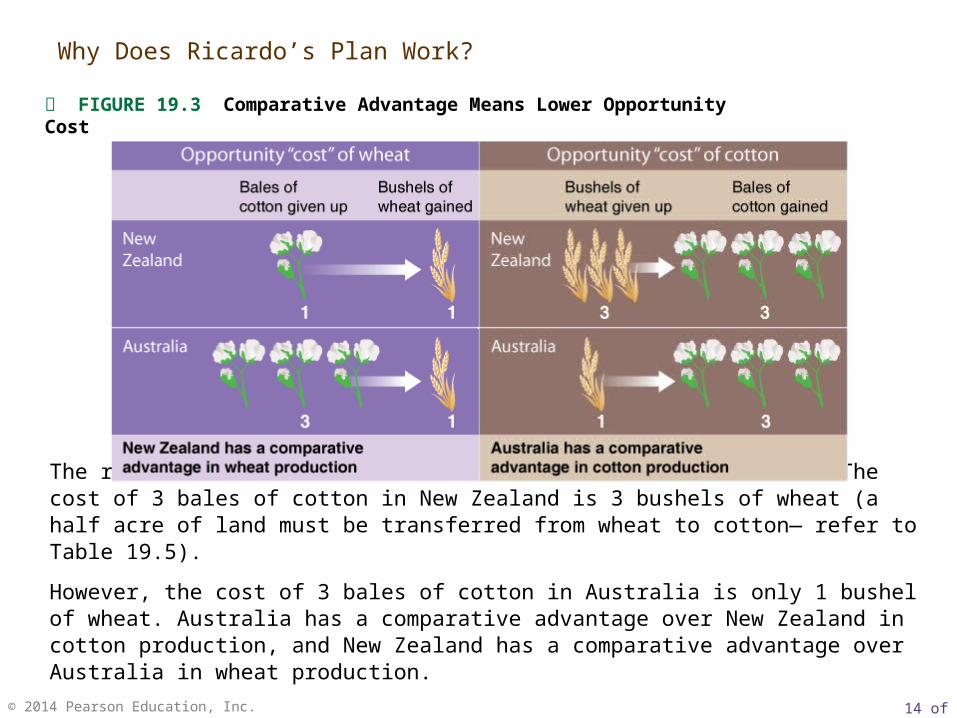
FIGURE 19.3 Comparative Advantage Means Lower Opportunity Cost
The real cost of cotton is the wheat sacrificed to obtain it. The cost of 3 bales of cotton in New Zealand is 3 bushels of wheat (a half acre of land must be transferred from wheat to cotton— refer to Table 19.5).
However, the cost of 3 bales of cotton in Australia is only 1 bushel of wheat. Australia has a comparative advantage over New Zealand in cotton production, and New Zealand has a comparative advantage over Australia in wheat production.
Why Does Ricardo’s Plan Work?

15 of 31© 2014 Pearson Education, Inc.
terms of trade The ratio at which a country can trade domestic products for imported products.
exchange rate The ratio at which two currencies are traded. The price of one currency in terms of another.
Terms of Trade
Exchange Rates

16 of 31© 2014 Pearson Education, Inc.
TABLE 19.8 Domestic Prices of Timber (per Foot) and Rolled Steel (per Meter) in the United States and Brazil
United States Brazil
Timber $1 3 Reals
Rolled steel $2 4 Reals
TABLE 19.9 Trade Flows Determined by Exchange Rates
Exchange Rate Price of Real Result
$1 = 1 R $1.00 Brazil imports timber and steel.
$1 = 2 R .50 Brazil imports timber.
$1 = 2.1 R .48 Brazil imports timber; United States imports steel.
$1 = 2.9 R .34 Brazil imports timber; United States imports steel.
$1 = 3 R .33 United States imports steel.
$1 = 4 R .25 United States imports timber and steel.
Trade and Exchange Rates in a Two-Country/Two-Good World
Trade flows in both directions as long as the exchange rate settles between $1 = 2 R and $1 = 3 R. Stated the other way around, trade will flow in both directions if the price of a real is between $0.33 and $0.50.
17 of 31© 2014 Pearson Education, Inc.
If exchange rates end up in the right ranges, the free market will drive each country to shift resources into those sectors in which it enjoys a comparative advantage.
Only in a country with a comparative advantage will those products be competitive in world markets.
Exchange Rates and Comparative Advantage
18 of 31© 2014 Pearson Education, Inc.
factor endowments The quantity and quality of labor, land, and natural resources of a country.
Heckscher-Ohlin theorem A theory that explains the existence of a country’s comparative advantage by its factor endowments: A country has a comparative advantage in the production of a product if that country is relatively well endowed with inputs used intensively in the production of that product.
The Sources of Comparative Advantage
The Heckscher-Ohlin Theorem
19 of 31© 2014 Pearson Education, Inc.
Comparative advantage is not the only reason countries trade. It does not explain why many countries import and export the same kinds of goods.
Just as industries within a country differentiate their products to capture a domestic market, they also differentiate their products to please the wide variety of tastes that exist worldwide.
Just as product differentiation is a natural response to diverse preferences within an economy, it is also a natural response to diverse preferences across economies.
Some economists distinguish between gains from acquired comparative advantages and gains from natural comparative advantages.
Other Explanations for Observed Trade Flows
20 of 31© 2014 Pearson Education, Inc.
Recent work in the trade area has described the way in which free trade improves the productivity of firms within a country.
When trade opens up, competition grows, and firms with good products and low costs can expand to serve markets elsewhere, often improving their cost through scale economies.
Less productive firms find themselves facing tough competition from both foreign producers and from their domestic counterparts who now look even more productive than before.
Trade exploits comparative advantage of countries and generally improves the efficiency of firms.
Globalization Improves Firm Productivity
E C O N O M I C S I N P R A C T I C E
THINKING PRACTICALLY
1. What do you expect to see happen to average prices after trade opens up?
21 of 31© 2014 Pearson Education, Inc.
protection The practice of shielding a sector of the economy from foreign competition.
tariff A tax on imports.
export subsidies Government payments made to domestic firms to encourage exports.
dumping A firm’s or an industry’s sale of products on the world market at prices below its own cost of production.
quota A limit on the quantity of imports.
Trade Barriers: Tariffs, Export Subsidies, and Quotas
22 of 31© 2014 Pearson Education, Inc.
Prior to 2005, textiles and clothing from much of the emerging world heading for the United States, Canada, and the European Union were subject to quotas.
When an exporting country faces a quota on its products, governments typically decide which firms get the privilege of sending their goods abroad.
After quotas were lifted in 2005, Chinese exports increased dramatically, most of which were produced not by the older firms which had dominated the quota-laden era, but by new entrants!
Without quotas, most of the older firms now subject to the new competition rapidly lost market share. However China was allocating its licenses, it was not to the most efficient firms.
What Happens When We Lift a Quota?
E C O N O M I C S I N P R A C T I C E
THINKING PRACTICALLY
1. If in fact the Chinese government was allocating the rights to export under a quota to the most productive firms, what would you expect to see happen once the quota is lifted?

23 of 31© 2014 Pearson Education, Inc.
Smoot-Hawley tariff The U.S. tariff law of the 1930s, which set the highest tariffs in U.S. history (60 percent). It set off an international trade war and caused the decline in trade that is often considered one of the causes of the worldwide depression of the 1930s.
General Agreement on Tariffs and Trade (GATT) An international agreement signed by the United States and 22 other countries in 1947 to promote the liberalization of foreign trade.
World Trade Organization (WTO) A negotiating forum dealing with rules of trade across nations.
Doha Development Agenda An initiative of the World Trade Organization focused on issues of trade and development.
U.S. Trade Policies, GATT, and the WTO
24 of 31© 2014 Pearson Education, Inc.
economic integration Occurs when two or more nations join to form a free-trade zone.
European Union (EU) The European trading bloc composed of 27 countries (of the 27 countries in the EU, 17 have the same currency—the euro).
U.S.-Canadian Free Trade Agreement An agreement in which the United States and Canada agreed to eliminate all barriers to trade between the two countries by 1998.
North American Free Trade Agreement (NAFTA) An agreement signed by the United States, Mexico, and Canada in which the three countries agreed to establish all North America as a free-trade zone.
Economic Integration

25 of 31© 2014 Pearson Education, Inc.
FIGURE 19.4 The Gains from Trade and Losses from the Imposition of a Tariff
A tariff of $1 increases the market price facing consumers from $2 per yard to $3 per yard. The government collects revenues equal to the gray shaded area in panel (b). The loss of efficiency has two components. First, consumers must pay a higher price for goods that could be produced at lower cost. Second, marginal producers are drawn into textiles and away from other goods,resulting in inefficient domestic production. The triangle labeled ABC in panel (b) is the dead weight loss or excess burden resulting from the tariff.
Free Trade or Protection?The Case for Free Trade
26 of 31© 2014 Pearson Education, Inc.
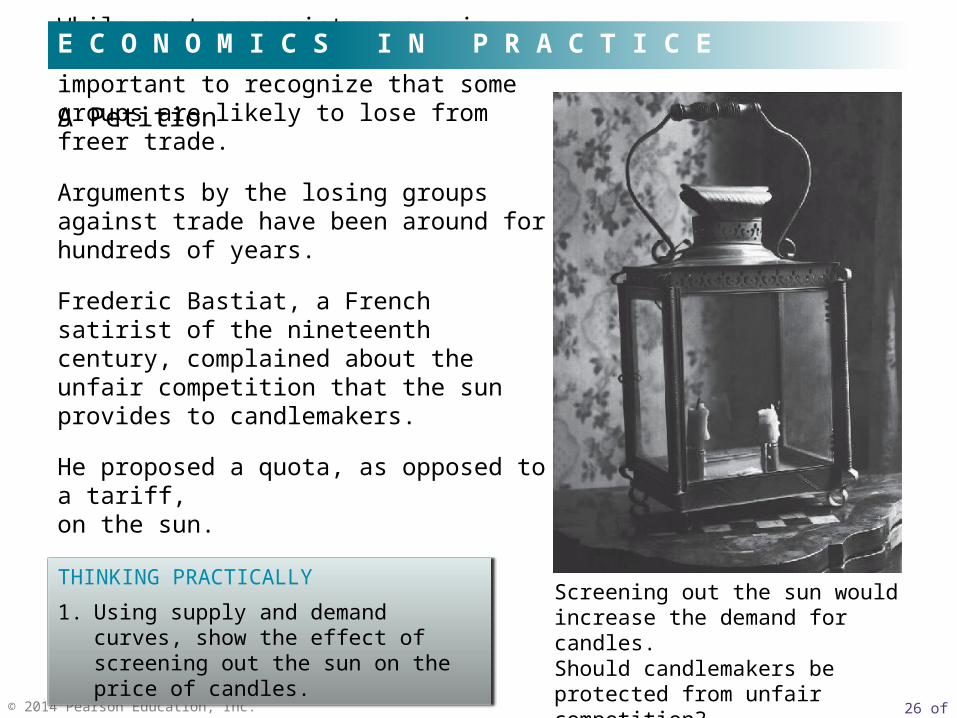
While most economists argue in favor of free trade, it is important to recognize that some groups are likely to lose from freer trade.
Arguments by the losing groups against trade have been around for hundreds of years.
Frederic Bastiat, a French satirist of the nineteenth century, complained about the unfair competition that the sun provides to candlemakers.
He proposed a quota, as opposed to a tariff,on the sun.
A Petition
E C O N O M I C S I N P R A C T I C E
Screening out the sun would increase the demand for candles.Should candlemakers be protected from unfair competition?
THINKING PRACTICALLY
1. Using supply and demand curves, show the effect of screening out the sun on the price of candles.
27 of 31© 2014 Pearson Education, Inc.
The Case for Protection
Protection Saves Jobs
The main argument for protection is that foreign competition costs Americans their jobs. Victims of free trade can be aided constructively without forgoing the gains from trade.
Some Countries Engage in Unfair Trade Practices
Free trade may be the best solution when everybody plays by the rules. The WTO is the vehicle currently used to negotiate disputes involving unfair trade practices.
Cheap Foreign Labor Makes Competition Unfair
Wages in a competitive economy reflect productivity: a high ratio of output to units of labor, and trade flows not according to absolute advantage, but according to comparative advantage: All countries benefit, even if one country is more efficient at producing everything.
28 of 31© 2014 Pearson Education, Inc.
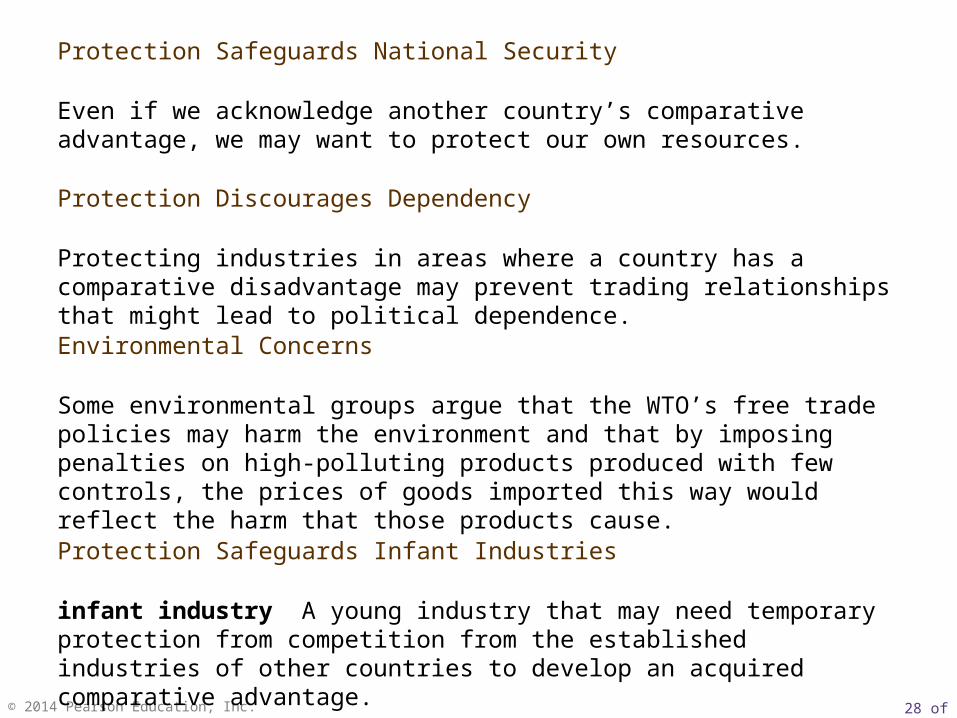
Protection Safeguards National Security
Even if we acknowledge another country’s comparative advantage, we may want to protect our own resources.
Protection Discourages Dependency
Protecting industries in areas where a country has a comparative disadvantage may prevent trading relationships that might lead to political dependence.
Environmental Concerns
Some environmental groups argue that the WTO’s free trade policies may harm the environment and that by imposing penalties on high-polluting products produced with few controls, the prices of goods imported this way would reflect the harm that those products cause.
Protection Safeguards Infant Industries
infant industry A young industry that may need temporary protection from competition from the established industries of other countries to develop an acquired comparative advantage.

29 of 31© 2014 Pearson Education, Inc.
FIGURE 19.5 Trade Openness Across the World (Index is 100 minus the average effective tariff rate in the region.)
Changes in Openness to Trade Over Time Across the World
30 of 31© 2014 Pearson Education, Inc.
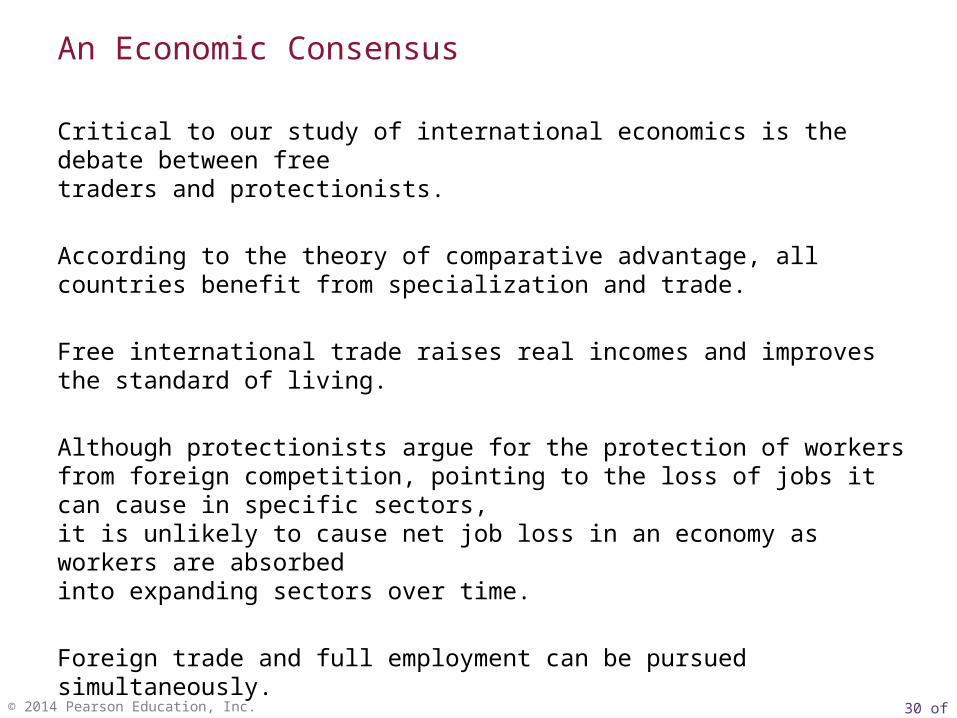
Critical to our study of international economics is the debate between free traders and protectionists.
According to the theory of comparative advantage, all countries benefit from specialization and trade.
Free international trade raises real incomes and improves the standard of living.
Although protectionists argue for the protection of workers from foreign competition, pointing to the loss of jobs it can cause in specific sectors, it is unlikely to cause net job loss in an economy as workers are absorbed into expanding sectors over time.
Foreign trade and full employment can be pursued simultaneously.
Although economists disagree about many things, the vast majority of them favor free trade.
An Economic Consensus
31 of 31© 2014 Pearson Education, Inc.
absolute advantage
comparative advantage
Corn Laws
Doha Development Agenda
dumping
economic integration
European Union (EU)
exchange rate
export subsidies
factor endowments
General Agreement on Tariffs and Trade (GATT)
Heckscher-Ohlin theorem
infant industry
North American Free Trade Agreement (NAFTA)
protection
quota
Smoot-Hawley tariff
tariff
terms of trade
theory of comparative advantage
trade deficit
trade surplus
U.S.-Canadian Free Trade Agreement
World Trade Organization (WTO)
R E V I E W T E R M S A N D C O N C E P T S