1 lodi unified school district 2011-12 first interim
TRANSCRIPT

1
Lodi Unified School District2011-12 First Interim

2
Trigger CrisisTrigger Crisis
Legislative Analysts Office 3.8 Billion Revenue Shortfall. 5.2 million dollar reduction to LUSD Revenue @ 190 per ADA.Up to 2 million dollars in Home-to-School Transportation.December 15 Department of Finance.January 10 Governor’s Budget.
3
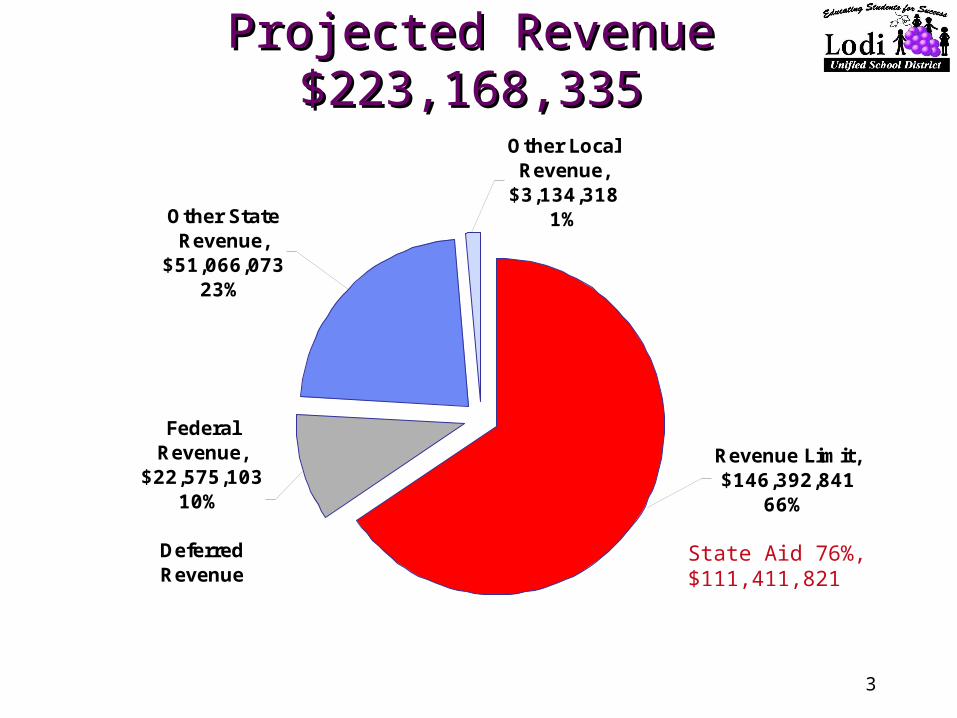
Projected Revenue Projected Revenue $223,168,335$223,168,335
Revenue Limit, $146,392,841
66%
Federal Revenue,
$22,575,103 10%
Deferred Revenue
Other State Revenue,
$51,066,073 23%
Other Local Revenue,
$3,134,318 1%
State Aid 76%, $111,411,821

4
Projected Expenditure Projected Expenditure $224,784,243$224,784,243
7000, -$296,624 0%
6000, $256,175 0%5000,
$21,526,917 10%
4000, $23,414,903
10%
3000, $43,756,853
19%
2000, $32,612,923
14%
1000, $103,513,096
47%
1000 Certificated Personnel
2000 Classified Personnel
3000 Benefits
4000 Supplies
5000 Contracted Services
6000 Capital Items
7000 Other Outgo

5
Projected ReservesProjected Reserves
Contingency Reserve $ 788,326Capital Outlay (AB 87) $ 279,920Contingent on State Deficit* $ 7,119,796Transportation Reserve* $ 2,085,437LEA Negotiated Settlement Reserve $ 3,284,915Tier III Program Reserves $ 4,972,225Unforeseen Special Education $ 1,423,689SERP Reserves $ 3,636,960State Deferred/Deficit Spending (Cash) $17,960,593State Required 3% $ 6,827,687
*County Required

6
Reduction to Reserves
2012-13 2013-14Certificated Step and Column $1,642,457Classified Step $291,930SERP Payment* $1,212,320*SERP 2011-12 $1,212,320Fee and Interest $500,000
Certificated Step and Column $1,642,457Classified Step 296,756SERP Payment $1,212,320Fees and Interest $500,000
Reduced School Year 2014-15Class Size Reduction 2013-14
Total Reductions 2011-2013 $8,510,560

7
$210,096,429 $213,482,727
$49,691,765
$0
$50,000,000
$100,000,000
$150,000,000
$200,000,000
$250,000,000
Revenue Expenditure Ending Balance
2012-13
$3,386,297 Deficit
Multi-Year ProjectionMulti-Year Projection

8
$205,265,941 $215,280,547
$39,677,159
$0
$50,000,000
$100,000,000
$150,000,000
$200,000,000
$250,000,000
Revenue Expenditure Ending Balance
2013-14
$10,014,606 Deficit
Multi-Year ProjectionMulti-Year Projection

9
Deferrals
Jul Aug
Aug Sep Oct Nov Dec Jan Feb Mar Apr May Jun Jul
New Fiscal Year
2011
2012
20112011 2012201120112011 201220122012
2012
20122012
$0.800 B $0.800 BMay ’12 to Jul ‘12
$1 B $1 BMay ’12 to Aug ‘12
Feb ’12 to Jul ‘12
$2.0 B$2.0 B
$0.419 BApr ’12 to Jul ‘12
$0.419 B
$1.4 B $1.4 B
Mar ’12 to Apr ‘12
$2.4 B $2.4 B
Oct ’11 to Jan ‘12
$1.4 B
Jul ’11 to Sep ‘11
$0.700 B $0.700 B
Jul ’11 to Jan ‘12
$1.4 B $1.4 B
Aug ’11 to Jan ‘12
$0.764 B $0.764 BApr ’12 to Aug ‘12
New Deferral
= Interyear
$2.5 B $2.5 BInfamous P-2 Deferral
Jun ’12 to Jul ‘12
$0.679 B $0.679 BApr ’12 to Aug ‘12
$1.3 BMar ’12 to Aug ‘12
$1.3 BNew
Deferral
B = Billion= Intrayear
38% or $41,612,812 is deferred to the next fiscal year.

1004/18/23
CASHCASH
$0
$5,000,000
$10,000,000
$15,000,000
$20,000,000
$25,000,000
$30,000,000
$35,000,000
$40,000,000
$45,000,000
$50,000,000
July
August
Septe
mber
Octob
er
Novem
ber
Decem
ber
Janua
ry
Febru
ary
Mar
chApr
ilM
ay
June
Beginning CashBalance
Expenses
Ending CashBalance
Estimated
TRANS
July $8,562,015 April $5,000,000
1104/18/23
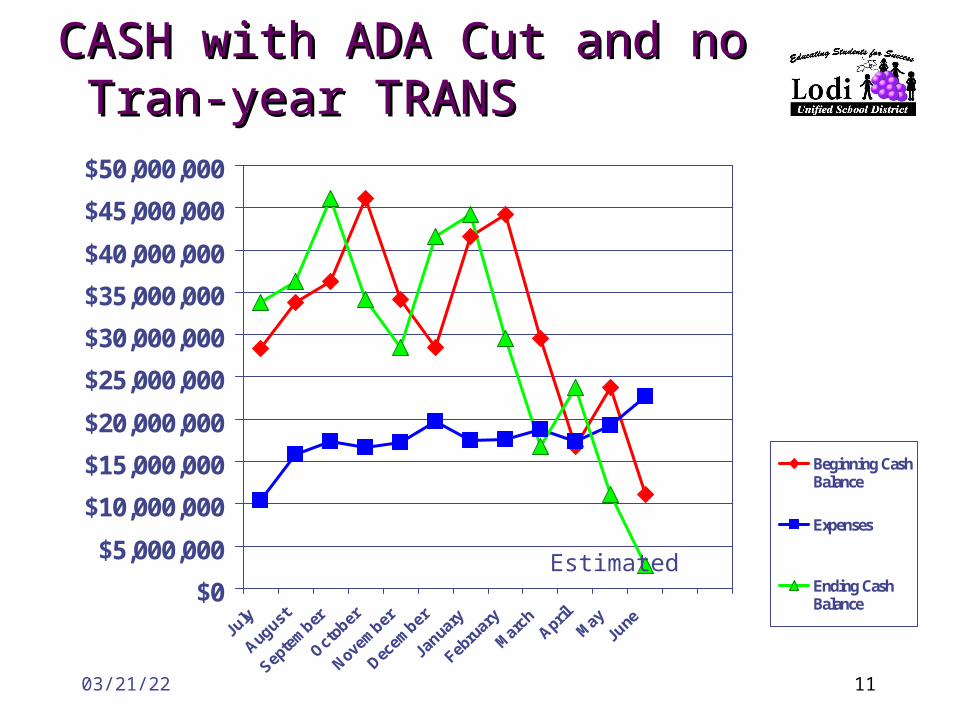
CASH with ADA Cut and no CASH with ADA Cut and no Tran-year TRANS Tran-year TRANS
$0
$5,000,000
$10,000,000
$15,000,000
$20,000,000
$25,000,000
$30,000,000
$35,000,000
$40,000,000
$45,000,000
$50,000,000
July
August
Septe
mber
Octob
er
Novem
ber
Decem
ber
Janua
ry
Febru
ary
Mar
chApr
ilM
ay
June
Beginning CashBalance
Expenses
Ending CashBalance
Estimated

12
EnrollmentEnrollment
28,577
29,00629,496
28,59928,739
27,500
28,000
28,500
29,000
29,500
30,000
30,500
July Aug Sept Oct Nov Dec Jan Feb March Apr May
2008-092009-102010-112011-12

13
Enrollment by GradeEnrollment by GradeYearly Enrollment by Grade
1029
2029198421252135211121372085213721902214209021782133
10182024209421082162207720472091216520562039209621722237
0
500
1000
1500
2000
2500
K 1 2 3 4 5 6 7 8 9 10 11 12 SpecialDay
2008-092009-102010-112011-12

14
Special ThanksSpecial Thanks
Angel Murnan, Director of Budgets, and the Budget Department
Maria Fong, Controller, and the Accounting Department
Joan Scherr, Administrative Assistant
And
to the Board of Education