modoc joint unified school district 2014-15 second interim
TRANSCRIPT

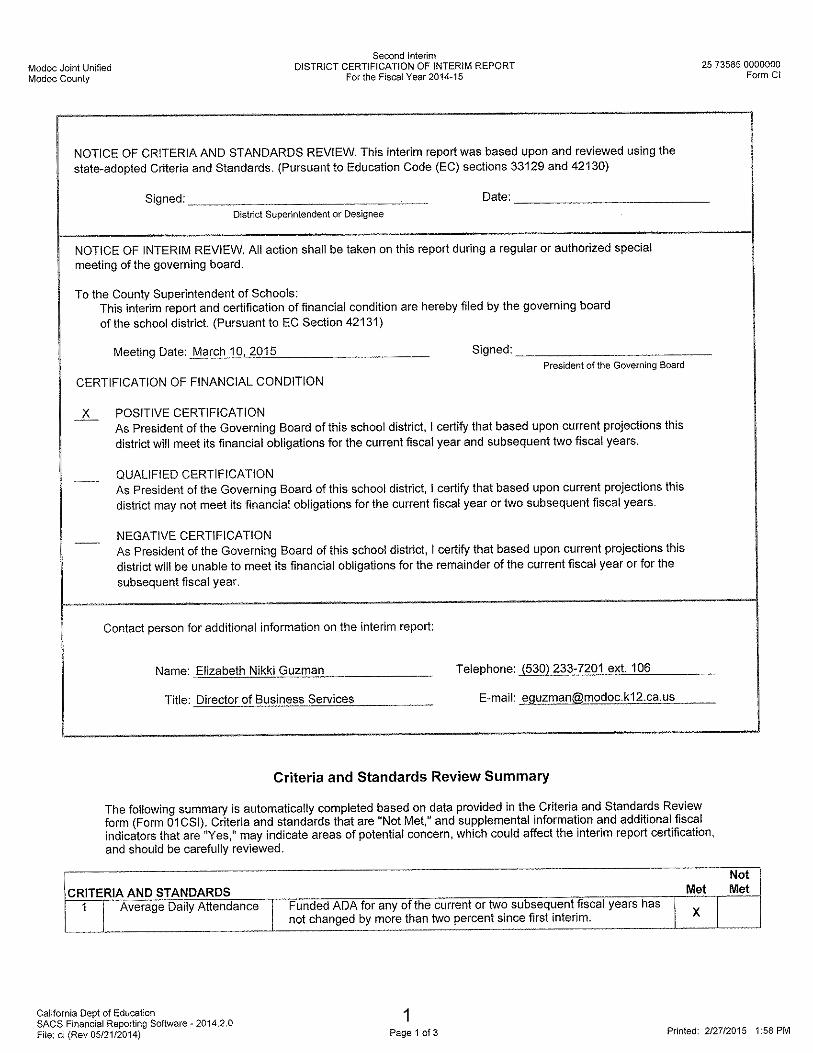
An Interim Report shows the District's current financial status and projections for the next two fiscal years.A review of the current financial condition helps to determine if the District will be able to meet it's financialobligations now and in the future. The budget is revised during the year to reflect changes from grant awardentitlements, state budget adjustments, and changes to expenditures.
Interim Reports are done on the Standardized Account Code Structure (SACS) state software. SACS formshave four columns of information: (A) The Original Budget or July 1st Budget, (B) Board Approved OperatingBudget as of January 31st, (C) Actuals to Date, and (D) Projected Year Totals.
I. GENERAL FUND (SACS Form 01I)
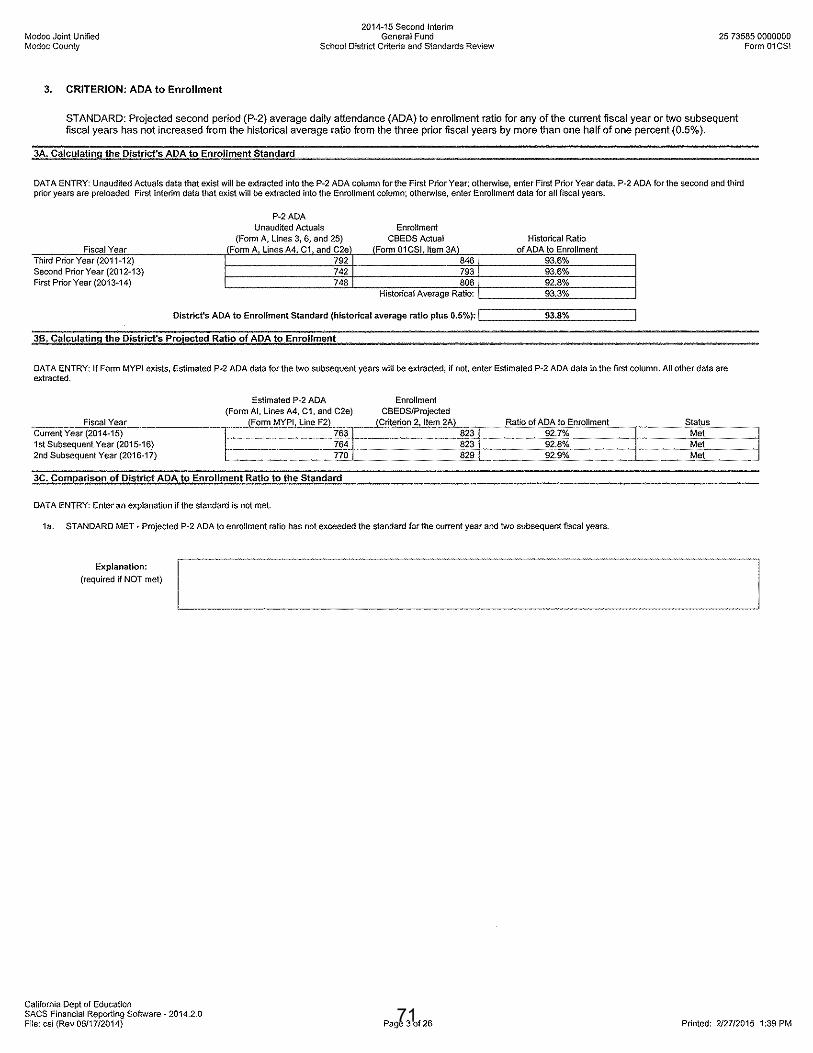
ENROLLMENT AND AVERAGE DAILY ATTENDANCE (ADA) Funding for the District is generated by the number of students enrolled and average daily attendance (ADA). Enrollment is reported each year in October. ADA is reported three times during the year; Period 1 (P1 ADA),Period 2 (P2 ADA) and Annual ADA.
Enrollment: Projections for the next year are done by rolling the current year enrollment counts forward
to the next grade level and getting estimates of the number of new Kindergarteners' that will be enrolling.Projections are updated during the year to ensure that the most current numbers are used.
Average Daily Attendance (ADA): Most of the funding for the District is generated by P2 ADA, which is
reported in the spring. For funding calculations our District can use current or prior year ADA, whichever isgreater. 14/15 P2 ADA is projected at 93.3% of enrollment.
BOARD APPROVED OPERATING BUDGETThe Board Approved Operating Budget is information as of January 31, 2015.
REVENUESLCFF Sources: Increased by $27,067 for California students attending school in Oregon. This fundingused to be received through a County Tuition Fund, but is now part of the LCFF calculation.
Federal Revenues: Title I increased by $1,285.
Modoc Joint Unified School District2014-15 Second Interim Report Narrative
859
846
793
806
823
802.
13
801.
11
754.
50
761.
93
777.
78
791.
26
793.
18
742.
30
748.
33
763.
09 78
5.76
790.
94
742.
58
743.
99
700
750
800
850
10/11 11/12 12/13 13/14 14/15
Enrollment P1 ADA P2 ADA Annual ADA
Pro
ject
ed
Page 1

State Revenues: Increased by $477 from state testing.
Local Revenues: Increased by $16,301 for nonresident student tuition, $3,500 from donations, $277from book fairs, and rent increased by $1,363.
EXPENDITURESStatus of Labor Agreements: Negotiations were settled with Teamsters and with the UnrepresentedConfidential Secretaries. All other groups remain unsettled.
Certificated Salaries/Classified Salaries/Benefits: Reflects changes from negotiations.
Books & Supplies/Services/Indirects: Reflects changes in revenues. $37,619 was added to pay fornonresident student tuition to Oregon.
Capital Outlay: $21,280 added for replacement cafeteria tables and $9,000 for well repair.
Direct/Indirect: No changes since First Interim Report.
OTHER FINANCINGNo changes since First Interim Report.
AUDIT ADJUSTMENTS/RESTATEMENTSThere were no adjustments in the Audit Report dated June 30, 2014. There are no restatements at this time.
PROJECTED YEAR TOTALSThe Projected Year Totals reflects any budget changes after January 31, 2015. Following is a narrative ofthose changes.
REVENUESLCFF Sources: Gap funding changed from 29.56% to 29.15%, reducing state aide by <$168>.
Federal Revenues: Increase of $36,700 from School Medi-Cal Administrative Activities prior yearreimbursements received and by $27 from Title II.
State Revenues: Lottery projections increased by $4,554, Prop 39 Energy Grant received $57,383, andstate testing increased by $477.
Local Revenues: No changes.
EXPENDITURESReclassifications to expenditure budgets were done to match current expenditure needs. Other revisions arefrom budgeting changes in revenues.
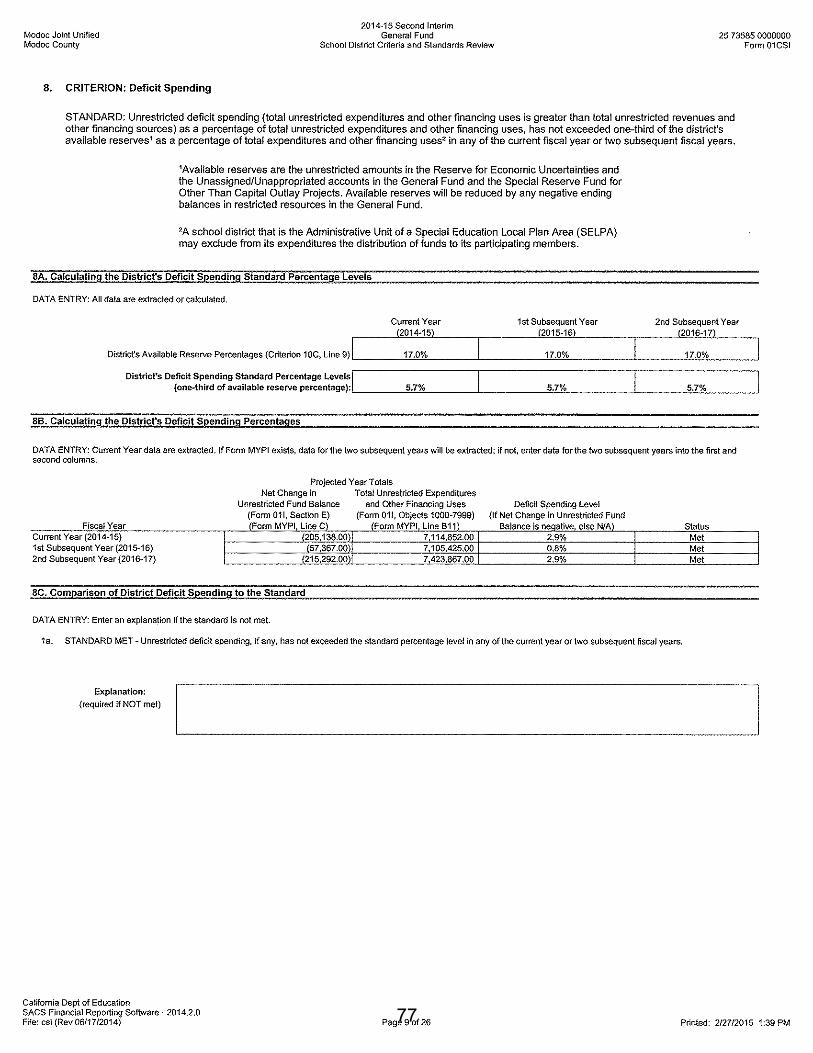
DEFICIT SPENDINGThe District reserves are being used for the goals in the LCAP to better meet the needs of students. The real
Increase (Decrease) to the General Fund Balance after carryover is removed is shown below:
July 1 Board Projected
Budget Approved Year TotalsGeneral Fund - Deficit Spending 14/15 14/15 14/15
Revenues 7,360,437 7,671,892 7,770,388- Expenditures -7,602,887 -8,026,536 -8,125,032
+/- Other Financing (Transfer In/Out) -98,229 5,838 5,838Increase (Decrease) -340,679 -348,806 -348,806
Carryover 0 154,675 154,675Real Increase (Decrease) -340,679 -194,131 -194,131
Page 2

FUND BALANCEOne of the most misunderstood aspects of California's required system for school budgeting is the General FundEnding Balance. Part of the ending fund balance is assigned to be used for specific purposes, such as designatedfunds for a geothermal matching grant requirement and to fund future costs associated with LCAP goals.
The General Fund Ending Balance includes the following components for the Projected Year Totals:
2,700 Revolving Fund (Object 9711) ; used for quick payments to vendors or employees.
3,528,210 Other Assignments (Object 9780) ; excess reserves needed for a geothermal grant match
and to meet current and future LCAP goals. The District is using reserves to provideintervention services, as seen in the decrease (deficit spending) to the General Fund.
1,392,013 Reserve for Economic Uncertainties (Object 9789) ; the remaining balance at the end of
the year that can be used at the discretion of the Governing Board. Required reservesare calculated on the total expenditures plus transfers out.This amount meets the 4% ($327,533) State Minimum Required Reserve and the17% ($1,392,013) reserve as per Board Policy 3100 to cover any unforeseenshortfalls in revenues or expenditures that are higher than those budgeted.
4,922,923 Total General Fund Ending Fund Balance
II. OTHER FUNDS (SACS Forms 13I, 17I, 35I, 40I)Since the First Interim Report, the Cafeteria Fund 13I has been revised to reflect Board approved salary changesthrough negotiations. Special Reserve Fund 40 has been revised to include the Board approved purchase of twovehicles.
III. MULTI-YEAR PROJECTION (MYP) ASSUMPTIONSIn order to make multi-year projections, the district uses a variety of assumptions and sources of informationavailable as of the point in time creating the projection. The purpose of MYPs is to show the impact of today'sdecisions on future budgets. Reasonable assumptions are made by utilizing information from multiple sourcessuch as the Department of Finances (DOF) future revenue estimates, School Services of California's Multi-YearProjection Dartboard, the Business and Administration Steering Committee (BASC) Common Message, currenttrends and historical data. Carryover is not estimated in MYP.
GOVERNOR'S JANUARY BUDGET PROPOSAL FOR 15/16The Governor proposes to eliminate any remaining cash deferrals, add one-time funding to further implementationof common core, and give a 1.58% COLA for categorical programs that remain outside LCFF.
MYP ADA & ENROLLMENT PROJECTIONSProjections are done by rolling current enrollment numbers forward to the next grade level and estimating futureKindergarteners. They are updated during the year to ensure that the most current numbers are used. DistrictADA is projected by using the historical ratio average of ADA to enrollment of 93.3%.
EnrollmentYear Projections TK - 3 4 - 6 7 - 8 9 - 12 Total ADA2015-16 820 230.20 183.60 128.62 221.82 764.242016-17 826 229.27 164.03 143.53 233.00 769.83
MYP REVENUESLCFF Sources: Until the target amount is reached under the LCFF calculation, funding is dependent onthe percent that Legislation will allocate each year to close the difference or "Gap" between the currentLCFF funded amount and the LCFF Target, which is estimated to be fully funded by 2021. The DOFestimates the LCFF gap funding to be 32.19% for 15/16 and 23.71% for 16/17. Revenues are notincreased by these percents, only the Gap difference is funded this way.
Federal/State/Local Revenues: Projected at current year amounts, less 14/15 one-time funding.
District ADA Projected by Grade Span
Page 3

MYP EXPENDITURESStatus of Labor Agreements: Unrepresented Confidential Secretaries are already settled for 15/16.All other groups are not settled in MYP at this time.
Salaries: Salaries are projected with step/longevity increases only at this time.
Benefits: Health insurance is capped at negotiated amounts. STRS is projected to be 10.73% in 15/16and 12.58% in 16/17. PERS is projected to be 12.60% in 15/16 and 15% in 16/17. All other mandatedbenefits are estimated at current rates.
Supplies/Services/Capital Outlay/Other: All other expenditures are estimates only and do not includeinclude any one-time expenditures from 14/15 or any estimated carryover.
Indirect Cost Rate: 7.43% in 15/16, which is also used as an estimate for 16/17.
Other Outgo: Special Education transfer of funding to MCOE. Bill backs are projected to begin in 16/17.
Interfund Transfers In: Funds are transferred in from Fund 17 to pay for the yearly retirement benefitcost of $59,974 in 15/16 and $50,034 in 16/17.
Interfund Transfers Out: Cafeteria Fund encroachment of $67,882 in 15/16 and $72,330 in 16/17.The Annual Required Contribution (ARC) under GASB 45 per the actuarial valuation is $39,483 in 15/16and $49,034 in 16/17. ARC is transferred from the General Fund to Special Reserve Fund 17.
MYP DEFICIT SPENDINGGeneral Fund - MYP Deficit Spending 15/16 16/17
Revenues 7,800,497 7,976,412- Expenditures -7,802,886 -8,110,742
+/- Other Financing (Transfer In/Out) -54,978 -80,962Increase (Decrease) -57,367 -215,292
MYP OTHER FUNDSMYP was done for Cafeteria Fund 13 and Special Reserve Fund 17 to reflect the interfund transfers betweenthese funds and General Fund 01.
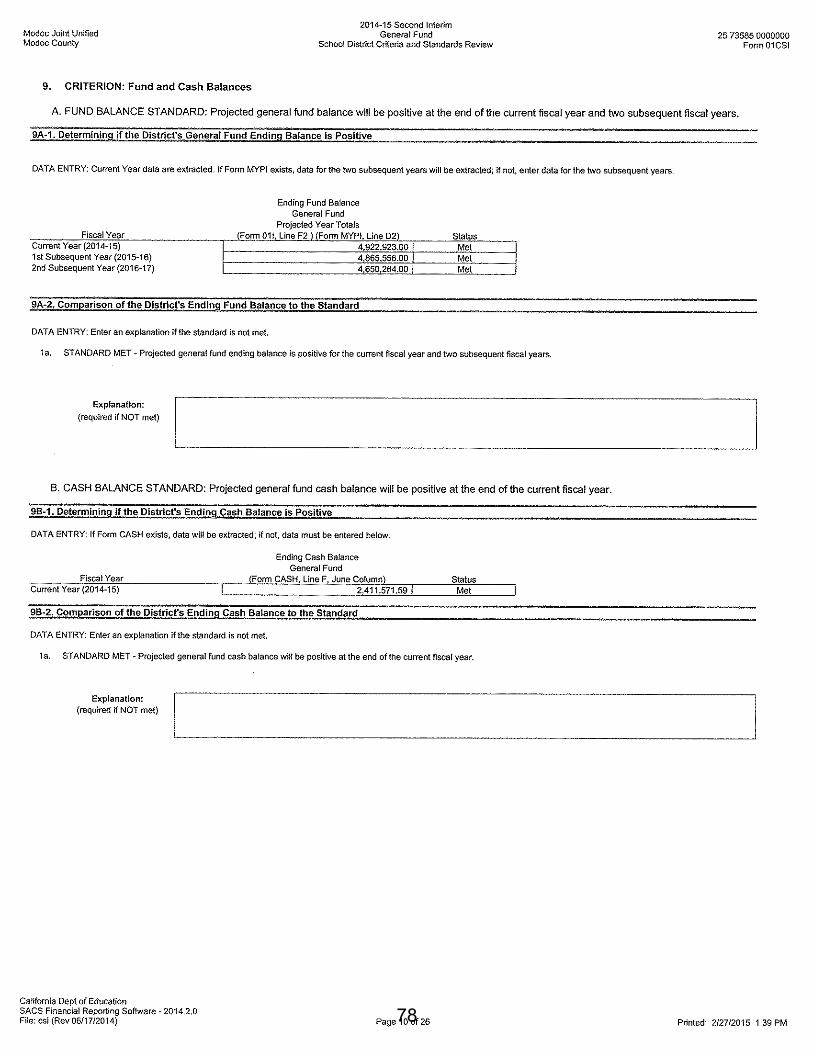
IV. CASH FLOWA budget is the estimated revenues and expenditures for a year. Cash flow reflects what is actually received andspent. The timing of state apportionments and county tax payments has an impact on our monthly cash flow.Cash management is essential in order to have an accurate picture of the District's financial stability. Cash ismonitored to ensure that the District will be able to meet expenditure needs on a monthly cash basis. Havingreserves become critical in order to meet cash flow needs of payroll and other obligations. A report is doneeach month as an information item for the Board.
Multi-year projections show that the District will have a positive cash balance in June 2015, 2016 and 2017.
V. RECOMMENDATIONAt this time in the fiscal year the District is in satisfactory financial condition. It is recommended that, based upon this Second Interim Report, the Board of Trustees approve the following:
A positive certification that the District will be able to meet its financial obligations for the current fiscalyear and subsequent two fiscal years by utilizing the General Fund Balance offset any deficit spending.
Page 4

Cafeteria Special Reserve Building Special ReserveUnrestricted Restricted Total Fund 13 Retirees - Fund 17 Fund 35 Fund 40
REVENUES:
LCFF Sources 6,822,578 0 6,822,578 0 0 0 0
Federal Revenues 49,700 365,695 415,395 282,000 0 0 0
Other State Revenues 180,992 94,597 275,589 23,900 0 0 0Other Local Revenues 229,755 27,071 256,826 56,025 1,000 50 108,392
TOTAL REVENUES 7,283,025 487,363 7,770,388 361,925 1,000 50 108,392
EXPENDITURES:
Certificated Salaries 3,045,025 106,553 3,151,578 0 0 0 0
Classified Salaries 857,523 271,549 1,129,072 129,122 0 0 0
Benefits 1,762,937 163,746 1,926,683 73,806 0 0 0
Books and Supplies 346,378 225,012 571,390 225,000 0 10,000 0
Services, Other Operating 857,534 127,815 985,349 2,300 0 12,460 0
Capital Outlay 68,380 154,766 223,146 0 0 32,463 51,245
Other Outgo 137,814 0 137,814 0 0 0 0Direct/Indirect -24,021 24,021 0 0 0 0 0
TOTAL EXPENDITURES 7,051,570 1,073,462 8,125,032 430,228 0 54,923 51,245
EXCESS (DEFICIENCY) 231,455 -586,099 -354,644 -68,303 1,000 -54,873 57,147
OTHER FINANCING:
Transfers In 69,120 0 69,120 63,282 0 0 0
Transfers Out 63,282 0 63,282 0 69,120 0 0
Other Sources 0 0 0 0 0 0 0
Other Uses 0 0 0 0 0 0 0Contributions to Rest. -442,431 442,431 0 0 0 0 0
TOTAL OTHER FINANCING -436,593 442,431 5,838 63,282 -69,120 0 0
INCREASE (DECREASE) -205,138 -143,668 -348,806 -5,021 -68,120 -54,873 57,147
Beginning Fund Balance 5,128,061 143,668 5,271,729 41,237 603,625 54,873 1,360,805
Audit Adjustments 0 0 0 0 0 0 0
Adj. Beginning Balance 5,128,061 143,668 5,271,729 41,237 603,625 54,873 1,360,805
ENDING FUND BALANCE 4,922,923 0 4,922,923 36,216 535,505 0 1,417,952
Components of Fund Balance
Revolving Fund 2,700
Stores 4,338
Other Assignments 3,528,210 31,878 535,505 1,417,952
Economic Uncertainties 1,392,013
4,922,923 36,216 535,505 0 1,417,952
Revised: 2/27/15
General Fund 01
14/15 Current Budgets for All Funds - - 2nd Interim Report

Unrestricted Restricted Total Unrestricted Restricted Total Unrestricted Restricted Total
REVENUES:
LCFF Sources 6,822,578 0 6,822,578 7,117,558 0 7,117,558 7,293,473 0 7,293,473
Federal Revenues 49,700 365,695 415,395 13,000 333,537 346,537 13,000 333,537 346,537
Other State Revenues 180,992 94,597 275,589 126,468 31,370 157,838 126,468 31,370 157,838Other Local Revenues 229,755 27,071 256,826 178,564 0 178,564 178,564 0 178,564
TOTAL REVENUES 7,283,025 487,363 7,770,388 7,435,590 364,907 7,800,497 7,611,505 364,907 7,976,412
EXPENDITURES:
Certificated Salaries 3,045,025 106,553 3,151,578 3,069,594 106,916 3,176,510 3,128,513 108,421 3,236,934
Classified Salaries 857,523 271,549 1,129,072 875,298 273,746 1,149,044 893,721 274,942 1,168,663
Benefits 1,762,937 163,746 1,926,683 1,843,292 169,437 2,012,729 1,924,944 177,429 2,102,373
Books and Supplies 346,378 225,012 571,390 290,446 105,775 396,221 290,646 105,775 396,421
Services, Other Operating 857,534 127,815 985,349 796,829 93,876 890,705 797,332 88,641 885,973
Capital Outlay 68,380 154,766 223,146 0 40,000 40,000 0 40,000 40,000
Other Outgo 137,814 0 137,814 137,677 0 137,677 280,378 0 280,378Direct/Indirect -24,021 24,021 0 -22,663 22,663 0 -22,663 22,663 0
TOTAL EXPENDITURES 7,051,570 1,073,462 8,125,032 6,990,473 812,413 7,802,886 7,292,871 817,871 8,110,742
EXCESS (DEFICIENCY) 231,455 -586,099 -354,644 445,117 -447,506 -2,389 318,634 -452,964 -134,330
OTHER FINANCING:
Transfers In 69,120 0 69,120 59,974 0 59,974 50,034 0 50,034
Transfers Out 63,282 0 63,282 114,952 0 114,952 130,996 0 130,996
Other Sources 0 0 0 0 0 0 0 0 0
Other Uses 0 0 0 0 0 0 0 0 0Contributions to Rest. -442,431 442,431 0 -447,506 447,506 0 -452,964 452,964 0
TOTAL OTHER FINANCING -436,593 442,431 5,838 -502,484 447,506 -54,978 -533,926 452,964 -80,962
INCREASE (DECREASE) -205,138 -143,668 -348,806 -57,367 0 -57,367 -215,292 0 -215,292
Beginning Fund Balance 5,128,061 143,668 5,271,729 4,922,923 0 4,922,923 4,865,556 0 4,865,556
Audit Adjustments 0 0 0 0 0 0 0 0 0
Adj. Beginning Balance 5,128,061 143,668 5,271,729 4,922,923 0 4,922,923 4,865,556 0 4,865,556
ENDING FUND BALANCE 4,922,923 0 4,922,923 4,865,556 0 4,865,556 4,650,264 0 4,650,264
NARRATIVE 14/15 includes carryover and one-time funding. Projected years do not include any estimated carryover. Projected 15/16 and 16/17 salaries and benefits are
increased by step, longevity and changes in benefit rates. 16/17 Other Outgo is increased by $142,038 for Special Education bill backs. Transfers In is from Special Reserve
Fund 17 for pay-as-you-go yearly retiree benefit costs. Transfers Out is Cafeteria Fund 13 encroachment and for the Special Reserve Fund 17 transfer to maintain a fund
balance that meets the Accrued Liability (AL) per the current Actuarial Valuation for Other Post-Employment Benefits (OPEB).
Revised: 2/27/15
General Fund Multi-Year Projections (MYP)
14/15 Current Budget 15/16 Projected 16/17 Projected

Multi-Year Projections (MYP) for Other Funds Revised: 2/27/15
14/15 15/16 16/17 14/15 15/16 16/17
REVENUES:
LCFF Sources 0 0 0 0 0 0Federal Revenues 282,000 282,000 282,000 0 0 0Other State Revenues 23,900 23,900 23,900 0 0 0Other Local Revenues 56,025 56,025 56,025 1,000 1,000 1,000
TOTAL REVENUES 361,925 361,925 361,925 1,000 1,000 1,000
EXPENDITURES:
Certificated Salaries 0 0 0 0 0 0Classified Salaries 129,122 134,044 137,621 0 0 0Benefits 73,806 76,050 78,966 0 0 0Books and Supplies 225,000 225,000 225,000 0 0 0Services, Other Operating 2,300 2,300 2,300 0 0 0Capital Outlay 0 0 0 0 0 0Other Outgo 0 0 0 0 0 0Direct/Indirect 0 0 0 0 0 0
TOTAL EXPENDITURES 430,228 437,394 443,887 0 0 0
EXCESS (DEFICIENCY) -68,303 -75,469 -81,962 1,000 1,000 1,000 OTHER FINANCING:
Transfers In 63,282 75,469 81,962 0 39,483 49,034Transfers Out 0 0 0 -69,120 -59,974 -50,034Other Sources 0 0 0 0 0 0Other Uses 0 0 0 0 0 0Contributions to Rest. 0 0 0 0 0 0
TOTAL OTHER FINANCING 63,282 75,469 81,962 -69,120 -20,491 -1,000
INCREASE (DECREASE) -5,021 0 0 -68,120 -19,491 0
Beginning Fund Balance 41,237 36,216 36,216 603,625 535,505 516,014Audit Adjustments 0 0 0 0 0 0Adj. Beginning Balance 41,237 36,216 36,216 603,625 535,505 516,014ENDING FUND BALANCE 36,216 36,216 36,216 535,505 516,014 516,014
NARRATIVE MYP's are done for Cafeteria Fund 13 and Special Reserve Fund 17 to show the transfers in and out with the General Fund.
Cafeteria Fund 13 : Salaries and benefits are increased by step, longevity and changes in benefit rates. Transfers In covers deficiency of revenues.
Special Reserve Fund 17: This fund is designated for tracking Other Post Employment Benefits (OPEB). Transfers In are the Annual Required Contribution (ARC)
needed in order to meet the total Accrued Liability (AL) per the Actuarial GASB 45 Valuation Report of $516,015. This amount is different each year, as the total AL
has been met in the current year. Transfers in are done to maintain the total AL in projected years. Transfers out are the actual yearly cost for retiree health benefits.
Cafeteria Fund 13 Special Reserve Fund 17

Modoc Joint Unified School District 2014-15 CASH FLOW PROJECTION - CURRENT YEAR Revised: 2/27/15
GENERAL FUND
July August September October November December January February March April May June Accruals Adjustments TOTALBeginning Cash 2,193,150.60 2,942,890.74 3,039,841.41 3,235,592.18 3,078,804.68 2,522,204.73 3,891,220.53 3,483,685.95 3,221,421.36 3,070,295.43 3,130,067.93 2,670,256.01RECEIPTS
LCFFState Aid 483,979.00 568,240.00 483,979.00 483,979.00 0.00 0.00 193,592.00 230,771.00 230,771.00 230,771.00 230,771.00 181,036.00 0.00 0.00 3,317,889.00Education Protection Acct 0.00 0.00 270,523.00 0.00 0.00 270,524.00 0.00 0.00 271,785.00 0.00 0.00 271,784.00 0.00 0.00 1,084,616.00Property Tax 0.00 131,139.82 0.00 -4,959.22 0.00 1,726,128.48 46,502.08 0.00 0.00 446,029.62 0.00 75,232.22 0.00 0.00 2,420,073.00
Federal Rev. 0.00 19,868.53 58,583.08 9,783.26 7,115.00 67,736.34 1,303.65 46,674.95 66,531.00 9,667.44 0.00 95,079.31 33,052.44 0.00 415,395.00State Rev. 0.00 0.00 5,145.09 197.63 72,314.00 0.00 32,650.85 57,383.00 5,590.64 30,000.00 1,947.00 38,758.00 31,602.79 0.00 275,589.00Local Rev. 2,506.15 51,528.57 16,964.86 8,341.33 3,237.80 10,417.83 10,636.01 19,596.56 35,910.87 33,177.43 14,370.49 49,877.95 260.15 0.00 256,826.00Interfund Transfers In 0.00 0.00 0.00 0.00 0.00 0.00 0.00 0.00 0.00 0.00 0.00 69,120.00 0.00 0.00 69,120.00All Other Financing Sources 0.00 0.00 0.00 0.00 0.00 0.00 0.00 0.00 0.00 0.00 0.00 0.00 0.00 0.00 0.00
TOTAL RECEIPTS 486,485.15 770,776.92 835,195.03 497,342.00 82,666.80 2,074,806.65 284,684.59 354,425.51 610,588.51 749,645.49 247,088.49 780,887.48 64,915.38 0.00 7,839,508.00DISBURSEMENTS
Certificated Salaries 39,213.27 268,890.83 276,554.72 278,272.72 275,097.77 306,042.18 271,393.58 267,720.71 294,682.22 281,425.00 282,349.00 309,936.00 0.00 0.00 3,151,578.00Classified Salaries 60,095.83 65,083.55 93,275.33 96,563.18 98,252.45 110,439.04 94,483.73 94,616.87 100,369.02 99,642.00 100,448.00 115,803.00 0.00 0.00 1,129,072.00Employee Benefits 59,353.59 101,236.72 162,672.56 159,198.50 171,844.63 172,320.53 166,195.76 166,396.48 172,836.23 172,836.00 172,836.00 248,956.00 0.00 0.00 1,926,683.00
Subtotal Salaries & Benefits 158,662.69 435,211.10 532,502.61 534,034.40 545,194.85 588,801.75 532,073.07 528,734.06 567,887.47 553,903.00 555,633.00 674,695.00 0.00 0.00 6,207,333.00Books & Supplies 17,857.84 59,830.81 45,306.40 63,204.93 26,115.98 20,395.75 40,283.23 19,966.03 85,700.03 45,690.00 64,525.00 51,100.00 31,414.00 0.00 571,390.00Services 146,008.34 53,141.34 58,415.02 53,305.40 68,169.68 73,049.35 71,988.73 50,039.30 98,220.84 76,574.00 78,780.00 80,600.00 77,057.00 0.00 985,349.00Capital Outlay 37,066.00 0.00 0.00 8,089.68 0.00 23,573.47 30,145.12 5,538.09 0.00 0.00 0.00 118,733.64 0.00 0.00 223,146.00Other Outgo 0.00 0.00 0.00 0.00 0.00 0.00 0.00 12,485.55 0.00 12,500.00 0.00 112,828.45 0.00 0.00 137,814.00Interfund Transfers Out 0.00 0.00 20,000.00 10,000.00 0.00 0.00 15,000.00 0.00 10,000.00 0.00 8,282.00 0.00 0.00 0.00 63,282.00All Other Financing Uses 0.00 0.00 0.00 0.00 0.00 0.00 0.00 0.00 0.00 0.00 0.00 0.00 0.00 0.00 0.00
TOTAL DISBURSEMENTS 359,594.87 548,183.25 656,224.03 668,634.41 639,480.51 705,820.32 689,490.15 616,763.03 761,808.34 688,667.00 707,220.00 1,037,957.09 108,471.00 0.00 8,188,314.00Prior Year Transactions
Investments/Cash not in Treasury -773.78 0.00 0.00 -1,137.14 0.00 0.00 -1,181.89 0.00 0.00 -1,283.00 0.00 -1,000.00 5,375.19 2,549,531.84 2,549,531.22Accounts Receivable 647,144.34 -59,857.35 25,584.47 14,698.74 0.00 0.00 0.00 0.00 0.00 0.00 0.00 0.00 0.00 0.00 627,570.20Other 0.00 0.00 0.00 0.00 0.00 0.00 0.00 0.00 0.00 0.00 0.00 0.00 0.00 0.00 0.00Use Tax (obj. 9502) 0.00 -107.12 -304.85 -943.31 -213.76 -29.47 1,547.13 -72.93 -93.90 -77.01 -319.59 614.81 0.00 0.00 0.00Accounts Payable 23,520.70 65,892.77 0.00 0.00 0.00 0.00 0.00 0.00 0.00 0.00 0.00 0.00 0.00 0.00 89,413.47Deferred Revenues 0.00 0.00 9,109.55 0.00 0.00 0.00 0.00 0.00 0.00 0.00 0.00 0.00 0.00 0.00 9,109.55
Total Prior Year Transactions 622,849.86 -125,643.00 16,779.77 14,504.91 213.76 29.47 -2,729.02 72.93 93.90 -1,205.99 319.59 -1,614.81 5,375.19 2,549,531.84 529,047.18Net Increase/Decrease 749,740.14 96,950.67 195,750.77 -156,787.50 -556,599.95 1,369,015.80 -407,534.58 -262,264.59 -151,125.93 59,772.50 -459,811.92 -258,684.42 -38,180.43 2,549,531.84 180,241.18Ending Cash 2,942,890.74 3,039,841.41 3,235,592.18 3,078,804.68 2,522,204.73 3,891,220.53 3,483,685.95 3,221,421.36 3,070,295.43 3,130,067.93 2,670,256.01 2,411,571.59
Ending Cash, Plus AccrualsEnding Fund Balance 4,922,923.00
REPORT: Projections based on historical, budgeted and estimated revenue allocations and expenditures.

Modoc Joint Unified School District 2015-16 CASH FLOW PROJECTION Revised: 2/27/15
GENERAL FUND
July August September October November December January February March April May June Accruals Adjustments TOTALBeginning Cash 2,411,571.59 2,480,940.18 2,411,999.97 2,545,640.97 2,369,689.97 1,754,516.97 2,983,999.97 2,541,659.97 2,217,701.97 2,208,602.97 2,695,819.97 2,337,968.97
RECEIPTS
LCFFState Aid 480,478.00 480,478.00 480,478.00 480,478.00 0.00 0.00 192,191.00 290,946.00 290,946.00 290,946.00 290,946.00 357,098.00 0.00 0.00 3,634,985.00Education Protection Acct 0.00 0.00 277,944.00 0.00 0.00 277,944.00 0.00 0.00 277,944.00 0.00 0.00 277,944.00 0.00 0.00 1,111,776.00Property Tax 0.00 0.00 0.00 0.00 0.00 1,500,000.00 0.00 0.00 0.00 800,000.00 0.00 70,797.00 0.00 0.00 2,370,797.00
Federal Rev. 0.00 4,600.00 25,000.00 1,500.00 0.00 126,000.00 0.00 3,500.00 77,287.00 4,312.00 8,000.00 66,000.00 30,338.00 0.00 346,537.00State Rev. 0.00 0.00 5,200.00 300.00 27,214.00 0.00 30,477.00 0.00 0.00 27,000.00 1,947.00 35,700.00 30,000.00 0.00 157,838.00Local Rev. 2,500.00 17,520.00 16,900.00 8,300.00 3,200.00 6,900.00 20,600.00 24,125.00 6,029.00 17,865.00 14,000.00 38,425.00 2,200.00 0.00 178,564.00Interfund Transfers In 0.00 0.00 0.00 0.00 0.00 0.00 0.00 0.00 0.00 0.00 0.00 59,974.00 0.00 0.00 59,974.00All Other Financing Sources 0.00 0.00 0.00 0.00 0.00 0.00 0.00 0.00 0.00 0.00 0.00 0.00 0.00 0.00 0.00
TOTAL RECEIPTS 482,978.00 502,598.00 805,522.00 490,578.00 30,414.00 1,910,844.00 243,268.00 318,571.00 652,206.00 1,140,123.00 314,893.00 905,938.00 62,538.00 0.00 7,860,471.00
DISBURSEMENTS
Certificated Salaries 40,687.00 241,148.00 286,771.00 290,773.00 284,157.00 299,120.00 282,431.00 284,076.00 284,510.00 283,635.00 284,763.00 314,439.00 0.00 0.00 3,176,510.00Classified Salaries 60,188.00 66,807.00 97,517.00 98,970.00 99,619.00 110,420.00 99,752.00 99,643.00 103,545.00 99,418.00 100,680.00 112,485.00 0.00 0.00 1,149,044.00Employee Benefits 60,441.00 152,836.00 172,893.00 172,836.00 172,861.00 172,541.00 172,272.00 172,585.00 172,520.00 172,603.00 172,401.00 245,940.00 0.00 0.00 2,012,729.00
Subtotal Salaries & Benefits 161,316.00 460,791.00 557,181.00 562,579.00 556,637.00 582,081.00 554,455.00 556,304.00 560,575.00 555,656.00 557,844.00 672,864.00 0.00 0.00 6,338,283.00Books & Supplies 15,535.00 29,000.00 39,000.00 32,400.00 28,000.00 35,000.00 28,500.00 22,500.00 33,000.00 24,400.00 45,200.00 63,686.00 0.00 0.00 396,221.00Services 160,800.00 73,500.00 60,800.00 55,600.00 61,000.00 54,300.00 61,800.00 63,800.00 57,800.00 72,000.00 69,800.00 72,505.00 27,000.00 0.00 890,705.00Capital Outlay 0.00 40,000.00 0.00 0.00 0.00 0.00 0.00 0.00 0.00 0.00 0.00 0.00 0.00 0.00 40,000.00Other Outgo 0.00 0.00 0.00 0.00 0.00 0.00 0.00 0.00 0.00 0.00 0.00 137,677.00 0.00 0.00 137,677.00Interfund Transfers Out 0.00 0.00 15,000.00 15,000.00 0.00 10,000.00 39,483.00 0.00 10,000.00 0.00 0.00 25,469.00 0.00 0.00 114,952.00All Other Financing Uses 0.00 0.00 0.00 0.00 0.00 0.00 0.00 0.00 0.00 0.00 0.00 0.00 0.00 0.00 0.00
TOTAL DISBURSEMENTS 337,651.00 603,291.00 671,981.00 665,579.00 645,637.00 681,381.00 684,238.00 642,604.00 661,375.00 652,056.00 672,844.00 972,201.00 27,000.00 0.00 7,917,838.00
Prior Year Transactions
Investments/Cash not in Treasury -800.00 0.00 0.00 -1,000.00 0.00 0.00 -1,000.00 0.00 0.00 -1,000.00 0.00 -1,000.00 10,175.19 2,549,531.84 2,554,907.03Accounts Receivable 33,312.59 31,602.79 0.00 0.00 0.00 0.00 0.00 0.00 0.00 0.00 0.00 0.00 0.00 0.00 64,915.38Other 0.00 0.00 0.00 0.00 0.00 0.00 0.00 0.00 0.00 0.00 0.00 0.00 0.00 0.00 0.00Use Tax (obj. 9502) 0.00 -150.00 -100.00 -50.00 -50.00 -20.00 370.00 -75.00 -70.00 -150.00 -100.00 395.00 0.00 0.00 0.00Accounts Payable 108,471.00 0.00 0.00 0.00 0.00 0.00 0.00 0.00 0.00 0.00 0.00 0.00 0.00 0.00 108,471.00Deferred Revenues 0.00 0.00 0.00 0.00 0.00 0.00 0.00 0.00 0.00 0.00 0.00 0.00 0.00 0.00 0.00
Total Prior Year Transactions -75,958.41 31,752.79 100.00 -950.00 50.00 20.00 -1,370.00 75.00 70.00 -850.00 100.00 -1,395.00 10,175.19 2,549,531.84 -43,555.62Net Increase/Decrease 69,368.59 -68,940.21 133,641.00 -175,951.00 -615,173.00 1,229,483.00 -442,340.00 -323,958.00 -9,099.00 487,217.00 -357,851.00 -67,658.00 45,713.19 2,549,531.84 -100,922.62
Ending Cash 2,480,940.18 2,411,999.97 2,545,640.97 2,369,689.97 1,754,516.97 2,983,999.97 2,541,659.97 2,217,701.97 2,208,602.97 2,695,819.97 2,337,968.97 2,270,310.97
Ending Cash, Plus AccrualsEnding Fund Balance 4,865,556.00
REPORT: Projections based on historical, budgeted and estimated revenue allocations and expenditures.

Modoc Joint Unified School District 2016-17 CASH FLOW PROJECTION Revised: 2/27/15
GENERAL FUND
July August September October November December January February March April May June Accruals Adjustments TOTALBeginning Cash 2,270,310.97 2,482,090.97 2,437,696.97 2,632,512.97 2,511,831.97 1,883,847.97 3,027,235.97 2,579,752.97 2,200,527.97 2,130,316.97 2,573,476.97 2,167,966.97
RECEIPTS
LCFFState Aid 545,248.00 545,248.00 545,248.00 545,248.00 0.00 0.00 218,099.00 247,179.00 247,179.00 247,179.00 247,179.00 477,782.00 0.00 0.00 3,865,589.00Education Protection Acct 0.00 0.00 276,349.00 0.00 0.00 276,349.00 0.00 0.00 276,349.00 0.00 0.00 276,348.00 0.00 0.00 1,105,395.00Property Tax 0.00 0.00 0.00 0.00 0.00 1,450,000.00 0.00 0.00 0.00 800,000.00 0.00 72,489.00 0.00 0.00 2,322,489.00
Federal Rev. 0.00 4,600.00 25,000.00 1,500.00 0.00 126,000.00 0.00 3,500.00 77,287.00 4,312.00 8,000.00 66,000.00 30,338.00 0.00 346,537.00State Rev. 0.00 0.00 5,200.00 300.00 27,214.00 0.00 30,477.00 0.00 0.00 27,000.00 1,947.00 35,700.00 30,000.00 0.00 157,838.00Local Rev. 2,500.00 17,520.00 16,900.00 8,300.00 3,200.00 6,900.00 10,600.00 24,125.00 6,029.00 17,865.00 14,000.00 38,425.00 12,200.00 0.00 178,564.00Interfund Transfers In 0.00 0.00 0.00 0.00 0.00 0.00 0.00 0.00 0.00 0.00 0.00 50,034.00 0.00 0.00 50,034.00All Other Financing Sources 0.00 0.00 0.00 0.00 0.00 0.00 0.00 0.00 0.00 0.00 0.00 0.00 0.00 0.00 0.00
TOTAL RECEIPTS 547,748.00 567,368.00 868,697.00 555,348.00 30,414.00 1,859,249.00 259,176.00 274,804.00 606,844.00 1,096,356.00 271,126.00 1,016,778.00 72,538.00 0.00 8,026,446.00
DISBURSEMENTS
Certificated Salaries 43,687.00 252,276.00 291,271.00 294,273.00 289,218.00 304,620.00 287,931.00 289,576.00 288,010.00 287,925.00 289,263.00 318,884.00 0.00 0.00 3,236,934.00Classified Salaries 61,188.00 68,700.00 98,517.00 99,970.00 100,619.00 114,420.00 100,752.00 100,643.00 108,545.00 100,418.00 100,680.00 114,211.00 0.00 0.00 1,168,663.00Employee Benefits 64,927.00 177,836.00 177,893.00 177,836.00 177,861.00 177,541.00 177,272.00 177,585.00 177,520.00 177,603.00 177,793.00 260,706.00 0.00 0.00 2,102,373.00
Subtotal Salaries & Benefits 169,802.00 498,812.00 567,681.00 572,079.00 567,698.00 596,581.00 565,955.00 567,804.00 574,075.00 565,946.00 567,736.00 693,801.00 0.00 0.00 6,507,970.00Books & Supplies 9,104.00 29,600.00 40,000.00 32,400.00 29,250.00 35,000.00 28,500.00 22,500.00 35,250.00 24,400.00 45,200.00 65,217.00 0.00 0.00 396,421.00Services 161,800.00 73,500.00 51,300.00 55,600.00 61,500.00 74,300.00 61,800.00 63,800.00 57,800.00 62,000.00 63,800.00 71,773.00 27,000.00 0.00 885,973.00Capital Outlay 0.00 40,000.00 0.00 0.00 0.00 0.00 0.00 0.00 0.00 0.00 0.00 0.00 0.00 0.00 40,000.00Other Outgo 0.00 0.00 0.00 0.00 0.00 0.00 0.00 0.00 0.00 0.00 0.00 280,378.00 0.00 0.00 280,378.00Interfund Transfers Out 0.00 0.00 15,000.00 15,000.00 0.00 10,000.00 49,034.00 0.00 10,000.00 0.00 0.00 31,962.00 0.00 0.00 130,996.00All Other Financing Uses 0.00 0.00 0.00 0.00 0.00 0.00 0.00 0.00 0.00 0.00 0.00 0.00 0.00 0.00 0.00
TOTAL DISBURSEMENTS 340,706.00 641,912.00 673,981.00 675,079.00 658,448.00 715,881.00 705,289.00 654,104.00 677,125.00 652,346.00 676,736.00 1,143,131.00 27,000.00 0.00 8,241,738.00
Prior Year Transactions
Investments/Cash not in Treasury -800.00 0.00 0.00 -1,000.00 0.00 0.00 -1,000.00 0.00 0.00 -1,000.00 0.00 -1,000.00 14,975.19 2,549,531.84 2,559,707.03Accounts Receivable 32,538.00 30,000.00 0.00 0.00 0.00 0.00 0.00 0.00 0.00 0.00 0.00 0.00 0.00 0.00 62,538.00Other 0.00 0.00 0.00 0.00 0.00 0.00 0.00 0.00 0.00 0.00 0.00 0.00 0.00 0.00 0.00Use Tax (obj. 9502) 0.00 -150.00 -100.00 -50.00 -50.00 -20.00 370.00 -75.00 -70.00 -150.00 -100.00 395.00 0.00 0.00 0.00Accounts Payable 27,000.00 0.00 0.00 0.00 0.00 0.00 0.00 0.00 0.00 0.00 0.00 0.00 0.00 0.00 27,000.00Deferred Revenues 0.00 0.00 0.00 0.00 0.00 0.00 0.00 0.00 0.00 0.00 0.00 0.00 0.00 0.00 0.00
Total Prior Year Transactions 4,738.00 30,150.00 100.00 -950.00 50.00 20.00 -1,370.00 75.00 70.00 -850.00 100.00 -1,395.00 14,975.19 2,549,531.84 35,538.00Net Increase/Decrease 211,780.00 -44,394.00 194,816.00 -120,681.00 -627,984.00 1,143,388.00 -447,483.00 -379,225.00 -70,211.00 443,160.00 -405,510.00 -127,748.00 60,513.19 2,549,531.84 -179,754.00
Ending Cash 2,482,090.97 2,437,696.97 2,632,512.97 2,511,831.97 1,883,847.97 3,027,235.97 2,579,752.97 2,200,527.97 2,130,316.97 2,573,476.97 2,167,966.97 2,040,218.97
Ending Cash, Plus AccrualsEnding Fund Balance 4,650,264.00
REPORT: Projections based on historical, budgeted and estimated revenue allocations and expenditures.

FORM # PAGES
C I District Certification of Interim Report 1-3
FUNDS01 I General Fund 4-2813 I Cafeteria Fund 29-3517 I Special Reserve Fund for Other Than Capital Outlay 36-3935 I County School Facilities Fund (Building Fund) 40-4640 I Special Reserve Fund for Capital Outlay 47-53
SUPPLEMENTAL FORMS
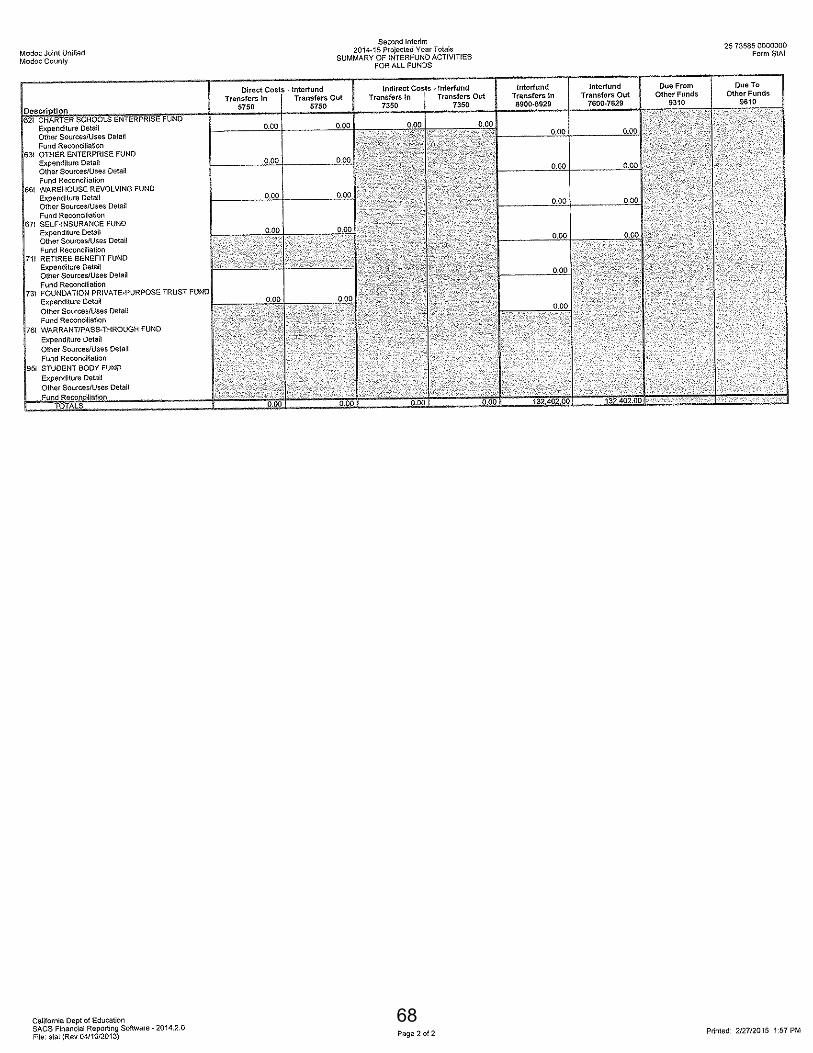
A I Average Daily Attendance 54CASH Cash Flow Worksheet, 2 years 55-58MYP I Multi-year Projections; General Fund 59-64MYP IO Multi-year Projections; Other Funds 65-66SIA I Summary of Interfund Activities 67-68CS I Criteria and Standards 69-94
MODOC JOINT UNIFIED SCHOOL DISTRICTSECOND INTERIM REPORT
2014-15
TABLE OF CONTENTS
1
2

3

4

5

6

7

8

9

10

11

12

13

14

15

16

17

18

19

20

21

22

23

24

25

26

27

28

29

30

31

32

33

34

35

36

37

38

39

40

41

42

43

44

45

46

47

48

49

50

51

52
53

54

55

56

57

58

59

60

61

62

63

64

65

66

67
68

69

70
71

72

73

74

75

76
77
78

79

80

81

82

83

84

85

86

87

88

89

90

91

92

93

94