1. infrastructure connectivity and regional integration in
TRANSCRIPT

17
1Infrastructure connectivity
and regional integration in Asia and the Pacific:
Evidence from a new index of economic integration
Cyn-Young Park and Racquel Claveria
IntroductionRegional integration, especially through open trade and investment regimes, has been a prominent driver of economic growth that has lifted more than a billion people out of poverty in Asia and the Pacific. During the period 1990–2018, Asia’s trade volume growth averaged 7.3 per cent annually—higher than the world average of 4.7 per cent. With that robust economic expansion, real per capita gross domestic product (GDP) (in constant 2010 dollar terms) more than doubled, from $2,807 to $6,557 over the same period.
In this process, the development of an export-oriented manufacturing industry helped attract foreign direct investment (FDI) and contributed to the creation and expansion of regional value chains across many economies in the region. Along with acceleration of trade and investment liberalisation, the private-sector-driven vertical integration of production systems across these economies has provided considerable impetus to deepen regional economic integration (ADB 2006). The intraregional

NEW DIMENSIONS OF CONNECTIVITY IN THE ASIA-PACIFIC
18
share of Asia’s total trade steadily increased from just under 50 per cent in 1990 to nearly 60 per cent in 2018. In addition, the intraregional share of total inward FDI to Asia increased from 41 per cent in 2001 to 48 per cent in 2018.
The remarkable success of the region’s high-performing economies over the past several decades demonstrates how trade and participation in global value chains can drive industrialisation and economic growth. However, the level of regional integration varies widely across Asian economies, with geographically remote and low-income developing economies often struggling to access international markets and participate in global and regional value chains.
Many studies have investigated the trade openness and economic growth nexus for the economic benefits of regional integration. Earlier literature shows that cross-border trade and investment promote information flows and technology transfers, increasing the stock of knowledge capital and lifting both levels and growth rates of long-run outputs (Romer 1990; Grossman and Helpman 1990, 1991; Rivera-Batiz and Romer 1991). Later studies further extend the endogenous growth models to embody the scale economies and spillover effects of economic integration on productivity and growth through better competition, financial intermediation, labour mobility and human capital development, among others.
Recent research has highlighted the importance of infrastructure and seamless connectivity in promoting regional economic integration (UNESCAP 2017). This study suggested that regional economic cooperation and integration can support the attainment of the UN Sustainable Development Goals (SDGs), by ensuring that infrastructure projects have favourable social and environmental, as well as economic, impacts. Ensuring infrastructure projects connect small, low-income and geographically distant countries with the main markets of the region and placing a high priority on dealing with transboundary vulnerabilities and risks can help achieve the UN 2030 Agenda for Sustainable Development. An earlier ADB – Asian Development Bank Institute (2009) study estimated that the expected benefits of regional infrastructure projects for pan-Asian connectivity could be worth as much as US$13 trillion for developing countries in Asia during 2010–20 and beyond if the required investment was made.
19
1. INFRASTRUCTURE CONNECTIVITY AND REGIONAL INTEGRATION IN ASIA AND THE PACIFIC
In this context, many regional and subregional integration initiatives have placed strong emphasis on building and strengthening infrastructure connectivity to boost regional trade and economic integration (ADB 2017b). Indeed, it is often noted that geographic and institutional barriers significantly constrain the expansion of regional trade and access to international markets (ADB 2017a). Having extensive and efficient transportation networks can therefore help connect businesses and people and create business opportunities and jobs. Better transport and energy connectivity will also reduce the costs of doing business. Countries with geographical disadvantages, particularly those landlocked or sea-locked, have often found it difficult to engage in international trade due to poor connectivity. Moreover, small economies facing significant capacity constraints may not be able to design and implement the public investments and policy reforms that support regional trade and economic integration without support from neighbouring economies and donor communities.
This chapter aims to establish the link between various elements of regional integration—including infrastructure and connectivity—and economic growth, using rigorous empirical methodologies to show how different elements of regional integration contribute to economic growth and poverty reduction. In particular, the chapter looks at how infrastructure and connectivity, among other elements, can catalyse regional integration by facilitating regional trade and investment, strengthening regional value chains and promoting the movement of people.
Section two surveys the link between infrastructure connectivity and regional integration in Asia using both hard and soft infrastructure indicators. Section three employs a composite indicator approach, through the Asia-Pacific Regional Cooperation and Integration Index (ARCII), to gauge the contribution of infrastructure connectivity to regional integration. Section four empirically explores the impact of regional integration (as well as its components, including infrastructure connectivity) on economic growth, inequality and poverty reduction. Section five concludes and offers policy prescriptions.

NEW DIMENSIONS OF CONNECTIVITY IN THE ASIA-PACIFIC
20
Infrastructure connectivity and regional integrationInfrastructure connectivity is the backbone of trade and cross-border economic activities. Economic integration depends critically on the development of infrastructure that will strengthen connectivity both within and between countries and regions, freeing up the flow of goods and services, investment, people and ideas, as well as contributing to more efficient usage across borders of resources such as labour, land and energy (UNESCAP 2012).
Infrastructure covers a wide range of facilities and systems serving economic areas and functions, including both ‘hard’ and ‘soft’ infrastructure. Soft infrastructure includes legal, regulatory, procedural and other supporting policy frameworks, as well as human and institutional capacities; hard infrastructure relates to physical networks, such as roads, railways and ports. The extensiveness and quality of such hard infrastructure are essential for physical connectivity and reducing transport and trade costs. But its effective contribution to regional integration depends crucially on the efficiency of the associated soft infrastructure such as laws, policies, taxes and governance. For example, lengthy customs clearance times, inefficient administrative systems, high logistics costs and other barriers continue to hamper the free flow of goods and services in many developing countries in the region. The availability of information and communication technology and internet access has also emerged as an important enabling factor for digital connectivity, which has been particularly important for international businesses and trade in recent years.
Adequate quality infrastructure remains critical for regional economic integration. Despite many regional and subregional initiatives aimed at promoting seamless connectivity in Asia, the gap between supply and demand for high-quality infrastructure is significant and continues to widen. For example, between 2016 and 2030, Asia will need to invest more than US$1.7 trillion per year to maintain its strong growth momentum, continue to fight poverty and address climate change impacts, according to the Asian Development Bank (ADB 2017c). The ADB report also estimated the infrastructure financing gap would reach US$459 billion per year in 2016–20 (about 2.4 per cent of projected GDP for 25 developing countries).

21
1. INFRASTRUCTURE CONNECTIVITY AND REGIONAL INTEGRATION IN ASIA AND THE PACIFIC
4.0
5.1
3.8
4.6
4.6
4.2
1 2 3 4 5 6 7
Central Asia
East Asia
South Asia
Southeast Asia
Asia
World
Overall infrastructure quality
4.0
5.1
3.7
4.5
4.5
4.1
1 2 3 4 5 6 7
Central Asia
East Asia
South Asia
Southeast Asia
Asia
World
Quality of road infrastructure
4.0
5.2
3.8
4.1
4.4
3.6
1 2 3 4 5 6 7
Central Asia
East Asia
South Asia
Southeast Asia
Asia
World
Efficiency of train services
4.4
5.3
4.0
4.9
4.8
4.5
1 2 3 4 5 6 7
Central Asia
East Asia
South Asia
Southeast Asia
Asia
World
Efficiency of air transport services
2.9
4.7
3.6
4.3
4.1
4.0
1 2 3 4 5 6 7
Central Asia
East Asia
South Asia
Southeast Asia
Asia
World
Efficiency of seaport services
4.7
5.6
3.7
5.1
5.1
4.8
1 2 3 4 5 6 7
Central Asia
East Asia
South Asia
Southeast Asia
Asia
World
Reliability of water supply
Figure 1.1 Quality of infrastructure in Asia, 2019Notes: Scores range from 1 (extremely poor, inefficient and unreliable, among the worst in the world) to 7 (extremely good, efficient and reliable, among the best in the world) . The Global Competitiveness Report 2019 covered 141 economies .Source: WEF (2019) .
Despite rapid overall growth and significant improvements in transportation networks, electricity-generation capacity and water supply, the quality of infrastructure varies widely across countries and subregions in Asia (Figure 1.1). Remote, landlocked and mountainous countries are often at great disadvantage due to high trade and transport costs, with likely significant impacts on socioeconomic development.
The provision of a broad range of infrastructure services is also important for strengthening connectivity. Basic infrastructure services include business, financial and freight services, along with information and communication technology. These services indirectly benefit other economic sectors by making transactions more efficient.

NEW DIMENSIONS OF CONNECTIVITY IN THE ASIA-PACIFIC
22
050
100150200250300350400450
1995
1996
1997
1998
1999
2000
2001
2002
2003
2004
2005
2006
2007
2008
2009
2010
2011
2012
2013
2014
2015
2016
2017
Central Asia East Asia Southeast Asia South Asia Pacific
%
Figure 1.2 Trade costs of Asia and Pacific subregions with large developed economies, 1995–2017Note: Trade costs shown are tariff equivalents, calculated as trade-weighted average trade costs of countries in each subregion compared with the three largest developed economies (Germany, Japan and the United States) .Source: UNESCAP (2019) .
Strong regional infrastructure and seamless connectivity are essential for reducing trade costs, which is the key to accelerating the economic integration of developing countries into the global economy. While Asian and Pacific economies have made progress in reducing trade costs, significant room for improvement remains (ADB 2017a). Figure 1.2 presents the trend of trade costs across the Asia and Pacific subregions. While the levels have generally come down, they vary significantly by region. Trade costs are lowest in East Asia and highest among the Pacific Island developing economies, followed by the Central, West and South Asian economies.
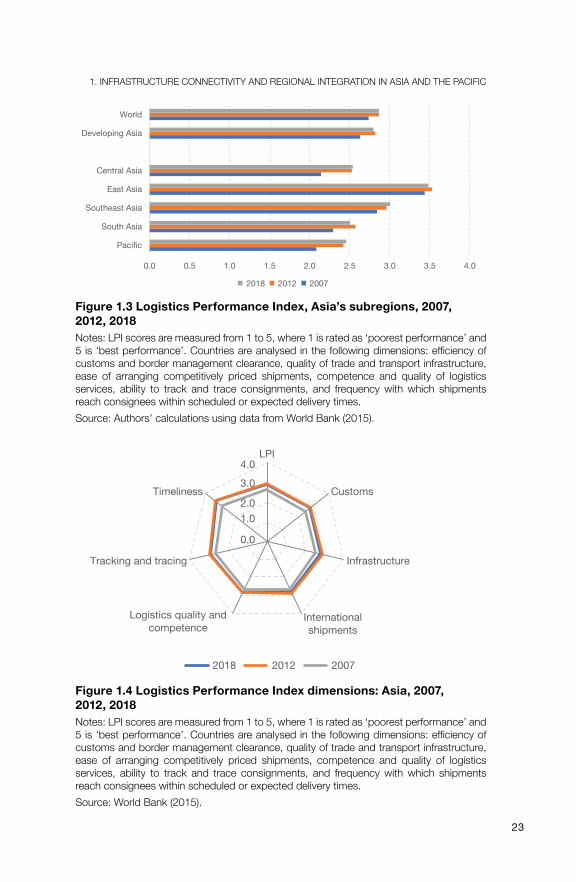
Figure 1.3 shows the Logistics Performance Index (LPI) scores across subregions in Asia and the Pacific between 2007 and 2018. Across the subregions, LPI scores have climbed, and East Asia performs comparatively better than the other regions. Among the LPI subdimensions, timeliness is relatively higher (Figure 1.4).
23
1. INFRASTRUCTURE CONNECTIVITY AND REGIONAL INTEGRATION IN ASIA AND THE PACIFIC
0.0 0.5 1.0 1.5 2.0 2.5 3.0 3.5 4.0
Pacific
South Asia
Southeast Asia
East Asia
Central Asia
Developing Asia
World
2018 2012 2007
Figure 1.3 Logistics Performance Index, Asia’s subregions, 2007, 2012, 2018Notes: LPI scores are measured from 1 to 5, where 1 is rated as ‘poorest performance’ and 5 is ‘best performance’ . Countries are analysed in the following dimensions: efficiency of customs and border management clearance, quality of trade and transport infrastructure, ease of arranging competitively priced shipments, competence and quality of logistics services, ability to track and trace consignments, and frequency with which shipments reach consignees within scheduled or expected delivery times .Source: Authors’ calculations using data from World Bank (2015) .
0.0
1.02.0
3.04.0
LPI
Customs
Infrastructure
Internationalshipments
Logistics quality andcompetence
Tracking and tracing
Timeliness
2018 2012 2007
Figure 1.4 Logistics Performance Index dimensions: Asia, 2007, 2012, 2018Notes: LPI scores are measured from 1 to 5, where 1 is rated as ‘poorest performance’ and 5 is ‘best performance’ . Countries are analysed in the following dimensions: efficiency of customs and border management clearance, quality of trade and transport infrastructure, ease of arranging competitively priced shipments, competence and quality of logistics services, ability to track and trace consignments, and frequency with which shipments reach consignees within scheduled or expected delivery times . Source: World Bank (2015) .

NEW DIMENSIONS OF CONNECTIVITY IN THE ASIA-PACIFIC
24
0 20 40 60 80 100
The PacificCentral Asia
OceaniaSouth Asia
Southeast AsiaEast Asia
AfricaMiddle East
Latin AmericaAsia and the Pacific
North AmericaEU-28
Figure 1.5 Distance to ‘best-performer frontier’ in trading across borders by region, 2019EU-28 = European Union member countriesNotes: 100 represents the ‘best-practice’ frontier . For example, a score of 75 means an economy is 25 percentage points away from the frontier constructed from the global best performance . The figure may change from year to year .Source: ADB calculations using data from World Bank (2020) .
Figure 1.5 presents the distance to best-performer frontier in trading across borders. The distance-to-frontier scores show improved regulatory environments for cross-border trade, especially by reducing the overall cost and complexity of compliance with border and documentary requirements. In 2019, Asia and the Pacific were 15 per cent of the way to the global ‘best-practice frontier’ and surpassed the performance of Latin America and the Middle East.1 The European Union (EU) and North America remain the best performance ‘frontiers’ in trading across borders. East and Southeast Asia are the best regional performers.
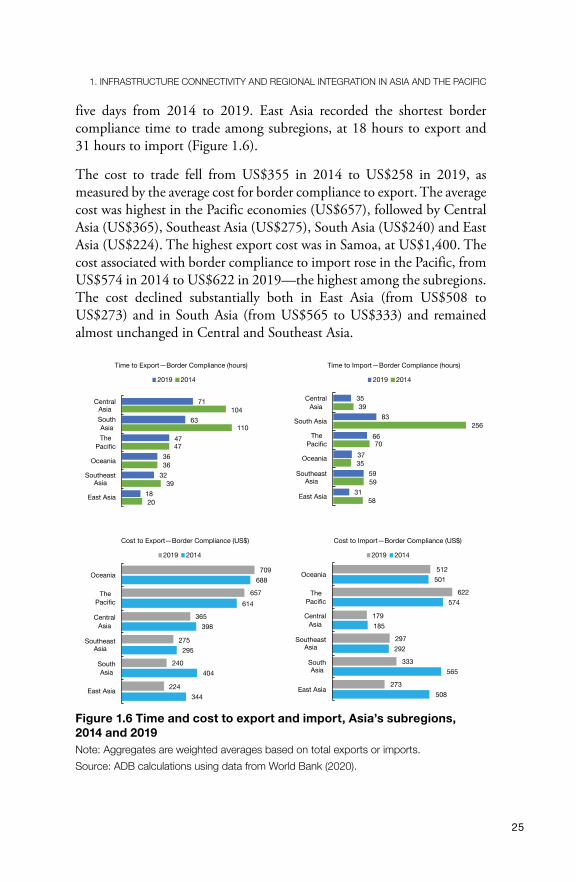
The time and cost associated with exporting and importing goods (that is, the trading across borders indicators) have generally improved over time (Figure 1.6). The time to trade decreased across Asia and the Pacific—most notably, in South Asia—through improvements in border and documentary compliance time, but it was still more than 20 times as long as in North America in 2019. The average border compliance time in South Asia remains about three days for exports and imports, but this subregion improved the most, with an average reduction of almost
1 The distance-to-frontier score measures how far, on average, an economy is at a point in time from the best performance (the ‘frontier’) and assesses the absolute change in the economy’s regulatory environment over time (World Bank 2020).
25
1. INFRASTRUCTURE CONNECTIVITY AND REGIONAL INTEGRATION IN ASIA AND THE PACIFIC
five days from 2014 to 2019. East Asia recorded the shortest border compliance time to trade among subregions, at 18 hours to export and 31 hours to import (Figure 1.6).
The cost to trade fell from US$355 in 2014 to US$258 in 2019, as measured by the average cost for border compliance to export. The average cost was highest in the Pacific economies (US$657), followed by Central Asia (US$365), Southeast Asia (US$275), South Asia (US$240) and East Asia (US$224). The highest export cost was in Samoa, at US$1,400. The cost associated with border compliance to import rose in the Pacific, from US$574 in 2014 to US$622 in 2019—the highest among the subregions. The cost declined substantially both in East Asia (from US$508 to US$273) and in South Asia (from US$565 to US$333) and remained almost unchanged in Central and Southeast Asia.
20
39
36
47
110
104
18
32
36
47
63
71
East Asia
SoutheastAsia
Oceania
ThePacific
SouthAsia
CentralAsia
Time to Export—Border Compliance (hours)
2019 2014
58
59
35
70
256
39
31
59
37
66
83
35
East Asia
SoutheastAsia
Oceania
ThePacific
South Asia
CentralAsia
Time to Import—Border Compliance (hours)
2019 2014
344
404
295
398
614
688
224
240
275
365
657
709
East Asia
SouthAsia
SoutheastAsia
CentralAsia
ThePacific
Oceania
Cost to Export—Border Compliance (US$)
2019 2014
508
565
292
185
574
501
273
333
297
179
622
512
East Asia
SouthAsia
SoutheastAsia
CentralAsia
ThePacific
Oceania
Cost to Import—Border Compliance (US$)
2019 2014
Figure 1.6 Time and cost to export and import, Asia’s subregions, 2014 and 2019Note: Aggregates are weighted averages based on total exports or imports .Source: ADB calculations using data from World Bank (2020) .

NEW DIMENSIONS OF CONNECTIVITY IN THE ASIA-PACIFIC
26
Reforms for better regulatory and institutional systems have been key to reducing the complexities of cross-border trade and related trade costs. Innovations in trade facilitation such as electronic submission and processing of documentation play a crucial role in reducing trade costs. In Georgia, for example, the introduction of electronic submission and processing in 2005 has since reduced the processing time for export documents from 48 hours to two hours. A customs union or trade agreement among major trading partners can also cut time and costs to trade. For instance, the Kyrgyz Republic reduced export time by 10 hours and cost by $85 after joining the Eurasian Economic Union in 2015. Domestic reforms to reduce trade documentation requirements also reduce administrative burdens and trade costs. In Kazakhstan, for example, the time for export documentation compliance fell substantially when the country removed two documentation requirements for customs clearance.
However, room still exists to lower trade costs. For example, policy measures can support the building of more efficient trade infrastructure, enhance trade facilitation, lower or streamline nontariff barriers, accelerate regulatory reforms to meet international standards and harmonisation, open up services trade and expand trade capacity. Improving the business climate to enhance competition and maximising the complementarity between trade and investment can also boost trade and trade integration in the region.
A multidimensional index of regional economic integrationEmpirical evidence of the growth impact of regional integration has been elusive (Park and Claveria 2018b). Some studies look at participation in trading blocs, the share of intraregional trade in total trade and the reduction or elimination of tariffs as measures of regional integration to establish the statistical link between regional integration and growth. Yet, while some findings point to significantly positive relationships, others are inconclusive.
In addition, past studies often employed trade-focused measures of regional integration, which were often criticised for their limited scope of regional integration. Indeed, regional integration is a multidimensional process extending beyond efforts to liberalise trade. Appropriate measures should cover various facets, such as promoting trade and investment, facilitating the movement of capital across borders, building and developing regional

27
1. INFRASTRUCTURE CONNECTIVITY AND REGIONAL INTEGRATION IN ASIA AND THE PACIFIC
value chains, enhancing infrastructure and connectivity, improving people’s mobility, and providing the legal and institutional bases for international policy cooperation. In this context, the ADB (2017b) introduced the Asia-Pacific Regional Cooperation and Integration Index (ARCII) as a comprehensive measure of regional integration, which departs from the typical trade-focused metrics. This chapter uses the ARCII to gauge the progress of regional integration, assess its main drivers and determine its impact on economic growth and poverty reduction.
The ARCII combines 26 indicators, categorised into six regional cooperation and integration dimensions: 1) trade and investment, 2) money and finance, 3) regional value chains, 4) infrastructure connectivity, 5) movement of people, and 6) institutional and social integration.2 The latest ARCII estimates indicate that the pace of regional integration in Asia was broadly steady during 2006–17 (Figure 1.7).
Key regional integration trendsAcross subregions, East and Southeast Asia appear to be the most integrated with Asia. Central and South Asia scored below the average for regional integration (Figure 1.7).
0.20
0.25
0.30
0.35
0.40
0.45
0.50
0.55
0.60
0.65
2006 2007 2008 2009 2010 2011 2012 2013 2014 2015 2016 2017
Central Asia East Asia Southeast Asia South Asia Asia
Figure 1.7 Asia-Pacific Regional Cooperation and Integration Index: Asia and Asia’s subregions, 2006–17Sources: Authors’ calculations using the methodologies of Huh and Park (2018) and Park and Claveria (2018a) .
2 Appendix Table 1.1 lists the ARCII dimensions and indicators. See Huh and Park (2018) and Park and Claveria (2018a) for detailed discussion of ARCII, and Asia Regional Integration Center (2015) for the ARCII database, methodology and other related resources.

NEW DIMENSIONS OF CONNECTIVITY IN THE ASIA-PACIFIC
28
Across dimensions, the performance of Asian subregions varies (Figure 1.8). For example, East Asia scored highest in the dimensions of money and finance, infrastructure and connectivity, regional value chains, and institutional and social integration. Southeast Asia outperformed other subregions in trade and investment and the movement of people. South and Central Asia trailed the other subregions on most dimensions.
0.00.20.40.60.8
Trade andInvestment
Money and Finance
Regional ValueChain
InfrastructureConnectivity
Movement of People
Institutional andSocial Integration
Central Asia East Asia Southeast Asia South Asia
Figure 1.8 Dimensional subindexes to the Asia-Pacific Regional Cooperation and Integration Index: Asia’s subregions, 2017Sources: Authors’ calculations using the methodologies of Huh and Park (2018) and Park and Claveria (2018a) .
0.0
0.1
0.2
0.3
0.4
0.5
0.6
2006 2017 2006 2017 2006 2017 2006 2017 2006 2017
Asia Central Asia East Asia Southeast Asia South Asia
Trade and Investment Money and Finance
Regional Value Chain Infrastructure ConnectivityMovement of People Institutional and Social Integration
Figure 1.9 Dimensional contributions to the Asia-Pacific Regional Cooperation and Integration Index: Asia and Asia’s subregions, 2006 versus 2017Source: Authors’ calculations .

29
1. INFRASTRUCTURE CONNECTIVITY AND REGIONAL INTEGRATION IN ASIA AND THE PACIFIC
Meanwhile, among the six dimensions, infrastructure connectivity contributes the most to the overall integration index (Figure 1.9). Hence, it appears to be the most forceful and stable foundation for regional integration in Asia. Moreover, the contribution of infrastructure connectivity to regional integration has increased over the years across Asia’s subregions.
Regional integration and inclusive growth: An empirical exerciseFrom the perspective of multilateral organisations (such as the ADB and the United Nations), regional integration is not only an end in itself, but also a means to achieve the overarching objectives of economic growth and poverty reduction. To gauge the impact of regional integration and its components in promoting growth and reducing poverty, Park and Claveria (2018b) utilised the ARCII to estimate the growth, inequality and poverty impacts of regional integration.
Park and Claveria (2018b) constructed an unbalanced panel dataset for 156 countries for 2006–16 to run separate regressions for growth, inequality and poverty that included the regional integration index as another explanatory variable, in addition to other control variables.3 In all regressions, indicators for both trade and financial openness were included to control the country-specific economic openness regardless of regional preference.4
3 Corresponding regional integration indexes (similar to the composition of ARCII) were constructed for the European Union, Latin America and Africa. Meanwhile, Appendix Table 1.2 presents the variables employed in the growth, inequality and poverty regressions. The control variables are listed in Appendix Table 1.3.4 It is important to recall that ARCII measures a regional bias in economic integration relative to integration with the world. That is, the index may be higher for some countries that have just begun regional rather than global economic integration, while it may be lower for some countries that are very open and integrated with the world but not necessarily inclined towards integration—that is, only regionally oriented. Hence, to control for such an open-integration component in the regional integration index, financial and trade openness variables are included in all the equations. See Park and Claveria (2018b) for full discussion of the theoretical bases and specifications of the regression equations.
NEW DIMENSIONS OF CONNECTIVITY IN THE ASIA-PACIFIC
30
Correlation analysis for the full sample indicates significantly positive associations among the dimensional indexes (Table 1.1). Indeed, this reaffirms mutually reinforcing and interrelated components of regional integration across dimensional indexes. For instance, infrastructure helps to link markets and resources. This sets the stage for corresponding benefits in terms of economies of scale and greater competition. However, benefits from improved physical connectivity may be constrained if the volume of trade and investment flow is small. Therefore, integration of trade and investment is important in maximising the benefits of cross-border and physical connectivity. Moreover, as more economies are physically connected, there is greater cross-border trade and investment. Labour mobility across borders grows. Monetary and financial transactions increase through formal and informal channels. However, stronger monetary and financial links mean that a country’s financial instability may be transmitted to its neighbours. Greater monetary and financial cooperation and integration are therefore essential in maintaining macroeconomic and financial stability and preventing financial crises (ADB 2006).
Park and Claveria (2018b) employed the generalised method of moments (GMM) estimation and found that infrastructure connectivity was significantly and robustly associated with higher growth and lower inequality and poverty.5 In particular, infrastructure connectivity—along with dimensions of the regional value chain and institutional and social integration—is a significant driver of economic growth (Table 1.2). Throughout a series of robustness tests, infrastructure and connectivity and institutional and social integration continue to show significant and positive impacts on growth. The results also indicate that infrastructure and connectivity lead to improved income distribution through an inequality-reducing effect that is stronger at low-income levels (Table 1.3).
5 As is typical in the empirical literature, GMM was utilised as the estimation procedure to address the econometric issues inherent in growth, inequality and poverty regressions. These include the observed heterogeneity across countries, persistence of the dependent variable, potential endogeneity and long lagged effects of the regressors on the dependent variable (particularly in the case of economic growth). Full GMM estimation results are available on request.

31
1. INFRASTRUCTURE CONNECTIVITY AND REGIONAL INTEGRATION IN ASIA AND THE PACIFICTa
ble
1.1
Pairw
ise
Pear
son
corr
elat
ion
coef
ficie
nts
of A
RC
II di
men
sion
al in
dexe
s, 2
006–
16Tr
ade
and
inve
stm
ent
Mon
ey a
nd
finan
ceR
egio
nal
valu
e ch
ain
Infr
astr
uctu
re
conn
ectiv
ityM
ovem
ent
of p
eopl
eIn
stitu
tiona
l and
so
cial
inte
grat
ion
Trad
e an
d in
vest
men
t1
Mon
ey a
nd fi
nanc
e0 .
520*
**1
Regi
onal
valu
e ch
ain0 .
110*
**0 .
406*
**1
Infra
stru
ctur
e co
nnec
tivity
0 .18
9***
0 .26
5***
0 .32
3***
1M
ovem
ent o
f peo
ple
0 .48
5***
0 .49
7***
0 .27
6***
0 .28
7***
1In
stitu
tiona
l and
soc
ial in
tegr
atio
n0 .
237*
**0 .
528*
**0 .
756*
**0 .
474*
**0 .
431*
** 1
*** s
igni
fican
t at t
he 1
per
cen
t lev
elNo
te: F
igur
es in
dica
te P
ears
on c
orre
latio
n co
effic
ients
.So
urce
: Aut
hors
’ calc
ulat
ions
.
Tabl
e 1.
2 G
ener
alis
ed m
etho
d of
mom
ents
est
imat
ion
resu
lts: G
row
th re
gres
sion
sD
epen
dent
var
iabl
e: L
og(re
al G
DP
per c
apita
)Ba
selin
eBa
selin
e w
ith fi
nanc
ial
open
ness
Base
line
with
fina
ncia
l and
tr
ade
open
ness
Log(
infra
stru
ctur
e co
nnec
tivity
)1 .
079*
*1 .
274*
*1 .
640*
**(0
.468
)(0
.509
)(0
.549
)Lo
g(in
stitu
tiona
l and
soc
ial in
tegr
atio
n)0 .
501*
**0 .
576*
**0 .
642*
**(0
.139
)(0
.153
)(0
.169
)W
ith c
ontro
l var
iables
Yes
Yes
Yes
*** s
igni
fican
t at t
he 1
per
cen
t lev
el**
signi
fican
t at t
he 5
per
cen
t lev
elNo
tes:
Tab
le in
dica
tes
sum
mar
y of
resu
lts w
hen
the
dim
ensio
nal s
ubin
dexe
s en
ter t
he g
row
th re
gres
sions
sep
arat
ely . F
or b
revit
y, di
men
siona
l sub
inde
xes
with
sig
nific
ant c
oeffic
ients
are
sho
wn .
Win
dmeij
er ro
bust
sta
ndar
d er
rors
are
in p
aren
thes
es .
Sour
ce: A
utho
rs’ c
alcul
atio
ns u
sing
revis
ed e
stim
atio
ns in
Par
k an
d Cl
aver
ia (2
018b
) .
NEW DIMENSIONS OF CONNECTIVITY IN THE ASIA-PACIFIC
32
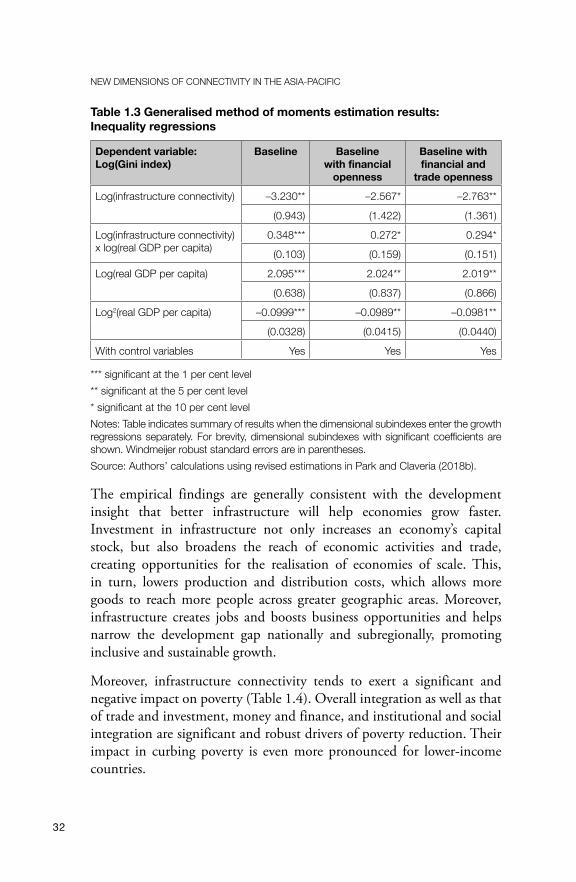
Table 1.3 Generalised method of moments estimation results: Inequality regressions
Dependent variable: Log(Gini index)
Baseline Baseline with financial
openness
Baseline with financial and
trade openness
Log(infrastructure connectivity) –3 .230** –2 .567* –2 .763**
(0 .943) (1 .422) (1 .361)
Log(infrastructure connectivity) x log(real GDP per capita)
0 .348*** 0 .272* 0 .294*
(0 .103) (0 .159) (0 .151)
Log(real GDP per capita) 2 .095*** 2 .024** 2 .019**
(0 .638) (0 .837) (0 .866)
Log2(real GDP per capita) –0 .0999*** –0 .0989** –0 .0981**
(0 .0328) (0 .0415) (0 .0440)
With control variables Yes Yes Yes
*** significant at the 1 per cent level** significant at the 5 per cent level* significant at the 10 per cent level Notes: Table indicates summary of results when the dimensional subindexes enter the growth regressions separately . For brevity, dimensional subindexes with significant coefficients are shown . Windmeijer robust standard errors are in parentheses . Source: Authors’ calculations using revised estimations in Park and Claveria (2018b) .
The empirical findings are generally consistent with the development insight that better infrastructure will help economies grow faster. Investment in infrastructure not only increases an economy’s capital stock, but also broadens the reach of economic activities and trade, creating opportunities for the realisation of economies of scale. This, in turn, lowers production and distribution costs, which allows more goods to reach more people across greater geographic areas. Moreover, infrastructure creates jobs and boosts business opportunities and helps narrow the development gap nationally and subregionally, promoting inclusive and sustainable growth.
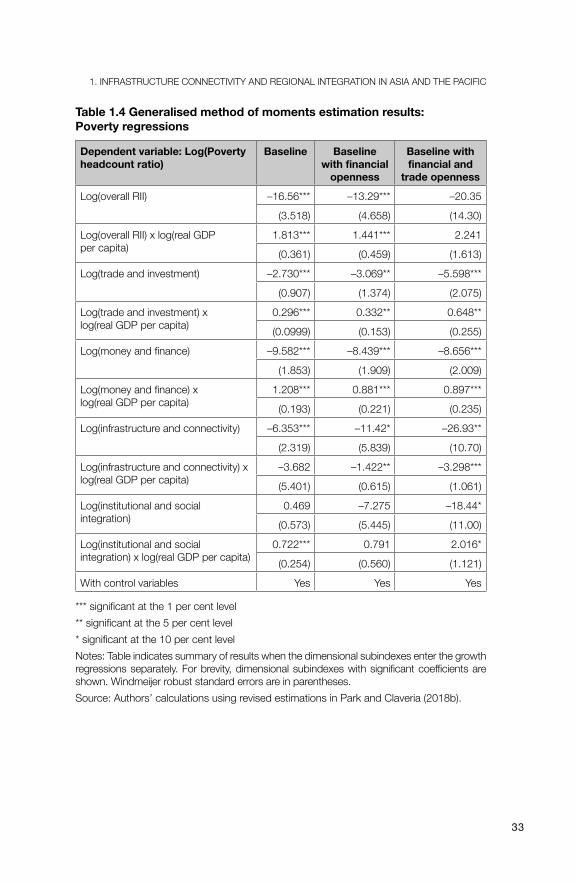
Moreover, infrastructure connectivity tends to exert a significant and negative impact on poverty (Table 1.4). Overall integration as well as that of trade and investment, money and finance, and institutional and social integration are significant and robust drivers of poverty reduction. Their impact in curbing poverty is even more pronounced for lower-income countries.
33
1. INFRASTRUCTURE CONNECTIVITY AND REGIONAL INTEGRATION IN ASIA AND THE PACIFIC
Table 1.4 Generalised method of moments estimation results: Poverty regressions
Dependent variable: Log(Poverty headcount ratio)
Baseline Baseline with financial
openness
Baseline with financial and
trade openness
Log(overall RII) –16 .56*** –13 .29*** –20 .35
(3 .518) (4 .658) (14 .30)
Log(overall RII) x log(real GDP per capita)
1 .813*** 1 .441*** 2 .241
(0 .361) (0 .459) (1 .613)
Log(trade and investment) –2 .730*** –3 .069** –5 .598***
(0 .907) (1 .374) (2 .075)
Log(trade and investment) x log(real GDP per capita)
0 .296*** 0 .332** 0 .648**
(0 .0999) (0 .153) (0 .255)
Log(money and finance) –9 .582*** –8 .439*** –8 .656***
(1 .853) (1 .909) (2 .009)
Log(money and finance) x log(real GDP per capita)
1 .208*** 0 .881*** 0 .897***
(0 .193) (0 .221) (0 .235)
Log(infrastructure and connectivity) –6 .353*** –11 .42* –26 .93**
(2 .319) (5 .839) (10 .70)
Log(infrastructure and connectivity) x log(real GDP per capita)
–3 .682 –1 .422** –3 .298***
(5 .401) (0 .615) (1 .061)
Log(institutional and social integration)
0 .469 –7 .275 –18 .44*
(0 .573) (5 .445) (11 .00)
Log(institutional and social integration) x log(real GDP per capita)
0 .722*** 0 .791 2 .016*
(0 .254) (0 .560) (1 .121)
With control variables Yes Yes Yes
*** significant at the 1 per cent level** significant at the 5 per cent level * significant at the 10 per cent level Notes: Table indicates summary of results when the dimensional subindexes enter the growth regressions separately . For brevity, dimensional subindexes with significant coefficients are shown . Windmeijer robust standard errors are in parentheses . Source: Authors’ calculations using revised estimations in Park and Claveria (2018b) .

NEW DIMENSIONS OF CONNECTIVITY IN THE ASIA-PACIFIC
34
Improved infrastructure can help reduce poverty by providing the poor with greater opportunity to participate in market activities. Cross-border infrastructure projects—for example, in transport, energy and telecommunications—are essential for the movement of goods, services, people and information across countries. They enlarge market access, reduce economic distance, facilitate trade, and increase investment and labour flows. The resulting intensification of cross-border economic activities can create employment, particularly in the labour-intensive sectors of developing economies, thus contributing to poverty reduction (ADB 2006).
Concluding remarksThe Asia-Pacific has made remarkable progress in regional economic integration, which has been anchored in the region’s strong trade and investment linkages and the associated expansion of regional value chains. Together with market-driven actions, government-led policies have promoted regional economic integration. In the process of regional economic integration, regional economies have removed barriers to trade and the transfer of capital (both physical and human) and technology. Strong regional dynamics, driven by intraregional trade and financial flows, have also encouraged the participation of low-income countries in the fast-growing regional and global value chains and boosted their economic performance.
Nevertheless, the progress of economic integration has not been even across subregions and countries in Asia and the Pacific, leading to unequal economic and social outcomes. Infrastructure connectivity and easier access to markets are often critical factors that divide high-performance countries from low-performance ones. Therefore, providing adequate quality infrastructure remains critical for regional integration and how individual countries can leverage regional integration for inclusive growth.
The United Nations Economic and Social Commission for Asia and the Pacific (UNESCAP 2017) also recognises the significant potential of regional economic integration and interconnectivity to support implementation of the 2030 Agenda for Sustainable Development at regional and subregional levels. Substantially increasing investment in transport, energy and information and communication technology
35
1. INFRASTRUCTURE CONNECTIVITY AND REGIONAL INTEGRATION IN ASIA AND THE PACIFIC
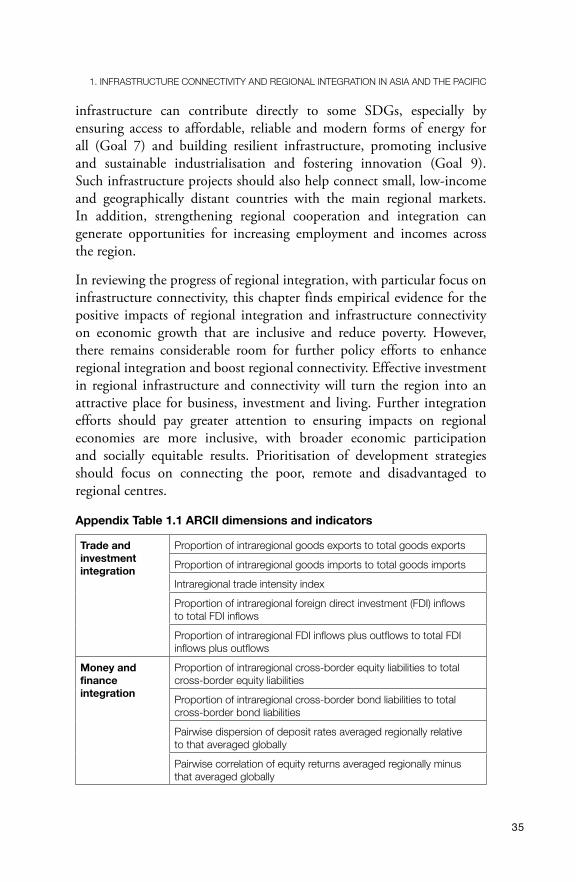
infrastructure can contribute directly to some SDGs, especially by ensuring access to affordable, reliable and modern forms of energy for all (Goal 7) and building resilient infrastructure, promoting inclusive and sustainable industrialisation and fostering innovation (Goal 9). Such infrastructure projects should also help connect small, low-income and geographically distant countries with the main regional markets. In addition, strengthening regional cooperation and integration can generate opportunities for increasing employment and incomes across the region.
In reviewing the progress of regional integration, with particular focus on infrastructure connectivity, this chapter finds empirical evidence for the positive impacts of regional integration and infrastructure connectivity on economic growth that are inclusive and reduce poverty. However, there remains considerable room for further policy efforts to enhance regional integration and boost regional connectivity. Effective investment in regional infrastructure and connectivity will turn the region into an attractive place for business, investment and living. Further integration efforts should pay greater attention to ensuring impacts on regional economies are more inclusive, with broader economic participation and socially equitable results. Prioritisation of development strategies should focus on connecting the poor, remote and disadvantaged to regional centres.
Appendix Table 1.1 ARCII dimensions and indicators
Trade and investment integration
Proportion of intraregional goods exports to total goods exports
Proportion of intraregional goods imports to total goods imports
Intraregional trade intensity index
Proportion of intraregional foreign direct investment (FDI) inflows to total FDI inflows
Proportion of intraregional FDI inflows plus outflows to total FDI inflows plus outflows
Money and finance integration
Proportion of intraregional cross-border equity liabilities to total cross-border equity liabilities
Proportion of intraregional cross-border bond liabilities to total cross-border bond liabilities
Pairwise dispersion of deposit rates averaged regionally relative to that averaged globally
Pairwise correlation of equity returns averaged regionally minus that averaged globally

NEW DIMENSIONS OF CONNECTIVITY IN THE ASIA-PACIFIC
36
Regional value chain
Ratio between average trade complementarity index over regional trading partners and average trade complementarity index over all trading partners
Ratio between average trade concentration index over regional trading partners and average trade concentration index over all trading partners
Proportion of intraregional intermediate goods exports to total intraregional goods exports
Proportion of intraregional intermediate goods imports to total intraregional goods imports
Infrastructure and connectivity
Ratio between average trade cost over regional trading partners and average trade cost over all trading partners
Ratio between average liner shipping connectivity index over regional trading partners and average liner shipping connectivity index over all trading partners
Logistics performance index (overall)
Doing Business Index (overall)
Movement of people
Proportion of intraregional outbound migration to total outbound migration
Proportion of intraregional tourists to total tourists (inbound plus outbound)
Proportion of intraregional remittances to total remittances
Proportion of other Asian countries that do not require an entry visa
Institutional and social integration
Proportion of other Asian countries with which free-trade agreements have been signed
Proportion of other Asian countries that have an embassy
Proportion of other Asian countries that have signed business investment treaties
Proportion of other Asian countries that have signed double taxation treaties
Cultural proximity with other Asian countries relative to that with all other countries
Sources: Huh and Park (2018); Park and Claveria (2018a) .
37
1. INFRASTRUCTURE CONNECTIVITY AND REGIONAL INTEGRATION IN ASIA AND THE PACIFIC
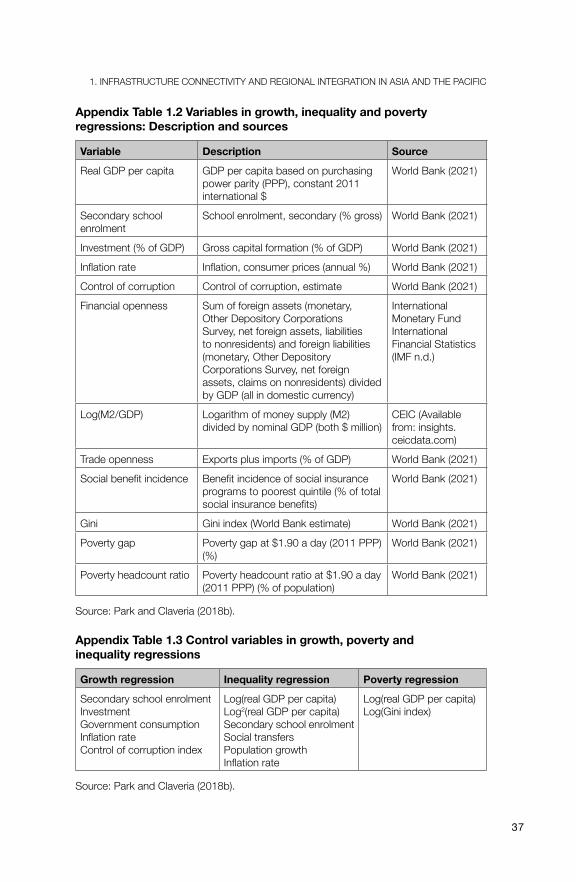
Appendix Table 1.2 Variables in growth, inequality and poverty regressions: Description and sources
Variable Description Source
Real GDP per capita GDP per capita based on purchasing power parity (PPP), constant 2011 international $
World Bank (2021)
Secondary school enrolment
School enrolment, secondary (% gross) World Bank (2021)
Investment (% of GDP) Gross capital formation (% of GDP) World Bank (2021)
Inflation rate Inflation, consumer prices (annual %) World Bank (2021)
Control of corruption Control of corruption, estimate World Bank (2021)
Financial openness Sum of foreign assets (monetary, Other Depository Corporations Survey, net foreign assets, liabilities to nonresidents) and foreign liabilities (monetary, Other Depository Corporations Survey, net foreign assets, claims on nonresidents) divided by GDP (all in domestic currency)
International Monetary Fund International Financial Statistics (IMF n .d .)
Log(M2/GDP) Logarithm of money supply (M2) divided by nominal GDP (both $ million)
CEIC (Available from: insights .ceicdata .com)
Trade openness Exports plus imports (% of GDP) World Bank (2021)
Social benefit incidence Benefit incidence of social insurance programs to poorest quintile (% of total social insurance benefits)
World Bank (2021)
Gini Gini index (World Bank estimate) World Bank (2021)
Poverty gap Poverty gap at $1 .90 a day (2011 PPP) (%)
World Bank (2021)
Poverty headcount ratio Poverty headcount ratio at $1 .90 a day (2011 PPP) (% of population)
World Bank (2021)
Source: Park and Claveria (2018b) .
Appendix Table 1.3 Control variables in growth, poverty and inequality regressions
Growth regression Inequality regression Poverty regression
Secondary school enrolmentInvestmentGovernment consumptionInflation rateControl of corruption index
Log(real GDP per capita)Log2(real GDP per capita)Secondary school enrolmentSocial transfersPopulation growth Inflation rate
Log(real GDP per capita)Log(Gini index)
Source: Park and Claveria (2018b) .

NEW DIMENSIONS OF CONNECTIVITY IN THE ASIA-PACIFIC
38
ReferencesAsian Development Bank (ADB). 2006. Regional Cooperation and Integration
Strategy. Manila: ADB.
Asian Development Bank (ADB). 2017a. Aid for Trade in Asia and the Pacific: Promoting connectivity for inclusive development. Manila: ADB.
Asian Development Bank (ADB). 2017b. Asian Economic Integration Report 2017: The era of financial interconnectedness—How can Asia strengthen financial resilience? Manila: ADB.
Asian Development Bank (ADB). 2017c. Meeting Asia’s Infrastructure Needs. Manila: ADB.
Asian Development Bank (ADB) and Asian Development Bank Institute. 2009. Infrastructure for a Seamless Asia. Tokyo: ADBI. Available from: www.adb.org/sites/default/files/publication/159348/adbi-infrastructure-seamless-asia.pdf.
Asia Regional Integration Center. 2015. Asia-Pacific Regional Cooperation and Integration Index. Manila: ADB. Available from: aric.adb.org/database/arcii.
Grossman, G.M. and Helpman, E. 1990. ‘Comparative advantage and long-run growth.’ American Economic Review 80(4): 796–815.
Grossman, G.M. and Helpman, E. 1991. ‘Trade, knowledge spillovers, and growth.’ European Economic Review 35(2–3): 517–26. doi.org/10.1016/0014-2921(91)90153-A.
Huh, H.-S. and Park, C.-Y. 2018. ‘Asia-Pacific Regional Integration Index: Construction, interpretation, and comparison.’ Journal of Asian Economics 54(February): 22–38. doi.org/10.1016/j.asieco.2017.12.001.
International Monetary Fund (IMF). n.d. IMF Data: Access to macroeconomic & financial data. Washington, DC: IMF. Available from: data.imf.org.
Park, C.-Y. and Claveria, R. 2018a. Constructing the Asia-Pacific Regional Cooperation and Integration Index: A panel approach. ADB Economics Working Paper Series No. 544. Manila: ADB. doi.org/10.22617/WPS189334-2.
Park, C.-Y. and Claveria, R. 2018b. Does regional integration matter for inclusive growth? Evidence from the multidimensional regional integration index. ADB Economics Working Paper Series No. 559. Manila: ADB. doi.org/10.22617/WPS189608-2.
39
1. INFRASTRUCTURE CONNECTIVITY AND REGIONAL INTEGRATION IN ASIA AND THE PACIFIC
Rivera-Batiz, L.A. and Romer, P.M. 1991. ‘International trade with endogenous technological change.’ European Economic Review 35(4): 971–1001. doi.org/ 10.1016/0014-2921(91)90048-N.
Romer, P. 1990. ‘Endogenous technological change.’ Journal of Political Economy 98(5): S71–102. doi.org/10.1086/261725.
United Nations Economic and Social Commission for Asia and the Pacific (UNESCAP). 2012. Growing Together: Economic integration for an inclusive and sustainable Asia-Pacific century. Bangkok: UNESCAP.
United Nations Economic and Social Commission for Asia and the Pacific (UNESCAP). 2017. Enhancing Regional Economic Cooperation and Integration in Asia and the Pacific. Bangkok: UNESCAP.
United Nations Economic and Social Commission for Asia and the Pacific (UNESCAP). 2019. ESCAP-World Bank Trade Costs Database. Bangkok: ESCAP Trade, Investment and Innovation Division. Available from: www.unescap.org/resources/escap-world-bank-trade-cost-database.
World Bank. 2015. Logistics Performance Index Database. Washington, DC: World Bank Group. Available from: lpi.worldbank.org.
World Bank. 2020. Doing Business. [Database]. Washington, DC: World Bank Group. Available from: www.doingbusiness.org.
World Bank. 2021. DataBank. Washington, DC: World Bank Group. Available from: databank.worldbank.org.
World Economic Forum (WEF). 2019. Global Competitiveness Report 2019: How to end a lost decade of productivity growth. Geneva: WEF. Available from: www.weforum.org/reports/how-to-end-a-decade-of-lost-productivity-growth.

This text is taken from New Dimensions of Connectivity in the Asia-Pacific, edited by Christopher Findlay and Somkiat Tangkitvanich, published 2021
by ANU Press, The Australian National University, Canberra, Australia.
doi.org/10.22459/NDCAP.2021.01