1 combining hitf/x with landing point alan nathan, univ. of illinois introduction what can be...
TRANSCRIPT

1
Combining HITf/x with Landing Point Alan Nathan, Univ. of Illinois
• Introduction• What can be learned
directly from the data?• Fancier analysis
methods• The Big Question:
– How well can HITf/x predict
• landing point?• hang time?• full trajectory?
0
20
40
60
80
100
0 50 100 150 200 250 300 350 400Horizontal Distance (ft)
(379,20,5.2)
hitf/xhittracker

2
Why do we care?
• HITf/x data come for “free”
• If HITf/x can determine full trajectory, then we have a handle on– Hang time– Fielder range and reaction time– Outcome-independent hitting metrics– Accurate spray charts– …..

3
My approach to studying the problem
A. Get initial trajectory from HITf/x
B. Get landing point and flight time from hittrackeronline.com
– thanks to Greg Rybarczyk
C. Determine how well A determines B

4
The physics issues
• If we know the initial conditions (HITf/x) and we know all the forces, then we can predict the full trajectory.
• What are the forces and how well are they known?

5
What are the Forces?
• Gravity• Drag (“air resistance”)• Magnus Force (due to spin)
v
mg
Fdrag
FMagnus
• Drag and Magnus depend on air density, wind• Drag depends on “drag coefficient” Cd
• Magnus depends on spinbackspin b: upward forcesidespin s: sideways force
6
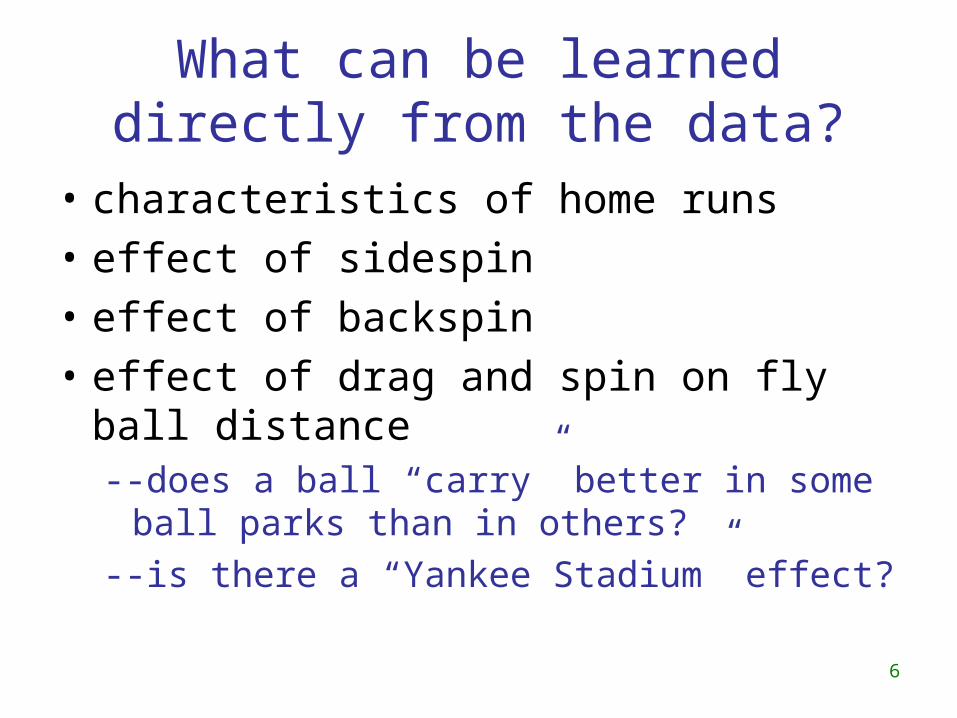
What can be learned directly from the data?
• characteristics of home runs
• effect of sidespin
• effect of backspin
• effect of drag and spin on fly ball distance--does a ball “carry” better in some ball parks
than in others?
--is there a “Yankee Stadium” effect?

7
SOB and Launch Angle

8
How important is SOB?
each additional mph of SOBincreases range by ~4 ft

9
What is optimum launch angle for home runs?
approximately 300
normalized range = range/(k*v0)

10
sideways break sidespin (s)
0
50
100
150
200
250
300
0 50 100 150 200 250 300
x (ft)
f
iRF foul line
1B
i- f measures sideways break

11
Effect of Sidespin
break to right
break to left
RFCFLF
• balls breaks towards foul pole• amount of break increases with spray angle• balls hit to CF seem to slice• the slice results in asymmetry between RHH and LHH
LHH
RHH

12
Hang Time:ratio to vacuum value
• backspin increase hang time
• drag decreases hang time
• ratio of hang time to vacuum value approaches 1 with larger launch angle

13
0
20
40
60
80
100
0 100 200 300 400 500 600Horizontal Distance (ft)
actual trajectory
vacuum trajectory
(379,20,5.2)
v0 = 100 mph = 29o
b = 2500 rpm
(532,20,4.2)
R = actual distance/vacuum distance = D/D0
= 379/532 = 0.71
Effect of Drag and Lift on Range
D0
D

14
R = D/D0 vs. initial vertical velocity

15
Normalized R by Park
0.940.960.981.001.021.041.061.08
An
gel
AT
&T
Pet
coD
od
ger
Tu
rner
Ch
ase
Min
ute
Mil
ler
Do
lph
inC
itiz
ens
Nat
ion
als
Met
rod
oG
reat
Pro
gre
ssi
Co
mer
ica
Wri
gle
yO
rio
leS
afec
oB
usc
hY
anke
eC
oo
rsR
og
ers
PN
C P
ark
U.S
.R
ang
ers
Fen
way
Kau
ffm
anT
rop
ican
Cit
i F
ield
Oak
lan
d
Park
No
rmal
ized
R
Larger normalized R means better “carry”

16
Normalized R by Park
0.940.960.981.001.021.041.061.08
An
gel
AT
&T
Pet
coD
od
ger
Tu
rner
Ch
ase
Min
ute
Mil
ler
Do
lph
inC
itiz
ens
Nat
ion
als
Met
rod
oG
reat
Pro
gre
ssi
Co
mer
ica
Wri
gle
yO
rio
leS
afec
oB
usc
hY
anke
eC
oo
rsR
og
ers
PN
C P
ark
U.S
.R
ang
ers
Fen
way
Kau
ffm
anT
rop
ican
Cit
i F
ield
Oak
lan
d
Park
No
rmal
ized
R
best carry: Houston, Denverworst carry: Cleveland, Detroit, Oaklandbest-worst: 10% or about 40 ft

17
Does the ball carry better in Yankee Stadium?
No evidence for better carry in the present data.
Coors
YS
18
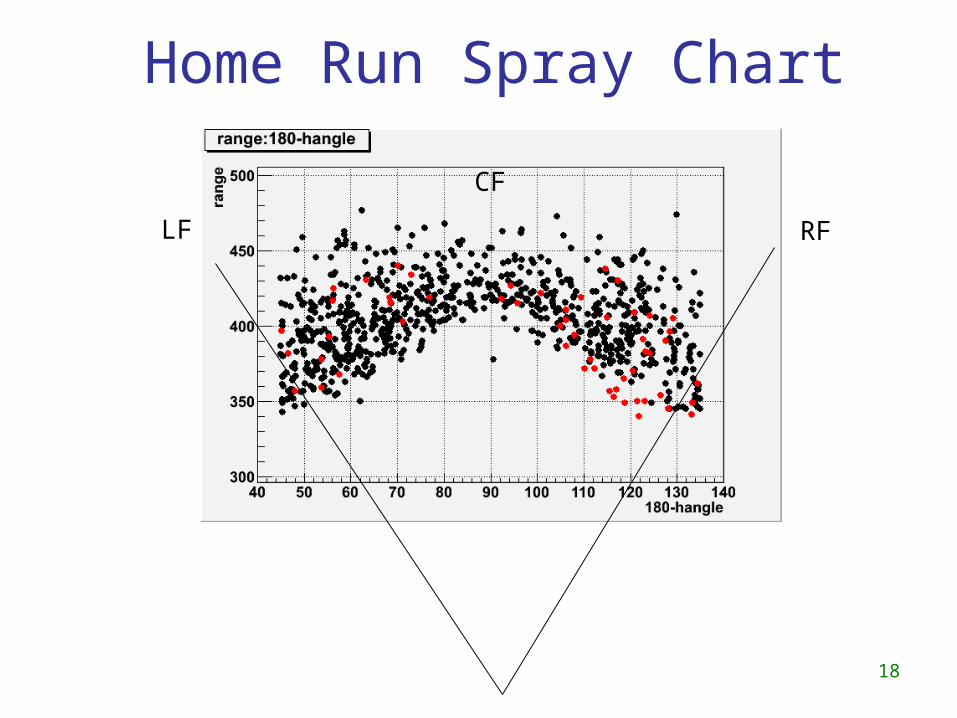
Home Run Spray Chart
RFLF
CF

19
Fancier Analysis Methods
• There are things we don’t know well– the spin on the batted ball (b and s)– the drag coefficient Cd
• Therefore, we will use the actual data as a way to constrain b, s, Cd
– develop relationships between these quantities and initial velocity vector
– investigate how well these relationships reproduce the landing point data.

20
0
20
40
60
80
100
0 50 100 150 200 250 300 350 400Horizontal Distance (ft)
(379,20,5.2)
v0 = 100 mph = 29o
b = 2500 rpm
hitf/xhittracker
• for given hitf/x initial conditions, adjust Cd, b, s to reproduce landing point (x,y,z) at the measured flight time • unique solution is always possible
--flight time determines b
--horizontal distance and flight time determines Cd
--sideways deflection determines s
21
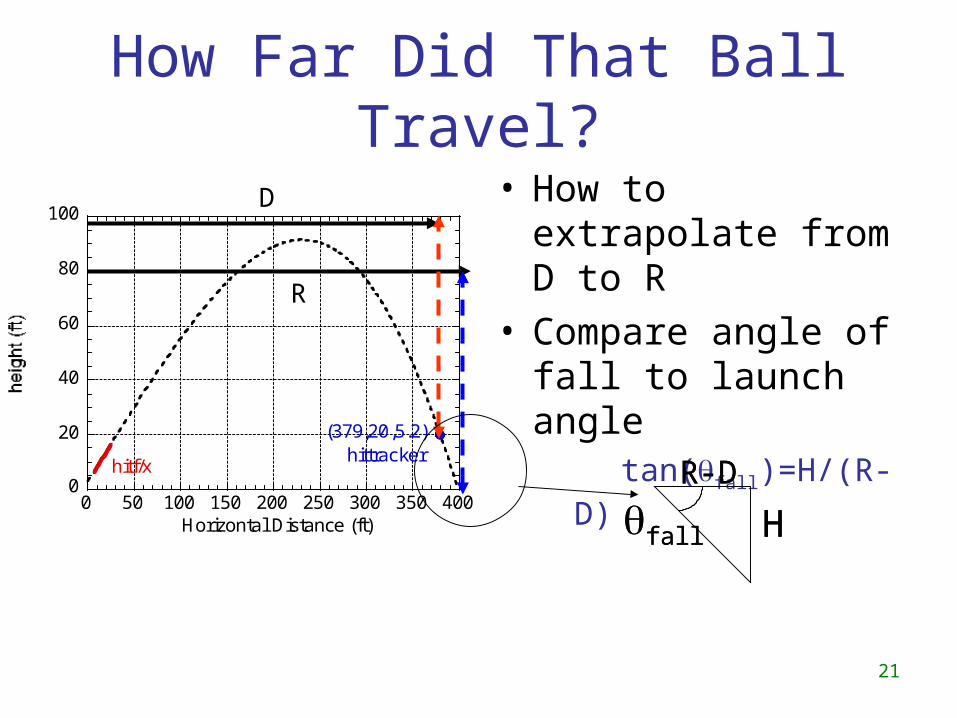
How Far Did That Ball Travel?
• How to extrapolate from D to R
• Compare angle of fall to launch angle tan(fall)=H/(R-D)
0
20
40
60
80
100
0 50 100 150 200 250 300 350 400Horizontal Distance (ft)
(379,20,5.2)
hitf/xhittracker
D
R
H
R-D
fall H
R-D
fall

22
fall
fall/
R fall/ = 1.4

23
Sidespin
LHH
LHH
s (rpm)
(deg)
(deg)

24
Backspinb (rpm)
(deg)
(deg)
b (rpm)

25
Summary• we have expressions for b() and s() • there is lots of scatter of the data about these mean values
– Is the scatter real?
• that means we still have a ways to go to meet our goal of predicting landing point and hang time from HITf/x data alone
• but we have learned some things along the way– Optimum launch angle for home run– Importance of SOB: 4 ft/mph – L-R asymmetry in s
– characterization of “carry”
• look forward to landing data from hit balls other than home runs