1. 2 table of contents population 3 labor force and nonfarm employment 3 employment trends 4 yuma...
TRANSCRIPT
1
GREATER YUMA EDCQUARTERLYSTATISTICS
REPORTAPRIL – JUNE 2012
899 Plaza Circle, Suite 2Yuma, Arizona 85365
(928) 782-7774www.greateryuma.org

2
TABLE OF CONTENTS
POPULATION 3
LABOR FORCE AND NONFARM EMPLOYMENT 3
EMPLOYMENT TRENDS 4
YUMA COUNTY AREA EMPLOYMENT By SECTOR By YEAR 5
TAXABLE SALES BY CLASS WITHIN YUMA COUNTY 6
COLLECTIONS by CLASS WITHIN YUMA COUNTY 6
YUMA COUNTY TAXABLE SALES BY FISCAL YEAR (CHARTS) 6
TAXABLE SALES BY CLASS WITHIN YUMA COUNTY (CHARTS) 7
TAX COLLECTIONS BY MUNICIPALITY 8
WATER SERVICE CUSTOMERS BY MUNICIPALITY 8
ELECTRIC SERVICE CUSTOMERS 9
NATURAL GAS CUSTOMERS 9
CURRENT AND HISTORICAL CONSUMER PRICE INDEX 10
FAMILY HOUSEHOLD INCOME 11
YUMA COUNTY AHCCS POPULATION 12BUILDING PERMITS By MUNICIPALITY 4th QUARTER 2011-2012 13BUILDING VALUATIONS By MUNICIPALITY 4th QUARTER 2011-2012 14
BUILDING PERMITS By MUNICIPALITY – FY 2007 - 2011 15
BUILDING VALUATIONS By MUNICIPALITY – FY 2007 - 2011 16
BORDER CROSSINGS 4th QUARTER 2010-2011-2011-2012 17BORDER CROSSINGS 4th QUARTER 2010-2011-2011-2012 (CHARTS) 18
TOURISM YUMA COUNTY LODGING DATA 19YUMA COUNTY TRAVEL SPENDING, EMPLOYMENT AND TRAVEL IMPACT 20
GROWING AND DECLINING BUSINESS 21
REAL ESTATE MARKET SNAPSHOT 22
REAL ESTATE CHARTS 23
REAL ESTATE CHARTS 24
INFORMATION SOURCES 25

3
Location
2000 Censu
s2010
Census
% of Change 2000-2010
Yuma County 160,026 195,751 22.3%
San Luis 15,322 25,505 39.9%
Somerton 7,266 14,287 49.1%
Wellton 1,829 2,882 36.5%
City of Yuma 77,515 93,064 16.7%
Fortuna Foothills CDP
20,478 26,265 22.0%
Gadsden, CDP 953 678 -28.9%
Tacna CDP 555 602 7.8%
Yuma County Growth Indicators
POPULATION
LABOR FORCE AND NONFARM EMPLOYMENTU S Census 2010
Arizona Workforce Informer
Apr '12 May '12 Jun '12
Average 4th
Quarter FY 11/12
Average 4thQuarter FY 10/11
% of Change 2010 vs 2011
Labor Force 86.9 91.7 89.6 89.4 93.5 -4.3%Employment 64.3 65.3 64.3 64.6 68.5 -5.7%Unemployment 22.6 26.5 25.3 24.8 25.0 -0.8%Unemployment Rate 26.0% 28.9% 28.3% 27.7% 23.9% 3.8% Total Nonfarm 49.9 49.2 48.0 49.0 48.7 0.7%Total Private 34.1 34.0 33.0 33.7 33.9 -0.6%Goods Producing 4.0 4.0 4.0 4.0 3.8 5.0%Service-Providing 45.9 45.2 44.0 45.0 44.9 0.3%Private Service-Providing 30.0 30.0 29.0 29.6 30.0 -1.3%Mining and Construction 2.2 2.2 2.2 2.2 2.2 0.0%Manufacturing 1.8 1.8 1.8 1.8 1.6 11.1%Trade, Transportation, and Utilities 9.1 9.0 8.8 8.9 9.1 -2.2%Information 0.5 0.5 0.5 0.5 0.5 0.0%Financial Activities 1.3 1.3 1.2 1.2 1.3 -7.7%Professional and Business Services 5.5 5.5 5.3 5.4 5.9 -8.5%Educational and Health Services 6.8 6.8 6.5 6.7 6.6 1.5%Leisure and Hospitality 5.6 5.5 5.3 5.4 5.1 0.6%Other Services 1.4 1.4 1.4 1.4 1.5 -6.7%Government 15.8 15.2 15.0 15.3 14.9 2.7%Federal Government 3.8 3.8 3.8 3.8 3.7 2.7%State and Local Government 11.4 11.4 11.2 11.3 11.1 1.8%

4
EMPLOYMENT TRENDS
Arizona Workforce Informer
Yuma County Apr '12 May '12 Jun '12
Average 4th Quarter
FY 11/12
Average 4th
Quarter FY 10/11
% of Change 2010 vs 2011
Labor Force 86,743 91,739 91,854 90,112 93,500 -3.6%Employment 64,163 65,250 66,182 65,198 68,500 -4.8%Unemployment 22,580 26,489 25,672 24,913 25,000 -0.3%Unemployment Rate 26.0% 28.9% 27.9% 27.6% 26.7% 0.9% City of San Luis Labor Force 16,352 18,569 17,239 17,386 8,584 50.6%Employment 5,482 5,575 5,655 5,570 4,279 23.2%Unemployment 10,870 12,994 11,584 11,816 4,305 63.6%Unemployment Rate 65.5% 70.0% 67.2% 67.5% 50.2% 17.3% City of Somerton Labor Force 4,408 4,745 4,723 4,625 4,773 -3.1%Employment 2,737 2,784 2,823 2,781 2,922 -4.8%Unemployment 1,671 1,961 1,900 1,844 1,850 -0.3%Unemployment Rate 37.9% 41.3% 40.2% 39.8% 38.8% 1.0% Town of Wellton Labor Force 841 893 892 875 908 -3.6%Employment 602 613 621 612 643 -4.8%Unemployment 239 280 271 263 264 -0.4%Unemployment Rate 28.4% 31.4% 30.4% 30.0% 29.0% 1.0% City of Yuma Labor Force 42,422 43,922 44,895 43,746 49,392 -11.4%Employment 36,243 36,859 37,384 36,828 38,969 -5.5%Unemployment 6,179 7,065 7,511 6,918 10,423 -33.6%Unemployment Rate 14.6% 16.1% 16.7% 15.8% 21.1% -5.3% Fortuna Foothills CDP Labor Force 6,699 6,967 7,015 6,894 7,191 -4.1%Employment 5,710 5,807 5,890 5,802 6,096 -4.8%Unemployment 989 1,160 1,125 1,091 1,095 -0.4%Unemployment Rate 14.8% 16.6% 16.0% 15.8% 15.2% 0.6% Gadsden CDP Labor Force 559 600 598 586 604 -3.0%Employment 354 360 365 360 378 -4.8%Unemployment 205 240 233 226 227 -0.4%Unemployment Rate 36.7% 40.0% 39.0% 38.6% 37.5% 1.1% Tacna CDP Labor Force 257 266 269 264 275 -4.0%Employment 223 226 230 226 238 -5.0%Unemployment 34 40 39 38 38 0.0%Unemployment Rate 13.2% 15.0% 14.5% 14.2% 13.7% 0.5%
5
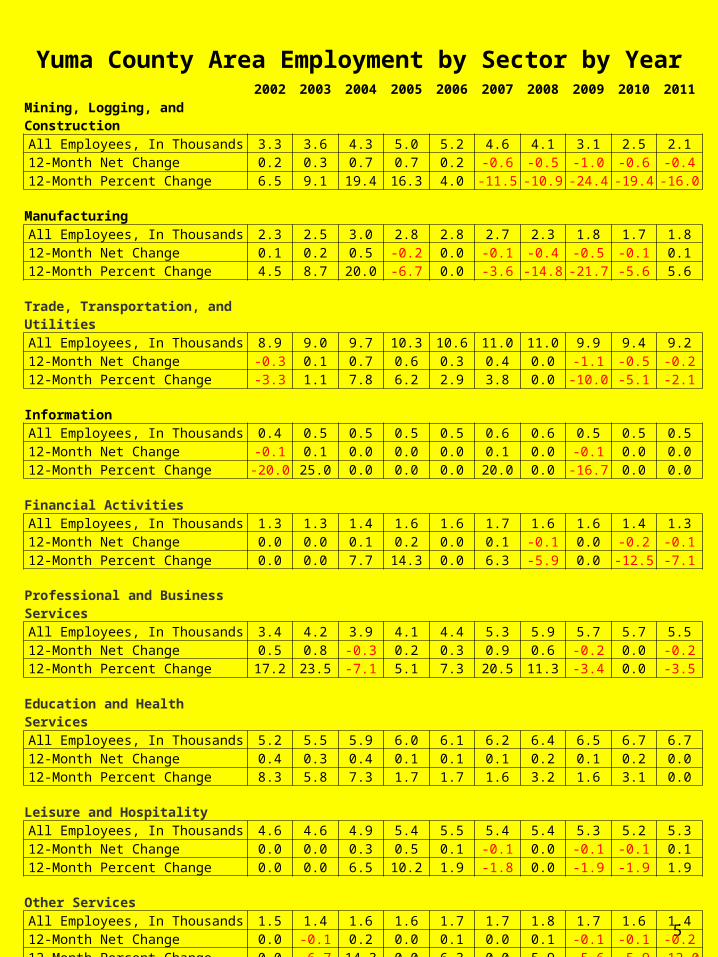
Yuma County Area Employment by Sector by Year2002 2003 2004 2005 2006 2007 2008 2009 2010 2011
Mining, Logging, and ConstructionAll Employees, In Thousands 3.3 3.6 4.3 5.0 5.2 4.6 4.1 3.1 2.5 2.112-Month Net Change 0.2 0.3 0.7 0.7 0.2 -0.6 -0.5 -1.0 -0.6 -0.412-Month Percent Change 6.5 9.1 19.4 16.3 4.0 -11.5 -10.9 -24.4 -19.4 -16.0
ManufacturingAll Employees, In Thousands 2.3 2.5 3.0 2.8 2.8 2.7 2.3 1.8 1.7 1.812-Month Net Change 0.1 0.2 0.5 -0.2 0.0 -0.1 -0.4 -0.5 -0.1 0.112-Month Percent Change 4.5 8.7 20.0 -6.7 0.0 -3.6 -14.8 -21.7 -5.6 5.6
Trade, Transportation, and UtilitiesAll Employees, In Thousands 8.9 9.0 9.7 10.3 10.6 11.0 11.0 9.9 9.4 9.212-Month Net Change -0.3 0.1 0.7 0.6 0.3 0.4 0.0 -1.1 -0.5 -0.212-Month Percent Change -3.3 1.1 7.8 6.2 2.9 3.8 0.0 -10.0 -5.1 -2.1
InformationAll Employees, In Thousands 0.4 0.5 0.5 0.5 0.5 0.6 0.6 0.5 0.5 0.512-Month Net Change -0.1 0.1 0.0 0.0 0.0 0.1 0.0 -0.1 0.0 0.012-Month Percent Change -20.0 25.0 0.0 0.0 0.0 20.0 0.0 -16.7 0.0 0.0
Financial ActivitiesAll Employees, In Thousands 1.3 1.3 1.4 1.6 1.6 1.7 1.6 1.6 1.4 1.312-Month Net Change 0.0 0.0 0.1 0.2 0.0 0.1 -0.1 0.0 -0.2 -0.112-Month Percent Change 0.0 0.0 7.7 14.3 0.0 6.3 -5.9 0.0 -12.5 -7.1
Professional and Business ServicesAll Employees, In Thousands 3.4 4.2 3.9 4.1 4.4 5.3 5.9 5.7 5.7 5.512-Month Net Change 0.5 0.8 -0.3 0.2 0.3 0.9 0.6 -0.2 0.0 -0.212-Month Percent Change 17.2 23.5 -7.1 5.1 7.3 20.5 11.3 -3.4 0.0 -3.5
Education and Health Services All Employees, In Thousands 5.2 5.5 5.9 6.0 6.1 6.2 6.4 6.5 6.7 6.712-Month Net Change 0.4 0.3 0.4 0.1 0.1 0.1 0.2 0.1 0.2 0.012-Month Percent Change 8.3 5.8 7.3 1.7 1.7 1.6 3.2 1.6 3.1 0.0
Leisure and HospitalityAll Employees, In Thousands 4.6 4.6 4.9 5.4 5.5 5.4 5.4 5.3 5.2 5.312-Month Net Change 0.0 0.0 0.3 0.5 0.1 -0.1 0.0 -0.1 -0.1 0.112-Month Percent Change 0.0 0.0 6.5 10.2 1.9 -1.8 0.0 -1.9 -1.9 1.9
Other Services All Employees, In Thousands 1.5 1.4 1.6 1.6 1.7 1.7 1.8 1.7 1.6 1.412-Month Net Change 0.0 -0.1 0.2 0.0 0.1 0.0 0.1 -0.1 -0.1 -0.212-Month Percent Change 0.0 -6.7 14.3 0.0 6.3 0.0 5.9 -5.6 -5.9 -12.0
GovernmentAll Employees, In Thousands 12.5 12.8 13.4 13.7 14.4 14.5 14.7 14.6 14.8 15.312-Month Net Change 0.5 0.3 0.6 0.3 0.7 0.1 0.2 -0.1 0.2 0.512-Month Percent Change 4.2 2.4 4.7 2.2 5.1 0.7 1.4 -0.7 1.4 3.3

6
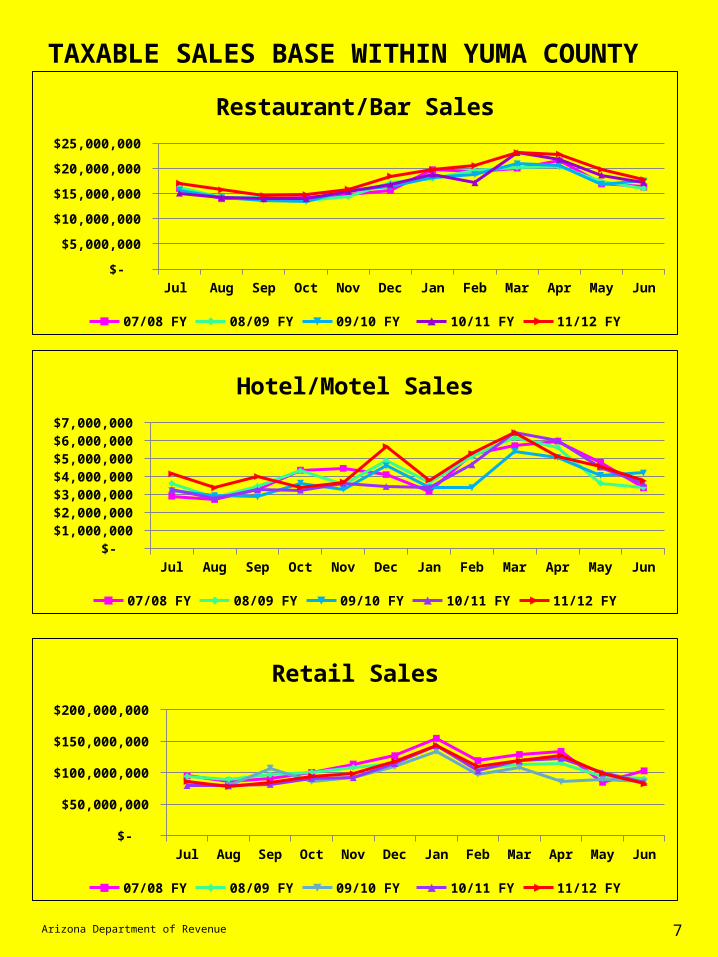
TAXABLE SALES BASE WITHIN YUMA COUNTY
YUMA COUNTY TAXABLE SALES BASE by FISCAL YEAR
Arizona Department of Revenue
STATE TAX COLLECTIONS WITHIN YUMA COUNTY
April '12 May '12 Jun '12
Total 4th Quarter FY 2011/12
Total 4th Quarter FY 2010/11
% of Change FY 2011/12 vs 2010/11
Yuma County Total
$215,518,180
$188,707,528
$168,438,857 $572,664,565 $542,275,343 5.3%
Restaurant/Bar $22,871,041 $19,796,424 $17,783,797 $60,451,262 $57,729,737 4.5%
Hotel/Motel $5,121,048 $4,558,427 $3,754,982 $13,434,457 $14,165,168 -5.2%
Retail Sales $127,143,55
8 $99,361,372 $82,190,973 $308,695,903 $307,303,167 0.5%
April '12 May '12 Jun '12
Total 4th Quarter FY 2011/12
Total 4th Quarter
FY 2010/11
% of Change FY 2011/12 vs 2010/11
Yuma County Total
$10,797,223 $9,446,424 $8,490,262 $28,733,909 $36,740,748 -21.8%
Restaurant/Bar $1,143,552 $989,821 $889,189 $3,022,562 $2,886,487 4.5%
Hotel/Motel $281,657 $250,713 $206,524 $738,894 $779,084 -5.2%
Retail Sales $6,357,177 $4,968,068 $4,109,548 $15,434,793 $15,365,159 0.5%
Jul Aug Sep Oct Nov Dec Jan Feb Mar Apr May Jun $-
$50,000,000
$100,000,000
$150,000,000
$200,000,000
$250,000,000
$300,000,000
07/08 FY 08/09 FY 09/10 FY 10/11 FY 11/12 FY
7
TAXABLE SALES BASE WITHIN YUMA COUNTY
Arizona Department of Revenue
Jul Aug Sep Oct Nov Dec Jan Feb Mar Apr May Jun $-
$5,000,000
$10,000,000
$15,000,000
$20,000,000
$25,000,000
Restaurant/Bar Sales
07/08 FY 08/09 FY 09/10 FY 10/11 FY 11/12 FY
Jul Aug Sep Oct Nov Dec Jan Feb Mar Apr May Jun $-
$1,000,000
$2,000,000
$3,000,000
$4,000,000
$5,000,000
$6,000,000
$7,000,000
Hotel/Motel Sales
07/08 FY 08/09 FY 09/10 FY 10/11 FY 11/12 FY
Jul Aug Sep Oct Nov Dec Jan Feb Mar Apr May Jun $-
$20,000,000 $40,000,000 $60,000,000 $80,000,000
$100,000,000 $120,000,000 $140,000,000 $160,000,000 $180,000,000
Retail Sales
07/08 FY 08/09 FY 09/10 FY 10/11 FY 11/12 FY

8
TAX COLLECTIONS by MUNICIPALITY
Arizona Department of Revenue
WATER SERVICE CUSTOMERS
Apr '12 May '12 Jun '12
Average 4th Quarter
FY 2011/12
Average 4th
Quarter FY
2010/11
% of Change
FY 2011/12
vs 2010 /11
City of Yuma 29,001 29,023 29,031 29,018 28,951 0.2%
City of San Luis 6,016 6,024 6,044 6,028 5,983 0.7%
City of Somerton 3,046 3,048 3,062 3,052 2,987 2.1%
Town of Wellton 966 952 944 954 940 1.5%
April '12 May '12 Jun '12
Total 4th Quarter FY 2011/12
Total 4th Quarter FY 2010/11
% of Change FY 2011/12 vs 2010/11
City of San Luis $537,970 $519,461 $472,113 $1,529,544 $1,506,462 1.5%
City of Somerton $121,787 $92,126 $94,467 $308,380 $253,713 17.7%
Town of Wellton $57,786 $16,065 $39,864 $113,715 $267,676 -57.5%
City of Yuma $3,027,962 $2,548,143 $2,463,929 $8,040,034 $7,450,911 7.3%

9
ELECTRIC SERVICE CUSTOMERS
Arizona Public Service - Residential
Arizona Public Service – Non - Residential
NATURAL GAS SERVICE CUSTOMERSSouthwest Gas
Apr '12 May '12 Jun '12
Average 4th Quarter FY 2011/12
Average 4th Quarter FY 2010/11
% of Change FY 2011/12 vs 2010 /11
Parker District 8,419 8,258 8,245 8,307 8,248 0.7%
Yuma Area34,131 33,526 33,424 33,693 33,743 -0.1%
Foothills Area 20,232 18,451 18,077 18,920 19,060 -0.7%
Somerton Area3,743 3,732 3,742 3,739 3,663 2.0%
San Luis Area 6,205 6,180 6,207 6,197 6,117 1.3%
Apr '12 May '12 Jun '12
Average 4th Quarter FY 2011/12
Average 4th Quarter FY 2010/11
% of Change FY 2011/12 vs 2010 /11
Parker District 1,931 1,906 1,892 1,909 1,885 1.3%
Yuma Area 5,289 5,293 5,279 5,287 5,245 0.8%
Foothills Area 1,142 1,142 1,136 1,140 1,109 2.7%
Somerton Area
446 442 446 444 435 2.0%
San Luis Area 574 573 566 571 559 2.1%
Apr '12 May '12 Jun '12
Average 4th Quarter FY 2011/12
Average 4th Quarter FY 2010/11
% of Change FY 2011/12 vs
2010 /11
Somerton 1,407 1,415 1,413 1,412 1,382 2.1%
Wellton 181 183 180 181 174 3.9%
San Luis 227 227 227 227 226 0.4%
Yuma 18,791 18,764 18,730 18,762 18,762 0.0%
Foothills 8,750 8,705 8,538 8,664 8,504 1.4%
Parker 1,055 1,051 1,035 1,047 1,047 0.0%
10
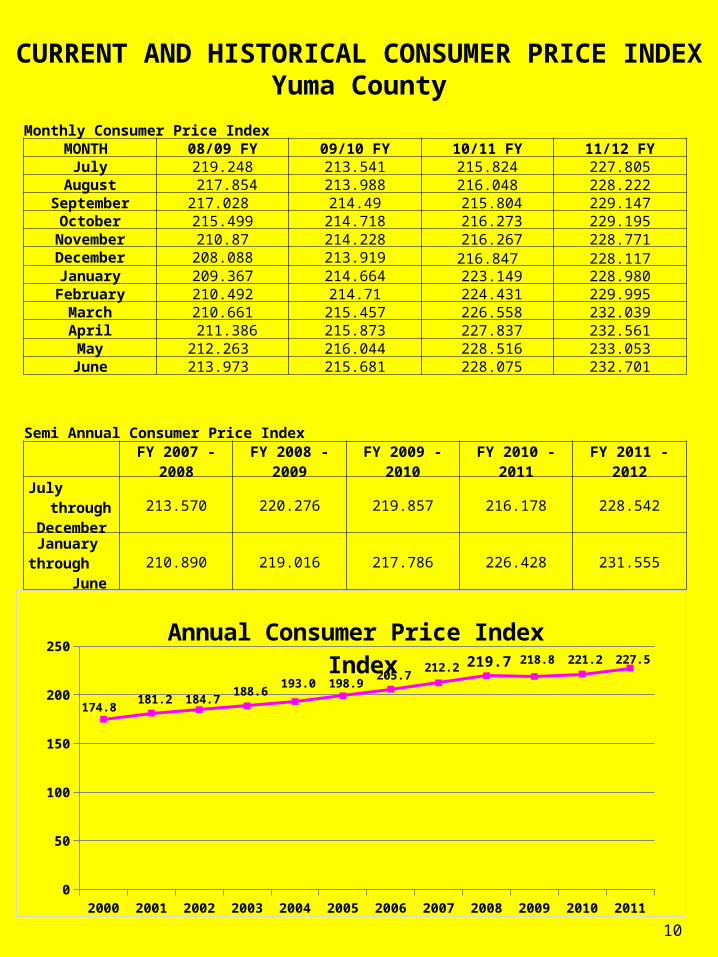
CURRENT AND HISTORICAL CONSUMER PRICE INDEX
Yuma CountyMonthly Consumer Price IndexMONTH 08/09 FY 09/10 FY 10/11 FY 11/12 FY
July 219.248 213.541 215.824 227.805August 217.854 213.988 216.048 228.222
September 217.028 214.49 215.804 229.147October 215.499 214.718 216.273 229.195
November 210.87 214.228 216.267 228.771December 208.088 213.919 216.847 228.117
January 209.367 214.664 223.149 228.980February 210.492 214.71 224.431 229.995
March 210.661 215.457 226.558 232.039April 211.386 215.873 227.837 232.561May 212.263 216.044 228.516 233.053June 213.973 215.681 228.075 232.701
Semi Annual Consumer Price Index
FY 2007 -
2008FY 2008 -
2009FY 2009 -
2010FY 2010 -
2011FY 2011 -
2012July through
December213.570 220.276 219.857 216.178 228.542
January through
June210.890 219.016 217.786 226.428 231.555
2000 2001 2002 2003 2004 2005 2006 2007 2008 2009 2010 20110
50
100
150
200
250Annual Consumer Price Index Index
181.2174.8
184.7188.6
193.0 198.9205.7
212.2218.8 221.2 227.5219.7
11
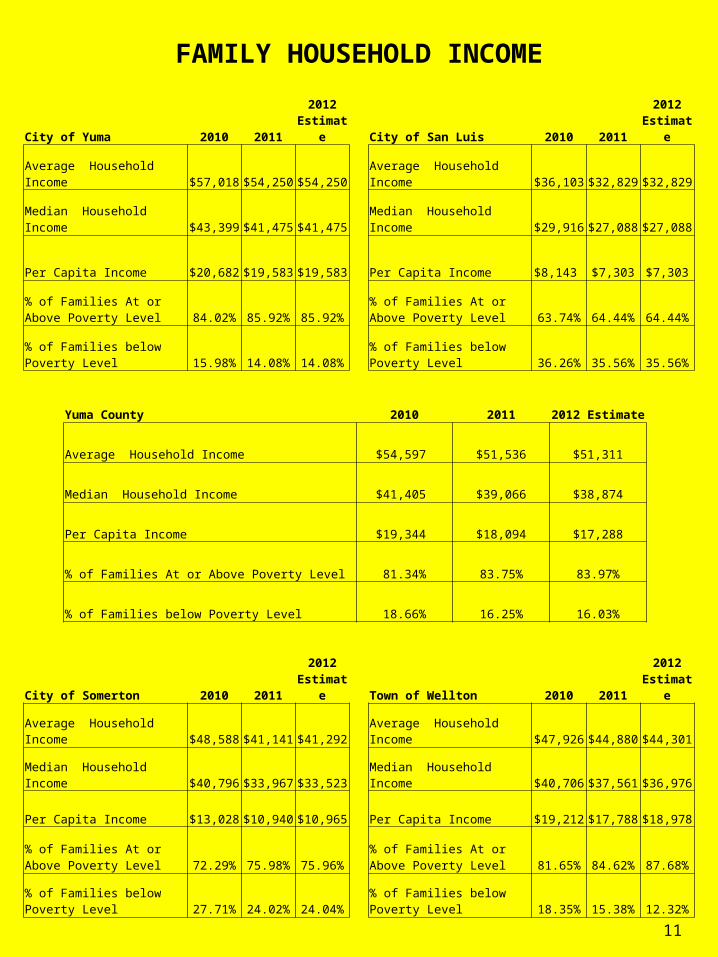
FAMILY HOUSEHOLD INCOME
City of Yuma 2010 2011
2012 Estimat
e City of San Luis 2010 2011
2012 Estimat
e
Average Household Income $57,018 $54,250 $54,250
Average Household Income $36,103 $32,829 $32,829
Median Household Income $43,399 $41,475 $41,475
Median Household Income $29,916 $27,088 $27,088
Per Capita Income $20,682 $19,583 $19,583 Per Capita Income $8,143 $7,303 $7,303
% of Families At or Above Poverty Level 84.02% 85.92% 85.92%
% of Families At or Above Poverty Level 63.74% 64.44% 64.44%
% of Families below Poverty Level 15.98% 14.08% 14.08%
% of Families below Poverty Level 36.26% 35.56% 35.56%
Yuma County 2010 20112012
Estimate
Average Household Income $54,597 $51,536 $51,311
Median Household Income $41,405 $39,066 $38,874
Per Capita Income $19,344 $18,094 $17,288
% of Families At or Above Poverty Level 81.34% 83.75% 83.97%
% of Families below Poverty Level 18.66% 16.25% 16.03%
City of Somerton 2010 2011
2012 Estimat
e Town of Wellton 2010 2011
2012 Estimat
e
Average Household Income $48,588 $41,141 $41,292
Average Household Income $47,926 $44,880 $44,301
Median Household Income $40,796 $33,967 $33,523
Median Household Income $40,706 $37,561 $36,976
Per Capita Income $13,028 $10,940 $10,965 Per Capita Income $19,212 $17,788 $18,978
% of Families At or Above Poverty Level 72.29% 75.98% 75.96%
% of Families At or Above Poverty Level 81.65% 84.62% 87.68%
% of Families below Poverty Level 27.71% 24.02% 24.04%
% of Families below Poverty Level 18.35% 15.38% 12.32%

12
YUMA COUNTY AHCCCS POPULATION
Apr '12 May‘12 Jun '12
Average 4th
Quarter 2012
Average 4th
Quarter 2011
% of Change 2011 vs 2012
48,791 49,009 49,249 49,016 51,236 -4.3%
Quarterly Average
Jul-11 Aug-11Sep-11 Oct-11 Nov-11 Dec-11 Jan-12 Feb-12 Mar-12 Apr-12May-12 Jun-1246,000
47,000
48,000
49,000
50,000
51,000
52,000
53,000
54,000
55,000
52,481
53,84054,189
53,96253,367
52,100
50,75250,012
49,53048,79149,00949,249
AHCCCS PopulationFY 2011/2012
FY 2
003/
04
FY 2
004/
05
FY 2
005/
06
FY 2
006/
07
FY 2
007/
08
FY 2
008/
09
FY 2
009/
10
FY 2
010/
11
FY 2
011/
12
0
10,000
20,000
30,000
40,000
50,000
60,000
42,002 44,590 45,369 45,731 46,536 47,80852,742 52,902 53,503
AHCCCS Average Yearly PopulationFY 2003/04 – FY 2011/12

13
BUILDING PERMITS By MUNICIPALITY 4th QUARTER FY 2011-2012
Apr-12 May-12 Jun-12
San Luis 21 40 16
Somerton 8 17 14
Wellton 5 2 2
Yuma 377 437 319
25
125
225
325
425
Permits Issued Per Month4th Quarter 2011-12
% of Change in Permits Issued Apr 2011 to Apr 2012
Permits Issued 12-Apr 11-Apr % of Change
San Luis 21 24 -12.5%
Somerton 8 7 12.5%
Wellton 5 2 60.0%
Yuma 377 99 73.7%
% of Change in Permits Issued May 2011 to May 2012
Permits Issued 12-May 11-May % of Change
San Luis 40 20 50.0%
Somerton 17 22 -22.7%
Wellton 2 2 0.0%
Yuma 437 99 77.3%
% of Change in Permits Issued Jun 2011 to Jun 2012
Permits Issued 12-Jun 11-Jun % of Change
San Luis 16 24 -33.3%
Somerton 14 6 57.1%
Wellton 2 7 -71.4%
Yuma 319 101 68.3%

14
BUILDING PERMIT VALUATIONS By MUNICIPALITY
4th QUARTER FY2011-2012
Apr-12 May-12 Jun-12
San Luis 2267007 2843103 286052
Somerton 522871 312954 499175
Wellton 1707250 179000 98900
Yuma 5917350 11752085 6163959
$1,000,000
$3,000,000
$5,000,000
$7,000,000
$9,000,000
$11,000,000
$13,000,000
Valuation of Permits Issued Per Month4th Quarter 2011-12
% of Change in Valuation of Permits Issued Apr 2011 to Apr 2012
Valuation 12-Apr 11-Apr % of Change
San Luis $2,267,007 $1,921,548 15.2%
Somerton $522,871 $227,744 56.4%
Wellton $1,707,250 $124,240 99.3%
Yuma $5,917,350 $8,750,096 -32.4%
% of Change in Valuation of Permits Issued May 2011 to May 2012
Valuation 12-May 11-May % of Change
San Luis $2,843,103 $1,329,206 53.2%
Somerton $312,954 $1,248,022 -74.9%
Wellton $179,000 $11,000 93.9%
Yuma $11,752,085 $6,442,638 45.2%
% of Change in Valuation of Permits Issued Jun 2011 to Jun 2012
Valuation 12-Jun 11-Jun % of Change
San Luis $286,052 $969,857 -70.5%
Somerton $499,175 $363,447 70.5%
Wellton $98,900 $221,888 -55.4%
Yuma $6,163,959 $14,954,994 -58.7%
15
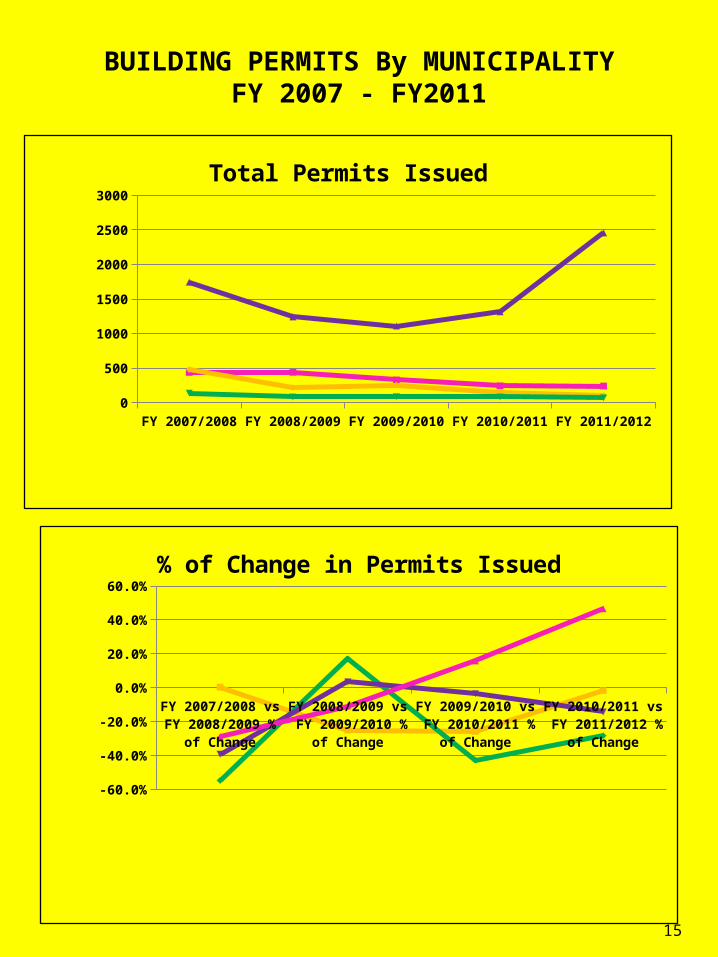
BUILDING PERMITS By MUNICIPALITYFY 2007 - FY2011
FY 2007/2008
FY 2008/2009
FY 2009/2010
FY 2010/2011
FY 2011/2012
San Luis
439 440 330 245 241
Somerton
481 218 253 145 104
Well-ton
138 84 87 84 72
Yuma 1744 1242 1109 1316 2457
250
750
1250
1750
2250
2750
Total Permits Issued
FY 2007/2008 vs FY 2008/2009 %
of Change
FY 2008/2009 vs FY 2009/2010 %
of Change
FY 2009/2010 vs FY 2010/2011 %
of Change
FY 2010/2011 vs FY 2011/2012 %
of Change
San Luis
0.003 -0.25 -0.258 -0.017
Somer-ton
-0.547 0.17 -0.427 -0.283
Wellton -0.392 0.035 -0.035 -0.143
Yuma -0.288 -0.108 0.158 0.466
-50.0%
-30.0%
-10.0%
10.0%
30.0%
50.0%
% of Change in Permits Issued

16
BUILDING VALUATIONS By MUNICIPALITYFY2007 - FY2011
FY 2007/2008
FY 2008/2009
FY 2009/2010
FY 2010/2011
FY 2011/2012
San Luis
28070812 33476953 22569782 13115405 14354819
Somerton
15432248 8149576 9508237 4251763 4149702
Well-ton
8400055 2735211 5979015 2324001 4408273
Yuma 179196703 78318651 76102658 82373393 82648326
$10,000,000 $30,000,000 $50,000,000 $70,000,000 $90,000,000
$110,000,000 $130,000,000 $150,000,000 $170,000,000 $190,000,000
Valuation of Permits Issued
FY 2007/2008 vs FY 2008/2009 %
of Change
FY 2008/2009 vs FY 2009/2010 % of Change
FY 2009/2010 vs FY 2010/2011 %
of Change
FY 2010/2011 vs FY 2011/2012 %
of Change
San Luis 0.162 -0.326 -0.449 0.087
Somer-ton
-0.472 0.143 -0.592 -0.025
Wellton -0.675 0.543 -0.624 0.473
Yuma -0.563 -0.029 0.025 0.004
-70.0%
-50.0%
-30.0%
-10.0%
10.0%
30.0%
50.0%
70.0%
% of Change in Valuation of Permits Issued

17
BORDER CROSSINGS4th QUARTER FY2011-2012
% of Change in Crossings Apr 2011 to Apr 2012
Total Border Crossings Apr-12 Apr-11 % of Change
Private Vehicles 203,212 169,699 16.5%
Commercial Vehicles 2,953 2,612 12.0%
Pedestrians 207,697 219,534 -5.4%
% of Change in Crossings May 2011 to May 2012
Total Border Crossings May-12 May-11 % of Change
Private Vehicles 210,720 180,159 15.0%
Commercial Vehicles 2,800 3,030 -7.6%
Pedestrians 194,306 185,728 4.4%
% of Change in Permits Issued Jun 2011 to Jun 2012
Total Border Crossings Jun-12 Jun-11 % of Change
Private Vehicles 187,153 177,240 5.0%
Commercial Vehicles 2,191 2,485 -11.8%
Pedestrians 167,096 185,728 -10.0%
Apr 12' May 12' Jun 12'
Private Vehicles 203212 210720 187153
Commercial Vehicles 2953 2800 2191
Pedistrians 207697 194306 167096
25,000
75,000
125,000
175,000
225,000
Border Crossings Per Month4th Quarter 11'-12'

18
Apr May Jun0
50000
100000
150000
200000
250000
Border Crossing -Private Vehicles
Border Crossings Private Vehicles 10/11 FY
Border Crossings Private Vehicles 11/12FY
214,807211,703 219,346
168,391154,686
178,599
Apr May Jun0
500
1000
1500
2000
2500
3000
3500
Border Crossing -Commercial VehiclesBorder Crossings Commercial Vehicles 10/11 FYBorder Crossings Commercial Vehicles 11/12FY
4,167 3,755
4,328
3,7673,572
4,132
Apr May Jun0
50000
100000
150000
200000
250000
Border Crossing -PedestriansBorder Crossings Pedestrians 10/11 FYBorder Crossings Pedestrians 11/12 FY
271,0046256,437 293,958
219,897
235,222244,378
19
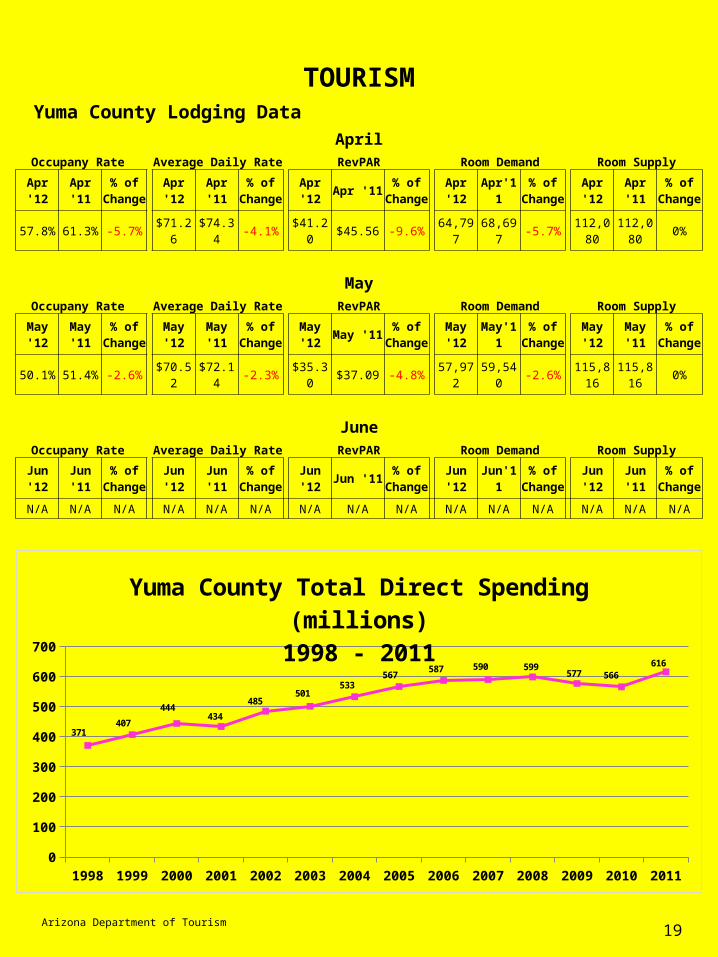
TOURISMYuma County Lodging Data
Arizona Department of Tourism
AprilOccupany Rate Average Daily Rate RevPAR Room Demand Room Supply
Apr '12
Apr '11
% of Chang
e
Apr '12
Apr '11
% of Chang
e
Apr '12
Apr '11% of
Change
Apr '12
Apr'11
% of Chang
e
Apr '12
Apr '11
% of Chang
e
57.8% 61.3% -5.7% $71.2
6$74.3
4-4.1%
$41.20
$45.56 -9.6%64,79
768,69
7-5.7%
112,080
112,080
0%
MayOccupany Rate Average Daily Rate RevPAR Room Demand Room Supply
May '12
May '11
% of Chang
e
May '12
May '11
% of Chang
e
May '12
May '11
% of Chang
e
May '12
May'11
% of Chang
e
May '12
May '11
% of Chang
e
50.1% 51.4% -2.6% $70.5
2$72.1
4-2.3%
$35.30
$37.09 -4.8%57,97
259,54
0-2.6%
115,816
115,816
0%
JuneOccupany Rate Average Daily Rate RevPAR Room Demand Room Supply
Jun '12
Jun '11
% of Chang
e
Jun '12
Jun '11
% of Chang
e
Jun '12
Jun '11% of
Change
Jun '12
Jun'11% of
Change
Jun '12
Jun '11
% of Chang
e
N/A N/A N/A N/A N/A N/A N/A N/A N/A N/A N/A N/A N/A N/A N/A
1998 1999 2000 2001 2002 2003 2004 2005 2006 2007 2008 2009 2010 20110
100
200
300
400
500
600
700
371407
444434
485501
533567
587 590 599577 566
616
Yuma County Total Direct Spending (millions)
1998 - 2011

20
TOURISMYuma County Travel Impacts
Arizona Department of Tourism
2000 2002 2004 2006 2008 2009 2010 2011pTotal Direct Travel Spending ($Million)Destination Spending 438.6 482.1 529.7 583.6 595.4 573.8 562.4 603.3Other Travel* 5.5 2.5 2.9 3.3 3.2 3.3 3.3 13.0Total Direct Spending 444 484.6 532.6 586.9 598.6 577.1 565.7 616.4
Visitor Spending by Type of Traveler Accommodation ($Million)Hotel, Motel 95.5 102.9 132.1 176.3 185.0 167.1 173.9 206.3Campground 57.3 57.9 64.6 68.4 66.9 59.1 55.9 65.7Private Home 76.9 68.4 91.9 103.1 101.7 95.5 104.6 109.1Vacation Home 33.8 35.5 38.8 43.3 48.3 46.5 48.5 51.2Day Travel 175.1 217.5 202.3 192.5 193.6 205.6 179.5 171.0Destination Spending 438.6 482.1 529.7 583.6 595.4 573.8 562.4 603.3
Visitor Spending by Commodity Purchased ($Million) Accommodations 32.2 33.4 40.8 56.1 58.7 54.1 53.2 60.9Food Service 72.5 77.2 90.8 104.1 107.5 110.5 112.4 117.5Food Stores 70.1 84.6 79.4 75.4 79.1 85.0 74.2 74.5Local Transportation & Gas 34.4 29.4 45.0 62.8 69.3 45.7 57.9 69.5Arts, Entertainment & Recreation 91.6 96.4 117.9 134.7 133.3 120.6 121.0 132.3Retail Sales 137.9 158.4 152.5 147.7 144.7 155.3 141.0 136.3Visitor Air Transportation 0.0 2.7 3.3 2.9 2.7 2.6 2.7 12.3Destination Spending 436.8 482.1 529.7 583.6 595.4 573.8 562.4 603.3
Industry Earnings Generated by Travel Spending ($Million)Accomodations & Food Service 32.8 34.7 41.4 49.7 56.0 58.3 55.4 66.4Arts, Entertainment & Recreation 33.9 35.2 43.2 51.5 52.7 49.1 48.8 51.4Retail** 30.1 34.9 34.0 34.4 35.1 33.9 29.4 30.4Ground Transportation 0.3 0.3 0.3 0.3 0.3 0.4 0.4 0.4Visitor Air Transportation 0.0 1.1 1.3 1.3 1.2 2.6 2.7 0.7Other Travel 2.4 1.2 1.3 1.6 1.6 3.2 3.2 1.2Total Direct Earnings 99.4 107.4 121.5 138.9 146.9 147.5 139.9 150.6
Industry Employment Generated by Travel Spending (Jobs)Accomodations & Food Service 2,110 2,091 2,350 2,630 2,700 2,760 2,530 3,060Arts, Entertainment & Recreation 1,500 2,120 2,270 2,450 2,110 2,000 2,130 2,190Retail** 1,320 1,390 1,240 1,270 1,240 1,190 1,020 1,030Ground Transportation 10 10 10 10 10 10 10 10Visitor Air Transportation 0 20 20 20 20 30 30 10Other Travel 60 30 30 30 30 50 40 30Total Direct Employment 5,000 5,650 5,920 6,410 6,110 6,040 5,770 6,330
Government Revenue Generated by Travel Spending ($Million)Local Tax Receipts 10.5 11.6 12.5 14.0 14.2 14.4 14.1 15.2State Tax Receipts 14.0 16.3 19.3 22.2 22.2 21.9 22.2 24.4Total Direct Government Revenue
24.5 27.8 31.7 36.3 36.4 36.3 36.3 39.6
Details may not add to totals due to rounding*Other Travel includes resident air travel and travel agencies. **Retail includes gasoline

21
GROWING AND DECLINING INDUSTRIESIn Yuma CountyGrowing Industries
Declining Industries
Year Ago Rank
Current Rank
NAICS Code Industry 2008-2011
Job Growth
- 1 1112 Vegetable and melon farming 372
1 2 9200 Government 344
6 3 5416Management and technical consulting services
150
- 4 6231 Nursing care facilities 146
- 5 2371 Utility system construction 106
9 6 6212 Offices of dentists 82
- 7 3323Architectural and structural metals mfg.
57
- 8 4482 Shoe stores 54
- 9 1111 Oilseed and grain farming 49
Year Ago Rank
Current Rank
NAICS Code Industry 2008-2011 Job
Growth
- 1 7222 Limited-service eating places -2,032
- 2 7221 Full-service restaurants -1,857
- 3 4244Grocery and Related Product Wholesalers
-626
2 4 2381Building foundation and exterior contractors
-339
1 5 2361 Residential building construction -235
- 6 6233Community care facilities for the elderly
-188
- 7 1113 Fruit and tree nut farming -179
9 8 4236 Electric goods merchant wholesalers -114
- 9 5324Machinery and equipment rental and leasing
-100
10 10 2389 Other specialty trade contractors -91
- 11 4452 Specialty food stores -60
Arizona Workforce Informer

22
Real Estate Market Snapshot
Yuma County Association of Realtors
Units Sold Apr '12 May '12 June '12
Total 4th Quarter
FY 2011/12
Total 4th Quarter FY 2010/11
% of Change FY 2011/12 vs
2010/11 Single Family 212 178 128 518 482 6.9%Condo 9 11 9 29 0 100.0%
Active Listings
Apr '12 May '12 June '12
Average 4th Quarter
FY 2011/12
Average 4th Quarter FY 2010/11
% of Change FY 2011/12 vs
2010/11 Single Family 1,012 1,012 1,012 1,012 1,150 -12.0%Condo 72 72 72 72 0 100.0%
Sales Pending
Apr '12 May '12 June '12
Average 4th Quarter
FY 2011/12
Average 4th Quarter FY 2011/12
% of Change FY 2011/12 vs
2010/11 Single Family 14 44 77 45 74 -39.2%Condo 0 1 4 3 0 100.0%
Average Price
Apr '12 May '12 June '12
Average 4th Quarter
FY 2011/12
Average 4th Quarter FY 2011/12
% of Change FY 2011/12 vs
2010/11
All Single Family Units Sold $123,490 $122,584 $121,958 $122,677
$124,642 -1.6%
2 or less Bedrooms $102,869 $81,867 $86,937 $90,558
$80,965 10.6%
3 Bedrooms $116,289 $107,877 $110,543 $111,570
$111,949 -0.3%
4 or more Bedrooms $158,513 $190,758 $157,133 $168,801
$175,842 -4.0%
Average Price
Apr '12 May '12 June '12
Average 4th Quarter
FY 2011/12
Average 4th Quarter FY 2011/12
% of Change FY 2011/12 vs
2010/11 All Condo Units Sold $90,649 $89,334 $95,956 $91,980 $0 100.0%
2 or less Bedrooms $103,333 $92,519 $93,840 $96,564
$0 100.0%
3 Bedrooms $84,307 $75,000 $98,600 $85,969 $0 100.0%4 or more Bedrooms $0 $0 $0 $0 $0 0.0%
Days on Market
Apr '12 May '12 June '12
Average 4th Quarter
FY 2011/12
Average 4th Quarter FY 2011/12
% of Change FY 2011/12 vs
2010/11 0-30 11 5 3 6 4 33.3%31-60 59 42 35 45 32 28.9%61-90 43 44 34 40 32 20.0%91-120 36 26 21 28 28 0.0%120+ 72 72 44 63 61 3.2%
Type of Financing
Apr '12 May '12 June '12
Average 4th Quarter
FY 2011/12
Average 4th Quarter FY 2011/12
% of Change FY 2011/12 vs 2010 /11
Cash 75 55 39 56 51 8.9%FHA 64 47 37 49 54 -9.3%Conventional 41 53 25 40 27 32.5%VA 21 20 23 21 18 14.3%Other 3 4 4 4 10 -60.0%CTL 0 0 0 0 1 -100.0%OWC 3 2 0 3 0 100.0%AOS 0 0 0 0 0 0.0%

23
Jul Aug Sep Oct Nov Dec Jan Feb Mar Apr May Jun0
50
100
150
200
250
111
99108
120127
151
121
145
161
182
157
143
135
163
126 127
155161
134
179171
212
178
128
Single Family Units Sold
10/11 FY 11/12FY
Jul Aug Sep Oct Nov Dec Jan Feb Mar Apr May Jun0
20000
40000
60000
80000
100000
120000
140000
160000
180000$158,070
$132,908 $129,411
$126,286$128,284 $126,743
$121,107 $116,657 $122,062$120,661
$135,144
$118,122$135,430
$120,355 $120,966$120,602 $115,655$113,593 $114,663$109,035
$80,527
$123,490 $122,584
$121,958
Average Price – All Single Family Units Sold
10/11 FY 11/12FY

24
Jul Aug Sep Oct Nov Dec Jan Feb Mar Apr May Jun0
2
4
6
8
10
12
14
4
11
9
10
9
13
12
11 11
5
9
6 6
7
11
7
8
13
9
11
9
Condo Units Sold
10/11 FY 11/12FY
Jul Aug Sep Oct Nov Dec Jan Feb Mar Apr May Jun$0
$20,000
$40,000
$60,000
$80,000
$100,000
$120,000
$140,000
$160,000
$124,875
$145,173
$127,735
$100,443
$89,356
$128,246
$107,575
$99,364
$78,550$65,880
$104,878
$81,333$85,833
$94,172
$82,205
$91,037$98,165
$82,205
$90,649 $89,334$95,956
Average Price – All Condo Units Sold
10/11 FY 11/12FY

25
All Information contained in this report has been obtained from one or more of the following sources:
Arizona Department of Revenue
Arizona Department of Tourism
Arizona Public Service
Arizona Workforce Informer
City of San Luis
City of Somerton
City of Yuma
Claritas Reports 2010
Town of Wellton
U.S. Census Bureau
Wellton-Mohawk Irrigation District
Yuma Association of Realtors
INFORMATION SOURCES