rural nonfarm employment and incomes in the eastern … · rural nonfarm employment and ... the...
TRANSCRIPT

Rural Nonfarm Employment and Incomes
in the Eastern Himalayas
Maja Micevska
University of Klagenfurt
and
Dil Bahadur Rahut
Center for Development Research, University of Bonn
Mailing address: Maja Micevska May 2007
Department of Economics
Klagenfurt University
Universitaetsstrasse 65-57
A-9020 Klagenfurt
Austria
Email: [email protected]

Rural Nonfarm Employment and Incomes
in the Eastern Himalayas
Abstract
Nonfarm activities generate on average about 60 percent of rural households’ incomes in the
eastern Himalayan region of India. This paper analyzes the determinants of participation in
nonfarm activities and of nonfarm incomes across rural households. We present and explore
an analytical framework that yields different activity choices as optimal solutions to a simple
utility maximization problem. A unique data set collected in the eastern Himalayas allows us
to closely examine the implications of the analytical framework. We conduct an empirical
inquiry that reveals that education plays a major role in accessing more remunerative
nonfarm employment. Other household assets and characteristics such as land, social status,
and geographical location also play a role.
Keywords: Nonfarm employment; Rural households; Incomes; Education; India
JEL Classification: O15; O18; Q12; R11

1
1. Introduction
Worldwide, rural households are engaged in a variety of nonfarm activities to
generate income (Lanjouw and Lanjouw 2001; World Bank 2003). This has spurred an
increasing interest in rural nonfarm employment, both among governments in developing
countries and within various international agencies. Recent research indicates that the rural
poor engage in nonfarm activities, both as a complement to their farm activities and as a
substitute for their farm incomes. In some cases, nonfarm employment may be a coping
strategy to deal with lack of access to sufficient land or with income shocks in agriculture. In
other cases, rural households may find it profitable to reduce their farming activities and
engage increasingly in nonfarm employment instead.
Amidst the mounting interest in nonfarm activities, this paper takes a comprehensive
view of the variety of sources of income that rural households in the eastern Himalayan
region of India rely upon. The focus is on understanding the determinants of participation in
nonfarm activities and of the levels of incomes derived from these activities by different
categories of farm households.1 In particular, the following research questions are of
paramount interest to us: (a) Why do rural households engage in rural nonfarm employment?
(b) What types of nonfarm employment opportunities are accessible to them? (c) What
should be the main focus of strategies aiming at getting rural households out of poverty?
Several contributions set this paper apart from the others in the literature. First, we
present and explore a novel analytical framework that yields different activity choices as
optimal solutions to a simple utility maximization problem. While many studies estimate
rural nonfarm participation, most of them fail to develop a clear conceptual basis for the
empirical analysis. Our analytical framework illustrates the role of the relative returns to farm
1 As in Dercon and Krishnan (1996) and Barrett et al. (2005), for instance, this study emphasizes the
significance of factors other than household’s behavior towards risk.

2
and nonfarm activities as well as of the entry-constraints as determinants of the optimal
pattern of activity choice.
Second, we use a unique data set collected in the eastern Himalayas to closely
examine whether empirical observations are in accordance with the implications of the
analytical framework. To the best of our knowledge, this is the first detailed survey
conducted to examine the livelihoods of rural households in the region.2 The choice of the
Himalayas as a study region is appropriate because, given the mountainous and isolated
terrain, households living in remote villages tend to divide their time among a large number
of distinct activities. Indeed, data from our survey show that nonfarm activities generate on
average more than 60 percent of rural households’ incomes.
Third, we conduct an empirical inquiry that distinguishes between more than a few
types of nonfarm employment, in particular between easy-entry, low-return activities and
difficult-entry, high-return activities. By using several different classifications of economic
activity, we provide a detailed and comprehensive picture of the labor allocation in a poor
society. To deal with the extreme heterogeneity of rural nonfarm activities, we use
aggregations into categories that are useful both analytically and for policy purposes. Our
results largely confirm previous work but considerably refine our understanding of the factors
influencing labor allocation of rural households. We find strong evidence that education plays
a major role in accessing more remunerative nonfarm employment. Other household assets
and characteristics such as land, social status, and geographical location also play a role.
As a by-product, our estimation approach also tests for effects of the caste system on
rural nonfarm employment. This is important given the dearth of empirical evidence in the
2 The eastern Himalayan region of India is ethnically, culturally, linguistically, socially, and historically distinct
from the rest of India.

3
area.3 The Indian government’s job reservation policies in favor of applications from persons
belonging to scheduled castes and scheduled tribes is an issue which arouses strong passions
in the Indian public. This paper provides insight into participation in nonfarm activities and
nonfarm incomes, taking into consideration the social status of rural households.
The remainder of this paper is organized as follows. In Section 2 we present a simple
analytical framework, which provides a conceptual basis for the empirical analysis. Section 3
presents details about our data set, sampling procedure, and main variables. Section 4
portrays the importance of nonfarm incomes across categories of rural households. In
Sections 5 and 6 we conduct an empirical inquiry of the determinants of participation in
nonfarm activities and of incomes derived from these activities. Robustness checks are
presented in Section 7. In Section 8 we present our concluding thoughts and reflect on policy
implications.
2. An analytical framework
We first seek to shed light on household’s activity choices by developing a simple
analytical framework. The labor can be allocated to agricultural production, and to different
nonfarm activities. For the sake of simplicity, we aggregate the nonfarm activities into a
single group,4 and analyze the choice between specializing in agriculture and activity
diversification. We denote the labor allocated to agricultural production as Lf and the labor
allocated to nonfarm activities as Ln. The returns, say per week, to agricultural production and
to nonfarm activities are denoted by Rf and Rn, respectively. We assume that Rn ≥ Rf for the
rural households to find it advantageous to engage in nonfarm employment.5
3 The study by Kijima and Lanjouw (2005) is among the very few that explore explicitly the relationship
between nonfarm employment and caste status. 4 The model can be easily extended to include several nonfarm activities.
5 One reader to an en earlier version raised the possibility that this assumption could be valid only with reference
to a particular point in time due to the significant seasonality of most agricultural activity. While this possibility

4
Let the utility function of the household be
)0( >−+= nffnn LSLRLRu (1)
where S denotes an entry-constraint to the nonfarm employment which the household may
encounter in case of activity diversification. This assumption reflects the perception and the
empirical evidence that, in general, it is difficult for rural households to enter better
remunerated types of nonfarm employment because of the need for special skills, the lack of
capital for investment as well as limitations related to location (Dercon and Krishnan 1996;
Collier and Gunning 1999). The costs of overcoming the entry-constraint, S, reduce the value
of nonfarm earnings and the household’s utility.
We normalize the household’s labor endowment, fn LLL += , as N, where N is the
number of adult household members. We thus rewrite the household’s utility function as
follows
)0()( >−−+= nnfnn LSLNRLRu (2)
We further assume that
ρδ nLS = (3)
should be kept in mind when analyzing our analytical framework, the purpose of the framework is to motivate
the econometric analysis, which is based on annual data.

5
where ρ > 1. We model the entry-constraint, S, as a function of labor based on the assumption
that overcoming a constraint is labor-intensive.6 For instance, a household member might
need to invest a significant amount of labor to attain the education level necessary to enter
high-return nonfarm activities. Alternatively, some of the household members might engage
in migration in order to accumulate savings that the household would use to overcome capital
constraints to entrepreneurship.7 When labor is allocated to overcoming a constraint, the
household bears costs that reduce the household’s utility. Since the cost of overcoming the
entry-constraint may differ across households, δ is assumed to be a random variable with a
probability distribution over the domain [ ]δδ , .
We assume that the cost of overcoming the entry-constraint rises in the amount of
labor allocated to that purpose and that it becomes increasingly difficult for the household to
uphold this type of labor allocation as its amount increases (i.e., we assume that ρ > 1). This
assumption merits some reflection. For example, as suggested by our empirical analysis in
Section 5, a key constraint to participation in more remunerative nonfarm activities is
education. When a family decides whether or not to enroll a child in school, the decision is
influenced by its ability to cover education-related costs and by the opportunity cost of
attending school.8 Whereas elementary education is mandated in India, high school education
is neither compulsory nor heavily subsidized. High school tuitions can be a substantial share
of household income, and poor families may be unable to enroll children in school.9 Thus,
6 We do not try to model the underlying dynamics of capital accumulation. That type of modeling is provided in
Dercon (1998). 7 Studying and migration entail diversion of the student’s or the migrant’s time away from household production
activities. Modeling the costs of overcoming a constraint in labor- or time-equivalent units is usual in the
literature (see, for instance, Chiquiar and Hanson 2005; Stark et al. 2006). 8 See Glewwe and Jacoby (1998) and Rosenzweig (2003), for the trade-off between the short-run benefits of
wage employment to poor households who potentially face credit constraints and the long-run benefits
associated with educational investment. 9 Tilak (2002) argues that that there is nothing like "free" education in India. Household expenditures on
education are sizeable. Households from lower socioeconomic backgrounds (scheduled castes/tribes and other
low-income groups) spend considerable amounts on acquiring education.

6
households face increasing costs in acquiring higher education in terms of higher tuition,
higher input costs (textbooks and other supplies), more competitive examinations, larger
distances from home to school, and other costs associated with schooling.10
Upon inserting (3) into (2), we get that the household’s utility is
ρδ nnfnn LLNRLRu −−+= )( (4)
Note that a standard utility formulation depicts the conflict between the unpleasant allocation
of labor aimed at overcoming a constraint and the consequent pleasure derived from a higher
income (the last and first terms of the right-hand side of (4), respectively).
Assume that the optimal solution to (4) is interior. Upon solving for the first-order
condition, we get that the optimal choice of nL is
1
1
*−
−=
ρ
ρδ
fn
n
RRL (5)
Since 0≥− fn RR , 0* ≥nL . If Rn = Rf, 0* =nL , in which case the household does not find it
advantageous to engage in nonfarm activities and specializes in agricultural production. In
this case, the household’s utility is
ff NRu ≡* (6)
10
One concern is the possibility of non-convex cost of overcoming entry-constraints due to, for instance,
economies of scale in children education. We recognize that it is not clear that the cost would be convex for
educating two children versus one child up to primary education. While we believe that the assumption of
convex cost of overcoming entry-constraints is realistic in the context of the Indian rural nonfarm sector, we are
not aware of any empirical study that would support this assumption. These considerations could gainfully
feature in our future research.

7
Activity diversification occurs if and only if Ln takes an interior solution, i.e., if and
only if
11
1
* <
−=
−ρ
ρδ
fn
n
RRL (7)
or
*δρ
δ ≡−
>fn RR
(8)
Thus nonfarm employment occurs if and only if *δδ > . Inserting (7) into (4) and rearranging
yields
f
fn
d NRRR
u +
−−≡
−1
1
*)(
)1(ρ
ρ
ρ
δρρ (9)
On the other hand, if *δδ = the household will choose to specialize in nonfarm
employment rather than to diversify the activities. In this case, upon inserting NLn = into
(4), we get that the household’s utility is
ρδNNRu nn −≡* (10)
The analytical framework illustrates the role of *δ as a determinant of the optimal
pattern of activity choice under constraints. Since *δ is a function of the returns to nonfarm
activities relative to the returns to agricultural production as well as of the costs of

8
overcoming the entry-constraint, it follows that these two factors are the key determinants of
labor allocation. We then have the following implications. Relatively high returns to labor in
nonfarm employment (or relatively low returns to labor in agriculture) will drive households
towards diversification. Yet, a household willing to diversify might not always have the
capacity to do so. If the costs of overcoming the entry-constraints are too high, the household
will specialize in agriculture even if a more diversified portfolio is wanted. Furthermore, the
returns to labor in nonfarm activities might be so low that households are not willing to
include them in their activity portfolios.
3. Data and variables
The data come from a survey conducted in the second half of 2004. The survey was
based in the eastern Himalayan region of India, in the states of Sikkim and West Bengal.11
The region is largely agrarian, based on traditional farming methods and terraced slopes.
Because of the hilly terrain and lack of reliable transportation infrastructure, there are no
large-scale industries.
As a first step, the region was divided into two main blocks: rural Darjeeling Gorkha
Hill Council in the state of West Bengal12
and rural Sikkim. Gram Panchayats were randomly
selected in each block.13
The selected Gram Panchayats were further divided into 4-6 villages
and 5-8 households were randomly selected from each village. This sampling procedure
yielded a sample of 520 households. The survey provided information on farm and nonfarm
activities, income sources, income levels, demographic characteristics, employment status,
11
The survey was carried out within a large-scale project designed to examine the livelihood of rural
households. The project was financed by the German Corporation for Technical Cooperation (GTZ). 12 We have taken into consideration only the highland areas of the Darjeeling Gorkha Hill Council. Villages
involved in the production of Darjeeling tea were excluded from the analysis. A few politically unstable rural
areas were also avoided. 13
Gram Panchayats are local government bodies in India. In Sikkim, Gram Panchayats were selected from all
four districts (North, South, East, and West).
9
asset holdings, credit access, as well as other attributes of the households and of the
household members. A one-year recall period was used and no effort was made to capture
seasonality in income patterns.14
An implication from our analytical framework is that relative returns to labor in
nonfarm employment are an important determinant of households’ activity choices. It is
therefore important to have data on the levels of nonfarm incomes from various sources. The
Indian National Sample Survey Organization (NSS) has been carrying out all-India
household surveys in quinquennial rounds.15
However, the NSS surveys capture just the
participation in various activities and do not contain quantitative data on household incomes.
These surveys are thus inapt for gauging the extent of dependence of the population on
particular sources of income. Our survey focused on collecting reliable data on both the
participation in nonfarm activities and the levels of incomes derived from these activities.
This allows us to use several different classifications of economic activity as well as to
provide a detailed and comprehensive picture of the labor allocation and incomes of rural
households.
To construct a measure of farm income, we begin with the value of all crops and
animal products marketed in the last year. To this we add the implicit income earned from
subsistence production imputed at local prices. From the total value of farm product, we then
subtract expenditures on seed, fertilizer, livestock, maintenance of machinery, hired labor,
rent paid to landlords, and the like. Nonfarm income is an aggregate measure of wage income
and self-employment income. Income from wage work includes payment in kind and income
from self-employment is net of business expenses.
14
It should be mentioned that, as in most studies, recall errors are likely to have affected reported income. 15 The sixth such survey was conducted in the 55th round (July 1999 - June 2000).

10
The demand for farm labor by households is measured by the farm size. We expect
households who inherit a lot of land to be less likely to work off-farm. Previous studies on
rural nonfarm employment have assumed exogeneity of land endowments since land markets
in developing countries barely function and are generally quite thin. In the present study, to
alleviate the endogeneity problem we consider just the inherited land. The supply of labor by
households is captured by the number of men and women of prime-working age (15-65 years
old). We include male and female adults separately because they might have different
comparative advantages. The dependency ratio in the household is measured by the number
of children younger than 15 years and of adults older than 65 years.
Level of education within the household is measured in different ways. We use the
years of education of the household head, the average education of adult males and females,
and the highest level of schooling completed by adult males and females.16
In addition, to
account for nonlinearity of educational effects we divide the households into several
categories according to the highest level of education attained by adult members: uneducated,
less than primary education (less than 5 years of education), completed primary (between 5
and 9 years), matriculation (between 10 and 11 years), completed high school (between 12
and 14 years), and tertiary education (15 or more years of education). We regard results about
educational effects as robust when they are present in all formulations.
Intergenerational effects might play a role for participation in nonfarm employment.
In our estimations, we consider whether a parent of the household head was engaged in a
more remunerative nonfarm activity (i.e., skilled job or small business). Including this
variable should reduce fears that observed correlation between education and nonfarm
activities in fact captures family background. For instance, individuals whose parents were
16
Children education is ignored because it is less likely to affect activity choices, but more likely to be
influenced by them through income.

11
employed in high-return nonfarm activities probably received more exposure to the nonfarm
sector or they might be better educated. Thus if family background is not controlled for,
education variables may capture the effect of exposure to nonfarm activities, not that of
education itself (Fafchamps and Quisumbing 1999).
Ethnicity may also play an important role in determining participation in nonfarm
activities (de Janvry and Sadoulet 2001). Since the majority of the households are of Nepali
ethnic origin and speak Nepali, we control for social status instead.17
We divide the
households into three groups. The first group consists of households that belong to scheduled
tribes and scheduled castes (the lowest caste). These households have preferential treatment
in public employment and reservation of seats in provincial and central legislatures.18
The
second group consists of households that belong to other backward classes and have certain
preferential treatment in public employment, but to a lesser degree compared to the first
group. The rest of the households are classified as a general category.19
In our empirical analysis, we control for locational characteristics. Ease of access to
market is measured by the time required to reach the nearest market. Given the mountainous
terrain, mileage is not a relevant measure for most of the region; travel time is a more
accurate measure in this case. Inter-regional disparities are captured by classifying the
households into two categories according to the regional location: Sikkim and West Bengal.
While both regions are largely agrarian, Sikkim has a more dynamic and diverse economy.20
A dummy variable for residence in Sikkim also accounts for differences in the agricultural
17 Other languages spoken in the region include Bhutia, Dzongkha, Groma, Gurung, Lepcha, Limbu, Magar,
Majhi, Majhwar, Newari, Rai, Sherpa, Sunuwar, Tamang, Thulung, Tibetan, and Yakha. 18
For a detailed description of the social system and caste-based preferential policies in India, see Gallanter
(1984) and Osborne (2001). 19 As noted by Borooah et al. (2005), if one were to establish a hierarchy of communities in terms of the
“desirability” of the economic status, scheduled castes/scheduled tribes would lie at the bottom, the general
category Hindus would be at the top, and the other backward classes would be in the middle. 20
Sikkim has had an impressive growth rate of 8.3 percent, which is the second highest in the country after
Delhi.

12
potential, institutional arrangements, infrastructure, prices, and other unobserved region-
specific characteristics.
Finally, to investigate the role of external financing in nonfarm self-employment, we
include in some estimations the following independent variables: a dummy variable
indicating if the start-up investment included external financing and the share of the external
financing in the start-up investment.
4. The importance of nonfarm incomes
Data from our survey show that nonfarm activities generate on average about 60
percent of rural households’ incomes (Table 1).21
Nonfarm incomes are larger than
agricultural incomes. Skilled wage employment is the most remunerative source of nonfarm
income. The detailed sectoral breakdown suggests that, in terms of returns, services dominate
nonfarm activity and contribute on average more than 30 percent to total household income.
The share of nonfarm wage income (45 percent) in total income by far exceeds the share of
nonfarm self-employment income (14 percent). This result is consistent with findings
reported by Reardon, Berdegué, and Escobar (2001) for Latin America, suggesting the need
for more attention to wage employment, versus the traditional focus on self-employment.
[TABLE 1 HERE]
While farming is the main activity of the sample, about 73 percent of the households
engage in nonfarm activities. Only 25 percent of the households engage in nonfarm self-
employment, while 58 percent engage in nonfarm wage employment. It is worth noting that
21
Rural nonfarm income averages approximately 40 percent of rural incomes in Latin America, 45 percent in
Africa, and 35 percent in Asia (Reardon et al. 2001).

13
both nonfarm self-employment and nonfarm wage employment are quite heterogeneous. In
nonfarm self-employment, retail dominates over brewing and manufacture. Nonfarm
unskilled wage employment takes mainly the form of construction work, road labor, and
other poorly-paid manual labor. Teaching, work for the government, and transportation are
the main activities within the nonfarm skilled wage employment.
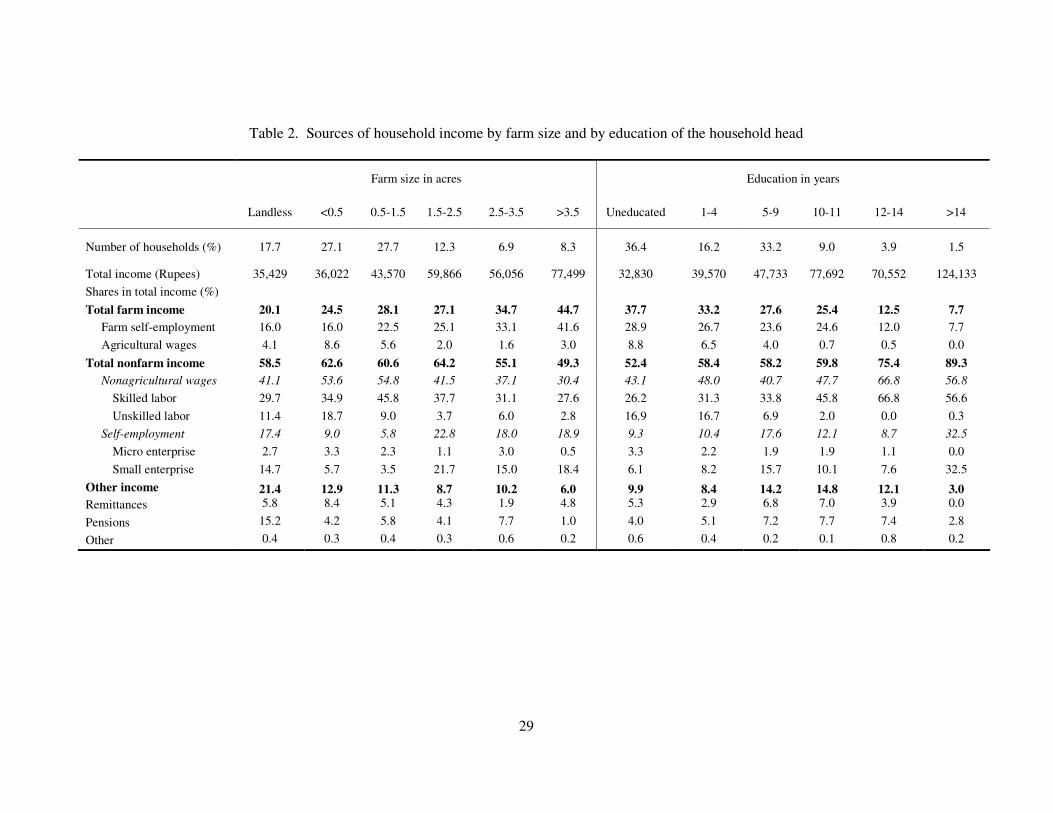
Table 2 shows the sources of income for households classified by farm size and by
education of the household head. Nonagricultural incomes are larger than agricultural
incomes across all categories of rural households, indicating that nonfarm activities are very
important for all households.
[TABLE 2 HERE]
As expected, the share of income derived from farm activities is relatively more
important for households with larger farms.22
Households with fewer land assets tend to have
higher shares of total household income generated by nonfarm activities. Hence, the
opportunity to participate in nonfarm activities seems essential for the land-poor, especially
the opportunity to participate in nonagricultural wage labor. On the other hand, incomes
derived from nonagricultural self-employment do not seem to differentially compensate for
lack of access to land.
The role of education in accessing both nonfarm wage labor and nonfarm self-
employment is quite clear. Households with a better educated household head derive larger
shares of income from nonfarm activities, particularly from skilled wage labor and from self-
employment in small enterprises.23
Households with lower educational levels obtain
22
The landless households derive income from farm self-employment by engaging in sharecropping and by
raising livestock. 23 Enterprises requiring investment of at least 5,000 Rupees were classified as small.

14
relatively larger share of income from farm activities, participation in nonagricultural
unskilled wage labor, and self-employment in micro enterprises.
We conclude this section by observing that there seem to be specific requirements to
access the more remunerative nonfarm activities which the land-poor and the unskilled are
not well placed to meet. That is, households poor in land and in education appear to be
involved mainly in nonfarm activities with less entry-constraints. Hence, it is important to
explore further the determinants of access to different types of nonfarm employment.
5. Participation in nonfarm activities
We now analyze participation by rural households in nonfarm activities. According to
the analytical framework discussed in Section 2 (equation 8), household’s occupation choice
is a function of the cost of overcoming the entry-constraint and of the returns to farm and
nonfarm activities. Equation (8') summarizes this theoretical result in its testable form
−−
−=
−
− −1
1
* 1 ρ
ρδδ
δδδδ
δδ fn RR (8')
It is important to note, however, that our empirical analysis does not aim at estimating
the structural theoretical model.24
Because the cost of overcoming the entry-constraint is not
observable, we include factors that influence labor supply when markets are imperfect, such
as: the asset position of the household, the household size and composition, and the locational
characteristics of the community where the household is located (Table 3). Household assets
24 Such estimation would require much more information. We would need to know the distribution of δ, on
which we have no information. In addition, although equation (8') implies a non-linear relationship, we assume
linearity to make estimations simpler. If we had the necessary data, the Generalized Method of Moments
(GMM) would be an appropriate method for the estimation of equation (8'). This would then allow us to test for
possible misspecifications because of an incorrect structural form.

15
are classified as human capital, land, intergenerational effects (if parents of the household
head were engaged in high-return nonfarm activities), and social status (if the households is a
member of a scheduled caste/scheduled tribe, other backward class, or if it belongs to the
general category). Village fixed effects are included to control for systematic differences
across villages due to market conditions, literacy rates, and the supply of nonfarm jobs.
[TABLE 3 HERE]
We start by estimating a probit model of participation in nonfarm employment. The
estimates in the first column of Table 3 imply that the average education of working-age
males is positively associated with participation in nonfarm activities, while land assets and
being a general-category household lower the probability of participation. As discussed
above, these results do not provide a detailed and comprehensive picture of the labor
allocation of rural households because of aggregation of the different types of nonfarm
activities in the dependent variable.
An implication from our analytical framework is that relative returns to labor in
nonfarm employment are an important determinant of households’ activity choices. To
explore this implication, we classify the nonfarm activities into two main types: easy-entry,
low-return activities (unskilled wage labor and micro enterprise) and difficult-entry, high-
return activities (skilled wage labor and small enterprise).25
Easy-entry, low-return activities
typically require no particular skills and little or no investment. These mainly include: road
and construction labor, cleaning services, weaving, brewing, road-side and weekly-market
vendors, and firewood collection. Difficult-entry, high-return activities usually require certain
25
Möllers and Buchenrieder (2005) use the term “demand-pull” to describe a situation in which those employed
in agriculture take advantage of more remunerative nonfarm employment opportunities, and the term “distress-
push” to describe a situation in which insufficient agricultural incomes and other factors push rural households
into poorly paid nonfarm employment.

16
skills and, in the case of small-enterprise self-employment, an investment higher than 5,000
Rupees. The main types of employment within this group are: teaching, civil service, police
and health services, engineering, rice mills, groceries, cash crop trade, and transportation.
Results in columns 2 and 3 of Table 3 show that education plays prominent and
differential role across low-return and high-return nonfarm activities. Higher educational
levels of both males and females enable participation in the more remunerative nonfarm
employment opportunities. In contrast, for low-return non-farm activities, education of both
males and females has a negative effect on the participation decision. These results show that
the better educated males and females opt out of the less remunerative nonfarm sector. Larger
labor supply by the household is associated with higher probability of participation in the
high-return nonfarm sector, as larger households benefit from returns to scale in household
chores and can more easily let some members engage in nonfarm work.26
This is true for both
males and females, hence suggesting that women do not seem to play marginal role in
market-oriented activities. Households that are members of scheduled castes/tribes or that
belong to the general category participate less in low-return activities compared to
households that are members of other backward classes (the reference group for social
status). This result suggests that the job reservation policy for the scheduled castes/tribes
could have benefited households from these groups in the sense of allowing them to depend
less on participation in the low-return nonfarm sector.
We proceed by reclassifying the nonfarm activities into wage employment (unskilled
and skilled wage labor) and self employment (micro and small enterprises).27
It is important
to differentiate between these two distinct types of economic activity, since self-employment
income includes returns to entrepreneurship and capital whereas wage income does not.
26
Dercon and Krishnan (1996) also find that a higher income-earning capacity, in terms of more male labor,
allows households to take up high-return activities. 27
Micro enterprises involve little or no investment. Enterprises requiring investment of at least 5,000 Rupees
were classified as small.

17
Columns 4 and 5 of Table 3 report that the mean education of males increases the probability
of participation in both nonagricultural wage labor and nonagricultural self-employment
activities. Intergenerational effects are important for participation in self-employment,
suggesting that the occupational effect on the propensity to engage in self-employment
carries over across generations (Fafchamps and Quisumbing 2003).
To extend the analysis even further, we present estimates of participation in the four
nonfarm activities: micro enterprise, small enterprise, unskilled wage labor, and skilled wage
labor (columns 6-9 of Table 3). Clearly, education is a key factor in determining participation
in nonfarm activities, particularly participation in the more remunerative activities.28
Results
show that education has no differential role across genders in accessing different types of
nonfarm employment. Households with higher average education of both males and females
participate more in self-employment in small enterprises and in remunerative wage
employment that requires certain skills. In contrast, these households participate less in
unskilled wage labor. Education has no role to play in access to self-employment in micro
enterprises, possibly because the products of these enterprises are for local consumption and
use traditional technologies.
A distinctly opposite age pattern can be observed in participation in micro-business
and small business self-employment. In the case of micro-business self-employment, the
likelihood of participation decreases with age, dips at 41 years, and then increases. On the
other hand, the likelihood of participation in small-business self-employment first rises with
age, peaks at 41 years, and then declines. Household labor supply tends to raise participation
in skilled wage labor. Land assets reduce the probability of participation in micro-business
28
A possible criticism of our estimates is the simultaneity between education and participation in nonfarm
employment. To alleviate the endogeneity problem, we take into consideration only the education of working-
age males and females, and exclude the household members who are currently undergoing education. We
conducted a test of weak exogeneity of education and found evidence supportive of the exogeneity assumption.

18
self-employment. A possible explanation for this finding is the higher marginal productivity
of farm labor compared to the marginal productivity of labor in micro enterprises.
Households with more children seem to be confined to self-employment in micro
enterprises, while intergenerational effects are important for self-employment only in small
enterprises. Households that are members of scheduled castes/tribes or that belong to the
general category are less likely to participate in unskilled wage employment. This again
suggests that members of other backward classes, being deprived of preferential treatment in
employment under the job reservation policy, are pushed into unskilled, low-return wage
employment. Regional location also matters as it affects the supply of opportunities.
Compared to West Bengal, there is more participation in skilled wage labor in Sikkim. Thus,
households located in the Darjeeling Gorkha Hill Council in the state of West Bengal, a
region with a less dynamic economy and lower supply of nonfarm income opportunities,
seem to be ill-placed for accessing lucrative salaried and wage employment.
To get further insights, we analyze the determinants of the intensity of participation
(Table 4), defined as the share of income from a particular nonfarm activity in the total
household income. Since the dependent variable is bounded between 0 and 1, the equations
are estimated as Tobits.29
[TABLE 4 HERE]
The findings in Table 4 reinforce those of Table 3. The most remunerative
employment opportunities are captured by those with the higher educational levels. The
beneficial effect of education accrues to both males and females. Land assets decrease the
29
We also performed two alternative estimations: (i) we first transformed the bounded dependent variable into
an (positive) unbounded variable and then applied the OLS estimator; and (ii) we applied the Censored Least
Absolute Deviations (CLAD) estimator. The results of the two alternative estimation methods have similar
qualitative implications as the Tobit estimates.

19
intensity of participation in unskilled wage labor and in micro-business self-employment, as
labor is reallocated to the farm. Taken together, our results indicate that the key determinants
of the intensity of participation in nonfarm employment are education and inherited wealth
(land): these regressors account for most of the variation in the intensity of participation as
more educated households are likely to farm less, while those with more inherited wealth
tend to farm more. As in Fafchamps and Shilpi (2005), proximity to markets is associated
with higher intensity of participation in small-business self-employment. This result suggests
that households with better access to market are in a better position to overcome factor
market constraints and develop private initiatives that make running small enterprises more
attractive by taking advantage of returns to scale. Social status and geographical location
display similar effects as in the participation equations.
We thus conclude that household assets, household characteristics, and locational
characteristics all play a role in explaining participation in nonfarm activities. Key among the
determinants of participation in nonagricultural employment are education (with higher
rewards to higher levels of education), household labor supply (positively for high-return
activities), land assets (negatively), intergenerational effects (positively for self-employment),
social status (negatively for other backward classes), and regional location (with deficits in
opportunities for households in West Bengal).
6. Determinants of nonfarm income
To understand why some households are better able to derive income from specific
nonfarm activities than others, we now turn to an analysis of the determinants of household
income by source (Table 5). Since not all households derive income from nonfarm activities,

20
the income equations are estimated using the two-step Heckman selection model.30
Following
Fafchamps and Quisumbing (1999), family background variables – inherited land and a
dummy variable indicating if parents of the household head were engaged in high-return
nonfarm activities – are used as identifying restrictions.31
The income equations in the second
stage are estimated in logs.
[TABLE 5 HERE]
Incomes from different nonfarm activities increase with age, but at a decreasing rate
indicating what to expect as a life cycle matures. When the household head is a man, the
household derives significantly more income from low-return activities, in particular from
unskilled wage labor. This result is not surprising given that working as an unskilled laborer
is often a strenuous activity for which returns to physical strength are high. Higher number of
working-age males and females adds significantly to incomes from skilled wage labor and
from small-business self-employment, hence suggesting that larger households can extract
larger incomes from high-return nonfarm activities by diverting family labor from agriculture
into the nonfarm sector.
The educational level of adults in the household affects income strategies. Education
of both males and females increases earnings from high-return activities, especially from
skilled wage labor. The strongest result concerns the effect of male education on nonfarm
incomes: one additional year of education leads to 13 percent, 16 percent, and 18 percent
30
The absence of correlation between the errors in the selection and income regressions is rejected for all
regressions except for low-return nonfarm activities and unskilled wage labor. A selection correction is thus
appropriate. 31
We also experimented with a longer list of identifying restrictions. For instance, instead of village dummies in
the first-step estimations we included the psychical characteristics of the village: the log of the arable land area,
the log of the distance to the nearest river, its mean elevation, and rainfall. Results were insensitive to the choice
of identifying restrictions.

21
more income from nonfarm activities in general, high-return nonfarm activities, and skilled
wage employment, respectively. 32
Interestingly, micro-business self-employment, as it is
quite heterogeneous, provides opportunities for men with higher education to increase
income. The coefficient on female education is also positive and highly-statistically
significant: one year of schooling is estimated to raise nonfarm income by 7 percent. In the
case of small business self-employment, an additional year of female education increases
earnings by 15 percent.
Household with more members older than 65 years derive higher incomes from
unskilled wage labor.33
Geographical location affects specific sources of income, even after
controlling for the differential asset positions of households. In Sikkim, incomes derived from
skilled wage employment are higher, while incomes from micro-business self-employment
are lower, indicating the importance of regional opportunities for nonfarm employment.
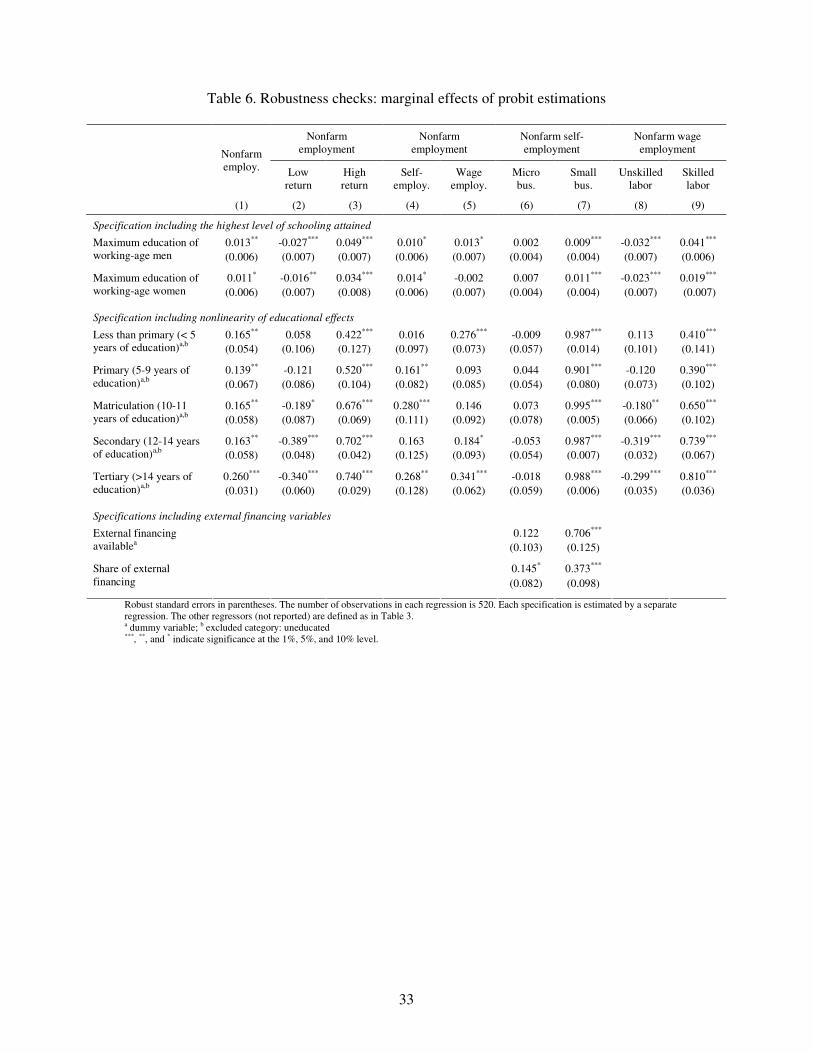
7. Robustness checks
In this section, we report estimates from alternative specifications designed to probe
the robustness of the main results reported in the preceding sections. For space
considerations, we present only selected estimates.34
An implication from our empirical analysis is that education is a key determinant of
success in participation in the more remunerative nonfarm activities. To check the robustness
of this result, in the top panel of Table 6 we present an alternative specification in which
education is measured as the highest level of schooling completed by an adult male and an
adult female member of the household. The estimates are qualitatively similar to the
32 The estimated returns to education in the nonfarm sector are much higher than, for instance, estimates for
rural Pakistan (Fafchamps and Quisumbing 1999). 33
For the most part, this is because in poor households the older household members usually continue to work
as unskilled laborers beyond the age of 65 years. 34 The complete regression tables are available from the authors upon request.

22
corresponding estimates in Table 3: schooling has a positive impact on participation in the
nonfarm sector and especially on participation in the high-return nonfarm employment.
[TABLE 6 HERE]
In the middle panel of Table 6 we present a specification where the probability of
participation in nonfarm employment is not linear in years of schooling. Compared to
households with no education, those which members have completed some education
participate more in the nonfarm sector. As in Lanjouw (2001), there is a strengthening effect
of education on the probability of nonfarm employment as education levels improve. For
those who went beyond primary education, gains are the greatest: they have a significantly
higher likelihood of participating in remunerative nonagricultural employment. Education has
a negative impact on participation in low-return activities, particularly at the highest
educational levels (more than eleven years of schooling). Interestingly, the effect of education
on participation in small-business employment is strongly positive, independent of the level
of schooling.
We conclude this section by reporting estimates of the effect of availability of
external financing on the probability of participation in nonagricultural self-employment.
Results in the bottom panel of Table 6 show that the availability of external financing for
start-up investment (measured both as a dummy variable and as a share in the start-up
investment) raises the probability of participation in small-business self-employment and
does not significantly affect the probability of involvement in micro-business self-

23
employment. This suggests that access to credit could be important only for entry into small-
business self-employment.35
8. Conclusions
Nonfarm activities play important role in the determination of rural households’
incomes in the eastern Himalayas. On average, nonfarm income accounts for about 60
percent of total household income. Services dominate the rural nonfarm activities, and the
shares of nonfarm wage income exceed the shares of nonfarm self-employment income
across all categories of rural households. This suggests the need for more attention to the
service sector and to wage employment, versus the traditional focus on rural manufactures
and self-employment. While the majority of households do diversify their activities, access
to high-return nonfarm activities might be limited in terms of special skills or access to assets.
Indeed, the evidence presented in this paper clearly points to the fact that those with low
education and with little access to land are mainly involved in low-return nonfarm activities.
Investment in agricultural productivity growth is certainly important for poverty
reduction in rural areas. Nevertheless, the growth of the rural nonfarm sector could be an
important complement to investments in agricultural productivity. Empirical evidence shows
that the growth of the nonfarm sector in India is particularly pro-poor (Ravallion and Datt
2002; Foster and Rosenzweig 2004).36
Our analysis suggests that a particularly important
challenge is to increase the access of the poor to nonfarm activities that yield high and stable
incomes, and thus present a potential basis for upward income mobility.
35
We are careful to avoid suggesting a clear casual relationship between the availability of external financing
and the entry into small-business self-employment. Since our measures of the availability of external financing
are arguably endogenous, we are not in the position to establish the causal relationship rigorously. 36
Ravallion and Datt (2002) emphasize that the nonfarm growth was more pro-poor in states with initially
higher literacy, higher farm productivity, higher rural living standards, lower landlessness, and lower infant
mortality.
24
A key determinant of participation in more remunerative nonfarm activities is
education. Hence, education is an important advantage to alleviate poverty if nonfarm
activities are to compensate for asset disadvantages. Getting rural households out of poverty
requires investments in rural education, as well as efforts to increase access of the rural youth
to schooling and to prepare them to access well-remunerated nonagricultural employment.
This is particularly important if the expanding nonfarm sector increasingly favors
employment that requires skill and education. Of course, raising the capacity of the poor to
participate in the better-paid nonfarm activities via education will be effective only if the
overall business environment is favorable and if the job creation is on the rise.
The number of adult females in the household and female education affect labor
allocation in systematic fashion, which indicates that women do not play marginal role in the
nonfarm sector. The relatively equal results regarding human capital across gender probably
explain the relatively low gender gap in the education in the region.37
A policy implication is
that, using nonfarm employment as sole criterion, female education does not seem to be a
wasted investment in the Eastern Himalayas. In addition, advanced education could make
women more financially independent as less emphasis is put on unpaid work on the family
farm.
Households that belong to scheduled castes/tribes or that belong to the general
category are less likely to participate in unskilled wage labor compared to households that are
members of other backward classes. This suggests that households that belong to other
backward classes find themselves in unfavorable conditions relative to other households
when it comes to accessing high-skilled wage employment. Job reservation has been seen as
the most important of the public concessions towards scheduled castes/tribes in India and
37
Data from the 55th
round of the Indian NSS show that Sikkim and West Bengal have a lower-than-average gap
between male and female literacy.

25
there is demand to extend reservation to persons who belong to other backward classes. Our
results suggest that if the job reservation policy is to be extended beyond the scheduled
castes/tribes, then households from the other backward classes may have a strong case.
Finally, regional location affects specific sources of income. In the highlands of West
Bengal, participation in and incomes derived from nonfarm employment are lower than in
Sikkim. Clearly, focusing on the household determinants of access to nonfarm employment
would not be sufficient. If nonfarm activities are to serve as a factor of a poverty reduction
strategy in West Bengal, addressing the factors that can enhance the availability of nonfarm
income opportunities for rural households should be a part of efforts at promoting regional
development.
26
References
Barrett, Christopher B., Mesfin B. Clark, Daniel C. Clay, and Thomas Reardon. 2005.
“Heterogeneous Constraints, Incentives and Income Diversification Strategies in Rural
Africa.” Quarterly Journal of International Agriculture 44(1): 37-60.
Borooah, Vani K., Amaresh Dubey, and Sriya Iyer. 2005. “Has Job Reservation Been
Effective? Caste, Religion, and Economic Status in India.” Unpublished manuscript,
University of Ulster, School of Economics and Politics.
Chiquiar, Daniel, and Gordon H. Hanson. 2005. “International Migration, Self-Selection, and
the Distribution of Wages: Evidence from Mexico and the United States.” Journal of
Political Economy 113(21): 239-81.
Collier, Paul, and Jan W. Gunning. 1999. “Explaining African Economic Performance.”
Journal of Economic Literature 37(1): 64-111.
de Janvry, Alain, and Elisabeth Sadoulet. 2001. “Income Strategies among Rural Households
in Mexico: The Role of Off-Farm Activities.” World Development 29(3): 467-480.
Dercon, Stefan. 1998. “Wealth, Risk and Activity Choice: Cattle in Western Tanzania.”
Journal of Development Economics 55(1): 1-42.
Dercon, Stefan, and Pramila Krishnan. 1996. “Income Portfolios in Rural Ethiopia and
Tanzania: Choices and Constraints.” The Journal of Development Studies 32(6): 850-
875.
Fafchamps, Marcel, and Agnes R. Quisumbing. 1999. “Human Capital, Productivity, and
Labor Allocation in Rural Pakistan.” Journal of Human Resources 34(2): 369-406.
_______________. 2003. “Social Roles, Human Capital, and the Intrahousehold Division of
Labor: Evidence from Pakistan.” Oxford Economic Papers 55(1): 36-80.
Fafchamps, Marcel, and Forhad Shilpi. 2005. “Cities and Specialization: Evidence from
South Asia.” Economic Journal 115(503): 477-504.
Foster, Andrew D., and Mark R. Rosenzweig. (2004). “Agricultural Productivity Growth,
Rural Economic Diversity, and Economic Reforms: India, 1970-2000.” Economic
Development and Cultural Change 52(3): 509-542.
Gallanter, Marc. 1984. Competing Inequalities: Law and the Backward Classes of India.
Berkley, CA: University of California Press.

27
Glewwe, Paul, and Hanan Jacoby. 1998. “School Enrollment and Completion in Vietnam: An
Investigation of Recent Trends.” In Household Welfare and Vietnam’s Transition, ed.
David Dollar, Paul Glewwe, and Jennie Litvack. Washington, DC: The World Bank.
Lanjouw, Jean O., and Peter Lanjouw. 2001. “The Rural Non-Farm Sector: Issues and
Evidence from Developing Countries.” Agricultural Economics 26(1): 1-23.
Lanjouw, Peter. 2001. “Nonfarm Employment and Poverty in Rural El Salvador.” World
Development 29(3): 529-547.
Kijima, Yoko, and Peter Lanjouw. 2005. “Economic Diversification and Poverty in Rural
India.” Indian Journal of Labour Economics 48(2): 349-374.
Möllers, Judith, and Gertrud Buchenrieder. 2005. “Theoretical Concepts for the Analysis of
Non-Farm Rural Employment.” Quarterly Journal of International Agriculture 44(1):
19-36.
Osborne, Evan. 2001. “Culture, Development, and Government: Reservations in India.”
Economic Development and Cultural Change 49(3): 659-685.
Ravallion, Martin, and Gaurav Datt. 2002. “Why Has Economic Growth Been More Pro-Poor
in Some States of India than Others?” Journal of Development Economics 68(2): 381-
400.
Rosenzweig, Mark R. 2003. “Openness and Poverty Reduction in the Long and Short Run.”
Paper presented at the 2003 Conference on the Future of Globalization, Yale
University, October 10-11.
Reardon, Thomas, Julio Berdegué, and Germán Escobar. 2001. “Rural Nonfarm Employment
and Incomes in Latin America: Overview and Policy Implications.” World
Development 29(3): 395-409.
Stark, Oded, C. Simon Fan, Ewa Kępińska, and Maja Micevska. 2006. “Seasonal Migration.”
Unpublished manuscript, University of Klagenfurt, Department of Economics.
Tilak, Jandhyala B.G. 2002. “Household Expenditure on Elementary Education in Rural
India: A Few Stylized Facts.” Indian Journal of Social Development 2(2): 231-267.
World Bank. 2003. Reaching the Rural Poor: A Renewed Strategy for Rural Development.
Washington, DC: The World Bank.

28
Table 1. Composition of household income by sector and activity
Income
Mean
(Rupees)
Median
(Rupees)
Std. dev.
(Rupees)
Share in
total
income
(%)
Number of
households
(%)
I. SECTORAL COMPOSITION
Agriculture 13,562 9,312 17,887 29.03 97.69
Manufacturing 11,695 8,400 8,988 2.51 9.81
Construction 15,911 9,900 22,753 12.00 34.42
Trade 25,613 14,400 37,774 7.66 13.65
Restaurants and hotels 30,914 14,400 14,308 0.91 1.35
Transport 29,187 18,000 21,313 4.30 6.73
Private services 26,515 19,180 21,288 7.82 13.46
Public services 74,800 72,000 46,820 23.95 14.62
Other 12,073 1,420 19,177 11.80 44.62
II. FARM VS. NONFARM COMPOSITION
Total farm income 13,562 9,312 17,887 29.03 97.69
Farm self-employment 11,363 7,204 17,545 24.28 97.50
Agricultural wages 6,758 5,040 6,475 4.76 32.12
Total nonfarm income 36,855 23,280 45,153 59.17 73.27
Nonagricultural wages 35,939 23,640 40,126 45.43 57.69
Skilled labor 57,682 42,000 45,859 35.97 28.46
Unskilled labor 13,051 9,150 12,259 9.46 33.08
Self-employment 24,886 12,000 44,795 13.74 25.19
Small enterprise 39,056 20,000 57,073 11.52 13.46
Micro enterprise 7,410 4,800 7,091 2.22 13.65
High-return activities 35,249 36,000 53,228 47.49 35.00
Low-return activities 12,828 9,050 12,085 11.68 37.50
Other income 12,074 1,420 19,177 11.80 44.62
Remittances 19,378 18,000 21,163 5.47 12.88
Pensions 28,332 27,600 15,662 5.97 9.62
Other 586 245 999 0.36 28.27
Notes: The mean, median, and standard deviation are calculated across households receiving income from the corresponding
source. Micro enterprises involve little or no investment. Enterprises requiring investment of at least 5,000 Rupees were
classified as small. Low-return activities include unskilled wage labor and micro-enterprise self-employment. High-return
activities include skilled wage labor and small-enterprise self-employment.
29
Table 2. Sources of household income by farm size and by education of the household head
Farm size in acres Education in years
Landless <0.5 0.5-1.5 1.5-2.5 2.5-3.5 >3.5 Uneducated 1-4 5-9 10-11 12-14 >14
Number of households (%) 17.7 27.1 27.7 12.3 6.9 8.3 36.4 16.2 33.2 9.0 3.9 1.5
Total income (Rupees) 35,429 36,022 43,570 59,866 56,056 77,499 32,830 39,570 47,733 77,692 70,552 124,133
Shares in total income (%)
Total farm income 20.1 24.5 28.1 27.1 34.7 44.7 37.7 33.2 27.6 25.4 12.5 7.7
Farm self-employment 16.0 16.0 22.5 25.1 33.1 41.6 28.9 26.7 23.6 24.6 12.0 7.7
Agricultural wages 4.1 8.6 5.6 2.0 1.6 3.0 8.8 6.5 4.0 0.7 0.5 0.0
Total nonfarm income 58.5 62.6 60.6 64.2 55.1 49.3 52.4 58.4 58.2 59.8 75.4 89.3
Nonagricultural wages 41.1 53.6 54.8 41.5 37.1 30.4 43.1 48.0 40.7 47.7 66.8 56.8
Skilled labor 29.7 34.9 45.8 37.7 31.1 27.6 26.2 31.3 33.8 45.8 66.8 56.6
Unskilled labor 11.4 18.7 9.0 3.7 6.0 2.8 16.9 16.7 6.9 2.0 0.0 0.3
Self-employment 17.4 9.0 5.8 22.8 18.0 18.9 9.3 10.4 17.6 12.1 8.7 32.5
Micro enterprise 2.7 3.3 2.3 1.1 3.0 0.5 3.3 2.2 1.9 1.9 1.1 0.0
Small enterprise 14.7 5.7 3.5 21.7 15.0 18.4 6.1 8.2 15.7 10.1 7.6 32.5
Other income 21.4 12.9 11.3 8.7 10.2 6.0 9.9 8.4 14.2 14.8 12.1 3.0
Remittances 5.8 8.4 5.1 4.3 1.9 4.8 5.3 2.9 6.8 7.0 3.9 0.0
Pensions 15.2 4.2 5.8 4.1 7.7 1.0 4.0 5.1 7.2 7.7 7.4 2.8
Other 0.4 0.3 0.4 0.3 0.6 0.2 0.6 0.4 0.2 0.1 0.8 0.2

30
Table 3. Probit estimations of participation in nonfarm activities: marginal effects
Nonfarm
employment
Nonfarm
employment
Nonfarm self-
employment
Nonfarm wage
employment
Nonfarm
employ. Low
return
High
return
Self-
employ.
Wage
employ.
Micro
bus.
Small
bus.
Unskilled
labor
Skilled
labor
(1) (2) (3) (4) (5) (6) (7) (8) (9)
Human capital and land assets
0.015* -0.016 0.021* -0.004 0.019 -0.016*** 0.013** 0.004 0.008 Age of household head
(0.009) (0.108) (0.011) (0.008) (0.104) (0.005) (0.006) (0.010) (0.010)
-0.017* 0.015* -0.022* 0.006 -0.015 0.017*** -0.012** -0.007 -0.009 Age of household head
squared (x100) (0.009) (0.011) (0.012) (0.008) (0.011) (0.005) (0.005) (0.010) (0.010)
0.065 0.060 -0.040 -0.026 0.142* 0.032 -0.070 0.859 0.096 Household head is malea
(0.077) (0.079) (0.087) (0.072) (0.083) (0.042) (0.060) (0.069) (0.062)
0.037 0.027 0.060** -0.019 0.042 -0.017 0.001 0.031 0.064*** Number of working-age
men (0.023) (0.028) (0.028) (0.022) (0.026) (0.016) (0.014) (0.027) (0.024)
0.030 -0.036 0.083*** 0.013 0.034 0.005 0.005 -0.026 0.068*** Number of working-age
women (0.026) (0.030) (0.030) (0.023) (0.028) (0.017) (0.014) (0.028) (0.025)
0.013** -0.023*** 0.047*** 0.012** 0.016** 0.006 0.009** -0.031*** 0.042*** Mean education of
working-age men (0.006) (0.008) (0.008) (0.006) (0.007) (0.004) (0.004) (0.007) (0.007)
0.010 -0.020** 0.039*** 0.012* -0.007 -0.002 0.014*** -0.028*** 0.020*** Mean education of
working-age women (0.007) (0.008) (0.008) (0.007) (0.008) (0.005) (0.004) (0.008) (0.008)
-0.029** -0.055 -0.015 -0.019* -0.032* -0.042** -0.001 -0.036 -0.018 Land assets per adult
(0.013) (0.036) (0.015) (0.012) (0.019) (0.020) (0.006) (0.036) (0.013)
Other assets and characteristics
0.073* -0.022 0.046 -0.014 0.052 -0.022 0.005 0.067 0.04 Number of adults older
than 65 years (0.044) (0.050) (0.052) (0.040) (0.049) (0.031) (0.025) (0.047) (0.045)
0.015 0.035* 0.021 0.018 0.015 0.023** 0.004 0.002 0.019 Number of children
younger than 15 years (0.016) (0.019) (0.018) (0.015) (0.018) (0.011) (0.010) (0.017) (0.016)
0.077 0.011 0.077 0.183*** -0.077 0.069 0.105** 0.009 -0.059 Parents were in high-
return activitiesa (0.054) (0.072) (0.077) (0.066) (0.069) (0.050) (0.053) (0.068) (0.058)
-0.076 -0.141** 0.046 0.163 -0.089 -0.174 0.039 -0.136** 0.009 Scheduled caste or
tribea,b (0.061) (0.061) (0.068) (0.053) (0.064) (0.037) (0.038) (0.054) (0.058)
-0.148** -0.190*** -0.017 -0.064 -0.089 -0.041 -0.017 -0.129** 0.007 General categorya,b
(0.060) (0.059) (0.068) (0.052) (0.063) (0.039) (0.033) (0.052) (0.060)
Locational characteristics
-0.035 0.024 -0.114 0.004 0.033 0.037 -0.104* 0.038 0.024 Distance to market
(x100) (0.062) (0.075) (0.079) (0.059) (0.073) (0.039) (0.055) (0.069) (0.071)
0.097 -0.246 0.307* -0.084 0.058 -0.067 0.106 -0.132 0.272** Residence in Sikkima,c
(0.124) (0.150) (0.162) (0.127) (0.152) (0.082) (0.111) (0.140) (0.121)
Log-likelihood -263.4 -281.5 -257.9 -268.5 -319.2 -179.1 -171.5 -243.2 -243.2
Pseudo R-squared 0.115 0.203 0.260 0.085 0.100 0.123 0.165 0.263 0.263
Wald chi-squared 67.77 138.9 173.0 47.66 61.77 52.80 68.25 161.4 161.4
Prob > chi-squared 0.001 0.000 0.000 0.113 0.007 0.035 0.001 0.000 0.000
Robust standard errors adjusted for clustering by villages in parentheses. Village fixed effects included but not shown. All regressions
include a constant. The number of observations in each regression is 520. a dummy variables; b excluded category: other backward classes; c excluded category: residence in Darjeeling ***, **, and * indicate significance at the 1%, 5%, and 10% level.

31
Table 4. Tobit estimations of the intensity of participation in nonfarm activities:
marginal effects
Nonfarm
employment
Nonfarm
employment
Nonfarm self-
employment
Nonfarm wage
employment
Nonfarm
employ. Low
return
High
return
Self-
employ.
Wage
employ.
Micro
bus.
Small
bus.
Unskilled
labor
Skilled
labor
(1) (2) (3) (4) (5) (6) (7) (8) (9)
Human capital and land assets
0.015* -0.022** 0.034** -0.002 0.014 -0.033** 0.051* 0.001 0.022 Age of household head
(0.009) (0.011) (0.015) (0.016) (0.011) (0.013) (0.028) (0.013) (0.019)
-0.017* 0.021* -0.036** 0.006 -0.019* 0.037*** -0.047* -0.004 -0.027 Age of household head
squared (x100) (0.009) (0.011) (0.015) (0.016) (0.011) (0.014) (0.028) (0.014) (0.019)
0.065 0.156* 0.037 -0.055 0.196** 0.119 -0.280 0.173 0.221 Household head is malea
(0.077) (0.092) (0.117) (0.121) (0.090) (0.121) (0.180) (0.111) (0.158)
0.037 0.001 0.066* -0.045 0.056** -0.091** 0.008 0.026 0.097** Number of working-age
men (0.023) (0.028) (0.037) (0.040) (0.028) (0.041) (0.061) (0.034) (0.046)
0.030 -0.042 0.108*** 0.011 0.033 -0.018 0.025 -0.033 0.122** Number of working-age
women (0.026) (0.030) (0.040) (0.043) (0.030) (0.039) (0.069) (0.035) (0.051)
0.013** -0.027*** 0.067*** 0.023** 0.022*** 0.014 0.033* -0.045*** 0.082*** Mean education of
working-age men (0.006) (0.008) (0.011) (0.011) (0.008) (0.010) (0.017) (0.010) (0.014)
0.010 -0.029*** 0.050*** 0.025** -0.001 -0.010 0.061*** -0.038*** 0.036** Mean education of
working-age women (0.007) (0.009) (0.011) (0.012) (0.009) (0.011) (0.020) (0.011) (0.014)
-0.029** -0.109*** -0.025 -0.040 -0.051** -0.137** -0.008 -0.089** -0.036 Land assets per adult
(0.013) (0.035) (0.025) (0.030) (0.024) (0.068) (0.039) (0.040) (0.035)
Other assets and characteristics
0.073* -0.001 0.040 -0.036 0.029 -0.071 0.013 0.047 0.005 Number of adults older
than 65 years (0.044) (0.053) (0.068) (0.075) (0.052) (0.070) (0.118) (0.062) (0.087)
0.015 0.028 0.020 0.026 0.020 0.021 0.017 0.011 0.017 Number of children
younger than 15 years (0.016) (0.018) (0.026) (0.027) (0.019) (0.024) (0.045) (0.021) (0.033)
0.077 -0.007 0.090 0.254*** -0.079 0.118 0.332** -0.198 -0.068 Parents were in high-
return activitiesa (0.054) (0.073) (0.094) (0.096) (0.073) (0.086) (0.151) (0.087) (0.122)
-0.076 -0.071 0.111 0.073 -0.058 0.028 0.187 -0.116 0.038 Scheduled caste or
tribea,b (0.061) (0.066) (0.094) (0.096) (0.068) (0.083) (0.158) (0.076) (0.120)
- 0.148** -0.176*** 0.004 -0.070 -0.084 -0.074 -0.041 -0.167** -0.002 General categorya,b
(0.060) (0.066) (0.094) (0.097) (0.067) (0.085) (0.165) (0.076) (0.118)
Locational characteristics
-0.072 0.013 -0.160 -0.052 0.020 0.066 -0.043** -0.002 0.013 Distance to market
(x100) (0.060) (0.071) (0.113) (0.106) (0.075) (0.088) (0.022) (0.084) (0.138)
0.307** -0.245 0.700*** 0.235 0.209 -0.298 0.751** -0.250 0.731*** Residence in Sikkima,c
(0.122) (0.155) (0.207) (0.207) (0.152) (0.222) (0.381) (0.182) (0.250)
Log-likelihood -338.0 -288.3 -341.2 -271.8 -385.0 -144.3 -183.9 -258.4 -301.4
Pseudo R-squared 0.129 0.212 0.210 0.085 0.097 0.156 0.156 0.247 0.190
Wald chi-squared 100.2 155.0 181.6 50.39 82.90 53.45 67.74 169.4 141.7
Prob > chi-squared 0.000 0.000 0.000 0.070 0.000 0.031 0.002 0.000 0.000
Robust standard errors in parentheses. Village fixed effects included but not shown. All regressions include a constant. The number of
observations in each regression is 520. a dummy variables; b excluded category: other backward classes; c excluded category: residence in Darjeeling ***, **, and * indicate significance at the 1%, 5%, and 10% level.

32
Table 5. ‘Heckit’ estimations of (log) nonfarm income: marginal effects
Nonfarm
employment
Nonfarm
employment
Nonfarm self-
employment
Nonfarm wage
employment
Nonfarm
employ. Low
return
High
return
Self-
employ.
Wage
employ.
Micro
bus.
Small
bus.
Unskilled
labor
Skilled
labor
(1) (2) (3) (4) (5) (6) (7) (8) (9)
Human capital and land assets
0.269*** 0.307*** 0.253*** 0.242*** 0.259*** 0.141*** 0.230*** 0.313*** 0.228*** Age of household head
(0.016) (0.023) (0.022) (0.034) (0.020) (0.041) (0.049) (0.028) (0.036)
-0.265*** -0.299*** -0.246*** -0.230*** -0.260*** -0.083* -0.224*** -0.326*** -0.231*** Age of household head
squared (x100) (0.020) (0.027) (0.025) (0.038) (0.024) (0.047) (0.054) (0.030) (0.036)
1.008***
1.324***
0.453 0.381 1.021***
1.097 0.404 1.453***
0.382 Household head is malea
(0.274) (0.368) (0.298) (0.407) (0.336) (0.712) (0.463) (0.543) (0.399)
0.238*** 0.017 0.255*** 0.103 0.310*** -0.292 0.328** 0.182 0.249*** Number of working-age
men (0.066) (0.113) (0.068) (0.130) (0.072) (0.237) (0.127) (0.131) (0.090)
0.266*** 0.224** 0.249*** 0.152 0.252*** -0.077 0.369** 0.293** 0.218* Number of working-age
women (0.068) (0.110) (0.093) (0.136) (0.076) (0.220) (0.181) (0.117) (0.113)
0.134*** 0.098* 0.161*** 0.156*** 0.127*** 0.139** 0.051 -0.041 0.181*** Mean education of
working-age men (0.021) (0.056) (0.032) (0.036) (0.026) (0.066) (0.037) (0.102) (0.043)
0.069*** -0.017 0.109*** 0.097** 0.057** -0.064 0.147** -0.041 0.087*** Mean education of
working-age women (0.020) (0.039) (0.025) (0.047) (0.025) (0.070) (0.060) (0.089) (0.032)
Other assets and characteristics
0.231 0.301 0.217 0.230 0.285** -0.342 0.296 0.395** 0.259 Number of adults older
than 65 years (0.145) (0.210) (0.177) (0.320) (0.144) (0.418) (0.395) (0.198) (0.188)
0.093* 0.001 0.070 0.049 0.062 0.225 -0.009 -0.017 0.049 Number of children
younger than 15 years (0.051) (0.075) (0.066) (0.097) (0.056) (0.145) (0.110) (0.070) (0.080)
0.190 0.403 0.229 0.183 0.141 0.070 0.555 0.283 0.129 Scheduled caste or
tribea,b (0.155) (0.283) (0.223) (0.299) (0.177) (0.479) (0.445) (0.471) (0.260)
-0.004 -0.017 0.035 -0.036 -0.140 -0.587 0.210 -0.356 -0.056 General categorya,b
(0.181) (0.396) (0.249) (0.346) (0.209) (0.545) (0.447) (0.459) (0.287)
Locational characteristics
-0.026 0.057 -0.123 -0.352 -0.036 0.401 -0.693 0.005 -0.168 Distance to market
(x100) (0.158) (0.202) (0.231) (0.337) (0.179) (0.486) (0.579) (0.203) (0.362)
0.476*** 0.280 0.850*** -0.270 0.639*** -1.135*** 0.099 -0.172 1.119*** Residence in Sikkima,c
(0.135) (0.423) (0.191) (0.272) (0.155) (0.423) (0.322) (0.735) (0.261)
0.694 -0.698 1.076 1.126 1.022 2.330 1.197 0.232 1.345 Lambda
(0.230) (0.801) (0.192) (0.482) (0.278) (0.204) (0.606) (1.202) (0.369)
Log-likelihood -871.9 -634.4 -561.8 -484.1 -783.7 -271.7 -277.6 -514.1 -445.9
Wald chi-squared 9790 2385 7573 617.9 3547 638.0 531.4 2482 3034
Prob > chi-squared 0.000 0.000 0.000 0.000 0.000 0.000 0.000 0.000 0.000
Robust standard errors in parentheses. In the first stage, the probabilities of participation in nonfarm activities are estimated as in Table 3. a dummy variables; b excluded category: other backward classes; c excluded category: residence in Darjeeling ***, **, and * indicate significance at the 1%, 5%, and 10% level. ***, **, and * indicate significance at the 1%, 5%, and 10% level.
33
Table 6. Robustness checks: marginal effects of probit estimations
Nonfarm
employment
Nonfarm
employment
Nonfarm self-
employment
Nonfarm wage
employment
Nonfarm
employ. Low
return
High
return
Self-
employ.
Wage
employ.
Micro
bus.
Small
bus.
Unskilled
labor
Skilled
labor
(1) (2) (3) (4) (5) (6) (7) (8) (9)
Specification including the highest level of schooling attained
0.013** -0.027*** 0.049*** 0.010* 0.013* 0.002 0.009*** -0.032*** 0.041*** Maximum education of
working-age men (0.006) (0.007) (0.007) (0.006) (0.007) (0.004) (0.004) (0.007) (0.006)
0.011* -0.016** 0.034*** 0.014* -0.002 0.007 0.011*** -0.023*** 0.019*** Maximum education of
working-age women (0.006) (0.007) (0.008) (0.006) (0.007) (0.004) (0.004) (0.007) (0.007)
Specification including nonlinearity of educational effects
0.165** 0.058 0.422*** 0.016 0.276*** -0.009 0.987*** 0.113 0.410*** Less than primary (< 5
years of education)a,b (0.054) (0.106) (0.127) (0.097) (0.073) (0.057) (0.014) (0.101) (0.141)
0.139** -0.121 0.520*** 0.161** 0.093 0.044 0.901*** -0.120 0.390*** Primary (5-9 years of
education)a,b (0.067) (0.086) (0.104) (0.082) (0.085) (0.054) (0.080) (0.073) (0.102)
0.165** -0.189* 0.676*** 0.280*** 0.146 0.073 0.995*** -0.180** 0.650*** Matriculation (10-11
years of education)a,b (0.058) (0.087) (0.069) (0.111) (0.092) (0.078) (0.005) (0.066) (0.102)
0.163** -0.389*** 0.702*** 0.163 0.184* -0.053 0.987*** -0.319*** 0.739*** Secondary (12-14 years
of education)a,b (0.058) (0.048) (0.042) (0.125) (0.093) (0.054) (0.007) (0.032) (0.067)
0.260*** -0.340*** 0.740*** 0.268** 0.341*** -0.018 0.988*** -0.299*** 0.810*** Tertiary (>14 years of
education)a,b (0.031) (0.060) (0.029) (0.128) (0.062) (0.059) (0.006) (0.035) (0.036)
Specifications including external financing variables
0.122 0.706*** External financing
availablea (0.103) (0.125)
0.145* 0.373*** Share of external
financing (0.082) (0.098)
Robust standard errors in parentheses. The number of observations in each regression is 520. Each specification is estimated by a separate
regression. The other regressors (not reported) are defined as in Table 3. a dummy variable; b excluded category: uneducated ***, **, and * indicate significance at the 1%, 5%, and 10% level.