09006dp learning from japan’s experience in …...conservation will lead to energy cost...
TRANSCRIPT

Copyright 2009 CRIEPI. All rights reserved.
SERC Discussion Paper: SERC09006
Learning from Japan’s Experience in Energy Conservation
Taishi Sugiyama*
Central Research Institute of Electric Power Industry
Abstract:
Japan has achieved the highest level of energy conservation in the world. Every indicator of
energy efficiency shows that Japan is positioned in a leading group. Then, how has Japan achieved
such energy conservation? In this paper, we will learn lessons from this valuable experience, and
discuss how the domestic global warming mitigation policies for the future should be.
* Corresponding author. [e-mail: [email protected]]
免責事項
本ディスカッション・ペーパー中,意見にかかる部分は筆者のものであり,
(財)電力中央研究所又はその他機関の見解を示すものではない。
Disclaimer
The views expressed in this paper are solely those of the author(s), and do not necessarily
reflect the views of CRIEPI or other organizations.

- 1 -
Copyright 2009 CRIEPI. All rights reserved.
This paper is organized as follows.
First, we will review establishing pollution control measures, that is to say a formative experience
for Japan that made huge impacts on the country’s later efforts on environmental problems.
Second, we will present “theories of energy conservation policies” in detail. “Theories” of
environmental taxes and emission trading systems are relatively known to many people, but the
“theories of energy conservation policies” are known to few people. However, since we shouldn’t
develop future global warming mitigation policies without understanding these theories, we will
fully explain them.
Third, we will confirm the proven results of the energy conservation policies.
Finally, we will mention that other policy instruments besides regulations have also played
important roles. Technological development policies will be discussed elsewhere.
1. Proven results of pollution control measures
A feature of Japanese environmental policies is that they have been implemented using
frameworks of industry policies and achieved great results.
This experience has been taken over by later energy conservation policies, and it is still alive as a
frame of current global warming mitigation policies.
Let us take up air pollution control measures below, focusing on ones against SO2 emissions, as an
example of pollution control measures which are deeply related to global warming issues.
As a result of large-scale industrial complex construction projects and energy conversion from
coal to oil during 1950s and early 1960s, SO2 air pollution occurred, being accompanied by serious
public health damage. To tackle the problems, various measures had been taken since late 1960s,
with the result that considerable reduction in SO2 emissions and improvement of environmental
quality level was brought in short-term.
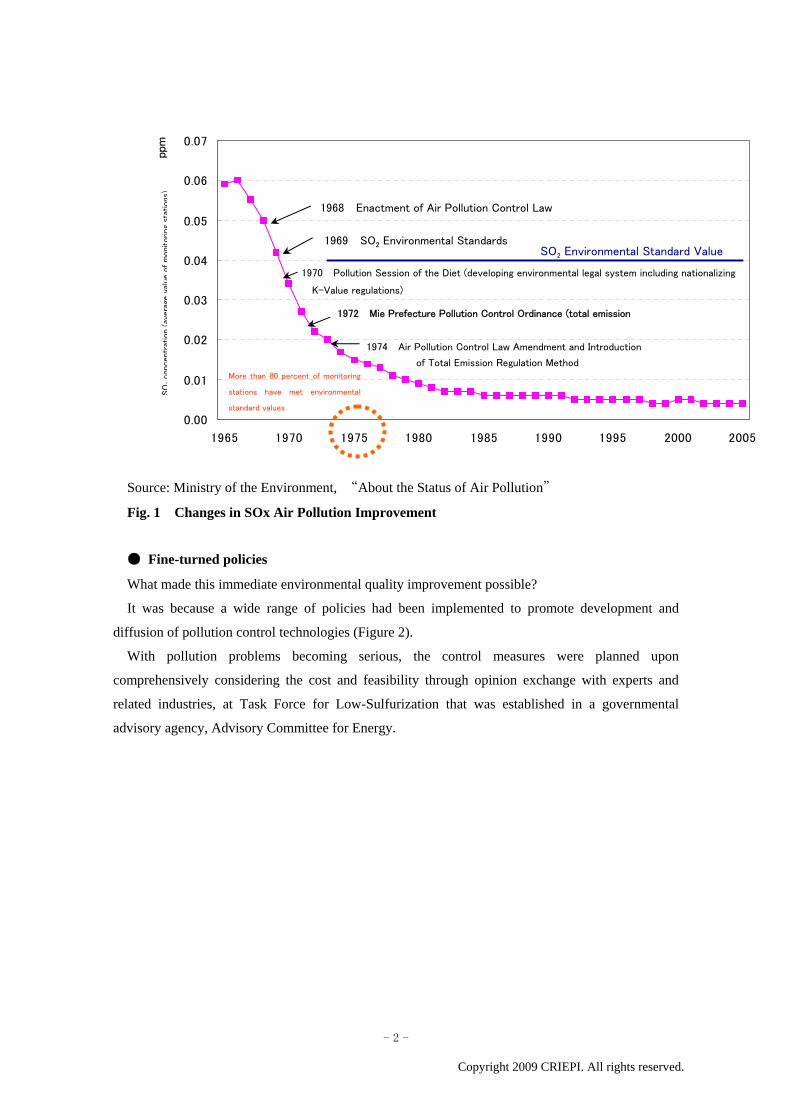
Figure 1 shows that average SO2 concentration in the air started decreasing dramatically since late
1960s, and by the middle of 1970s, the environmental standards had been achieved at more than 80
percent of monitoring stations throughout the country. Since then, up to date, the achievement rate of
environmental standards has remained at an excellent level of almost 100 percent.
- 2 -
Copyright 2009 CRIEPI. All rights reserved.
Source: Ministry of the Environment, “About the Status of Air Pollution”
Fig. 1 Changes in SOx Air Pollution Improvement
● Fine-turned policies
What made this immediate environmental quality improvement possible?
It was because a wide range of policies had been implemented to promote development and
diffusion of pollution control technologies (Figure 2).
With pollution problems becoming serious, the control measures were planned upon
comprehensively considering the cost and feasibility through opinion exchange with experts and
related industries, at Task Force for Low-Sulfurization that was established in a governmental
advisory agency, Advisory Committee for Energy.
0.00
0.01
0.02
0.03
0.04
0.05
0.06
0.07
1965 1970 1975 1980 1985 1990 1995 2000 2005
ppm
1969 SO2 Environmental Standards
1970 Pollution Session of the Diet (developing environmental legal system including nationalizing
K-Value regulations)
1974 Air Pollution Control Law Amendment and Introduction
of Total Emission Regulation Method
1972 Mie Prefecture Pollution Control Ordinance (total emission
More than 80 percent of monitoring
stations have met environmental
standard values
SO2 Environmental Standard Value
1968 Enactment of Air Pollution Control Law
SO
2concentr
atio
n(a
vera
geva
lue
of
monitoring
stat
ions)

- 3 -
Copyright 2009 CRIEPI. All rights reserved.
Fig. 2 Fine-tuned Air Pollution Control Policies
At this time, regarding the development and diffusion of control technologies, full discussion was
made on certain factors including which technologies would be effective and which technologies
could be introduced. Concretely, these technologies included ① lowering sulfur content of fuels
(promoting import of low-sulfur crude oil, crude oil burning, and expanding use of LNG), ②
desulfurization of heavy oil, and ③ flue gas desulfurization technology.
According to a judgment based on the circumstances surrounding these technologies at the time, it
would never be easy for each measure’s goal to be achieved. However, eventually, a decision was
made that the levels of these goals were attainable if the every measure would be taken. And then,
detailed plans based on the long-term view were developed to achieve the goals.
Policy instruments that were adopted then included technological development, tax breaks,
regulations, and agreements.
First of all, development of flue gas desulfurization equipment started as a national technological
development program. Also, financial measures including customs reduction and special loans by
development banks were taken for private companies’ installation of equipment for desulfurization
of heavy oil, flue gas desulfurization, and desulfurization by gasification process to promote the
Technological Development and Investment in Pollution Control
Development of flue gas desulfurization technology
(National Project 1966-70, launching manufacturers’ technological development 1962-)
Customs reduction, special loans, etc. for introduction of environmental equipment
Administrative GuidanceSecuring low sulfur crude oil
Planned introduction of heavy oil desulfurization
equipment (National Project 1967-70)
Pollution Control Agreements
Regulations (K-value regulations 1968-, total emission regulations 1974-)

- 4 -
Copyright 2009 CRIEPI. All rights reserved.
measure of installing such equipment.
Regarding regulations, under Air Pollution Control Act, K-value regulations were introduced and
sliding-scale-type strengthening of regulations was attempted. In 1974, for large emission sources
including large plants, total emission standards that would apply to individual plants came into effect,
and for small emission sources including small plants that were exempted from total emission
regulations, fuel utilization standards that would be complied with at individual factories took effect.
With regard to the approach of total emission regulations, it allowed business flexibility in how
they would address the regulations, by providing an approach that establishes a cap on total amount
of pollutants emitted from every target facility of a business entity and does not regulate emissions
from individual facilities of the entity.
In addition, large-scale business entities began to voluntarily sign pollution control agreements
with local municipalities and implement pollution control measures at much higher levels than ones
the laws provided.
● Great results
As a result of a series of policies mentioned above, Japan has achieved great results (Figure 3).
International comparison on SO2 emission intensity (SO2 emissions per kWh of power generation) at
coal- and oil-fired power stations shows that Japan has succeeded in significant emission reductions
in advance of other countries. Other countries were much behind in improvement of emission
intensity, and, for example, in South Korea and Germany, it occurred twenty years later. As for
emission intensity in the U.S.A., which introduced emission trading systems, it can not be said that
the emissions have been reduced since 1995 in comparison with trend of emissions before then.
Moreover, regarding technologies, the U.S. has merely utilized existing ones which had already
turned into practical use in other countries such as Japan.

- 5 -
Copyright 2009 CRIEPI. All rights reserved.
Source: Reference 2
Fig. 3 International Comparison of SOx emissions
Japan’s fine-turned policy instruments have realized ambitious emission reductions ahead of the
rest of the world, and have become a superior precedent to other countries.
2. Theories of energy conservation policies
Next, we will discuss on energy conservation policies. We will present data of results later, and
we will explain about the theories first.
To make the explanation organized, we will start by talking about the stage of diffusion of
existing technologies, followed by discussion on the stage of research and development of new
technologies.
Now, to begin with, why are some policies necessary in promoting energy savings (Figure 4) ?
0
2
4
6
8
1 0
1 2
1 4
1 6
1 8
2 0
1 9 6 5 1 9 7 0 1 9 7 5 1 9 8 0 1 9 8 5 1 9 9 0 1 9 9 5 2 0 0 0
発電
量あ
たり
SO
x排出
量(g
-SO
2/kW
h)
Japan:
Technology Development (National
Project)/Direct Regulation/Tax Credit/
Subsidies
Europe: Convention on Trans-Boundary Air Pollution / Direct Regulation
The U.S.A.:
Direct Regulation
Japan has achieved the highest level of emission control in advance of other countries. S
O2 e
mis
sion
s pe
r ge
nera
ted
pow
er (
g-S
O2/k
Wh)
The U.S.A.(95~):Emission
trading scheme

- 6 -
Copyright 2009 CRIEPI. All rights reserved.
Fig. 4 Why “Energy Conservation Policies” Are Necessary?
Some argue that government doesn’t have to do anything because, in many cases, energy
conservation will lead to energy cost reductions.
However, it is not true. The fact is that even energy conservation measures which are assumed to
be fully cost-effective have not been implemented by various reasons. Then, governments’ policies
are required.
● “What are barriers to impede energy conservation?”
To help you understand this fact, we will explain, with concrete examples, the barriers that
prevent investments in energy conservation and consumption of energy-efficient products from
being realized (Fig. 5).
Fig.5 Barriers which prevent investment in energy conservation and consumption of energy-
efficient equipment from being realized
There are barriers against implementing energy conservation.
Therefore, even highly-economical energy saving activities are not implemented!
Then, the government has a role to play.
Priority on other purposes Preference of consumers Lack of information Practices of industries Distortion in energy price structure Instability of macro-market
Could energy conservation improvement be pursued without government intervention for the reason that it would lead to cost reductions?

- 7 -
Copyright 2009 CRIEPI. All rights reserved.
For instance, let us imagine that, when we’re going to buy a refrigerator, there’re two candidate
products. One is expensive and its energy efficiency is high, and the other is cheap and its energy
efficiency is low.
Consumers may just not be interested in how much energy these products will consume, and they
may select one of them according to their preference of color, design, performance, or actresses who
are advertising the products. In this way, “precedence of other purposes” and “preference of
consumers” are considered as barriers from a viewpoint of encouraging energy conservation.
Next, imaging when information on difference of effectiveness of energy savings between these
two refrigerators, such as electricity charges and energy efficiency, is not available at stores, energy-
efficient products won’t be selected. This barrier is called “lack of information.”
Also, in case of building construction, various businesses including designers, constructors,
owners, and tenants are involved in one project. Although all of the stakeholders should work
together to construct highly energy-efficient buildings, in the actual industry practices, on the
contrary, energy conservation tends to be given secondary importance. For instance, people engaged
in building design and people engaged in selecting air conditioners rarely have opportunities to
exchange their opinions. In this way, “industry practices” is another barrier to impede energy
conservation.
With regards to the fifth barrier indicated in Fig. 5, when subsidies for electricity charges are
excessive and don’t reflect actual cost of power supply, the number of people who would like to buy
energy-efficient products will decrease. This is a barrier which is called “energy price distortion,” a
phenomenon which is often seen in developing countries.
Furthermore, though refrigerator manufacturers need stable macroeconomic conditions so that
they could invest in production lines of more refined and more energy-efficient refrigerators, there
are some cases in which such conditions are not met. This is as well one of the barriers which is
often seen particularly in developing countries.
An actual state is that the progress of energy conservation has been very slow because of the
existence of these barriers as mentioned above.
● “What is payback period?”
In this book, payback period means, “the years required to recover the necessary amount of the
investment by saved energy cost in case of certain investment in energy conservation.”
We will illustrate it using Fig. 6. Installing insulation at a building costs you one million yen.
When this measure can save electricity and heating expenses by 500,000 yen per year, the payback
period is two years, as a result of a calculation of dividing one million yen by 500,000 yen.

- 8 -
Copyright 2009 CRIEPI. All rights reserved.
Fig. 6 What Is Payback Period
The payback period can be measured when the information on the necessary cost for investment
in energy efficiency improvement and the amount of energy actually saved by the investment is
obtained through observing actual economic activities or surveying companies with questionnaires.
The results of the measurement on the obtained information indicate that many opportunities for
energy conservation have not been realized in any countries.
In the case of ordinary factories, the payback period of investment in energy conservation will be
short and it is around one to three years. In the case of electric home appliances, the payback period
is much shorter, and in some cases, it is only six months (Figure 7).
Example In the case of Payback Period = two years
Insulation
OOnnee mmiilllliioonn yyeenn Cost
550000,,000000
Second First
550000,,000000
Effectiveness of energy conservation
Payback Period = Years required for investment to be fully recovered by energy conservation

- 9 -
Copyright 2009 CRIEPI. All rights reserved.
Fig. 7 Without Policies, Energy Conservation Doesn’t Easily Advance
Probably, you have experienced selecting a product of which price without tax is cheap, rather
than “an energy-saving appliance” at a store, not paying attention to its energy consumption. Of
course, though some people will buy energy-saving products “in which investment will require 30
years to be fully recovered,” such cases are probably rare.
On the other hand, the payback period is longer in some industries such as power companies
whose main business is energy production, or steel making, cement, and petrochemical industries in
which energy costs account for a large part of production costs. Even in these industries, the period
is about three to seven years.
Thus, an actual state is that even the investment in energy-saving products, in which the
investment could be recovered in just a few years, has not been implemented.
● “The role of energy conservation policies”
Then, the time has come for government to play its role (Figure 8).
Ordinary factories
One year - Three years
Consumption behavior
Six months - ? years
Intensively energy consuming industries
Three years - Seven years
Investment in energy conservation
10 years 20 years

- 10 -
Copyright 2009 CRIEPI. All rights reserved.
Fig. 8 Energy Conservation Policies by Government
The government will provide information on estimated electricity and heating expenses through
establishing energy efficiency standards and an energy-saving labeling program for electric home
appliances and automobiles. Consequently, poor quality products with high energy cost will be
removed from the market, and companies and consumers who would like to purchase products will
be able to select ones taking account of the total costs including electricity and heating expenses.
Also, regarding factories, the government will address the problems by establishing a qualified
energy manager system, a system of developing long-term energy conservation plans, and
management standards including technical guidelines.
Factories larger than a certain scale will be required to be staffed with employees who have
qualification as a manager having expertise on energy and to ensure that employees who are
responsible for promoting energy conservation will be available all the time.
Also, developing long-term energy conservation plans will provide opportunities to consider what
potential the factories will have for energy conservation.
Moreover, specific technical guidelines including one on temperature management for the
equipment important for energy saving such as boilers are prepared in order to routinize tasks of
qualified energy managers, opportunities to promote energy saving will not be missed.
Setting Energy Efficiency Standards (Top Runner Law)
Providing Information(Energy-Saving Labeling)
Setting Management Standards(Energy Conservation Law for Factories) Qualified energy manager system System of developing long-term energy conservation plans Technical guidelines, etc.

- 11 -
Copyright 2009 CRIEPI. All rights reserved.
● Promoting technological development
In the above, we have discussed on the stage of diffusing technologies.
On the other hand, the government has its role to play in promoting technological development as
well (Figure 9).
Fig. 9 Technological Development Promotion by Government
Various policies promote development of technologies. They are generally categorized into two
approaches; one is a method of “pulling” technological development by creating a market for
energy-saving equipment, and the other is a method of “technology push” which facilitates
technological development activities themselves.
The following will further provide information on an energy-saving labeling program and a
governmental procurement program on energy-saving equipment among these various policies.
● Energy-saving labeling program
First, we will see the labeling, which shows information on energy-saving performance of
equipment at retail stores (Figure 10).
Technology Push
Market Pull
National Technological Development Programs
Tax Relief for Cost of Technological Development
Subsidies and Tax Relief for Procuring Equipment
Government Procurement of Energy-Saving Equipment
Energy Conservation Standards and Labeling

- 12 -
Copyright 2009 CRIEPI. All rights reserved.
Fig. 10 Uniform Energy-Saving Label
On the label, the following three kinds of information are provided about the electric home
appliances including refrigerators and air conditioners;
1. Multi-stage rating system: it indicates energy-saving performance of the appliances in five
stages, from one star (☆) to five stars (☆☆☆☆☆).
2. Energy-saving labeling system: it consists of two kinds of energy-saving logos, a green colored
one with a white cutout letter “e” or an orange colored one with the “e” letter. The green logo with a
white “e” means that the appliance has already met the top runner standards before its target deadline
year.
3. Estimated annual electricity charges: it provides consumers with information of energy-saving
performance of individual appliances. Consumers will refer to the information when they are going
to buy the products.
● Procurement of energy-saving products by government
Next, let us talk about government procurement of energy-saving products.
The government’s choice on what equipment to buy is very important. In every country,
【Multi-stage rating system】 ・Energy-saving performance is indicated in 5 stages, from 1 to 5 stars, from low to high performance of products offered on the market. ・In order to clarify the compliance level with the Top Runner standards, arrows are placed under the stars showing achievement and non-achievement.
【Energy-saving labeling system】 ・ Products which achieved the Top Runner standards carry a green “e” logo, while others carry an orange “e” logo. ・Achievement level of the standards and energy consumption efficiency (including annual electricity consumption) are also indicated
【Estimated annual electricity charges】 ・The estimated annual electricity charges are indicated to clearly show the energy consumption efficiency (including annual electricity consumption).

- 13 -
Copyright 2009 CRIEPI. All rights reserved.
government procurement accounts for 10 to 20 percent of its GDP, and therefore, if the government
purchases energy-saving equipment, it will considerably contribute to energy conservation
throughout the county.
Figure 11 shows the roles the government plays in energy-saving procurement, comparing its
effectiveness with that of the top runner program.
Fig. 11 Technological Innovation Driven by Government Procurement
In the Figure, a red line curve shows distribution of equipment before introduction of both of top
runner program and government procurement system, and a solid curve shows distribution after their
introduction. A vertical line shows sales of equipment (for example, air conditioners), and a
horizontal line shows energy efficiency of the equipment.
Under the top runner program, a top runner standard value is set up just behind the top runner
product (a gray colored person in the Figure). Since manufacturers have to ensure that the average
energy efficiency value of the equipment they sell will exceed the standard value, the distribution of
the products in the target year will be like that shown with the solid curve.
At this time, if the government sets a procurement standard value that is higher than the top runner
standard value or will likely front-load the target year, government procurement opportunities will
be awarded to a tiptop group among top runners.
In developing the guidelines for such government procurement, the labels with stars and energy-
Top Runner standard value
Government procurement standard
Before
implementation
of policies
After
implementation
of policies
Other technological development policies
Information-providing labeling
Num
berof
equ
ipment
units
Energy efficiency of equipment

- 14 -
Copyright 2009 CRIEPI. All rights reserved.
saving “e” logos are utilized.
The government procurement creates markets for cutting edge energy-efficient products and likely
accelerates technological development.
In addition, if governmental departments establish longer payback period than that established in
private sectors, it will lead to reductions in governmental expenditure.
Of course, it is essential that the standards and labeling programs are properly set or developed
and the technical capabilities are assured upon full consideration so that such government
procurement can work well. Regarding the technical capabilities, technical consideration on
individual equipment must be done respectively and concretely.
3. Proven results of energy conservation
Now, upon your understanding the theories of energy conservation policies, let us look at data
which show what results has been seen.
● Energy saving improvement of electric home appliances
First, we will explain about the changes of energy efficiency of room air conditioners, as a
successful example of the top runner program (Figure 12).
COP
Fig.12 Energy Saving Improvement of Equipment
1.0
1.5
2.0
2.5
3.0
3.5
4.0
4.5
5.0
5.5
6.0
73 75 77 79 81 83 85 87 89 91 93 95 97 99 01 03 05
Introduction of Top Runner Program
Source: Prepared from materials of Association for Electric Home Appliances
and Jyukankyo Research Institute Inc. (2.8kW class)

- 15 -
Copyright 2009 CRIEPI. All rights reserved.
Currently, average Coefficient of Performance (COP) of room air conditioners is around 5.5.
This means that when the units consume 100W of electricity, 550W of cooling and heating
capacity will be produced.
Efficiency can virtually exceed 100, because a room air conditioner is a system that takes unused
heat in the air into a room.
After the top runner program was introduced, energy efficiency of the products has been sharply
improved. Many experts agree that such improvement couldn’t have been achieved without the top
runner program.
In addition, the top runner program improved vehicle fuel efficiency, and it also stopped the trend
that an annual total amount of CO2 emissions from cars had been increasing (Figure 13).
Fig. 13 CO2 emissions from vehicles
Moreover, as for many other electric home appliances covered by the program, a significant
improvement of energy efficiency has been realized.
The Figure 14 shows an estimate of reduction in CO2 emissions achieved by the top runner
program.
217
268
215
225
235
245
255
265
275
90 91 92 93 94 95 96 97 98 99 00 01 02 03 04
BAU
Introduction of Top Runner Program
217
262
268
215
225
235
245
255
265
275
90 91 92 93 94 95 96 97 98 99 00 01 02 03 04
Year
Hypothetic Outcome without Top Runner Program
Source: Prepared from materials of Japan Business Federation
One
-mill
ion
-ton
CO
2/ye
ar

- 16 -
Copyright 2009 CRIEPI. All rights reserved.
Fig. 14 CO2 Emission Reductions by Top Runner Program
Of course, not every regulation was proper, and some of them need to be reviewed. However, the
results have proved that the method of establishing appliance-specific energy efficiency standards
was effective as a measure for energy conservation as well as global warming mitigation.
In the Figure 15, we will find that even overseas, energy efficiency standards have achieved a
great result in energy saving in private and transportation sectors.
トップランナー基準による機器の効率向上
689925
1,548
1,943
2,401
2,901
478310
1,215
0
500
1,000
1,500
2,000
2,500
3,000
3,500
2002 2003 2004 2005 2006 2007 2008 2009 2010
省エ
ネ量
見込
み(万
kL)
29million t - CO2
トップランナー基準による自動車燃費の改善
405599
1,032
1,247
1,466
1,686
2,117
809
1,904
0
500
1,000
1,500
2,000
2,500
2002 2003 2004 2005 2006 2007 2008 2009 2010
CO
2削
減量
(万
t-CO
2) 21million t - CO2
Energy Efficiency Improvement of Equipment
Source: Prepared from materials of Agency for Natural Resources and Energy
Fuel Efficiency Improvement of Vehicles
Est
imat
e of
Ene
rgy
Eff
icie
ncy
Im
prov
emet
(10
000
kL)
C
O2
Em
issi
on R
educ
tion
(10
000
t- C
O2)

- 17 -
Copyright 2009 CRIEPI. All rights reserved.
Fig. 15 Energy Efficiency Standards Have Leaded to Success In Energy Savings Even
Overseas
Fig. 16 Electricity Consumption per Capita
2000
15
10
5
‘ ’ ’ ’ ’
Enactment of California Energy Conservation Regulation (1974)
Implementation of California Energy Conservation Regulation(1974)
Federal Energy Conservation Regulation of 1990
Federal Energy Conservation Regulation of 1993
Federal Energy Conservation Regulation of 2001
Average Energy Consumption of new refrigerators in the U.S.A.
Source: Prepared from materials of Lawrence Berkeley National Laboratory
kWh
/yea
r
Per Capita Electricity Consumption
0
2,000
4,000
6,000
8,000
10,000
12,000
14,000
16,000
18,000
1960 1965 1970 1975 1980 1985 1990 1995 2000
kWh
/per
son
California
U.S.A
Texas
Source: Prepared from materials of Lawrence Berkeley National Laboratory
- 18 -
Copyright 2009 CRIEPI. All rights reserved.
The Figure 16 clearly shows that California which proactively introduced energy efficiency
regulations has succeeded in stabilizing electricity consumption per person. Such trend in California
outstandingly contrasts with that in the entire U.S. or Texas.
● Energy conservation of factory
We have discussed on energy saving of electric home appliances and vehicle, and now, we will
look at the energy conservation of factory.
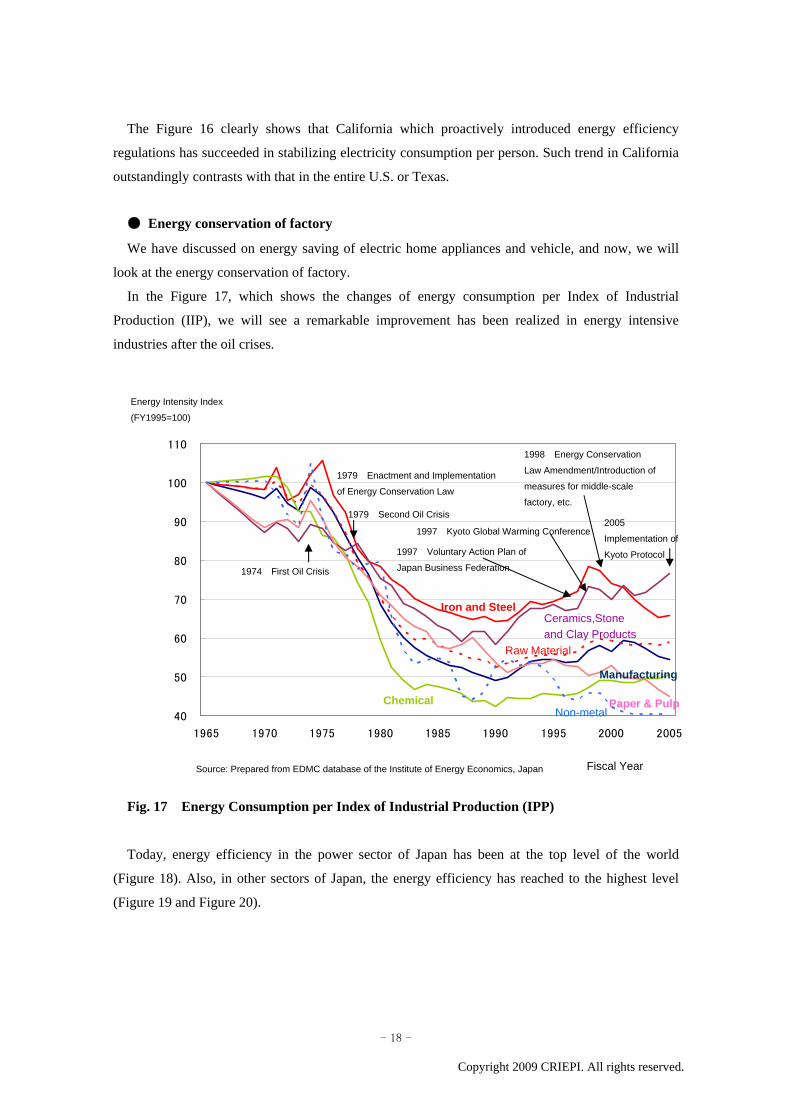
In the Figure 17, which shows the changes of energy consumption per Index of Industrial
Production (IIP), we will see a remarkable improvement has been realized in energy intensive
industries after the oil crises.
Fig. 17 Energy Consumption per Index of Industrial Production (IPP)
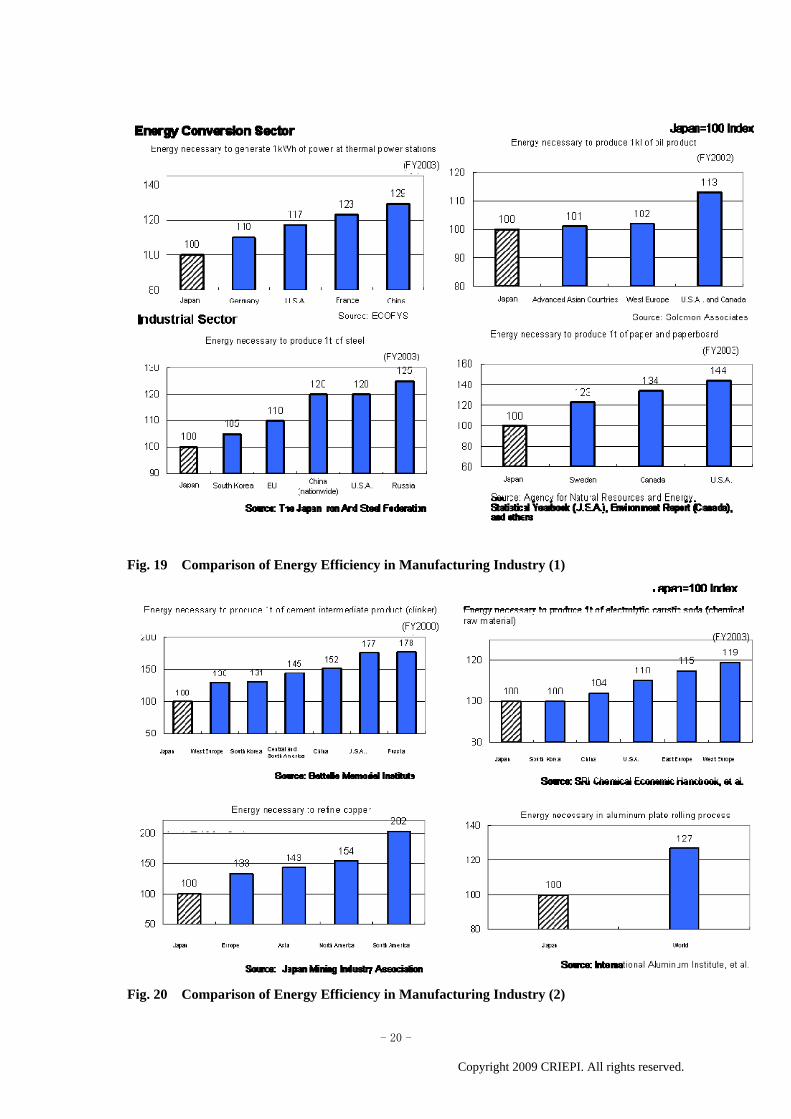
Today, energy efficiency in the power sector of Japan has been at the top level of the world
(Figure 18). Also, in other sectors of Japan, the energy efficiency has reached to the highest level
(Figure 19 and Figure 20).
40
50
60
70
80
90
100
110
1965 1970 1975 1980 1985 1990 1995 2000 2005
年度
原単
位指
数(1965年
度=
100)
Chemical
Ceramics,Stone
and Clay Products
Non-metal Paper & Pulp
Iron and Steel
Raw Material
Manufacturing
Source: Prepared from EDMC database of the Institute of Energy Economics, Japan
Energy Intensity Index
(FY1995=100)
Fiscal Year
1974 First Oil Crisis
1979 Second Oil Crisis
1979 Enactment and Implementation
of Energy Conservation Law
1997 Voluntary Action Plan of
Japan Business Federation
1997 Kyoto Global Warming Conference
1998 Energy Conservation
Law Amendment/Introduction of
measures for middle-scale
factory, etc.
2005
Implementation of
Kyoto Protocol

- 19 -
Copyright 2009 CRIEPI. All rights reserved.
Fig. 18 International Comparison about Efficiency at Thermal Power Plant
26
28
30
32
34
36
38
40
42
44
46
1990 1992 1994 1996 1998 2000 2002
インド
中国
ドイツフランス
北欧
日本
米国
イギリス・アイルランド
Source: ECOFYS; The Federation of Electric Power Companies of Japan
U.K/Ireland
Japan
Northern Europe
U.S.A.
Germany France
China
India
Therm
al Efficiency (%
)
- 20 -
Copyright 2009 CRIEPI. All rights reserved.
Fig. 19 Comparison of Energy Efficiency in Manufacturing Industry (1)
Fig. 20 Comparison of Energy Efficiency in Manufacturing Industry (2)

- 21 -
Copyright 2009 CRIEPI. All rights reserved.
Since there are some controversies on indexes of this kind of international comparison, Japan can
not always take the first place when other indexes are used. However, many experts on energy
conservation of factory believe that Japan has made maximum efforts in taking energy saving
measures.
4. Non-regulatory policy instruments
We have discussed on the theories of energy conservation policy so far, and we have also
examined data of proved results of energy conservation on both electric home appliances and factory.
By the way, not only regulation but also many other factors work on such promotion of energy
conservation. In this paper, we will brief on voluntary measures and national technological
development programs which have played important roles though they are not so familiar to us.
In factory, since 1997, global warming mitigation measures have been promoted by voluntary
approaches of Japan Business Federation, for the reason that energy conservation went around as the
results of measures taken after the oil crises and making regulation stricter was deemed improper.
The goal of these approaches is “to reduce CO2 emissions from industry and energy conversion
sectors in 2010 to 1990 level.” A wide range of sectors from manufacturing to service, distribution
and transportation participates in these voluntary approaches.
Among the participants, industry and energy conversion sectors account for about 45 percent of
the total CO2 emissions in Japan. In the Fig. 21, we will see the changes of CO2 emissions from
these participant industries. The Figure shows that CO2 emissions from them had been below the
1990 level for six continuous years since 2000 and thus the goal had been attained. If it had not been
for long-term shutdown of nuclear power plants since 2002, more CO2 emissions could have been
reduced.

- 22 -
Copyright 2009 CRIEPI. All rights reserved.
Fig. 21 Voluntary Approaches by Japan Business Federation
In the voluntary action plans for the environment, effectiveness of the measures are ensured
through a cycle of “Plan,” “Do,” “Check,” and “Act” (PDCA cycle) that works as a review system in
industries (Figure 22).
CO2 emissions from industrial and energy conversion
sectors
Fiscal Year
0.6 percent reduction from FY1990 levels
Hypothetical reduction of 2.0 percent without about 7.3 million t – CO2 (1.4 percent) addition due to impact of nuclear plant shutdown
Below
FY1990 levels
Source: Japan Business Federation (2006)
Goal Impact from nuclear plant shutdown
(10
000
t–
CO
2)

- 23 -
Copyright 2009 CRIEPI. All rights reserved.
Fig. 22 PDCA Cycle in Voluntary Approaches by Japan Business Federation
In addition, Japan Business Federation itself established a third party review committee in
FY2002, and since then, a verification function by third-party has been added to the industries’
review system. Moreover, in the system, the measures are also regularly reviewed by a follow-up
committee created by related ministries and agencies, and the industries are called for further
measures, as appropriate.
A vital feature of the voluntary approaches is that such PDCA cycle has been established. It is
assumed important that the PDCA cycle will be expanded to other energy conservation policies.
● Beyond “outcome without voluntary efforts”
By the way, as energy conservation is basically an extension of the daily efforts for efficiency
improvement of production process, it is not easy for us to answer the question, “how much additive
the effectiveness of voluntary energy conservation measures is in comparison with outcome the
industries could have attained in the same manner as before without doing their voluntary
approaches.”
There are some examples, however, which clearly seem to be results from the voluntary
approaches. Let us introduce a few of them.
A voluntary action goal of the iron and steel industry is to reduce energy consumption in steel
production process to 10 percent below 1990 level in 2010. Today, since it is not easy for the
D
A
P
C
Government’s Long-Term Energy Supply & Demand Outlook
Basic Energy Plan
Regularly following up by voluntary review system,
third party review committee and ministries
concerned (Ministry of Economy, Trade and
Industry, Ministry of Land, Infrastructure, Transport
and tourism, Ministry of Agriculture, Forestry and
Fisheries, Ministry of Internal Affairs and
Communications, and Ministry of the Environment)

- 24 -
Copyright 2009 CRIEPI. All rights reserved.
industry to achieve the goal, they have been considering additional measures including further
efficiency improvement. Moreover, when it will turn out to be hard for industry to attain the goal,
they are ready to struggle for securing credits through Kyoto Mechanism, mainly CDM.
The iron and steel industry has also engaged in effective use of waste materials including waste
plastic in steelmaking processes such as blast furnace. Though its actual usage of the waste plastic is
currently about 450,000 tons, the goal is set at one million tons.
It is considered that all of those measures have been pushed by the existence of framework of
voluntary approaches.
Next, we will introduce an example of the electric power industry. The goal of its voluntary
approaches is to reduce CO2 emission intensity by 20 percent below 1990 level in 2010. It was
highly ambitious goal-setting which was based on the prospect of high economic growth and the
optimistic siting plans for nuclear power stations, both of which were made around in 1997.
However, contrary to the government’s prospect, the economic growth didn’t measure up to its
expectation, and also the stagnation of power demand significantly delayed the development plans of
nuclear power. This raised possibility of falling short of the 20-percent reduction target by about 5
percent. Therefore, the electric power industry has taken additional steps including improvement of
capacity utilization rate of nuclear power stations, further enhancement of thermal power generation
efficiency, and utilization of Kyoto mechanism, heading toward the goal.
Looking at the entire voluntary action plans, according to the results of a follow-up study on the
achievements of FY2005 for 33 industries (25 industry and energy conversion sectors, 3 private
business sectors, and 3 non-members of Japan Business Federation) which are under the jurisdiction
of the Ministry of Economy, Trade and Industry, 21 industries out of 33 successfully have met their
goals, while other 12 industries have failed to attain theirs. Out of 12 non-attainment industries, six
industries which are represented by the iron and steel and the electric power are intending to achieve
their goals by additional measures, and in the case that they still won’t have reached the goals, they
intend to acquire credits by using Kyoto mechanism to complement their voluntary approaches. In
this way, though the environmental voluntary action plans of Japanese domestic industries are
essentially voluntary approaches and they are never regulations, the industries have taken additional
measures to achieve their own goals, having contributed to energy efficiency improvement beyond
outcome we would have but for their voluntary efforts.
● National technological development program
We will change the subject here and talk about the government’s national technological
development programs. Since the programs will be fully analyzed elsewhere, here we will mention
just two points.
First, since the oil crises, government’s development budget in areas of new energy and energy
conservation has been at the top level of the world in comparison with GDP (Figure 23).

- 25 -
Copyright 2009 CRIEPI. All rights reserved.
Fig. 23 Government’s Research and Development Budget in the Area of New Energy and
Energy Conservation
The total amount of these budgets between 1974 and 2002 reached 1300 billion yen (value in
2002). It was an investment in technological development of which continuousness and largeness of
scale were unusual even across the world.
As a result of this investment, some of the technologies, including solar cell, high efficiency gas
turbine and heat pump, have come into practical use.
Looking at individual technological development projects, you will find that some of them haven’t
led to practical use yet. It is partly unavoidable, however, because technological development,
inherently, won’t always end up in success.
In addition, there are some projects which have led not only to practical use but also to creating
new industries. Moreover, even though some projects have failed to come into practical use, the
national technological development projects have given impacts on theme setting by private
companies and research institutions and have enabled such entities to continue to invest in research
and development activities.
Of course, the programs have had much criticism and many problems. However, the achievements
as a whole have gotten a passing mark so far, and it seems important to further improve and make
use of the programs (Figure 24).
0.00%
0.01%
0.02%
0.03%
0.04%
0.05%1974
1976
1978
1980
1982
1984
1986
1988
1990
1992
1994
1996
1998
2000
U.S.A
Japan
Germany
France
Japan’s Energy R&D Budget ratio has been at the
top level of the world, even in comparison with
GDP
Source: Prepared from IEA “Energy R&D Database”
U.K.
(Budget-to-GDP ratio, % )

- 26 -
Copyright 2009 CRIEPI. All rights reserved.
Fig. 24 Results of National Technology Development Programs
5. Conclusions
We would like to close this paper by summarizing the long talk we have got above (Figure 25).
Fig.25 Sector- and technology-specific fine-tuned approaches has realized the highest level
of energy efficiency improvement of the world
1.10 out of 23 projects have come into practical use.
2 . Effectiveness of energy saving and CO2 reduction in
practical use is generally regarded valid for the entire
investment.
3.A number of projects have led to new industries formation.
4.Even though some projects have failed in coming into
practical use, the national technological development
programs have set the important themes and have made
continuous development investment possible.

- 27 -
Copyright 2009 CRIEPI. All rights reserved.
Japan has implemented fine-turned policy instruments, and as a result, it has realized energy
conservation at the highest level in the world.
There are three reasons why the fine-turned policy instruments are necessary.
The first reason is to overcome barriers to energy conservation.
The second reason is to enhance technological development.
The third reason is to prevent business activities from being disturbed. The policies should be
taken after their feasibilities are concretely and respectively discussed, and if not, business activities
could suffer adverse impact.
Because Japan has achieved a number of results, we should learn that experience more, and with
confidence, we should continue to put the experience at the heart of its fine-tuned global warming
mitigation measures.
However, unfortunately, little is known about matters including what policies have worked and
how much they have worked, or what external factors such as oil price have worked and how they
have made impacts on business actions. Since some of existing policy instruments may be out-of-
date or out-of-focus, what is important in the future will be steadily continuing assessment and
improvement of the policy instruments, that is to say, making PDCA cycle on the instruments work
properly.
【References】
1) Masayo Wakabayashi and Taishi Sugiyama, Case Study Review about Effectiveness of European
Environmental Taxes (Japanese version), Central Research Institute of Electric Power Industry
Report Y06002, 2006
2) Masayo Wakabayashi and Taishi Sugiyama, Case Study Review about Effectiveness of Emission
Trading Schemes (Japanese version), Central Research Institute of Electric Power Industry Report
Y06010, 2007
3) Osamu Kimura, Yoshiyuki Ozawa, Taishi Sugiyama, Analysis of government-sponsored energy
R&D projects (Japanese version), Central Research Institute of Electric Power Industry Report
Y06019, 2007
4) Howard Geller, The Experience with Energy efficiency policies and Programs in IEA Countries:
Learning from the Critics, IEA, 2005