02 - pure.iiasa.ac.at
TRANSCRIPT

31
02Risk assessment & information
2.1. Introduction p. 32
2.2. A risk-based approach p. 34
2.2.1. Calculating losses: example Austrian railways
and flood risk
2.2.2. Example of damage and vulnerability calculations:
Port of Rotterdam and flood risk
2.2.3. Case study Italy: controlled floods to reduce risk
2.2.4. Example of EP curve: case study wildfires in Portugal
2.2.5. Alternative vulnerability indicators: drought indicators
2.3. Direct and indirect damages p. 43
2.4. Extreme events and statistics p. 44
2.5. Risk information and policy implications p. 46
References p. 48
Authors: Jeroen Aerts(1), Toon Haer(1), Ted Veldkamp(1), Maria Conceição Colaço(2), Francisco Castro Rego(2), Stefan Hochrai-ner-Stigler(3), Reinhard Mechler(3), Patric Kellermann(4), Luc Feyen(6), Jaroslav Mysiak(5), Annegret Thieken(4).
Affiliations: (1)Institute for Environmental Studies (IVM), VU University Amsterdam, The Netherlands; (2)CEABN-InBio, Insti-tuto Superior de Agronomia, University of Lisbon, Portugal; (3)
International Institute for Applied Systems Analysis (IIASA), Aus-tria; (4)Institute of Earth and Environmental Science, University of Potsdam, Germany; (5)Fondazione Eni Enrico Mattei (FEEM), Italy; (6)Joint Research Centre (JRC), Italy

32 Risk assessment and information
During the past decades, the frequency and worldwide impacts of natural disasters has increased rapidly (Mu-nich Re, 2014; 2015). A number of major disasters have occurred in Europe, prompting high economic damage and losses, casualties and social disruptions. Examples are the 2010 eruption of the Eyjafjallajökull volcano in Iceland; earthquakes in Italy in 2009 and 2012; droughts and forest fires in Portugal in 2012; and heavy rainfall that caused re-cord floods in Central Europe in 2002 and 2013.
Natural disaster risks are of high policy and citizen con-cern in Europe. They are expected to rise further as a result of projected demographic development and land use change, with expansion of residential and produc-tion activities in hazard-prone areas. Climate change will further exacerbate risk from natural hazards, and it has been demonstrated to have already increased the frequency and severity of certain extreme climate and weather related events, such as droughts, heat waves and heavy precipitation (IPCC, 2012; IPCC, 2014).
Knowing the increasing trends in natural disasters and losses, it is imperative to take action on disaster risks to improve resilience of European societies to natural haz-ards. The main goal, therefore, of the ENHANCE project is to develop and analyse innovative ways to manage natural hazard risks. Key is to develop new multi-sector partnerships (MSPs) that aim at reducing or redistribut-ing risk, and increase resilience of societies. For sever-al reasons, comprehensive and accurate risk infor-mation is important for MSPs and for policy-making in general. First, a better understanding of natural hazard risk is important for preventing excessive socio-eco-
Introduction
nomic stress at levels from local to national to inter-national, and in order to plan for reducing risk from extreme events in the future. For example, measures that reduce risk (e.g. levees to prevent flooding) require a certain design level or elevation, which can be derived from historical water level data or hydrological simulation models. Second, post-disaster information on the losses from a natural hazard event is important, in order to pre-pare (emergency) aid to the region. In addition, accu-rate post-event loss information is needed to estimate whether financial support is needed in terms of com-pensation or new investments to recover the area and develop the economy back to its original state.
An example of where inaccurate risk information can lead to is exemplified in Figure 2.1. This figure shows a map for NYC, for the actual flooding due to hurricane Sandy in 2012 (red color) and the official 1/100 flood zone (blue colors) provided by the Government before the hurri-cane occurred. The figure shows that many of the ac-tual flooded areas are outside the official flood zone. Inaccurate perception of flood risk for an area may lead to the development of urban areas in unprotect-ed areas, or to under-designing levees for protecting people against extreme events.

33
Figure 2.1.A map for NYC, for the actual flooding due to Hurricane Sandy in 2012 (red color) and the 1/100 flood zone map (blue colors) provided by the Government before the event (Source: NYC, 2013).
FEMA Effective 100-year Flood Plain and Sandy Comparision Map
FEMA Effective Flood 100-Year Flood Plain (1983)Sandy Inundation (2012)

34 Risk assessment and information
A risk-based approach
ExposureSpatial overlay of hazard footprints and elements-at-risk locations
Hazard
Risk = probability of losses =
Elements-at-risk
Temporal probability ofhazard scenario, annualprobability = 1/Return period
Hazard Type (e.g. debris flow, flash flood, river flood)Other characteristics (Duration, onset time, hazard interaction etc.)Hazard intensity: spatial distribution of damaging effects
Quantification of exposedElements-at-risk (e.g. nr. people/ buildings, monetary value)
Type of elements-at-risk(e.g. people, building type,type of infrastructure).Temporal variation of elements-at-risk (e.g. population scenarios)Spatial location (e.g. points, lines, polygons)
Vulnerability
Degree of loss of a specific type of elements-at-risk given the intensity of a given hazard scenario
Focus is here on physical vulnerability.
Low High
StrongerWeaker
Vuln
erab
ility
Hazard intensity
0
1
Within the ENHANCE project, we have followed a risk-based framework (see e.g. Kron, 2005) which has several components displayed in Figure 2.2: (1) Exposed assets (‘Elements at risk’): These are the assets at risk, such as people, buildings and infrastructure. (2) Hazard: the po-tential magnitude and frequency of hazards that threaten
Figure 2.2.Schematic figure of risk as a function of hazard, vulnerability and elements-at-risk (Source: Van Westen, 2015).
those assets, (3) Vulnerability: the level of protection and preparedness to reduce risk of the exposed assets. Loss-es can be calculated by combining the hazard information with exposure and vulnerability data. For example, a flood depth and extent map (hazard) can be overlaid with infor-mation on exposed buildings with their value (exposure).

35
Furthermore, each exposed asset can be further char-acterised by its vulnerability. For example, for exposed buildings, we can use information on building codes, or use data on empirical losses to buildings from historical records. Losses can be measured in terms of dollars of damage, fatalities, injuries, or some other unit of analysis.
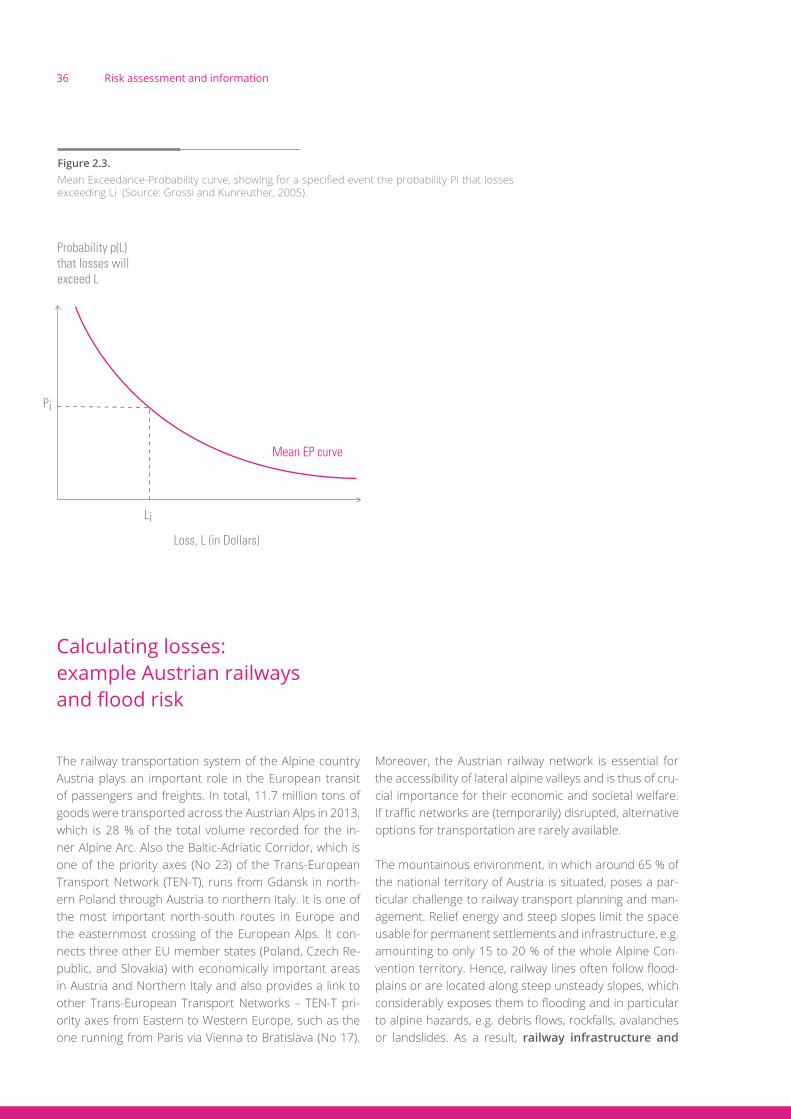
In order to derive risk estimates from calculated losses per event, we also need the probability for each of these events. In this way we can plot the exceedance probability against the potential loss per event, summarised as an ex-ceedance probability-loss (risk) curve (EP curve, Figure 2.3), where the risk is approximated by the area under the curve (Meyer et al., 2009). The EP curve in Figure 2.3 shows that for the specific loss Li, the likelihood that losses will
Photo by Donald Bowers/Shutterstock.
exceed a certain threshold level of losses Li, is given by Pi. There is some debate on the number of data points need-ed to construct the curve. For example, Merz and Thieken (2009) used seven return periods to produce risk curves for Cologne, Germany, which is relatively many data points compared to most other studies.
36 Risk assessment and information
Calculating losses: example Austrian railways and flood risk
The railway transportation system of the Alpine country Austria plays an important role in the European transit of passengers and freights. In total, 11.7 million tons of goods were transported across the Austrian Alps in 2013, which is 28 % of the total volume recorded for the in-ner Alpine Arc. Also the Baltic-Adriatic Corridor, which is one of the priority axes (No 23) of the Trans-European Transport Network (TEN-T), runs from Gdansk in north-ern Poland through Austria to northern Italy. It is one of the most important north-south routes in Europe and the easternmost crossing of the European Alps. It con-nects three other EU member states (Poland, Czech Re-public, and Slovakia) with economically important areas in Austria and Northern Italy and also provides a link to other Trans-European Transport Networks – TEN-T pri-ority axes from Eastern to Western Europe, such as the one running from Paris via Vienna to Bratislava (No 17).
Moreover, the Austrian railway network is essential for the accessibility of lateral alpine valleys and is thus of cru-cial importance for their economic and societal welfare. If traffic networks are (temporarily) disrupted, alternative options for transportation are rarely available.
The mountainous environment, in which around 65 % of the national territory of Austria is situated, poses a par-ticular challenge to railway transport planning and man-agement. Relief energy and steep slopes limit the space usable for permanent settlements and infrastructure, e.g. amounting to only 15 to 20 % of the whole Alpine Con-vention territory. Hence, railway lines often follow flood-plains or are located along steep unsteady slopes, which considerably exposes them to flooding and in particular to alpine hazards, e.g. debris flows, rockfalls, avalanches or landslides. As a result, railway infrastructure and
Probability p(L)that losses willexceed L
Loss, L (in Dollars)
Mean EP curve
Pi
Li
Probability p(L)that losses willexceed L
Loss, L (in Dollars)
Mean EP curve
Pi
Li
Figure 2.3. Mean Exceedance-Probability curve, showing for a specified event the probability Pi that losses exceeding Li (Source: Grossi and Kunreuther, 2005).

37
Photo by LeksusTuss/Shutterstock.
operation has been repeatedly impacted by alpine hazards. For example, in June 2013, floods and debris flow events caused substantial damage to the railway in-frastructure in Austria. The national railway operator ÖBB reported a total damage of about EUR 75 million to its railway network.
In order to better plan, negotiate, and decide on invest-ments in protection measures, reliable models for esti-mating potential flood losses to railway infrastructure are needed. Such models are, however, rare and their reli-ability is seldom investigated. Therefore, the ENHANCE case study ‘Building railway transport resilience to alpine hazards’ aimed at developing an empirical modelling approach for estimating direct structural flood dam-age to railway infrastructure and associated financial
losses. Via a combination of event data, i.e. photo-docu-mented damage on the Northern Railway in Lower Aus-tria caused by the March river flood in 2006, and simulat-ed flood characteristics, i.e. water levels, flow velocities, and combinations thereof, the correlations between physical flood impact parameters and damage occurred to the railway track were investigated and subsequently rendered into a damage model.
After calibrating the loss estimation using recorded repair costs of the Austrian Federal Railways, the loss model was applied to three synthetic flood hazard sce-narios with return periods of 1/30, 1/100 and 1/300 years along the March River (see Figure 2.4). Next, flood losses were calculated for these three flood hazard sce-narios (Table 2.1).

38 Risk assessment and information
Figure 2.4. Estimation of potential structural damage at the Northern Railway for three synthetic flood sce-narios: a) a 30-year event, b) a 100-year event, and c) a 300-year event. In damage class 1 the track`s substructure is (partly) impounded, but there is no or only little notable damage. In dam-age class 2 the track section is fully inundated and significant structural damage has occurred (or must be expected), while in damage class 3 additional damage to substructure, superstructure, catenary and/or signals occurred so that a full restoration of the cross-section is required. The damage classes are estimated for each 100 m-segment (Source: Kellermann et al., 2015).
Table 2.1. Estimated repair costs for different hydraulic scenarios along the March River (Source: Kellermann et al., 2015).
Flood scenario and probability
Repair costs estimated by the RAIL model (euro)
1/30 17.698.600
1/100 21.511.600
1/300 93.168.900
Finally, it was applied to the whole catchment of the river Mur to identify hot spots of flood risk in this part of the railway network (Kellermann et al. 2016).

39
Example of damage and vulnerability calculations: Port of Rotterdam and flood risk
The port of Rotterdam in the Netherlands is the second largest in the world and the Largest Port in Europe. The harbor is situated in the south-western river delta of the Netherlands and is prone to natural hazards (wind storms, flooding) and the impact of climate change on these natural hazards. Potential elements at risk are in-dustries, energy plants, port facilities, railways, tunnels, and container terminals. In addition, a large section of Rotterdam’s working population is employed in the port area, and many businesses are highly dependent upon port activities. Severe economic damage can occur from long-term closures of the port and its industry.
Containers/Breakbulk
Liquid Bulk
Dry Bulk
Distribution
Chemical Industries/Re�neries/Energy
Other activities
AM\DM , 2012d095
Similar to the Austrian case study, flood inundation maps with different return periods (probabilities) were used to estimate potential flood losses. This was done by first over-laying the flood maps for the Port with the exposed assets (‘buildings’) of the area. This database is shown in Figure 2.5. Next, we applied so-called stage-damage curves (SDC) to represent the vulnerability to flooding for each of the exposed assets classes (Figure 2.6). A stage-damage curve for flooding shows how much percentage damage of the total potential damage occurs for a certain flood depth. For example, Figure 2.6 shows that for asset type ‘liquid bulk storage’, more than 85% of the total damage occurs with a flood depth of 1m.
Figure 2.5. The six types of exposed assets in the Port of Rotterdam. Photo by Port of Rotterdam Authority, 2012.

40 Risk assessment and information
Case study Italy: controlled floods to reduce risk
The flood risk analysis conducted in this case study was compelled as a result of the severe earthquake that hit the Emilia Romagna region (Northern Italy) in 2012, caus-ing a total loss of €16 billion. Among other consequences, the earthquake disrupted the otherwise well-functioning drainage system (DS) protecting the area against flood-ing. Flood risk increased consistently in urban, industrial, and agricultural areas. To prevent larger impacts, in 2012 a multi-sector partnership was installed between the Civil Protection Agency (CPA), the Land Reclamation and Irriga-tion Boards (LRIB), and the Regions Lombardy and Emilia Romagna. The partnership, promoted and overseen by the Po River Basin Authority (PRBA), was endorsed as an inter-regional emergency management plan.
Figure 2.6.Stage-damage functions for the Port of Rotterdam. The functions show the relation between the exposed assets (6 types), and the % damage of flooding as a function of the flood depth.
Other industry
Chemical/energy
Distribution
Dry bulk storage
Liquid bulk storage
Container/general ca
0
0,4
0,8
1 2 3 4 5 6
Container/general cargo Liquid bulk storage Dry bulk storage
Distribution Chemical/energy Other industry
The risk assessment delineated the areas exposed to higher flood risk as a result of inoperable DS under differ-ent precipitation and disruption scenarios, and estimated economic losses caused by uncontrolled floods in terms of capital stock damage and foregone production losses. First, the simulated volume of drained water and timing of its outflow were analysed using a 2D hydrodynamic mod-el and high-resolution digital elevation model to produce flooding maps for each scenario (Figure 2.7). Altogether 25 scenarios were analysed, including four network dis-ruption and five rainfall intensity configurations. As in the Port of Rotterdam case, economic losses were estimated using stage-damage curve model. The SDC method esti-mated capital stock damage that ranges between €20 mil-lion under normal functioning conditions to around €300 million under catastrophic floods. The analysis also includ-ed the effects of climate change and land conversion.

41
Example of EP curve: case study wildfires in Portugal
A key hazard in Portugal is wildfire with many major ep-isodes over the recent past. In 2003, Portugal had the worst ever recorded fire season, with about 450 thousand hectares burned. The central part of the Portuguese main-land was most affected, including the district of Santarém where the ENHANCE case studies, the municipalities of Chamusca and Mação, are located. Chamusca and Mação were especially affected in 2003, and empirical risk data from 2003 were used to study the major drivers that led to the catastrophic fires.
The assessment of wildfire risk was performed in two dif-ferent complementary components: spatial and tempo-ral. First, wildfire hazard maps were created showing the extent of the burned areas. Next, each of those hazard maps was translated into losses using a wildfire model. This model integrates the following variables: land cov-er (CORINE Land Cover data, the exposed assets), slope (Digital Elevation Module 80m) and previously burnt are-as (historical data of burnt areas). The model derives fire loss maps by combining the forest fire hazard maps with the economic value of the elements at risk (different types of forests) and their vulnerability. Finally, each fire loss map was assigned a probability that could be statistical-
Figure 2.7.Flood scenarios for the Po River Basin case study, for return periods 1/1, 1/10 and 1/50 years.
ly derived from a fire database. Using the unit values for losses included in the National Forest Strategy of 2006, an exceedance-probability loss curve (Figure 2.8) was established indicating loss information for the two most extreme years of 2003 and 2005. It shows that values of estimated losses for the district of Santarém can be higher than €100 million.
0100
0,2
0,4
0,6
0,8
1
1000 10000 100000 1000000
Santarém
Losses (thousand euro/year)
Prob
abili
ty o
f non
-exc
eeda
nce
Observed
Weibull
Lognormal
Figure 2.8.Exceedance probability-loss curve for wildfires in the district of Santarém, showing the relation between forest fire losses and their probability.
Rp1 Rp10 Rp50
42 Risk assessment and information
Alternative vulnerability indicators: drought indicators
In the ENHANCE project, we have performed two drought case studies: (1) a global analysis on past drought trends and projections of future drought conditions due to cli-mate and socio-economic changes, and (2) a regional case study in the Júcar Basin in South Eastern Spain, where we have assessed drought impacts in view of global change and evaluated the effectiveness of drought adaptation.
Drought and water scarcity are two manifestations of wa-ter-related risk that are both connected to the deficit of freshwater resources. Drought is a natural phenomenon that refers to a deviation from the historical record (Log-ar & Van den Bergh, 2012; Pereira et al., 2009; Wilhite, 2005). Water resources scarcity refers to the overuse of water resources and is often seen as strongly modi-fied by human use. Two hazard indicators often used to assess global and regional scale water scarcity are the Water Crowding Index (WCI) and the Water Scarcity Index (WSI) (Falkenmark, 1986; Falkenmark et al., 2007). The WCI quantifies water scarcity as the yearly water availability (measured in runoff or discharge) per capita at a country or basin-level. The WSI uses a ratio between withdrawals and resources availability as an indicator for water scarcity conditions.
The Júcar Basin, for example, uses a combination of indicators for the assessment of current and future drought risk, and for operational use. Synthetically gen-
erated information on streamflow and reservoir storage levels are combined with knowledge on sectoral water needs and costs of potential water shortages to assess the probability of hazardous drought conditions and their associated (economic) impacts. Vulnerability to drought and water scarcity conditions in the Júcar Basin is mainly determined by the portfolio of different water uses being dependent on the same source of water and by the op-erational management of drought conditions. At this op-erational level, drought risks are governed by monitoring multiple drought indicators (reservoir volumes, aquifer storage, streamflow, rainfall) and the timely declaration of emergency states if necessary (Monteagudo et al., 2013).
Both global scale indicators and local scale indices for risk assessment and operational use depend heavily on the availability of reliable observations or simula-tions of meteorological and hydrological conditions (precipitation, evaporation, streamflow, reservoir levels) and socioeconomic information (population, water needs, land use, vulnerability). Continuous investments are needed and taking place to assimilate and improve the (open-source) availability and quality of this meteor-ological, hydrological and socioeconomic information at different spatial scales, for example within the Inter-Sec-toral Impact Model Inter-comparison Project (ISI-MIP), the EartH2Observe project (E2O), the Global Runoff Data Cen-tre (GRDC), and the European Drought Observatory (EDO).
Initialsituation Flood
t0 t1 t2t-1
Start ofreconstruction
Full productioncapacity
No production possible
PART I PART IIPART III
43
Direct and indirect damages
In risk assessment studies, one can distinguish between direct and indirect effects (Koks et al., 2012). Direct ef-fects can be defined as the impacts that occur due to di-rect effects from hazards to properties or people. In the economic literature, direct losses are often referred to as stock losses, which are defined as losses that occur at a given point in time. Indirect effects, on the other hand, are often caused by the direct impacts, but are the result of interferences within industrial supply chains (Okuyama and Santos, 2014). Most importantly, indirect effects may also occur outside the hazard area: e.g., companies that are not flooded, but that have economic relations with households and industries that are flooded, cannot sup-ply or demand their goods and services, and therefore, indirectly suffer from the flood.
Numerous studies have developed approaches to esti-mate flood damage. Many of these studies, often origi-nating from the engineering community, address main-ly direct losses of flooding using stage-damage curves, such as illustrated for the cases of Rotterdam and Po (Penning-Rowsell et al., 2010; Kreibich et al., 2010). Es-timating indirect losses has mainly been the domain of the economic community, using macroeconomic models
such as input-output models or generalised equilibrium models (e.g. Steenge and Bockarjova, 2007; Hallegatte, 2008). A few studies have proposed a more integrative approach for the calculation of both direct and indirect flood damage. For instance, Jonkman et al. (2008) pro-posed a framework for the combination of direct and in-direct losses and FEMA (2009) developed two modules within the HAZUS-FLOOD model to assess direct and in-direct losses. However, an integrative model, able to con-sistently integrate both direct and indirect losses, which gives the total flood risk in terms of expected annual damage, is in our opinion, still missing.
In the ENHANCE project, we have applied an integrative flood risk model for the Port of Rotterdam. The frame-work consists of multiple steps. First, a direct loss assess-ment (using a direct flood damage model) is conducted in the port region, specifically differentiating the direct dam-ages to various industrial sectors. Second, we simulate in-direct losses using an input output model, and calculate how direct losses translate into the loss in economic pro-duction per sector (Koks et al. 2014). Next, the input-out-put model is used to show the time and costs required to reach the pre-disaster state of the economy in the area.
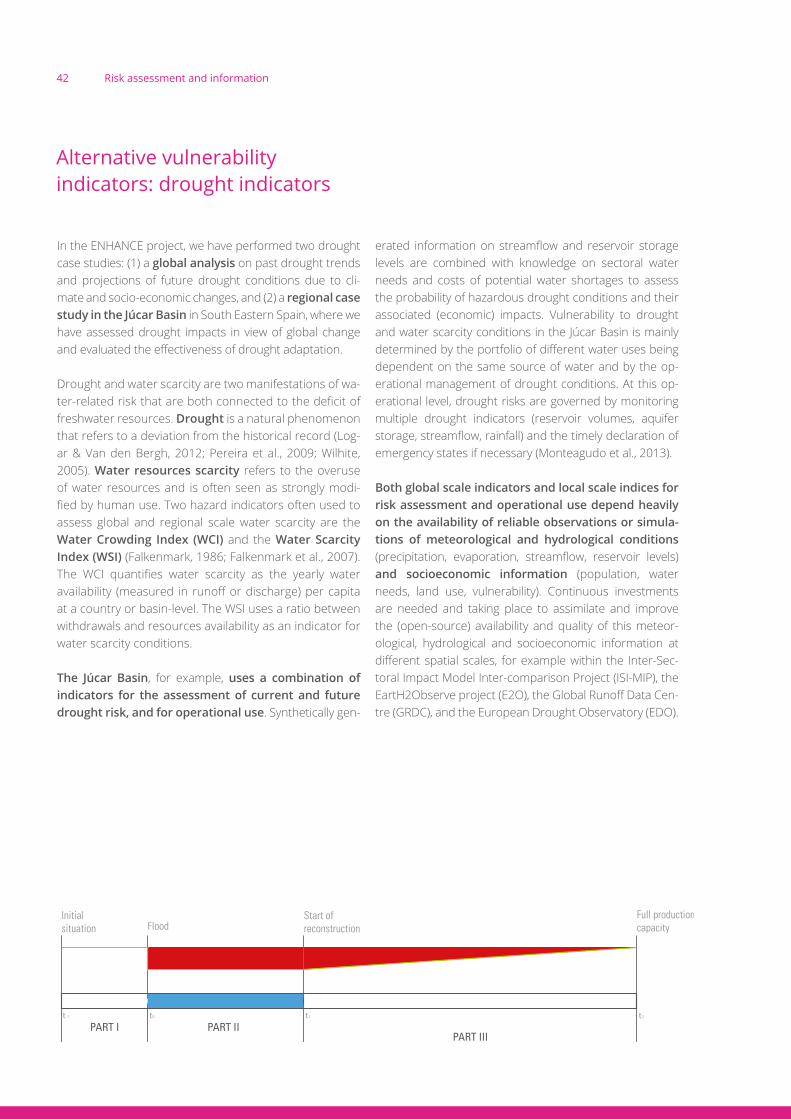
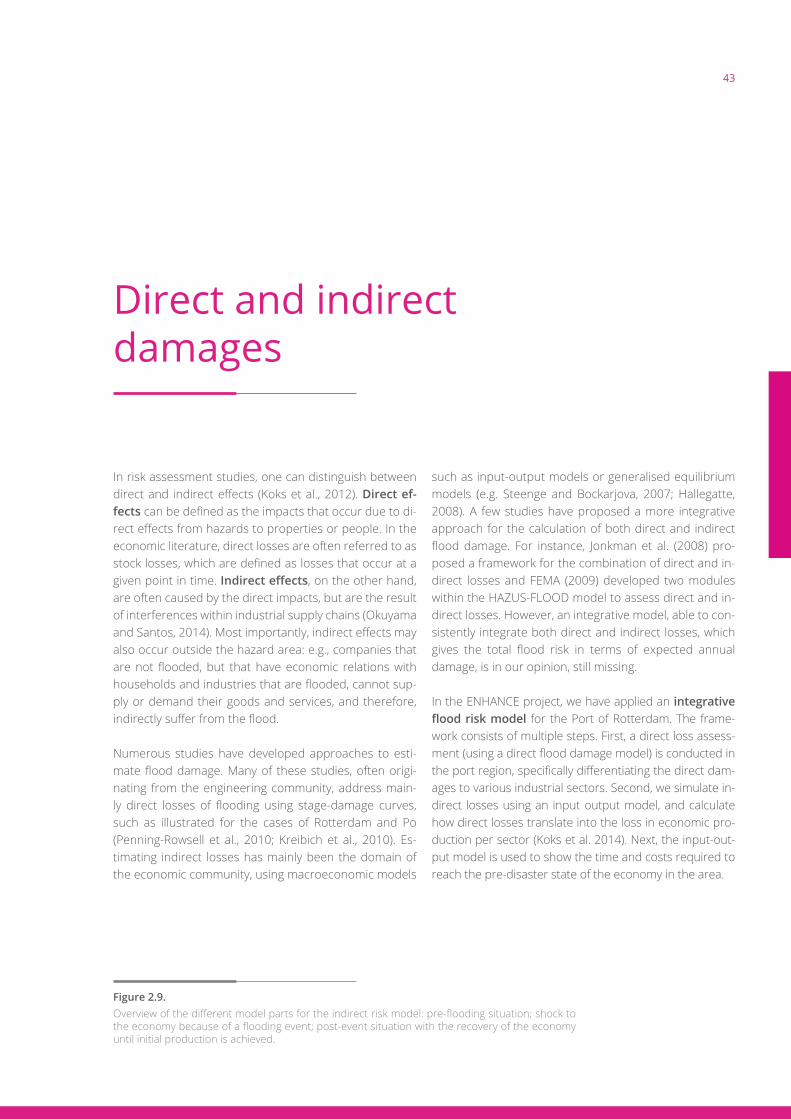
Figure 2.9.Overview of the different model parts for the indirect risk model: pre-flooding situation; shock to the economy because of a flooding event; post-event situation with the recovery of the economy until initial production is achieved.

44 Risk assessment and information
Extreme events and statistics
In risk assessment, it is often difficult to attach a probability to a certain hazard event. This pertains especially for low probability events for which there is little or no empirical data. For these situations, extreme value theory is need-ed to model statistical properties of extreme events that lie outside the range of observed data. The usual statistical techniques focus on average events, and have a great bias in estimating extremes. One reason for this is that stand-ard estimation techniques only serve well where there is a large density of observed data. Furthermore, most data is (naturally) concentrated toward the center of the distri-bution (the average) and so, by definition, extreme data is scarce and therefore estimation is challenging.
6,000
10 100 500 2000
8,000
10,000
12,000
14,000
16,000
18,000
Standardized Gumbel variate
Return period (years)
Q (m
3 /s)
1 2 3 4 5 6 7 8
Figure 2.10.Fitting an extreme value Gumbel plot through measured discharge data for the Rhine Basin.
Figure 2.10 shows an example of fitting extreme value statis-tics (A so called ‘Gumbel plot’) through measured data of river discharges for the river Rhine in the Netherlands (the black dots). Since only ~100-150 years of measurements are availa-ble, the rarest event is the maximum discharge in that period: ~12500 m3/s, with a probability of ~1/100. However, for policy reasons, we would like to estimate an extreme discharge that has a probability of 1/1000. Therefore, we need to extrapolate the measured data using extreme value statistics, which gives us a discharge of ~16000 m3/s.

45
A further complication is the dependency between ex-treme events which is now tackled within the ENHANCE project via a ‘Copula approach’. Copulas are useful for modelling dependencies between continuous random variables. Using a copula model allows to separate the se-lection of the marginal distributions (e.g. the risk in form of loss distributions) from the selection of the copula (e.g. the dependency between risks). In other words, while the
marginal distributions contain the information of the sep-arate risks, the copula contains the information about the structure of the dependency. Using flood as an example, the application of a copula approach makes it possible to estimate loss distributions between selected regions and countries, explicitly taking their dependency into account (Jongman et al. 2014).
Flood in York, UK, 2007. Copyright: UNISDR.
46 Risk assessment and information
Risk information and policy implications
The importance of the quality-assured, systematically col-lected and thorough datasets on impacts of natural haz-ards, the loss data systems (LDS) have been highlighted by the Sendai Framework for Disaster Risk Reduction 2015-2030 and the OECD.
Currently, empirical data on losses from natural haz-ards in Europe are fragmented and inconsistent. Be-cause open and accessible records on disaster impacts and losses are prejudiced by data gaps, European pol-icy-makers have little choice but to resort to proprietary data collection.
The Sendai Framework calls on the national and regional government to better appreciate the (knowledge of) risk. Empirical and evidence-based risk analysis and as-sessment are a vital part of the disaster risk reduction ef-forts (e.g. JRC, 2015). The open-ended intergovernmental expert working group (IEWG) was instituted to develop a set of indicators for measuring global progress.
The Sendai Framework is not alone in this quest. The OECD invited the member countries to better prepare for catastrophic and critical risks (OECD, 2010, 2014). The draft Sendai Framework indicators focus currently on di-rect damage and structural/physical losses. However, the OECD recommended considering the whole distribu-tional and implied ripple or spillover effects of natural hazards, which is now also discussed between countries and UNISDR.
The European Union Civil Protection Mechanism (EC, 2013) compels the EU member states to conduct risk as-
sessments, where possible also in economic terms, at na-tional or appropriate sub-national level. They also have to make a summary of the relevant elements thereof availa-ble to the Commission by December 2015 and every three years thereafter. For both purposes, the Joint Research Centre (JRC) is developing loss indicators that should be part of operational disaster loss databases (De Groeve et al., 2013; 2014; 2015).
Photo by hotblack/Morguefile.

47
48 Introduction
Bockarjova, M. (2007). Major Disasters in Modern Eco-nomies: An Input-Output Based Approach at Modelling Imbalances and Disproportions. PhD thesis, University of Twente.
EC (2013). Decision No 1313/2013/EU of the European Parlia-ment and of the Council of 17 December 2013 on a Union Ci-vil Protection Mechanism, Off. J. Eur. Union, (L.347), 924–947.
EC (2014). Regulation (EU) No 661/2014 of the Euro-pean Parliament and of the Council of 15 May 2014 amending Council Regulation (EC) No 2012/2002 esta-blishing the European Union Solidarity Fund.
Eco (2002). Council regulation (EC) No 2012/2002 of 11 November 2002 establishing the European Union Solida-rity Fund, Off. J. Eur. Communities, (L 311/3 14.11.2002) Available at: http://eur-lex.europa.eu/LexUriServ/LexU-riServ.do?uri=OJ:L:2002:311:0003:0008:EN:PDF, 2002.
De Groeve, T., Poljansek, K. and Ehrlich, D. (2013). Re-cording Disaster Losses Recommendations for a Euro-pean approach.
De Groeve, T., Poljansek, K., Ehrlich, D. and Corbane, C. (2014). Current status and best practices for disas-ter loss data recording in EU Member States, European Commission - Joint Research Centre: Institute for the Protection and the Security of the Citizen, Ispra.
Grossi, P. and Kunreuther, H. (2005). Catastrophe Mo-deling: A New Approach to Managing Risk, New York: Springer.
Falkenmark, M. (1986). Fresh water - Time for a modi-fied approach. Ambio, 15(4), 192–200.
Falkenmark, M., Berntell, A., Jagerskog, A., Lundqvist, J., Matz, M., Tropp, H. (2007). On the Verge of a New Water Scarcity: A Call for Good Governance and Human Inge-nuity. Stockholm International Water Institute (SIWI).
FEMA (2009). HAZUS-MH MR4 Flood Model Technical Manual, Federal Emergency Management Agency, Mi-tigation Division, Washington, D.C.
Koks, E.E., Bockarjova, M., Moel, H. de & Aerts, J.C.J.H. (2014). Integrated Direct and Indirect Flood Risk Mode-ling: Development and Sensitivity Analysis. Risk Analy-sis. 10.1111/risa.12300.
Hallegatte, S. (2008). An Adaptive Regional Input-Out-put Model and its Application to the Assessment of the Economic Cost of Katrina. Risk Analysis, 28: 779–799. doi: 10.1111/j.1539-6924.2008.01046.x.
Jongman, B., Hochrainer-Stigler, S., Feyen, L., Aerts, J.C.J.H., Mechler, R., Botzen, W.J.W., Bouwer, L.M., Pflug, G., Rojas, R., Ward, P.J. (2014). Increasing stress on di-saster-risk finance due to large floods. Nature Climate Change 4, 264–268. doi:10.1038/nclimate2124.
Jonkman, S.N., Bockarjova, M., Kok, M., & Bernardini, P. (2008). Integrated hydrodynamic and economic modelling of flood damage in the Netherlands. Ecological Economics, 66(1), 77-90. Special Section: Integrated Hydro-Economic Model-ling for Effective and Sustainable Water Management.
References

49
JRC (2015). Guidance for Recording and Sharing Di-saster Damage and Loss Data: Towards the develop-ment of operational indicators to translate the Sendai Framework into action, Joint Research Centre, Institute for the Protection and Security of the Citizen and the EU expert working group on disaster damage and loss data, Ispra., 2015.
Kellermann, P., A. Schöbel, G. Kundela, A.H. Thieken (2015). Estimating flood damage to railway infrastructure – the case study of the March River flood in 2006 at the Austrian Northern Railway. –Nat. Hazards Earth Syst. Sci. 15: 2485-2496; discussion paper in Nat. Hazards Earth Syst. Sci. Dis-cuss. 3: 2629-2663, doi: 10.5194/nhessd-3-2629-2015.
Kellermann, P., Schönberger, C., and Thieken, A. H.: Large-scale application of the flood damage model Railway Infrastructure Loss (RAIL), Nat. Hazards Earth Syst. Sci. Discuss., doi:10.5194/nhess-2016-259, in review, 2016.
Kreibich, H., Seifert, I., Merz, B. and Thieken, A.H. (2010). ‘Development of FLEMOcs - a new model for the esti-mation of flood losses in the commercial sector’, Hy-drological Sciences Journal, 55: 8, 1302 — 1314.
Kron, W. (2005). Flood Risk = Hazard • Values • Vulnera-bility. Water Int 30(1):58–68.
Logar, I., & van den Bergh, J. C. J. M. (2012). Methods to As-sess Costs of Drought Damages and Policies for Drought Mitigation and Adaptation: Review and Recommenda-tions. Water Resources Management 27(6): 1707–20.
Merz, B., and Thieken, A. H. (2009). Flood risk curves and uncertainty bounds, Nat. Hazards, 51, 437-458, doi: 10.1007/s11069-009-9452-6.
Meyer, V., Haase, D., and Scheuer, S. (2009). Flood risk assessment in European river basins - concept, me-thods, and challenges exemplified at the Mulde River, Integrated Environmental Assessment and Manage-ment, 5, 17-26, doi:10.1897/IEAM_2008-031.1.
Monteagudo, D.H., Andreu Alvarez, J., Solera, A., S., Ar-quiola, J. P., Benavent, A. M. (2013). Risk profile of the Júcar River Basin case study. In: Mysiak (ed.) Risk profile case study using the conceptual framework. ENHANCE deliverable 7.1.
Munich Re (2014). Natural catastrophes 2013: Analyses, assessments, positions. Topics GEO. Munich Re, Munich.
Munich Re (2015). Loss events worldwide 2014: 10 costliest events ordered by insured losses. Munich Re Geo Risks Research, NatCatSERVICE.
NYC (2013). SIRR report. http://www.nyc.gov/html/sirr/html/home/home.shtml.
OECD (2010). Recommendation of the Council on good practices for mitigating and financing catastrophic risks. Good practices for mitigating and financing ca-tastrophic risks OECD recommendation.
OECD (2014). Recommendation of the Council on the governance of critical risks. Adopted on 6 May 2014.
Okuyama, Y. and Santos, J. R. (2014). Disaster impact and input-output analysis, Econ. Syst. Res., 26(1), 1–12.
Penning-Rowsell, E. C., Viavattene, C., Pardoe, J., Chat-terton, J., Parker, D., and Morris, J. (2010). The benefits of flood and coastal risk management: a handbook of assessment techniques – 2010, Flood Hazard Research Centre, Middlesex University Press.
Pereira, L. S., Cordery, I., & Iacovides, I. (2009). Coping with water scarcity: Adressing the challenges.
Van Wetsen (2015). http://www.charim.net/methodo-logy/55.
Veldkamp, T.I.E., Wada, Y., Aerts, J.C.J.H., Ward, P.J. (in review). A first step towards a global water scarcity risk assessment framework using probabilistic methods. Env. Research Letters.
Veldkamp, T.I.E & Ward, P.J. (2015). Report on global scale assessment of physical and social water scarcity. EartH2Observe Deliverable 2.6.
Wilhite, D. A. (2005). Drought and Water Crises: Science, Technology, and Management Issues.
Wilhite, D.A., & Glantz, M.H. (1985). Understan-ding: the drought phenomenon: the role of defi-nitions. Water International, 10, 3, 111-120. Doi: 10.1080/02508068508686328.
Zargar, A., Sadiq, R., Naser, B., Khan, F. I. (2011). A review of drought indices. Environmental Reviews, 19(NA), 333-349.