007-0189 expectations and perceptions of individual …€¦ · this study presents an evaluation...
TRANSCRIPT
007-0189
Expectations and Perceptions of Individual Bank Clients with High Earnings in
the Municipality of São Paulo - Brazil
Maria Aparecida Gouvêa
University of São Paulo, Brazil
Av. Prof. Luciano Gualberto, 908 Cidade Universitária Sala – E110
ZIP CODE 05508-900 SP
e-mail: [email protected] Phone: 55 11 30916044
Ana Carolina Raduan Masano
University of São Paulo, Brazil
Av. Prof. Luciano Gualberto, 908 Cidade Universitária Sala – E110
ZIP CODE 05508-900 SP
e-mail: [email protected] Phone: 55 11 30916044
POMS 18th Annual Conference
Dallas, Texas, U.S.A.
May 4 to May 7, 2007

ABSTRACT
This study presents an evaluation of expectations and perceptions of individual
bank clients with high earnings in the municipality of São Paulo, in Brazil. A
quantitative survey with 206 interviewees was carried through drawing on attributes of
bank services as well as models and scales provided by the relevant literature. The
scales of quality, satisfaction and loyalty were analyzed in terms of reliability and
validity. Additionally, it was found that whereas clients’ expectations were high, their
perceptions regarding some aspects of the quality of bank services presented lower
scores. These results can provide relevant directions to the banks that intend to improve
the quality of their services.
Keywords:
Bank clients, Quality, Loyalty
INTRODUCTION
The service sector is becoming predominant in the Brazilian economy, whether looked
at from the aspect of production or employment. Data from the Brazilian Institute of
Geography and Statistics (IBGE) show that since the 1950s more than half the wealth
produced in the country has come from the service sector, a reality shared in large part
by both developed as well as developing economies.
Services have been an integral part of our daily lives, right from the origins of social
life, but only in the XXth century was segmentation of the economy into three sectors
(primary, secondary and tertiary, or service) suggested and the stages of development
linked to each one of them explained. Later on, in the 1970s, the first management
studies appeared, outlining the differences between the service sector and the goods
sector, announcing the importance of a management focus that includes their particular,
individual aspects. Even though management and marketing theories are valid for the
most diverse range of companies, the intrinsic and singular characteristics of the service
world were evidence of the need for a management that was alive to its specific issues.
The management of service operations is firmly established as a field of study that covers
all service industries. [...] the discipline was recognized as an academic field and
designated as a separate line of studies by the Decision Sciences Institute (DSI), at its
meeting in 1987, in Boston, and in 1989 the Journal of Service Industry Management was
set up. Finally, in 1990, in France, the First International Research Seminar on the
Management of Services was held and attracted participants from the operations
management, marketing and organizational behavior areas. This conference recognized the
multidisciplinary nature of services and abolished the words “of operations” in order to
thus emphasize the integrating nature of service management. (FITZSIMMONS, J.;
FITZSIMMONS, M., 2005, p.xi).
Without disregarding the importance of integrated management, the chronological
congruence shared by the development of service management theories and increasingly
fierce competition resulting from a scenario that seems to have few frontiers, thereby
increasing consumer choice, were evidence of the need for customer-focused
management. In this context, service quality, which by its very definition includes the
mapping out of consumer expectations and perceptions relating to multiple aspects, and
the contrast between them, assumes a particular character and one of outstanding
competitive importance.
During the 1980s and 1990s research into service quality evolved consistently, with
models and scales for measuring it being proposed, and became closely linked with
consumer behavior studies, thus making it possible to understand the aspects involved
in its formation and making quality the antecedent to satisfaction and loyalty.
In this study we propose to investigate quality in banking services, focusing specifically
on the high income individuals’ personal banking segment in the City of São Paulo.
From quantitative research with the clients of these banks, we mapped out their
expectations and perceptions relating to a set of attributes that concern the provision of
banking services and that reflect the relationships between Quality, Satisfaction and
Loyalty in this marketing context.
This study aims to measure the perceptions of clients of the high income personal
banking market in the City of São Paulo, and to develop constructs that will allow us to
evaluate the quality of the banking service and the satisfaction and loyalty of the high
income clients in this sector.
THEORETICAL FOUNDATION
Service quality
Though services are considered to be the center of economic activities in the modern
world and have been present in society since the origins of social life, studies into
service quality and the introduction of this subject on the agenda of managers are recent.
It was only in the 1980s that the first service quality studies and models appeared.
Marshall et al. (1985) divide service marketing studies into three phases: (i) the
Exploratory Phase; (ii) the Discovery Phase; (iii) the Consolidation Phase. Service
quality studies fell into the third phase in the 1980s when the lines of research into
service and quality came together to investigate service quality.
Grönroos (1993) was the first to study service quality and propose a service quality
model: “In service marketing literature an approach to service-oriented quality was
introduced by Grönroos in 1982 with the concept of Perceived Service Quality and the
Total Service Quality Model” (GRÖNROOS, 1993, p.46).
In 1983, Zeithaml, Parasuraman and Berry (1990) started extensive research in the area
of service quality and recorded as some of its most important by-products (i) a proposal
for the definition of service quality; (ii) understanding service quality as a
multidimensional concept; (iii) the service quality model based on gaps, and (iv) the
SERVQUAL scale as an instrument for measuring service quality.
The works of Grönroos (1993) and Zeithaml et al. (1990) bear a relationship with one
another in that they understand that perceived quality comes from the relationship
between consumer expectations and perceptions, a relationship that was originally
researched by Oliver (1980) in his studies into consumer satisfaction.
At the beginning of the 1990s Cronin Jr. and Taylor (1992) questioned many of
Zeithaml, Parasuraman and Berry’s (1990) proposals and started a productive debate by
proposing a new evaluation methodology for service quality called SERVPERF, in
which service quality is essentially measured by consumer perception. Cronin Jr. and
Taylor (1992), therefore, state that it is not necessary to quantify consumer expectations,
which is the main difference between the two lines of research in this particular area.
To date, the approaches proposed by Zeithaml et al. (1990) and by Cronin Jr. and
Taylor (1992) have become the ones most often used and mentioned in the literature on
the quality of services. Many confirming and comparative studies have been conducted
based on the SERVQUAL and SERVPERF methodologies in several areas of services
and sociocultural contexts, thus maintaining the two theoretical lines alive (MEHTA;
DURVASULA, 1998; ANGUR et al., 1999; LASSAR et al., 2000; MATOS; VEIGA,
2000; REIS, 2001; CARVALHO; LEITE, 2001; GONÇALVES et al., 2002;

SURESHCHANDAR et al., 2002; MELLO et al., 2002, CUI et al., 2003; MIGUEL;
SALOMI, 2004; SALOMI et al., 2005).
SERVQUAL and SERVPERF scales
The SERVQUAL scale, proposed by Zeithaml, Parasuraman and Berry (1990) for
measuring consumer-perceived quality within the service context, is the result of an
extraordinary piece of quantitative research based on the conclusions obtained by the
authors during the qualitative phase of their studies. Successive and combined statistical
analyses of the information collected in the quantitative phase made it possible to
reduce the previously proposed number of service quality dimensions (Five
SERVQUAL dimensions) to five and to include the attributes considered most relevant
when evaluating services (Table 1).
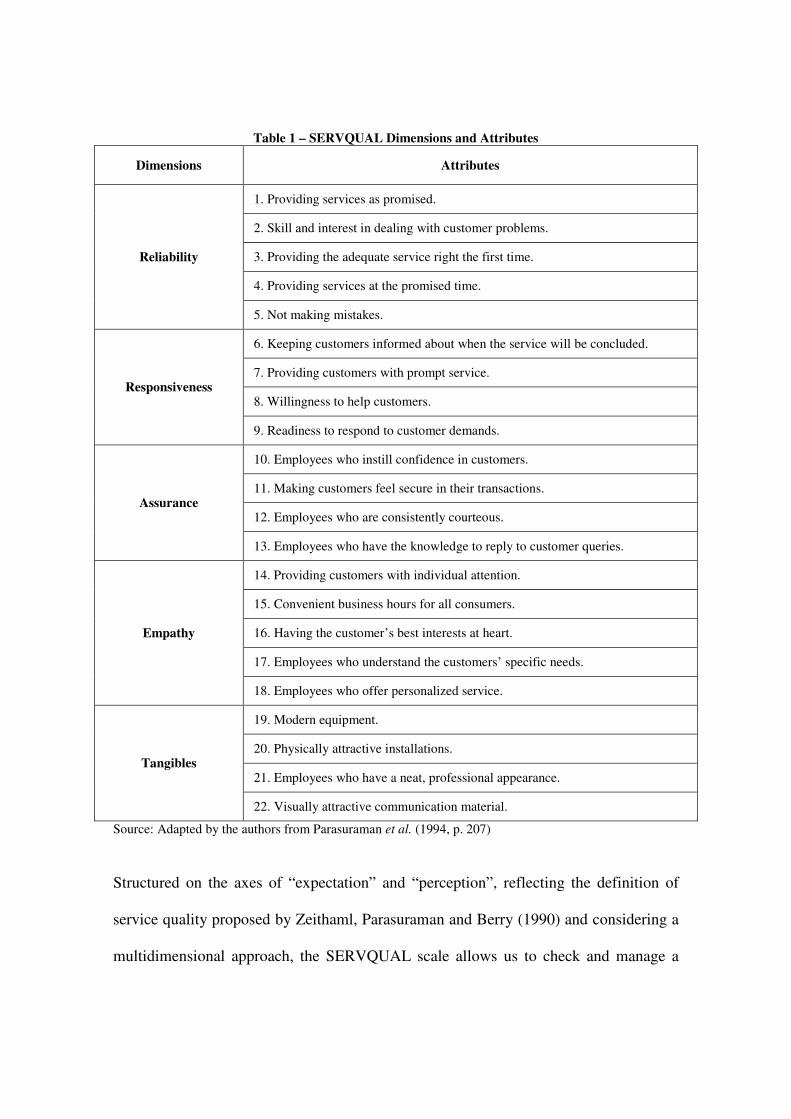
Table 1 – SERVQUAL Dimensions and Attributes
Dimensions Attributes
1. Providing services as promised.
2. Skill and interest in dealing with customer problems.
3. Providing the adequate service right the first time.
4. Providing services at the promised time.
Reliability
5. Not making mistakes.
6. Keeping customers informed about when the service will be concluded.
7. Providing customers with prompt service.
8. Willingness to help customers. Responsiveness
9. Readiness to respond to customer demands.
10. Employees who instill confidence in customers.
11. Making customers feel secure in their transactions.
12. Employees who are consistently courteous. Assurance
13. Employees who have the knowledge to reply to customer queries.
14. Providing customers with individual attention.
15. Convenient business hours for all consumers.
16. Having the customer’s best interests at heart.
17. Employees who understand the customers’ specific needs.
Empathy
18. Employees who offer personalized service.
19. Modern equipment.
20. Physically attractive installations.
21. Employees who have a neat, professional appearance. Tangibles
22. Visually attractive communication material.
Source: Adapted by the authors from Parasuraman et al. (1994, p. 207)
Structured on the axes of “expectation” and “perception”, reflecting the definition of
service quality proposed by Zeithaml, Parasuraman and Berry (1990) and considering a
multidimensional approach, the SERVQUAL scale allows us to check and manage a
measure of service quality (SERVQUAL score) and to understand its main gaps from
the consumer’s point of view.
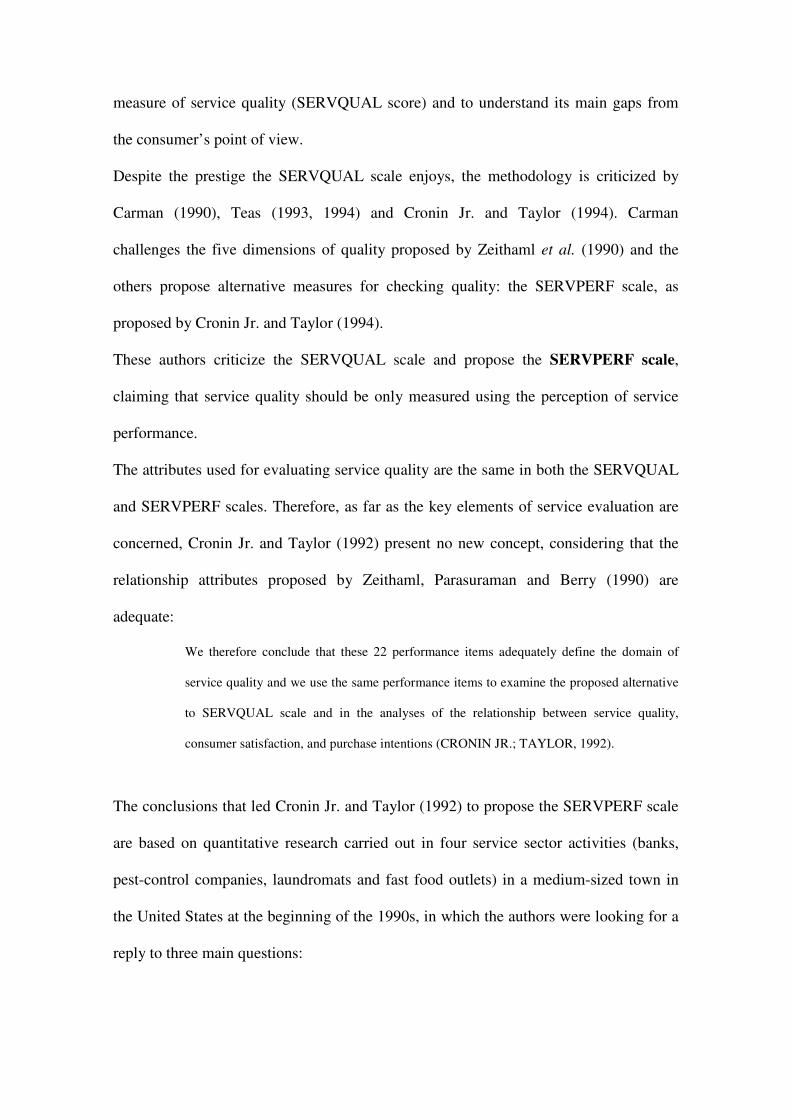
Despite the prestige the SERVQUAL scale enjoys, the methodology is criticized by
Carman (1990), Teas (1993, 1994) and Cronin Jr. and Taylor (1994). Carman
challenges the five dimensions of quality proposed by Zeithaml et al. (1990) and the
others propose alternative measures for checking quality: the SERVPERF scale, as
proposed by Cronin Jr. and Taylor (1994).
These authors criticize the SERVQUAL scale and propose the SERVPERF scale,
claiming that service quality should be only measured using the perception of service
performance.
The attributes used for evaluating service quality are the same in both the SERVQUAL
and SERVPERF scales. Therefore, as far as the key elements of service evaluation are
concerned, Cronin Jr. and Taylor (1992) present no new concept, considering that the
relationship attributes proposed by Zeithaml, Parasuraman and Berry (1990) are
adequate:
We therefore conclude that these 22 performance items adequately define the domain of
service quality and we use the same performance items to examine the proposed alternative
to SERVQUAL scale and in the analyses of the relationship between service quality,
consumer satisfaction, and purchase intentions (CRONIN JR.; TAYLOR, 1992).
The conclusions that led Cronin Jr. and Taylor (1992) to propose the SERVPERF scale
are based on quantitative research carried out in four service sector activities (banks,
pest-control companies, laundromats and fast food outlets) in a medium-sized town in
the United States at the beginning of the 1990s, in which the authors were looking for a
reply to three main questions:
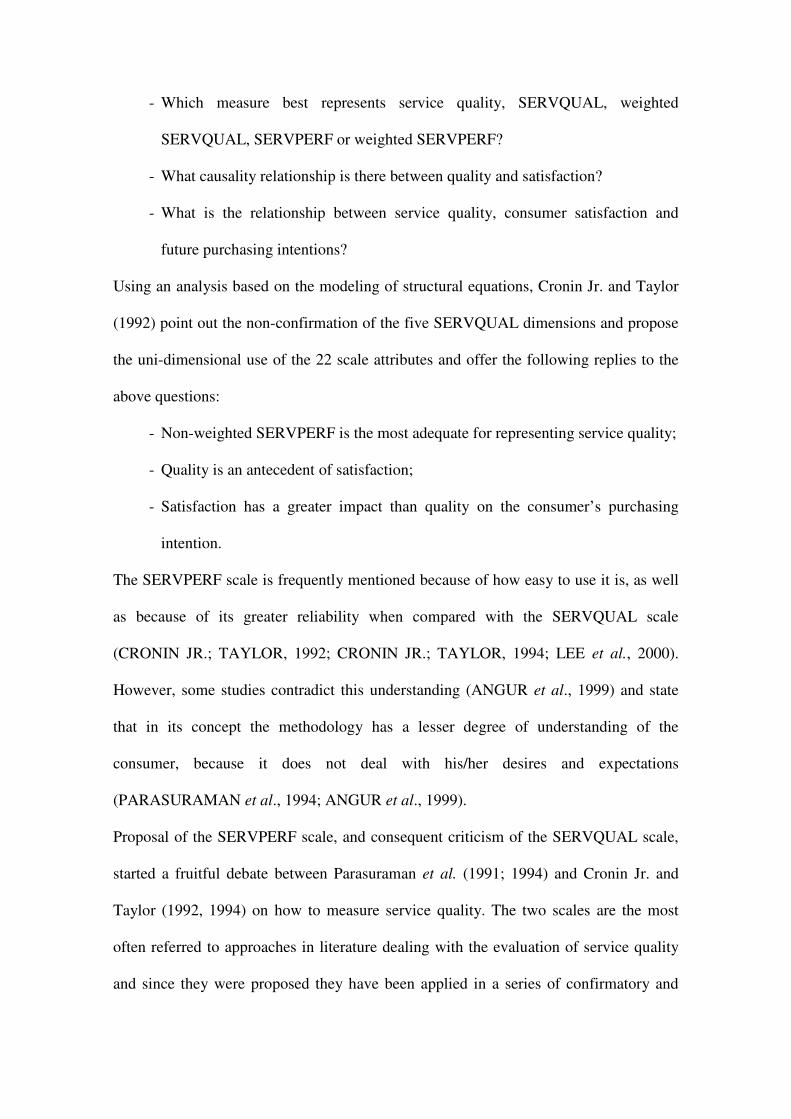
- Which measure best represents service quality, SERVQUAL, weighted
SERVQUAL, SERVPERF or weighted SERVPERF?
- What causality relationship is there between quality and satisfaction?
- What is the relationship between service quality, consumer satisfaction and
future purchasing intentions?
Using an analysis based on the modeling of structural equations, Cronin Jr. and Taylor
(1992) point out the non-confirmation of the five SERVQUAL dimensions and propose
the uni-dimensional use of the 22 scale attributes and offer the following replies to the
above questions:
- Non-weighted SERVPERF is the most adequate for representing service quality;
- Quality is an antecedent of satisfaction;
- Satisfaction has a greater impact than quality on the consumer’s purchasing
intention.
The SERVPERF scale is frequently mentioned because of how easy to use it is, as well
as because of its greater reliability when compared with the SERVQUAL scale
(CRONIN JR.; TAYLOR, 1992; CRONIN JR.; TAYLOR, 1994; LEE et al., 2000).
However, some studies contradict this understanding (ANGUR et al., 1999) and state
that in its concept the methodology has a lesser degree of understanding of the
consumer, because it does not deal with his/her desires and expectations
(PARASURAMAN et al., 1994; ANGUR et al., 1999).
Proposal of the SERVPERF scale, and consequent criticism of the SERVQUAL scale,
started a fruitful debate between Parasuraman et al. (1991; 1994) and Cronin Jr. and
Taylor (1992, 1994) on how to measure service quality. The two scales are the most
often referred to approaches in literature dealing with the evaluation of service quality
and since they were proposed they have been applied in a series of confirmatory and
comparative social economic studies, thus keeping alive both these theoretical currents
(MEHTA; DURVASULA, 1998; ANGUR et al., 1999; LASSAR et al., 2000; MATOS;
VEIGA, 2000; REIS, 2001; CARVALHO; LEITE, 2001; SILVA et al., 2001;
GONÇALVES et al., 2002; SURESHCHANDAR et al., 2002; MELLO et al., 2002,
CUI et al., 2003; MIGUEL; SALOMI, 2004; SALOMI et al., 2005).
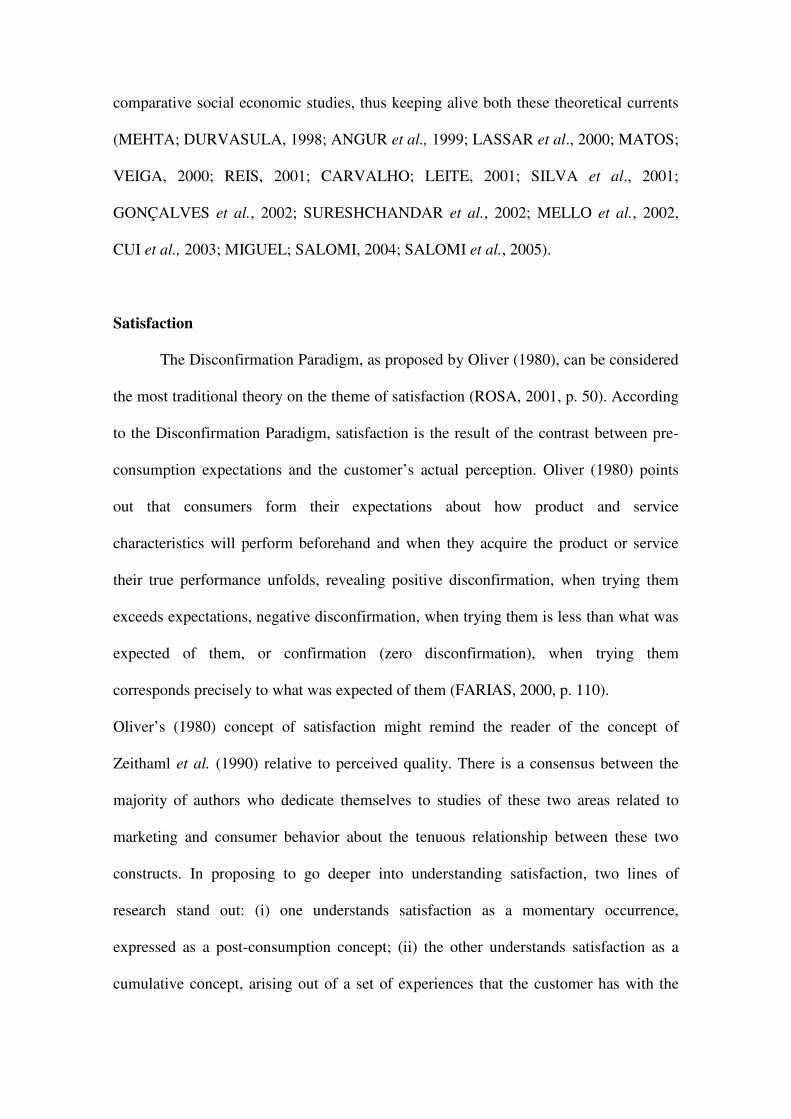
Satisfaction
The Disconfirmation Paradigm, as proposed by Oliver (1980), can be considered
the most traditional theory on the theme of satisfaction (ROSA, 2001, p. 50). According
to the Disconfirmation Paradigm, satisfaction is the result of the contrast between pre-
consumption expectations and the customer’s actual perception. Oliver (1980) points
out that consumers form their expectations about how product and service
characteristics will perform beforehand and when they acquire the product or service
their true performance unfolds, revealing positive disconfirmation, when trying them
exceeds expectations, negative disconfirmation, when trying them is less than what was
expected of them, or confirmation (zero disconfirmation), when trying them
corresponds precisely to what was expected of them (FARIAS, 2000, p. 110).
Oliver’s (1980) concept of satisfaction might remind the reader of the concept of
Zeithaml et al. (1990) relative to perceived quality. There is a consensus between the
majority of authors who dedicate themselves to studies of these two areas related to
marketing and consumer behavior about the tenuous relationship between these two
constructs. In proposing to go deeper into understanding satisfaction, two lines of
research stand out: (i) one understands satisfaction as a momentary occurrence,
expressed as a post-consumption concept; (ii) the other understands satisfaction as a
cumulative concept, arising out of a set of experiences that the customer has with the

company and that indicates a cause and effect relationship between the perceived
quality and satisfaction constructs, with quality being an antecedent of satisfaction
(ZEITHAML; BITNER, 2003, p. 87; ROSA, 2001, p. 47-62).
When it is understood as a momentary experience, satisfaction is seen as the result of
the customer’s perception of a specific consumption experience, in which the customer
compares what was expected with what was received; when dealt with as cumulative
experience, satisfaction is understood as a concept based on the global consumption
experience over a particular period of time (KRISTENSEN et al., 1999 apud ROSA,
2001; FORNEL, 1992). The most recent academic publications defend the
understanding of satisfaction as a global judgment formed from multiple consumption
experiences, or even as consumer feeling expressed in response to interaction
experiences over a period of time, thus classifying satisfaction as a consequence of
perceived quality (TSE; WILTON, 1988 apud ROSA, 2001; BOLTON; DREW, 1991;
CRONIN JR.; TAYLOR, 1992; ANDERSON; SULLIVAN, 1993; FORNEL, 1996;
PRADO, 2004).
Some academics have dealt with satisfaction as the result of an outcome-oriented process,
relating it to pre-defined standards, compared to the performance perception of the products
and/or services consumed [...] The process-oriented approach has introduced a broader view
of Consumer Satisfaction to the extent that it conceives of it from the consumption
experience as a whole (PRADO, 2004).
Over the last twenty years research into satisfaction has tried to identify and outline its
antecedents and its consequences. In addition to perceived quality, aspects such as
attachment, emotion, price, value and equity have been shown to have an influence on
the formation of satisfaction (OLIVER, 1993; CRONIN JR. et al., 2000; WIRTZ;
BATESON, 1999). With regard to the consequences, consumer loyalty and greater
corporate profitability are frequently mentioned in literature, although the intensity of

the relationship between the constructs mirrors great variability among the different
activities and social economic contexts (FORNELL, 1992; BLOEMER et al., 1998;
OLSEN, 2002; PRADO, 2004; GASTAL, 2005).
The issue of how to assess customer satisfaction has accompanied the conceptual
evolution of the subject. As we also understand that satisfaction is the global assessment
of a product or service we researched works that present proposals for alternative ways
of measuring satisfaction within such a concept.
Loyalty
“For at least thirty years the study of repeat buying, of loyalty and its antecedents have
been discussed in academia.” (PRADO; SANTOS, 2003, p.22). The lively interest in
the subject is justified by the undoubtedly positive relationship that exists between
consumer loyalty and company profitability, with loyalty therefore being an outstanding
source of competitive advantage. “[...] loyal customers are less motivated to look for
alternatives, are more resistant to persuasion by competitors and more likely to engage
in word of mouth communication behaviors” (GASTAL, 2005, p.30).
Loyalty was initially understood as repeat purchase behavior and then subsequently as a
dynamic concept that combines both behavioral and attitude aspects (PRADO, 2004, p.
90). Illustration 1 gives the definition proposed by Dick and Basu (1994), which
explains that loyalty is only actually found when a relatively favorable attitude to the
company and repeat purchase behavior co-exist. This understanding is shared by Sheth
et al. (1999), when they define loyalty as the customer’s commitment to the supplier,
sustained by a significantly favorable attitude (attitudinal type) and manifest by
consistent purchase repetition (behavioral type).
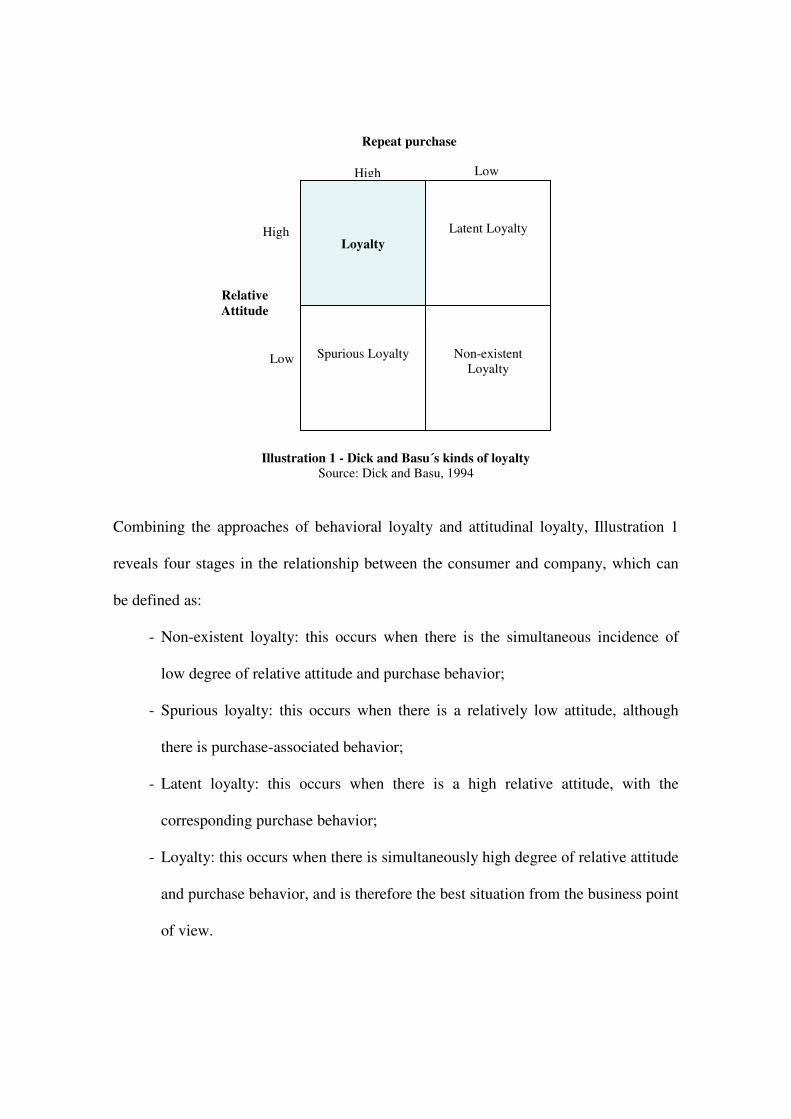
Illustration 1 - Dick and Basu´s kinds of loyalty Source: Dick and Basu, 1994
Combining the approaches of behavioral loyalty and attitudinal loyalty, Illustration 1
reveals four stages in the relationship between the consumer and company, which can
be defined as:
- Non-existent loyalty: this occurs when there is the simultaneous incidence of
low degree of relative attitude and purchase behavior;
- Spurious loyalty: this occurs when there is a relatively low attitude, although
there is purchase-associated behavior;
- Latent loyalty: this occurs when there is a high relative attitude, with the
corresponding purchase behavior;
- Loyalty: this occurs when there is simultaneously high degree of relative attitude
and purchase behavior, and is therefore the best situation from the business point
of view.
Loyalty
Latent Loyalty
Spurious Loyalty
Non-existent Loyalty
Repeat purchase
High Low
High
Low
Relative Attitude

Oliver (1999) also points out that loyalty must be understood as a dynamic and evolving
process, which divides into four phases: (i) cognitive loyalty; (ii) affective loyalty; (iii)
connative loyalty; and (iv) action loyalty. For Oliver (1995, apud ROSA, 2001), the
phases of the loyalty process intervene with the satisfaction perceived by the customer
and with the efforts of the competitors to conquer him/her, thus representing increasing
conditions of loyalty building. The relation between satisfaction and loyalty suggested
by Oliver (1999) was explored in greater depth by the author himself, who finally
concluded that satisfaction must be understood as the start of a process that culminates
in a situation of loyalty.
The relationship between satisfaction and loyalty was the target of a series of studies
(TAYLOR; BAKER, 1994; ZEITHAML et al., 1996; FORNELL et al., 1996;
ANDREASSEN; LINDESTAD, 1998; URDAN; RODRIGUES, 1999; CRONIN JR.
et al., 2000; ANDERSON; FORNELL, 2000; OLSEN, 2002). Specifically within the
banking context, the works of Hallowell, 1996; Bloemer et al., 1998; Moutinho and
Smith, 2000; Rosa, 2001; Prado; 2004; and Brei and Rossi, 2005 stand out. Though the
models applied have different degrees of complexity and the intensity of the relation
between satisfaction and loyalty has great variability within the different market
contexts in which the studies were conducted, one concludes that the two constructs
have a positive relation, satisfaction anteceding loyalty.
Over the last twenty years a lot of attention has been paid to satisfaction as the potential
determinant of customer loyalty. Customer satisfaction is considered to be a key component
in the long term relationship between purchasers and those offering, and a satisfied customer
may be motivated once again and recommend the supplier to other potential customers.
(GASTAL, 2005, p. 43).
The understanding of loyalty and its antecedents continues to be a very much alive area
of investigation. Some authors point out that in addition to satisfaction, quality, trust,
the cost of change and formal complaints by consumers are factors that intervene when
it comes to creating loyalty (PRADO, 2004; GASTAL, 2005; BREI; ROSSI, 2005).
Even though an understanding of how loyalty is created is a complex subject, there is a
certain agreement in literature about how it should be measured, as far as the aspects to
be observed so that the existence of the loyalty stage can be defined are concerned.
The evaluation of loyalty is of great interest to the extent that it attests to the degree of
customer loyalty that exists and at the same time allows us to quantify the intensity of
the relationship between loyalty and its antecedents. The following quotations will help
us understand the key factors used in measuring the construct:
- “Measuring to what extent the customer recommends the company is the best
way of measuring his/her loyalty, because the recommendation in itself is a
sacrifice for the customer” (REICHHELD, 2003 apud GASTAL, 2005, p.33);
- Based on the work of Zeithaml et al. (1996) and Sirdeshmukh et al. (2001),
Santos (2001 apud GASTAL, 2005, p.97) indicates intention of future use, word
of mouth communication and expansion of the amount of business done with the
supplier as loyalty indicators.
The Brazilian Personal Banking Market
The majority of the statistics available about the banking market do not segregate
data relative to private individuals from corporate clients; it is, however, estimated
that 60 million Brazilians have a bank checking account (WORLD BANK, 2005). In
2005 this number represented around 70% of the economically active population
(IBGE, 2006). In this section we are seeking to understand the structure, dimension
and segmentation of the Brazilian personal banking market.

The Brazilian banking market is a competitive market. Its history, its dimension, and
the number and types of institutions operating in it are witness to its competitiveness.
However, we can see that, for a very long time, the Brazilian banking market had a
structure based only on two sectors: (i) private individuals vs. corporate clients and
(ii) retail banks vs. wholesale banks. We can state that for years banks understood
private individuals as a group of homogenous consumers in terms of their banking
needs.
Although the concept of market segmentation dates back to the 1950s, only in the
1990s did the Brazilian banking market’s movement towards segmentation become
apparent.
In the late 1990s a new wave of changes began to appear in the Brazilian banking
market, when local banks, following in particular two foreign banks that were
operating in the country, Citibank and BankBoston, stated their specific interest in
prospecting high income consumers (and not served by Private Banks) with the
promise of differentiated products and service. Perceiving an opportunity in a
segment of the population that has high income by Brazilian standards, but that does
not have the potential resources to be considered for the Private Bank sector, some
banks accelerated their segmentation process that was still in its infancy and created
a new personal banking segment structure, which was subsequently “High Income”.
The main thrust in the strategy of Brazilian retail banks has been serving the mass of
customers with standardized service, quickly and conveniently, by providing a high degree
of automation; the counterpart to this low cost, mass service are specialist structures that
focus on customers from the upper echelons. The account manager, a typical tool in
Relationship Marketing, became popular. (PIRES, 1997 apud DESTRO, 2002).
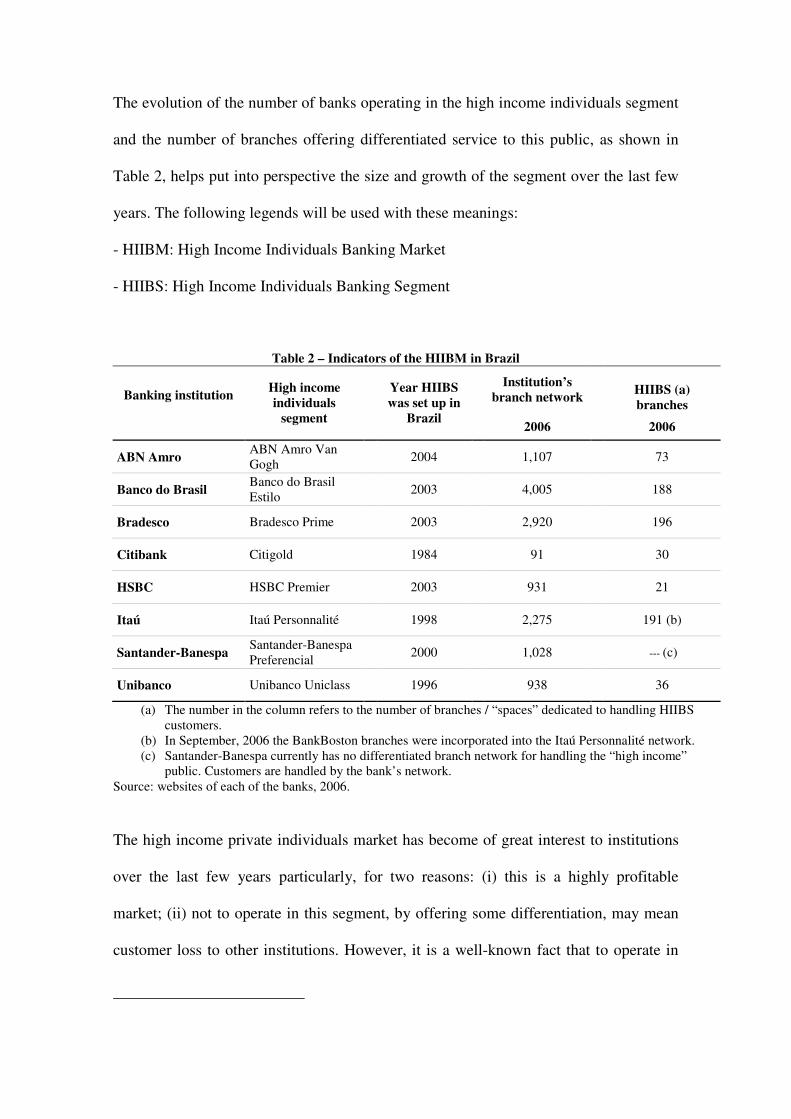
The evolution of the number of banks operating in the high income individuals segment
and the number of branches offering differentiated service to this public, as shown in
Table 2, helps put into perspective the size and growth of the segment over the last few
years. The following legends will be used with these meanings:
- HIIBM: High Income Individuals Banking Market
- HIIBS: High Income Individuals Banking Segment
Table 2 – Indicators of the HIIBM in Brazil
Institution’s branch network
HIIBS (a) branches
Banking institution
High income individuals
segment
Year HIIBS was set up in
Brazil 2006 2006
ABN Amro ABN Amro Van Gogh 2004 1,107 73
Banco do Brasil Banco do Brasil Estilo 2003 4,005 188
Bradesco Bradesco Prime 2003 2,920 196
Citibank Citigold 1984 91 30
HSBC HSBC Premier 2003 931 21
Itaú Itaú Personnalité 1998 2,275 191 (b)
Santander-Banespa Santander-Banespa Preferencial 2000 1,028 --- (c)
Unibanco Unibanco Uniclass 1996 938 36
(a) The number in the column refers to the number of branches / “spaces” dedicated to handling HIIBS customers.
(b) In September, 2006 the BankBoston branches were incorporated into the Itaú Personnalité network. (c) Santander-Banespa currently has no differentiated branch network for handling the “high income”
public. Customers are handled by the bank’s network. Source: websites of each of the banks, 2006.
The high income private individuals market has become of great interest to institutions
over the last few years particularly, for two reasons: (i) this is a highly profitable
market; (ii) not to operate in this segment, by offering some differentiation, may mean
customer loss to other institutions. However, it is a well-known fact that to operate in

this market requires a deep understanding of customer needs and expectations. Weber
(1988, p.18), referring to the American banking market for high income individuals,
emphasized the importance of fully understanding consumer expectations and offering
customized products and services that meet these expectations. He warned that winning
and maintaining these customers is not a simple mission and is far from being based
merely on aspects related to rates or bank charges.
METHODOLOGICAL ASPECTS OF THE STUDY
The methodological procedure for the creation of a model for measurement of quality
of bank services will be described in this section.
Type of research
The research for this study, in line with its objectives, is basically characterized as
conclusive-descriptive, using quantitative techniques.
Sample
We identified the following banks that have a segmented service structure for high
income individuals:
. ABN Real Van Gogh
. Banco do Brasil Estilo
. BankBoston (during the course of this work BankBoston was taken over by Bank
Itaú)
. Bradesco Prime
. Citibank - Citigold
. HSBC Premier
. Itaú Personnalité
. SantanderPreferencial
. Unibanco Uniclass
The sample unit in this work are private individuals who have a checking account in the
city of São Paulo in one of the banking segments mentioned above.
According to Hair Jr. et al. (2005a), sampling methods can be divided into two major
groups: (i) probabilistic sampling, and (ii) non-probabilistic sampling. The approach
used in this work is considered as being non-probabilistic and with intentional sampling.
Data-collection instrument
Before arriving at the final version of the questionnaire we went through two main
steps:
- Step I – The search for bibliographic references to support preparation of the
measuring scale for the quality, satisfaction and loyalty constructs. Particularly for
the quality construct, in addition to outlining the scales (SERVQUAL and
SERVPERF), we sought to also map out the specific and relevant attributes for
evaluating quality within the banking context, following the recommendation of
Zeithaml et al. (1990) that the SERVQUAL list must be adapted every time it is
judged appropriate to do so.
- Step II – Pre-test. According to Kinnear and Taylor (1996, p.501), the pre-test is
necessary for assessing different aspects of the questionnaire, and if necessary
modifying it. Therefore, the pre-test objective is to check:
. if the terms used in the questionnaire are easily understood by the interviewees;
. if the questions were understood as they should be;
. if the reply options cover all possible alternatives;
. if there are any objections to replying to any of the questions.

Aiming to cover these objectives the pre-test was first carried out by applying the
questionnaire personally (direct contact between the interviewer and the interviewee)
and subsequently by sending electronic questionnaires by e-mail. Among the main
adjustments carried out as a result of the pre-test we would highlight:
- The restating of some phrases and questions;
- The choice of the “0 to10” measurement scale, indicated by the majority of those
interviewed in the pre-tests as being easier to express;
- The exclusion of questions relative to the interviewee’s monthly income, since
this was a barrier to completing and returning the questionnaire;
- The decision to question the customer as to the expectations he/she has with
regard to the HIIBS service with which they have a relationship and not in
relation to the “high income” banking market, since this latter proved to be a
difficult concept to understand.
We also asked if the interviewees considered that the questionnaire failed to cover some
relevant point for assessing banking services, considering the target-audience of the
research. They considered that the included attributes were enough.
In this way we arrived at the questionnaire applied, which is divided into three blocks:
I. Banking relationship – in this initial block we sought to: (i) understand the
possession or otherwise of an HIIBS checking account; (ii) outline which
checking account was most used, if the interviewee indicated he/she had more
than one HIIBS account; and (iii) measure how long the customer had a
relationship with the HIIBS;
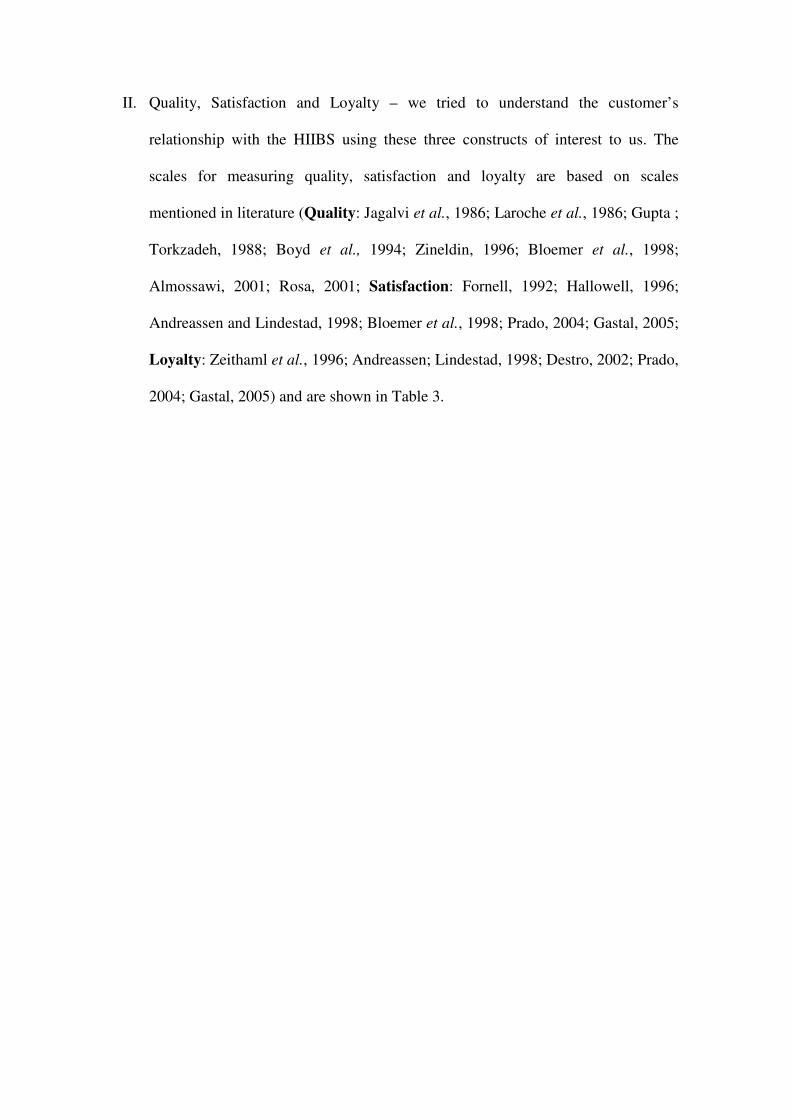
II. Quality, Satisfaction and Loyalty – we tried to understand the customer’s
relationship with the HIIBS using these three constructs of interest to us. The
scales for measuring quality, satisfaction and loyalty are based on scales
mentioned in literature (Quality: Jagalvi et al., 1986; Laroche et al., 1986; Gupta ;
Torkzadeh, 1988; Boyd et al., 1994; Zineldin, 1996; Bloemer et al., 1998;
Almossawi, 2001; Rosa, 2001; Satisfaction: Fornell, 1992; Hallowell, 1996;
Andreassen and Lindestad, 1998; Bloemer et al., 1998; Prado, 2004; Gastal, 2005;
Loyalty: Zeithaml et al., 1996; Andreassen; Lindestad, 1998; Destro, 2002; Prado,
2004; Gastal, 2005) and are shown in Table 3.

Table 3 – Scales for the Quality, Satisfaction and Loyalty Constructs Construct
Expectations and Perceptions
Branch physical installations (V4a)
Branch locations (V4b)
Branch parking lot (V4c)
Waiting time at the branch cash-desk (V4d)
Responsive employees (V4e)
Service agility (V4f)
Precision in the information given (V4g)
Confidence in the account manager (V4h)
Quality Actions taken when faced with problems and complaints (V4i)
Personalized service (V4j)
Financial assistance and guidance (V4k)
Pro-activity of the account manager (V4l)
Credibility of the institution (V4m)
Error-free banking transactions (V4n)
Internet banking service (V4o)
ATMs: number and location (V4p)
Offer of products and services (V4q)
Question
What is your level of satisfaction with regard to HIIBS X? (V6) Satisfaction
Relative to your ideal bank how would you evaluate HIIBS X? (V7)
Indicate how probable it is you will:
Recommend the bank to friends and relatives? (V9a)
Keep your checking account open for the next 2 years? (V9b) Loyalty
Increase your business with the bank over the next 2 years? (V9c)
* The variables "v4" will always be accompanied by the suffix "e" or "p",
corresponding to “expectation” and “perception” of the attribute in question,
respectively.
III. Demographic data – the last block of the questionnaire sought to map out the
gender, age band and activity of the HIIBS customers.
Data collection
Due to the research characteristics and the size of the sample we chose to use an
electronic questionnaire sent by e-mail. The electronic questionnaire was sent to the
12,000 people selected for the sample by e-mail, in which we set out the following
information:
- Research objective;
- Academic nature of the research;
- Faculty and university where the project was being developed;
- Identity data of the project’s author (Name, e-mail address and USP-University
of São Paulo number);
- Name of the project tutor.
For selecting the public and sending the e-mails we used the DataListas service
(www.datalistas.com.br). The choice of which database to use was based on the criteria
(i) updated data; (ii) representitiveness of the database relative to the universe of
customers; and (iii) the possibility of segmentation by income and municipality. The
sample selection used the following criteria:
- Income in excess of R$ 5,000 per month;
- Fixed abode in the City of São Paulo;
- E-mail addressed open to receiving the questionnaire.
To make it impossible for each questionnaire to be replied to more than once, the access
link was codified. The e-mails with the link to the questionnaire were sent during June,
2006 and for this study we considered replies received by July 31,2006.
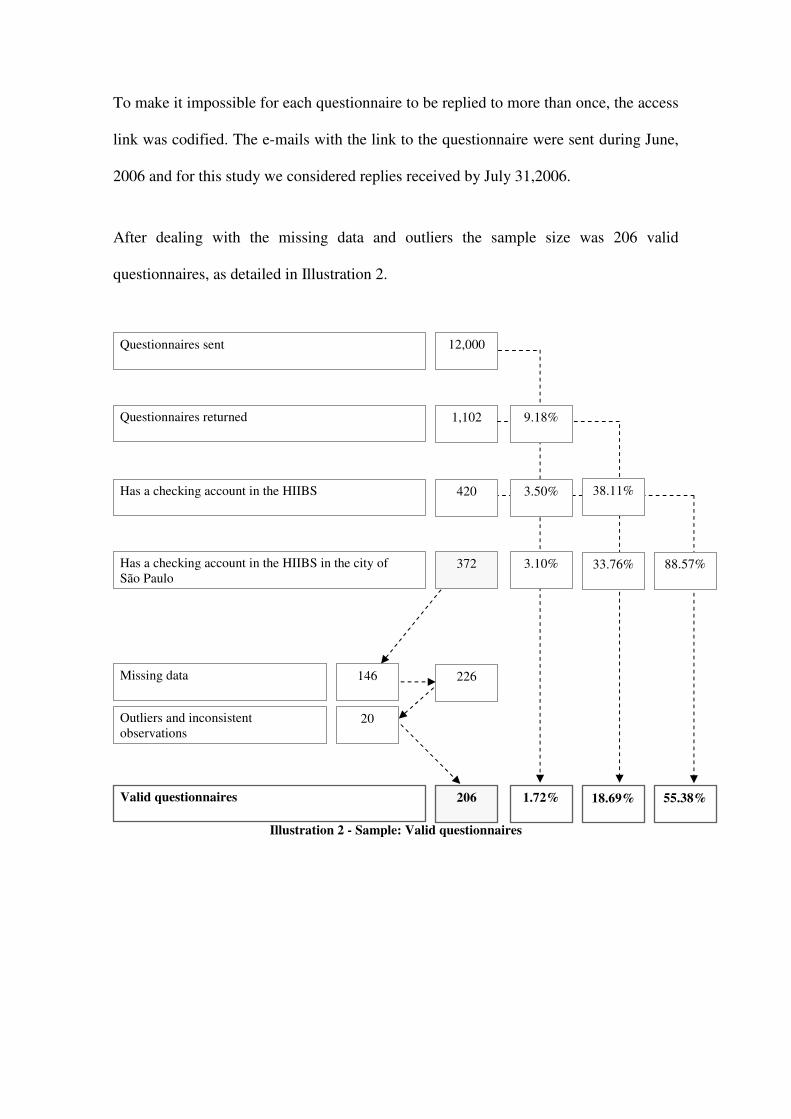
After dealing with the missing data and outliers the sample size was 206 valid
questionnaires, as detailed in Illustration 2.
Illustration 2 - Sample: Valid questionnaires
Has a checking account in the HIIBS
Questionnaires sent 12,000
Questionnaires returned 1,102
Has a checking account in the HIIBS in the city of São Paulo
372
9.18%
420 3.50% 38.11%
Missing data 146
Outliers and inconsistent observations
20
226
Valid questionnaires 206 1.72% 18.69% 55.38%
3.10% 33.76% 88.57%

ANALYSIS OF THE RESULTS
Measuring the Quality, Satisfaction and Loyalty constructs
In this study we did not choose a priori to check the service quality measurement using
either one or other of the SERVQUAL or SERVPERF scales; we used both. The
information about expectations and perceptions was collected in relation to a series of
attributes considered relevant for evaluating the quality of banking services, making it
possible to measure a “Quality Score” using both methods. In this way we initially
calculated four quality measures which were analyzed from the point of view of
reliability and validity, and then we decided which was the most appropriate way of
measuring quality within the context of this study.
Following the methodology proposed by Zeithaml et al. (1990) and by Cronin Jr. and
Taylor (1992; 1994), we considered the five dimensions of the SERVQUAL scale and
the uni-dimensionality of the SERVPERF scale. The measuring process of the latent
constructs from their scales was done in the following way:
- Quality Score using non-weighted SERVQUAL (QUALI_SQN): the
SERVQUAL scale presupposes five dimensions and its score was obtained
following the three steps described by Zeithaml et al. (1990):
- Measuring the gaps of the variables, calculated by the differences between
perceptions and expectations;
- Measuring the gaps of the dimensions, calculated from the simple average
of the gaps of the attributes that comprise the dimensions;
- Calculating the quality measure using the simple average of the gaps of the
five dimensions.

- Quality Score – Weighted SERVQUAL Score (QUALI_SQW): still
presupposing five dimensions the score was obtained following the three steps:
- Measuring the gaps of the variables, calculated by the differences
between perceptions and expectations;
- Measuring the gaps of the dimensions, calculated from the simple
average of the gaps of the attributes that comprise the dimensions;
- Calculating the quality measure using the weighted average of the gaps
of the five dimensions based on the declarations of their importance, as
expressed by the customers.
- Quality Score using average SERVPERF (QUALI_SQA): following the
methodology described by Cronin Jr. and Taylor (1992) the scale was
presupposed to be uni-dimensional and the “Quality Score” was obtained using
the simple average of all the perception variables.
- Quality Score using factor SERVPERF (QUALI_SQF): considering the uni-
dimensionality proposed by Cronin Jr. and Taylor (1992), the quality measure
was obtained using a “1 factor” analysis.
The factor Satisfaction (SATISF) and factor Loyalty (LOYAL) Scores were
obtained by exploratory factor analysis (1 factor). We extracted the factor scores
resulting from operationalization via the main components with varimax rotation were
extracted.
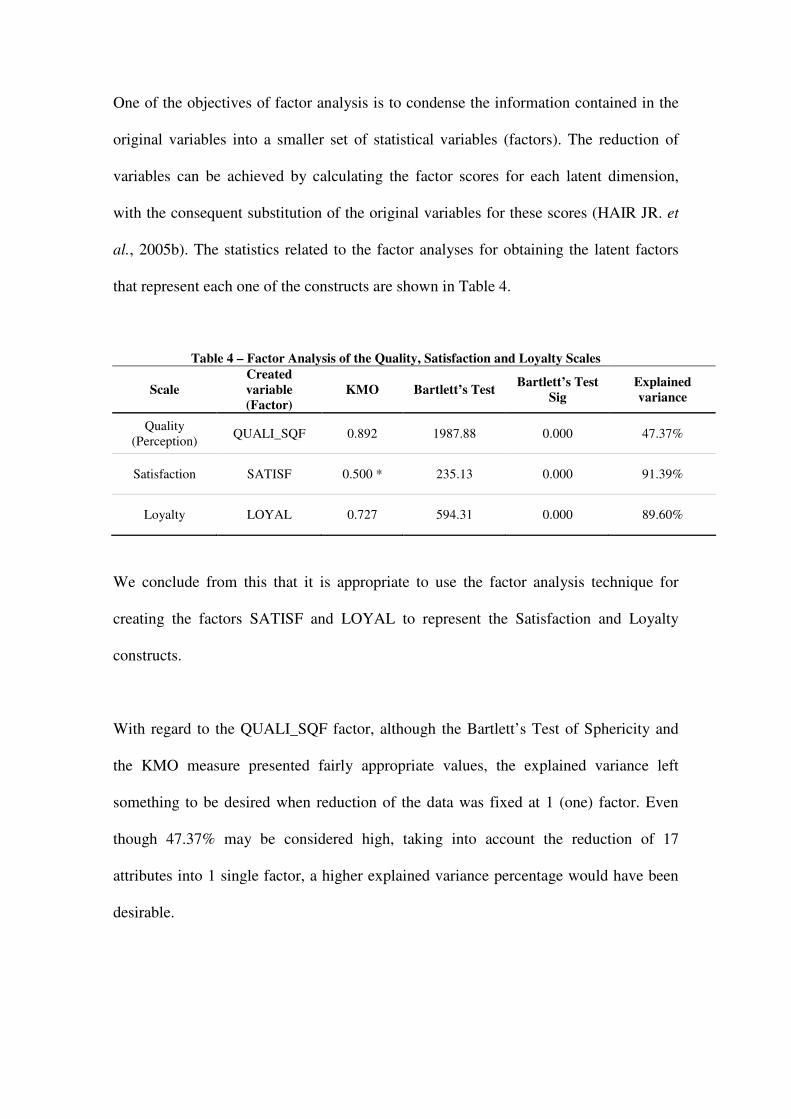
One of the objectives of factor analysis is to condense the information contained in the
original variables into a smaller set of statistical variables (factors). The reduction of
variables can be achieved by calculating the factor scores for each latent dimension,
with the consequent substitution of the original variables for these scores (HAIR JR. et
al., 2005b). The statistics related to the factor analyses for obtaining the latent factors
that represent each one of the constructs are shown in Table 4.
Table 4 – Factor Analysis of the Quality, Satisfaction and Loyalty Scales
Scale Created variable (Factor)
KMO Bartlett’s Test Bartlett’s Test Sig
Explained variance
Quality (Perception) QUALI_SQF 0.892 1987.88 0.000 47.37%
Satisfaction SATISF 0.500 * 235.13 0.000 91.39%
Loyalty LOYAL 0.727 594.31 0.000 89.60%
We conclude from this that it is appropriate to use the factor analysis technique for
creating the factors SATISF and LOYAL to represent the Satisfaction and Loyalty
constructs.
With regard to the QUALI_SQF factor, although the Bartlett’s Test of Sphericity and
the KMO measure presented fairly appropriate values, the explained variance left
something to be desired when reduction of the data was fixed at 1 (one) factor. Even
though 47.37% may be considered high, taking into account the reduction of 17
attributes into 1 single factor, a higher explained variance percentage would have been
desirable.

Reliability of the Quality, Satisfaction and Loyalty Attributes
In this study the reliability of the scales was evaluated using Cronbach’s alpha, a
measurement of the internal consistency, which varies between 0 and 1, with 0.6 being
the lowest acceptable limit (MALHOTRA, 2006, p. 276; HAIR JR. et al., 2005b).
Tables 5 and 6 show Cronbach’s alpha for each of the scales applied, revealing a high
degree of reliability for all of them.
Table 5 – Reliability of the Quality Scales
Gaps Perceptions
Scale Dimension Variables Alpha if item deleted Scale Variables Alpha if
item deleted
GAP_A 0.7202
GAP_B 0.6768
GAP_C 0.6967 V4AP 0.9226
GAP_O 0.7053 V4BP 0.9208
GAP_P 0.6433 V4CP 0.9237
GAP_Q 0.7163 V4DP 0.9234
Tangibles
Alpha 0.7312 V4EP 0.9186
GAP_D 0.8600 V4FP 0.9175
GAP_E 0.7779 V4GP 0.9203
GAP_F 0.5810 V4HP 0.9164
Responsiveness
Alpha 0.8132 V4IP 0.9164
GAP_J -13.2623 V4JP 0.9157
GAP_K 0.8106 V4KP 0.9248
GAP_L -6.0931 V4LP 0.9170
Empathy
Alpha -2.8987 V4MP 0.9216
GAP_H 0.5965 V4NP 0.9230
GAP_I 0.2944 V4OP 0.9263
GAP_M 0.8143 V4PP 0.9197
Assurance
Alpha 0.7193 V4QP 0.9208
GAP_G -
GAP_N -
Qua
lity
– SE
RV
QU
AL
Reliability
Alpha 0.7039
Qua
lity
- SE
RV
PER
F
Alpha 0.9249
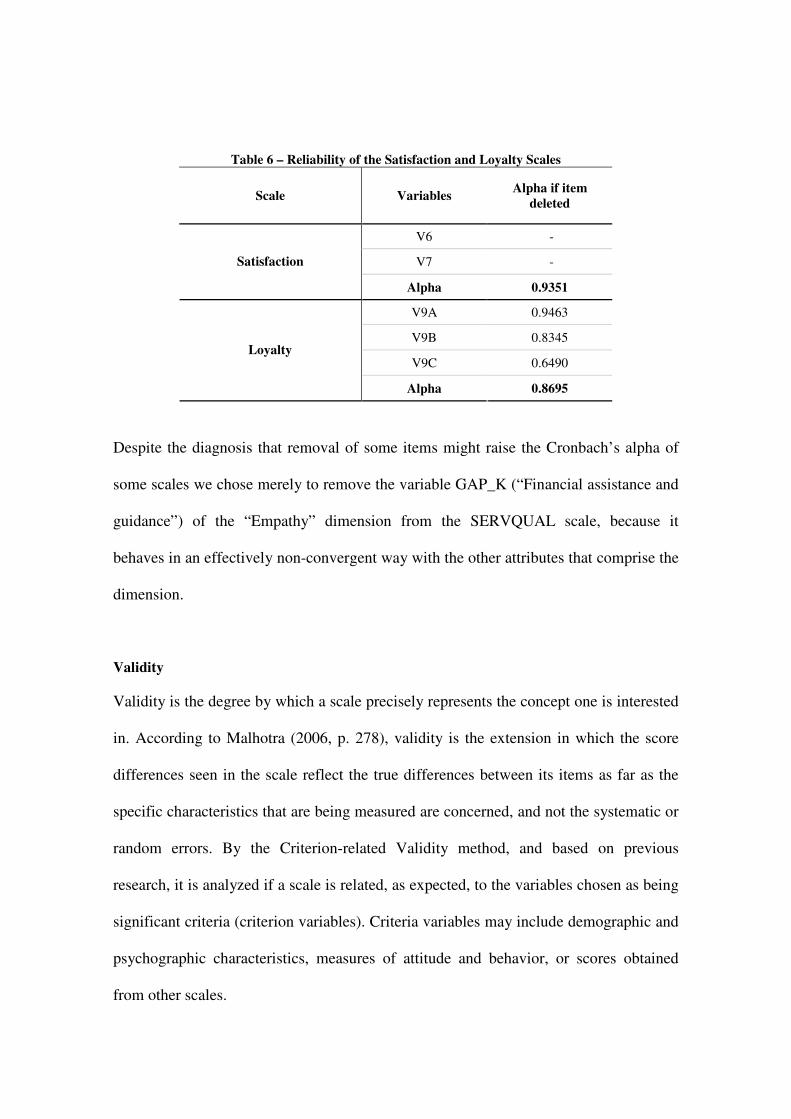
Table 6 – Reliability of the Satisfaction and Loyalty Scales
Scale Variables Alpha if item deleted
V6 -
V7 - Satisfaction
Alpha 0.9351
V9A 0.9463
V9B 0.8345
V9C 0.6490 Loyalty
Alpha 0.8695
Despite the diagnosis that removal of some items might raise the Cronbach’s alpha of
some scales we chose merely to remove the variable GAP_K (“Financial assistance and
guidance”) of the “Empathy” dimension from the SERVQUAL scale, because it
behaves in an effectively non-convergent way with the other attributes that comprise the
dimension.
Validity
Validity is the degree by which a scale precisely represents the concept one is interested
in. According to Malhotra (2006, p. 278), validity is the extension in which the score
differences seen in the scale reflect the true differences between its items as far as the
specific characteristics that are being measured are concerned, and not the systematic or
random errors. By the Criterion-related Validity method, and based on previous
research, it is analyzed if a scale is related, as expected, to the variables chosen as being
significant criteria (criterion variables). Criteria variables may include demographic and
psychographic characteristics, measures of attitude and behavior, or scores obtained
from other scales.
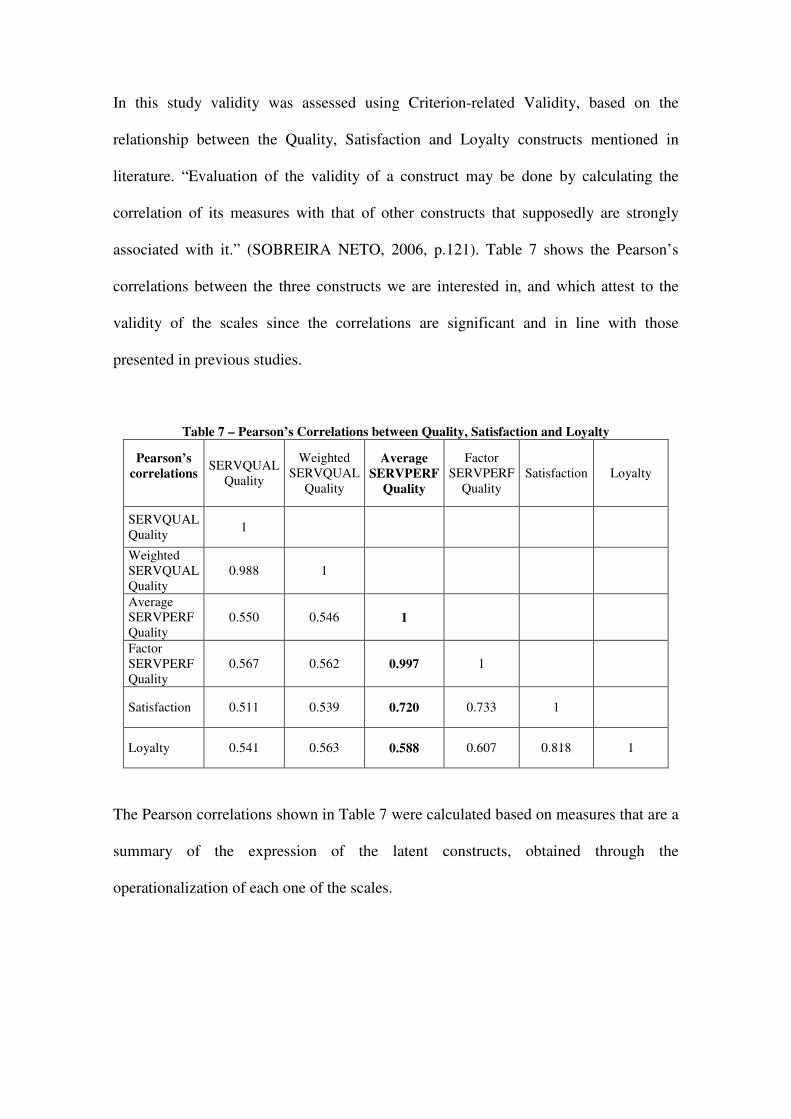
In this study validity was assessed using Criterion-related Validity, based on the
relationship between the Quality, Satisfaction and Loyalty constructs mentioned in
literature. “Evaluation of the validity of a construct may be done by calculating the
correlation of its measures with that of other constructs that supposedly are strongly
associated with it.” (SOBREIRA NETO, 2006, p.121). Table 7 shows the Pearson’s
correlations between the three constructs we are interested in, and which attest to the
validity of the scales since the correlations are significant and in line with those
presented in previous studies.
Table 7 – Pearson’s Correlations between Quality, Satisfaction and Loyalty
Pearson’s correlations
SERVQUAL Quality
Weighted SERVQUAL
Quality
Average SERVPERF
Quality
Factor SERVPERF
Quality Satisfaction Loyalty
SERVQUAL Quality 1
Weighted SERVQUAL Quality
0.988 1
Average SERVPERF Quality
0.550 0.546 1
Factor SERVPERF Quality
0.567 0.562 0.997 1
Satisfaction 0.511 0.539 0.720 0.733 1
Loyalty 0.541 0.563 0.588 0.607 0.818 1
The Pearson correlations shown in Table 7 were calculated based on measures that are a
summary of the expression of the latent constructs, obtained through the
operationalization of each one of the scales.
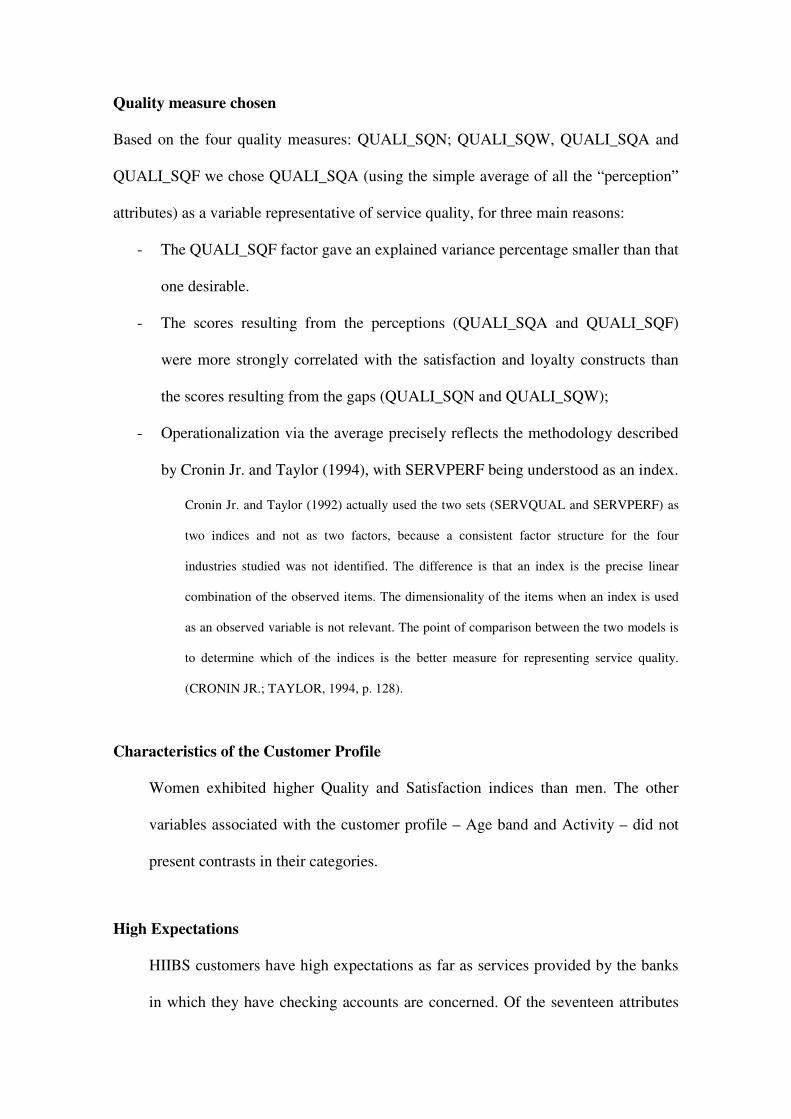
Quality measure chosen
Based on the four quality measures: QUALI_SQN; QUALI_SQW, QUALI_SQA and
QUALI_SQF we chose QUALI_SQA (using the simple average of all the “perception”
attributes) as a variable representative of service quality, for three main reasons:
- The QUALI_SQF factor gave an explained variance percentage smaller than that
one desirable.
- The scores resulting from the perceptions (QUALI_SQA and QUALI_SQF)
were more strongly correlated with the satisfaction and loyalty constructs than
the scores resulting from the gaps (QUALI_SQN and QUALI_SQW);
- Operationalization via the average precisely reflects the methodology described
by Cronin Jr. and Taylor (1994), with SERVPERF being understood as an index.
Cronin Jr. and Taylor (1992) actually used the two sets (SERVQUAL and SERVPERF) as
two indices and not as two factors, because a consistent factor structure for the four
industries studied was not identified. The difference is that an index is the precise linear
combination of the observed items. The dimensionality of the items when an index is used
as an observed variable is not relevant. The point of comparison between the two models is
to determine which of the indices is the better measure for representing service quality.
(CRONIN JR.; TAYLOR, 1994, p. 128).
Characteristics of the Customer Profile
Women exhibited higher Quality and Satisfaction indices than men. The other
variables associated with the customer profile – Age band and Activity – did not
present contrasts in their categories.
High Expectations
HIIBS customers have high expectations as far as services provided by the banks
in which they have checking accounts are concerned. Of the seventeen attributes
measured, sixteen presented a mode equal to “10” and fifteen had an average
expectation greater than “8”.
Attributes of Greatest Expectation
The highest expectations are associated with aspects of credibility, security and
reliability, expressed by the attributes:
- “Credibility of the institution” (9,27);
- “Error-free banking transactions” (9,17);
- “Internet banking” (9,05);
- “Confidence in the account manager” (9,04).
Attributes of Least Expectation
The attribute “Financial assistance” was the one that registered the lowest average
expectation (6,89), although it was accompanied by a high variation coefficient.
The other two attributes with medians equal to “8” and with a lower degree of
average expectation are:
- “Branch parking lot” (7,87);
- “Waiting time at the branch cash-desk” (8,15).
However, these attributes should not be interpreted as of little importance,
because:
. They present expectation mode equal to “10”;
. They demonstrate variability among the respondents;
. They are listed as being among the lowest average perceptions.
Attributes of Greatest Perception
The items with the highest perception, with an assessment average greater than
“8” and mode equal to “10” are:
- “Credibility of the institution” (8,76);
- “Error-free banking transactions” (8,49);
- “Financial assistance and guidance” (8,42);
- “Internet Banking” (8,38);
- “Responsive employees” (8,21).
With the exception of the attribute “Financial assistance and guidance”, the
others have a parallel in the greatest expectations and the greatest perceptions.
Attributes of Least Perception
The three attributes of least perception, with an average evaluation lower than “7”
are:
- “Branch parking lot” (6,64);
- “Pro-activity of the account manager” (6,81);
- “Waiting time at the branch cash-desk” (6,86).
Of all the attributes these also have the highest variation coefficients, denoting that
this low perception is not homogenous in the sample.
Gaps: Difference between Expectations and Perceptions
With the exception of the attribute “Financial assistance and guidance”, all the
others have negative gaps, indicating that customer expectations are not being
fully met.

MAIN CONCLUSIONS
In this study we evaluated the constructs of quality, satisfaction and loyalty with regard
to banking services directed at high income private individuals in the City of São Paulo.
The constructs presented a high degree of reliability. In the constructs we proposed for
quality we used QUALI_SQA (using the simple average of all the “perception”
attributes) as the most suitable construct for measuring service quality.
Constant monitoring of the opinions of this segment of banking might signal great
opportunities to be exploited by the banks that operate in the high income personal
banking market.
The results we obtained may supply the relevant direction to be taken by those banks
that intend increasing the quality standard of the service they provide to a public that is
highly demanding and increasing loyalty in the customer-bank relationship.
REFERENCES
ALMOSSAWI, Mohammed. Bank selection criteria employed by college students in Bahrain : an empirical analysis. International Journal of Bank Management. Bradford: MCB University Press, v. 19, n. 3, p. 115-125, 2001.
ANDERSON, Eugene W.; FORNELL, Claes. Foundations of the american customer satisfaction index. Total Quality Management. [S.l]: Taylor & Francis Ltd., v. 11, n. 7, p. 869-882, 2000.
ANDERSON, Eugene W.; SULLIVAN, Mary W. The antecedents and consequences of customer satisfaction for firms. Marketing Science. [S.l.], v. 12, n. 2, p. 125-143, Spring, 1993.
ANDREASSEN, Tor Wallin; LINDESTAD, Bodil. Customer loyalty and complex services: the impact of corporate image on quality, customer satisfaction and loyalty for customers with varying degrees of service expertise. International Journal of Service Industry Management. Bradford: MCB University Press, v. 9, n. 1, p. 7-23, 1998.
ANGUR, Madhukar G. et al. Service quality in the banking industry : an assessment in a developing economy. International Journal of Bank Marketing. Bradford: MCB University Press, v. 17, n. 3, p. 116-125, 1999.
BLOEMER, Josée et al. Investigating drivers of bank loyalty: the complex relationship between image, service quality and satisfaction. International Journal of Bank Marketing. Bradford: MCB University Press, v. 16, n. 7, p. 276-286, 1998.
BOLTON, Ruth N.; DREW, James H. A multistage model of customers' assessments of service quality and value. Journal of Consumer Research. [S.l.], v. 17, n. 4, p. 375-384, 03/1991.
BOYD, William L. et al. Customer preferences for financial services: an analysis. International Journal of Bank Marketing. Bradford: MCB University Press, v. 12, n. 1, p. 9-15, 1994.
BREI, Vinícius Andrade; ROSSI, Carlos Alberto Vargas. Confiança, valor percebido e lealdade em trocas relacionais de serviço: um estudo com usuários de internet banking no Brasil. Revista de Administração Contemporânea. [S.l.], v. 9, n. 2, p. 145-168, 04-06/2005.
CARMAN, J. M. Consumer perceptions of service quality: an assessment of the SERVQUAL Dimensions. Journal of Retailing. New York: New York University, v.66, n.1, p.33-55, 1990.
CARVALHO, Frederico A. de; LEITE, Valdecy F. Refinando a conjetura PBZ: uma revisão da relação entre importância e tolerância em qualidade de serviços. Revista de Administração Contemporânea. [S.l.], v. 5, n. 1, p. 43-60, 01-04/2001.
CRONIN JR., J. Joseph; TAYLOR, Steven A. Measuring service quality: a reexamination and extension. Journal of Marketing. Chicago, v. 56, p. 55-68, 07/1992.
CRONIN JR., J. Joseph; TAYLOR, Steven A. SERVPERF versus SERVQUAL: reconciling performance-based and perceptions-minus-expectations measurement of service quality. Journal of Marketing. Chicago, v. 58, p. 125-131, 01/1994.
CRONIN JR., J. Joseph et al. Assessing the effects of quality, value, and customer satisfaction on consumer behavioral intentions in service environments. Journal of Retailing. New York: New York University, v. 76, n. 2, p. 193-218, 2000.
CUI, Charles Chi et al. Service quality measurement in the banking sector in South Korea. International Journal of Bank Marketing. Bradford: MCB University Press, v. 21, n. 4, p. 191-201, 2003.
DESTRO, Paulo José. Importância relativa de alguns fatores que antecedem a lealdade: uma investigação junto a clientes de bancos de varejo na cidade de São Paulo. São Paulo, 2002. Dissertação (Mestrado em Administração) – Escola de Administração de Empresas de São Paulo, Fundação Getulio Vargas.
DICK, Alan S.; BASU, Kunal. Customer loyalty: toward an integrated conceptual framework. Journal of the Academy of Marketing Science. [S.l.], v. 22, n. 2, p. 99-113, 1994
FARIAS, Salomão Alencar de; SANTOS, Rubens da Costa. Modelagem de equações estruturais e satisfação do consumidor: uma investigação teórica e prática. Revista de Administração Contemporânea. São Paulo, v. 4, n. 3, p. 107-132, 09-12/2000.
FITZSIMMONS, James A.; FITZSIMMONS, Mona J. Administração de serviços: operações, estratégia e tecnologia da informação. 4. ed. Porto Alegre: Bookman, 2005.
FORNELL, Claes. A national consumer satisfaction barometer: the swedish experience. Journal of Marketing. Chicago, v. 56, p. 6-21, 01/1992.
FORNELL, Claes et al. The american customer satisfaction index: nature, purpose, and findings. Journal of Marketing. Chicago, v. 60, p. 7-18, 10/1996.
GASTAL, Fernanda. A influência da satisfação e dos custos de mudança na lealdade do cliente. Porto Alegre, 2005. Dissertação (Mestrado em Administração) – Programa de Pós-Graduação em Administração, Universidade Federal do Rio Grande do Sul.
GONÇALVES, Carlos Alberto et al. Avaliação de um modelo de mensuração de desempenhol de serviços oferecidos por empresas públicas. Congresso Internacional del Clad, 7., 2002, Lisboa., 2002.
GRÖNROOS, Christian. Marketing: gerenciamento e serviços: a competição por serviços na hora da verdade. Rio de Janeiro: Campus, 1993.
GUPTA, Y.; TORKZADEH, G. Re-designing bank service: systems for effective marketing. Long Range Planning. [S.l.], v. 21, n. 6, 1988.
HAIR JR, Joseph F. et al. Fundamentos de métodos de pesquisa em administração. Porto Alegre: Bookman, 2005a.
HAIR JR., Joseph F. et al. Análise multivariada de dados. 5. ed. Porto Alegre: Bookman, 2005b.
HALLOWELL, Roger. The relationship of customer satisfaction, customer loyalty, and profitability: an empirical study. International Journal of Service Industry Management. Bradford: MCB University, v. 7, n. 4, p. 27-42, 1996.
INSTITUTO BRASILEIRO DE GEOGRAFIA E ESTATÍSTICA – IBGE. Disponível em: <http://www.ibge.org.br>. Acessos em: 08/09/2005; 02/11/2005; 11/12/2005; 08/01/2006; 25/07/2006; 10/10/2006.
INSTITUTO BRASILEIRO DE GEOGRAFIA E ESTATÍSTICA – IBGE. Estatísticas Históricas do Brasil: séries econômicas demográficas e sociais de 1550 a 1985. Rio de Janeiro, 1987. (Séries estatísticas retrospectivas, 3).
INSTITUTO BRASILEIRO DE GEOGRAFIA E ESTATÍSTICA – IBGE. Anuário Estatístico do Brasil. Rio de Janeiro, v. 52, p. 1-1119, 1992.
INSTITUTO BRASILEIRO DE GEOGRAFIA E ESTATÍSTICA – IBGE. Anuário Estatístico do Brasil. Rio de Janeiro, v. 65, p. 1-1-8-39, 2005.
INSTITUTO BRASILEIRO DE GEOGRAFIA E ESTATÍSTICA – IBGE. Pesquisa Nacional por Amostra de Domicílios. Rio de Janeiro, v. 26, p. 1-125, 2006.
JAVALGI et al. An application of the analytic hierarchy process for a consumer choice problem. Marketing Science. [S.l.], v. 9, p. 402-406, 1986.
KINNEAR, T.C.; TAYLOR, J.R. Marketing research: an applied approach. 5ed. New York: McGraw-Hill, 1996.
LAROCHE, M et al. Services used and factor considered important in selecting a bank: an investigation across diverse demographic segments. International Journal of Bank Marketing. Bradford: MCB University Press, v. 21, n. 2, p. 72-79, 2003.
LAROCHE, M et al. Services used and factor considered important in selecting a bank: an investigation across diverse demographic segments. International Journal of Bank Marketing. Bradford: MCB University Press, v. 4, n. 1, p. 33-35, 1986.
LASSAR, Walfried M. et al. Service quality perspectives and satisfaction in private banking. Journal of Services Marketing. Bradford: MCB University Press, v. 14, n. 3, p. 244-271, 2000.
LEE, Haksik et al. The determinants of perceived service quality and its relationship with satisfaction. Journal of Service Marketing. Bradford: MCB University Press, v. 14, n. 3, p. 217-231, 06/2000.
MALHOTRA, Naresh. Pesquisa de marketing: uma orientação aplicada. 4 ed. Porto Alegre: Bookman, 2006.
MARSHALL, C. et al. Creativity in Services Marketing: What´s New, What Works, What´s Developing. Chicago: American Marketing Association, 1985.
MATOS, Celso Augusto; VEIGA, Ricardo Teixeira. Avaliação da qualidade percebida de serviços: um estudo em uma organização não-governamental. Caderno de Pesquisas em Administração. São Paulo, v. 07, n. 3, 07-09/2000.
MEHTA, Subhash C.; DURVASULA, Srinivas. Relationships between SERVQUAL dimensions and organizational performance in the case of a business-to-business service. Journal of Business & Industrial Marketing. Bradford: MCB University Press, v. 13, n. 1, p. 40-53. 1998.
MELLO, S.C.B. et al- Aplicação do modelo SERVQUAL para a avaliação da qualidade de serviço numa instituição de ensino superior baseado na percepção dos alunos. Encontro Nacional de Engenharia de Produção, 22., Curitiba, 2002.
MIGUEL, Paulo Augusto Cauchik; SALOMI, Gilberto Eid. Uma revisão dos modelos para medição da qualidade em serviços. Revista Produção. [S.l.], v. 14, n. 1, p. 12-30, 2004.
MOUTINHO, Luiz; SMITH, Anne. Modeling bank customer satisfaction through mediation of attitudes towards human and automated banking. International Journal of Bank Marketing. Bradford: MCB University Press, v. 18, n. 3, p. 124-134, 2000.
OLIVER, Richard L. A cognitive model of the antecedents and consequences of satisfaction decisions. Journal of Marketing Research. Chicago, v. 17, p. 460-469, 11/1980.
OLIVER, Richard L. Satisfaction: a behavioral perspective on the consumer. [S.l.]: Irvin McGraw-Hill, 1999.
OLIVER, Richard L. Cognitive, Affective, and Attribute Bases of the Satisfaction Response. The Journal of Consumer Research, v. 20, n. 3, pp. 418-430, 1993.
OLSEN, Svein Ottar. Comparative evaluation and the relationship between quality, satisfaction, and repurchase loyalty. Journal of the Academy of Marketing Science. [S.l.], v. 30, n. 3, p. 240-249, 2002.
PARASURAMAN, A. et al. Refinement and reassessment of the SERVQUAL scale. Journal of Retailing. New York: New York University Press, v. 67, n. 4, p. 420-450, Winter 1991.
PARASURAMAN, A. et al. Reassessment of expectations as a comparison standard in measuring service quality: implications for further research. Journal of Marketing. Chicago, v. 58, n. 1, p. 111-124, 01/1994.
PRADO, Paulo Henrique Muller; SANTOS, Rubens da Costa. Comprometimento e lealdade ao fornecedor: dois conceitos ou duas dimensões de um único conceito? ENANPAD, 22 a 24 09/2003, Atibaia . 2003.
PRADO, Paulo H.M.; SANTOS Rubens da Costa. Satisfação, qualidade no relacionamento e lealdade entre clientes e bancos de varejo. EMA, 2004

REIS, Izabel Cristina da Silva. A escala SERVQUAL modificada: avaliação da qualidade percebida do serviço de lazer oferecido por um complexo poliesportivo num parque florestal. Florianópolis, 2001. Dissertação (Mestrado em Engenhara de Produção) – Programa de Pós-Graduação em Engenharia de Produção, Universidade Federal de Santa Catarina.
ROSA, Fernando de. Canais de atendimento eletrônico e satisfação, retenção e rentabilidade de clientes em bancos. São Paulo, 2001. Tese (Doutorado em Administração) – Programa de Pós-Graduação em Administração, Faculdade de Economia, Administração e Contabilidade da Universidade de São Paulo.
SALOMI, Gilberto Gabriel Eid et al. SERVQUAL x SERVPERF : comparação entre instrumentos para avaliação da qualidade de serviços internos. Gestão e Produção. São Carlos, v. 12, n. 2, 05-08/2005.
SIRDESHMUKH, D., et al. Costumer trust, value, and loyalty in relational exchanges. Journal of Marketing. Chicago, v. 66, n. 1, p. 15-37, 01/2001.
SHETH, J. N. Relationship marketing: paradigm shift or shaft? In: DHEFT, J.N.; PARVATYAR, A. Handbook of Relationship Marketing. Thousand Oaks: Sage, 1999.
SILVA et al. Construção de Indicadores de Avaliação da Qualidade no Turismo. Projecto de Investigação, Relatório Final, v.1. Faro: Universidade do Algarve, 2001.
SOBREIRA NETTO, Francisco. Medição de desempenho do gerenciamento de processos de negócio – BPM no PNAFE: uma proposta de modelo. São Paulo, 2006. Tese (Doutorado em Administração) – Programa de Pós-Graduação em Administração, Faculdade de Economia, Administração e Contabilidade da Universidade de São Paulo.
SURESHCHANDAR, G. S. et al. Determinants of customer-perceived service quality : a confirmatory factor analysis approach. Journal of Services Marketing. Bradford: MCB University Press, v. 16, n. 1, p. 9-34, 2002.
TAYLOR, Steven A.; BAKER, Thomas L. An assessment of the relationship between service quality and customer satisfaction in the formation of consumers’ purchase intentions. Journal of Retailing. New York: New York University, v. 70, n. 2, p. 163-178, 1994.
TEAS, R. Kenneth. Expectation, performance evaluation and costumer’s perception of quality. Journal of Marketing. Chicago, v. 57, n. 4, p. 18-34, 10/1993.
TEAS, R. Kenneth. Expectations as a comparison standard in measuring service quality: an assessment of a reassessment. Journal of Marketing. Chicago, v. 58, p. 132-139, 01/ 1994.
URDAN, André Torres; RODRIGUES, Arnaldo Rocha. O modelo do índice de satisfação do cliente norte-americano: um exame inicial no Brasil com equações estruturais. Revista de Administração Contemporânea. [S.l.], v. 3, n. 3, p. 109-130, 09-12/1999.
WIRTZ, Jochen; BATESON, John E. G. Introducing uncertain performance expectations in satisfaction models for services. International Journal of Service Industry Management. Bradford: MCB University Press, v. 10, n. 1, p. 82-99, 1999.
WORLD BANK. Brazil access to financial services. Report 30858. [S.l.], Disponível em: <http://www.worldbank.org>. Acesso em: 24/06/2005.
ZEITHAML, Valarie A. et al. Five imperatives for improving service quality. Sloan Management Review. [S.l.], v. 31, n. 4, p. 29-38, Summer 1990.
ZEITHAML, Valarie A. et al. The behavioral consequences of service quality. Journal of Marketing. Chicago, v. 60, n. 2, p. 31-46, 04/1996.
ZEITHAML, Valarie A.; BITNER, Mary Jo. Marketing de serviços: a empresa com foco no cliente. 2 ed. Porto Alegre: Bookman, 2003.
ZINELDIN, Mosad. Bank strategic positioning and some determinants of bank selection. International Journal of Bank Marketing. Bradford: MCB University Press, v. 14, n. 6, p. 12-22, 1996.