© nhs national services scotland/crown copyright 2009 · and scientific advisory committee...
TRANSCRIPT
II
© NHS National Services Scotland/Crown Copyright 2009
First published October 2009
ISBN: 978-1-84134-014-2
Brief extracts from this publication may be reproduced provided the source is fully acknowledged. Proposals for reproduction of large extracts should be addressed to:
ISD Scotland Publications Information Services Division NHS National Services Scotland Gyle Square 1 South Gyle Crescent Edinburgh EH12 9EB
Tel: +44 (0)131-275-6233 Email: [email protected]
Designed and typeset by: ISD Scotland Publications
III
Contents
Foreword. ................................................................................................................................. IV
Introd.uction ................................................................................................................................ V
Summary and. Key Find.ings ................................................................................................... VII
Section 1: Activity ......................................................................................................................1
Section 2: Interventions in Critical Care ...............................................................................17
Section 3: Outcomes ...............................................................................................................23
Conclusions ..............................................................................................................................28Critical Care Capacity (funded beds) 2008 .................................................................................................. 29
ICUs and. HDUs in Scotland. ............................................................................................. ........30
Contact Details ................................................................................................................. ........31SICSAG Steering Group 2009 .................................................................................................................... 31Lead Audit Consultant: ICU/Combined units 2009 ...................................................................................... 31Lead Nurse: HDU 2009 ............................................................................................................................... 32National Audit Team Coordinators 2009 ...................................................................................................... 33
Appendix 1: ICU Unit Profiles 2009........................................................................................34Part 1: Capacity and Multi-disciplinary Team Information ............................................................................ 34Part 2: Quality Improvement Measures (snap shot only) ............................................................................. 35Part 3: Medical Staff Information ................................................................................................................. 36
Append.ix 2: Level of Care ......................................................................................................38Calculating Levels of Care ........................................................................................................................ 38
Append.ix 3: Method.ology ........................................................................................................39
Append.ix 4: APACHE II ............................................................................................................40Eligibility for APACHE II scores and selection for analysis...........................................................................41
Append.ix 5: Ward.Watcher upgrad.e to 2008 version .............................................................42
Append.ix 6: Abbreviations ......................................................................................................42Unit codes used in this publication...............................................................................................................43
References ................................................................................................................................44
Acknowled.gement ....................................................................................................................44
IV
Foreword.This report is of the activity and outcomes in Scottish Intensive Care Units (ICU) and High Dependency Units (HDU) for 2008. It is the culmination of work, which has produced a continuous database since 1995. Scottish Intensive Care Society Audit Group (SICSAG) is a national audit funded through Information Services Division (ISD). We exist to monitor and compare activities and outcomes across Scottish Critical Care. We would also hope to drive standards and quality of care upward by engagement with clinical staff, and to provide them with information that can be used in quality improvement programmes.
I would like to start this year’s report by thanking the Scottish Critical Care community for their continued enthusiasm and support. Our clinical workload increases year on year, yet we have found the time and resource to continue contributing to our unique audit of a nation’s Critical Care activity and outcomes.
In addition, Scottish Critical Care has embraced the Scottish Patient Safety Programme (SPSP) and is leading the way with implementation of the safety culture and care bundles. We are making steady progress with Health Protection Scotland (HPS) to recruit ICUs to the national collaborative project on Healthcare Associated Infection (HAI) in ICU. These initiatives require all involved to make an extra effort to succeed, and it is gratifying that the clinical staff have demonstrated their support to try to improve patient outcomes and quality of care.
The SICSAG and ISD staff have worked very hard to ensure that WardWatcher is updated in all Scottish Health Boards with training and support to make the collection, extraction, analysis and reporting of this huge amount of data possible.
We are at the initial stages of monthly reports back to units, of activity, data quality and HAI incidence, which I hope will increase the value of our audit to the busy clinicians and managers who support it in all the Scottish acute hospitals.
A theme of this year’s annual SICSAG conference in Stirling, on 3rd and 4th September, will be quality and outcome improvement through care bundle implementation and HAI surveillance and control. This will be a joint meeting with the Scottish Critical Care Trials Group and Scottish Intensive Care Society (SICS)Evidence Based Medicine Groups which I hope will retain the interest of previous separate meetings but also improve ties between Critical Care audit, research and the evidence base with which we work. A programme and registration form can be found on the SICSAG website www.sicsag.scot.nhs.uk.
Finally, as usual my thanks go to those who make me look good by doing all the hard work underpinning this audit: the SICSAG steering group, ISD staff, STAG local and regional co-ordinators, Diana Beard (National Project Manager), Angela Kellacher (National Clinical Co-ordinator), Moranne MacGillivray (Quality Assurance Manager) and Dr Jan Kerssens (Senior Statistician).
Dr Brian CookChairman
V
Introd.uctionThe Scottish Intensive Care Society Audit Group (SICSAG) continues to grow in size with the addition of four High Dependency Units (HDU) in early 2009, and another four planned for late 2009. All general Intensive Care Units (ICU) have participated in the audit for many years and general HDU participation has now reached more than 85% coverage throughout Scotland.
SICSAG data collection relies on the motivation and dedication of clinical staff, and we are encouraged to see that quality improvement remains high priority.
In this year’s report we are reporting on the management of over 10,000 patients admitted to ICU/combined units* and almost 20,000 patients admitted to HDU during 2008.
The format of the report continues to follow the patient’s journey through three sections: activity, interventions and outcomes.*Combined unit = Unit with a combination of ICU and HDU beds.
PROGRAMME OF WORK 2008/2009WardWatcher upgrade in all units ●Measures in place to improve/assure data quality ●Real-time reporting ●Better communication with stakeholders ●Collaboration with other national projects to achieve government priorities: Health Protection Scotland ●and the Scottish Patient Safety Programme
Ward.Watcher upgrad.eAll units now have the latest version of WardWatcher (2008 version) installed. This was designed by the WardWatcher subgroup to ensure that only relevant data are collected and that questions that may have been open to misinterpretation were removed or clarified.
Improved. d.ata qualityMoranne MacGillivray has joined SICSAG as Quality Assurance Manager, with responsibility for assuring and improving quality of data.
Updated manuals (HELP pages) defining all mandatory fields are now available in all units.
Prospective case note validation started in January 2009 in ICU and will begin in HDU later this year. Accuracy reports are sent back to lead consultants every month.
On-site training of clinical staff on data collection is ongoing.
Real-time reportingThe turnaround for the Annual report is the quickest it can be. The process begins in March/April with planning, extraction of final data and final validations. The report group then have approximately four weeks to get the final draft to ISD’s publication team for professional production.
Monthly reports are currently being sent to Lead Audit Consultants in ICU with a turnaround of 5 – 6 weeks. Monthly reports will begin in HDU later this year.
Better communicationThe SICSAG website www.sicsag.scot.nhs.uk is reviewed every month to ensure the information is current.
An electronic link to quarterly newsletters is sent to all leads and staff who are on the SICSAG distribution list. Paper copies are sent to all participating units. If you would like to receive an electronic link to the newsletter please contact me.

VI
Unit posters and patient leaflets have been sent to all units to ensure patients and their families are informed of SICSAG.
Moranne and I continue to visit units regularly to ensure staff are supported and well informed. We are also available by phone or email, see website www.sicsag.scot.nhs.uk for this information.
Collaboration with other national projects
Health Protection Scotland. (HPS)SICSAG and HPS have been working together to ensure all ICUs have the ability to collect data on ICU associated infections via the Healthcare Associated Infection (HAI) page of WardWatcher using the Hospital in Europe Link for Infection Control through Surveillance (HELICS) definitions.
Following a pilot involving five units in 2005, the recommended changes to WardWatcher have been completed and all units now have the ability to collect these data via the current version of WardWatcher.
A protocol has been produced and a National study day took place in June 2009 for staff involved in the collection of HAI data.
Units who are currently collecting these data are receiving reported data monthly, as part of the report sent to Lead Consultants. Following validation of these data by HPS, a National report by HPS and SICSAG will be produced in late 2010.
Scottish Patient Safety Programme (SPSP)We have facilitated the reporting of data to SPSP by adapting the activity analysis (time) report to include all data routinely collected via WardWatcher that is required by SPSP, as well as including some of these data in the monthly reports.
We are now including some feedback from SPSP in our quarterly newsletters, after being approached by SPSP.
WardWatcher can be adapted locally to collect other items not routinely collected. Please contact me if you require any help with this.
New units in 2009HDU (Dr Grays Hospital, Elgin), a second Surgical HDU (Aberdeen Royal Infirmary), Medical HDU (Ninewells Hospital, Dundee) and Surgical HDU (Inverclyde Royal Hospital).
Units to join later this year: Medical HDU (Monklands DGH), Medical HDU (Queen Margaret and Victoria hospital, Fife) and HDU (Western Isles Hospital).
Optimising the d.atabaseSICSAG have had numerous requests for data and analysis. Rules for the release of data can be found on the website. We hope to share some of the results of these projects later this year.
What next? Although we have made much progress in the last few years, there is still much to do. Some ideas for the coming year:
Setting up a ‘user’ group to improve support for clinical staff and maximize data use. ●Unit SICSAG folders containing help on data collection, reporting through WardWatcher, interpreting ●data and more. Online WardWatcher training ●
Angela KellacherNational Clinical Co-ordinator
VII
Summary and. Key Find.ingsThe SICSAG database continues as a complete national audit of Scottish adult general Intensive Care. The total number of patients treated in these units is stable at just over 10,000 per year, although some reorganisation has occurred in various units. An increasing number of HDU are participating in the audit and this is reflected in the increased HDU patient numbers to almost 20,000 per year.
Bed occupancy in ICU and HDU remains stable at about 75%, but there is variability between units. This is especially so in HDU, where occupancy ranges from 46% to 97%. This may reflect the wide variability in HDU type and function and is probably related to units with small numbers of beds. Length of stay is also highly variable in HDU. High Dependency Unit Beds: A Report by a Working Group of the Scottish Medical and Scientific Advisory Committee (SMASAC) in April 2008, identified widespread variability of HDU bed provision in Scotland. Their recommendations included a HDU beds ‘needs assessment’ exercise. The variability in HDU bed occupancy and length of stay supports this and work is in progress through the Scottish Critical Care Delivery Group to co-ordinate it.
There has been a marked increase in delayed discharges from ICU in 2008 mostly related to lack of ward beds. This is an important message that highlights we have a capacity problem within some acute hospitals. This will be multifactorial, but causes may include delayed hospital discharge to appropriate community care and the four hour Emergency Department target which prioritises patient distribution from the front door of hospitals over Critical Care discharges.
Critical Care underpins emergency and major elective surgical care in Scottish hospitals. The 24/7 nature of Scottish Critical Care provision remains evident: 42% of ICU and 29% of HDU patients are admitted between 8pm and 8am, 23% of ICU and 18% of HDU patients are admitted at weekends. Workforce planners and service managers will find these figures informative and it reinforces the point that continued high quality, safe service provision will be a challenge if the worst predictions of Modernising Medical Careers (MMC) reductions of trainee medical staff are to become reality.
There is a continuing trend for increasing acuity of admissions to ICU from Emergency Departments. Transfers between hospitals for Critical Care, to both ICU and HDU is also increasing. This may be due to local capacity problems, but centralisation of specialist services may also be an important factor.
While our main priority is to saving lives, unfortunately some patients will die due to brain stem death or other severe unsurvivable brain injuries. Scottish Critical Care clinicians have helped make the best of often difficult and tragic circumstances to help others benefit through organ donation, which has increased despite an overall reducing mortality rate.
Critical Care interventions show marked variability nationally. This may be due to variations in case mix, sources of admission and local service delivery. An additional factor may be that data collection for this is complex and some variability in data quality might be expected. Prospective data validation has started and the newest version of WardWatcher which has a redesigned interventions (Augmented Care Period) page has been installed in all units in 2009.
This variability is not mirrored in outcomes across Scotland. Standardised Mortality Ratio (SMR) measured by APACHE II with, and without pre-sedation GCS, and in non-operative and post-operative subgroups has no significant outlying units in Scotland in 2008.
Patients admitted to ICU, by the nature of their illness severity have a relatively high risk of death. 27.3% of patients admitted to Scottish ICUs died in hospital in 2008. This is fewer than predicted by APACHE II SMR, which was .86. This mortality rate and SMR continue to fall and are the lowest SICSAG has ever reported. Critical Care is a relatively young specialty whose evidence base is rapidly advancing. Scottish Critical Care clinicians are a cohesive group who have striven to share experience, training and best practice for many years. This is perhaps reflected in improving outcomes. We have as a clinical community also engaged seriously with the Scottish Patient Safety Programme (SPSP). It is too early in implementation to gauge the effects of this with 2008 data, but we look forward with anticipation to the next few years.

VIII

1
Figure 1 Annual ad.missions to ICU and. Combined. Units (1999-2008)
The number of admissions to ICU in Scotland over the past 12 months has remained static at just over 10,000 patients/year (figure 1), however this masks a number of structural changes that have occurred in some units.
Borders General Hospital (BGH) has seen a large reduction in patients following reorganisation of their database, which formerly included postoperative level 1 patients. This accounts for the reduction in the red line on the graph, as BGH is one of the units that have contributed to the audit since its inception. There have also been reductions of patient numbers at the Victoria Hospital in Kirkcaldy following a reorganisation of Critical Care provision within NHS Fife. Conversely we present the first full year of data from the Southern General Hospital Neurological ICU in Glasgow.
.
5000
6000
7000
8000
9000
10000
11000
99 (24)
00 (24)
01 (26)
02 (26)
03 (26)
04 (26)
05 (24)
06 (24)
07 (25)
08 (25)
Year (participating units)
Num
ber o
f adm
issi
ons
All participating units
Cohort of same 22 ICUand combined Units
Section 1: Activity
2
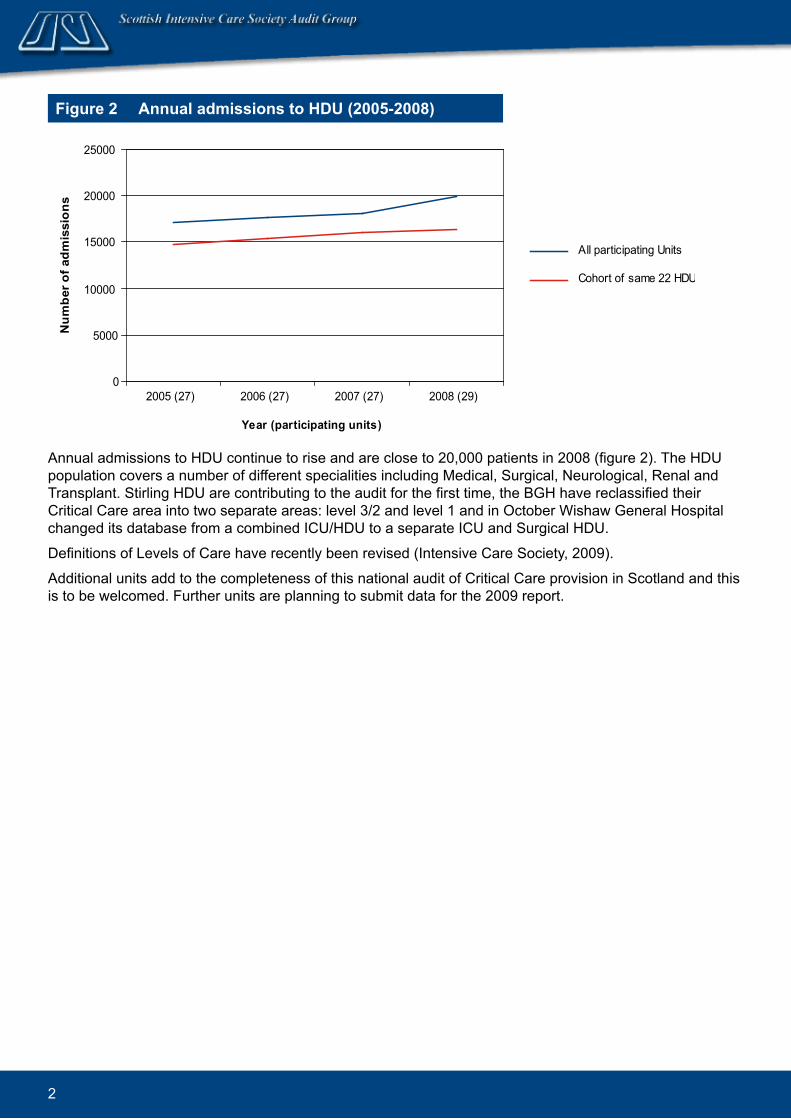
Figure 2 Annual ad.missions to HDU (2005-2008)
Annual admissions to HDU continue to rise and are close to 20,000 patients in 2008 (figure 2). The HDU population covers a number of different specialities including Medical, Surgical, Neurological, Renal and Transplant. Stirling HDU are contributing to the audit for the first time, the BGH have reclassified their Critical Care area into two separate areas: level 3/2 and level 1 and in October Wishaw General Hospital changed its database from a combined ICU/HDU to a separate ICU and Surgical HDU.
Definitions of Levels of Care have recently been revised (Intensive Care Society, 2009).
Additional units add to the completeness of this national audit of Critical Care provision in Scotland and this is to be welcomed. Further units are planning to submit data for the 2009 report.
0
5000
10000
15000
20000
25000
2005 (27) 2006 (27) 2007 (27) 2008 (29)
Year (participating units)
Num
ber o
f adm
issi
ons
All participating Units
Cohort of same 22 HDUs
3
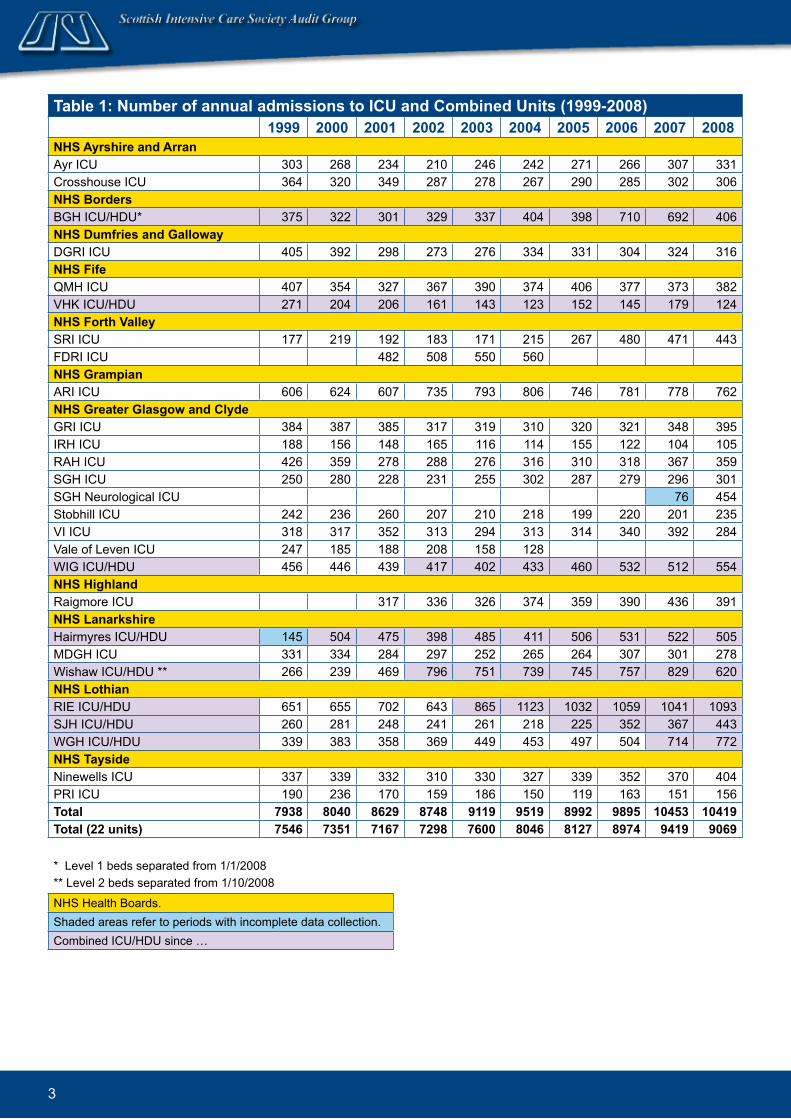
Table 1: Number of annual admissions to ICU and Combined Units (1999-2008) 1999 2000 2001 2002 2003 2004 2005 2006 2007 2008NHS Ayrshire and. Arran Ayr ICU 303 268 234 210 246 242 271 266 307 331Crosshouse ICU 364 320 349 287 278 267 290 285 302 306NHS Bord.ersBGH ICU/HDU* 375 322 301 329 337 404 398 710 692 406NHS Dumfries and. Galloway DGRI ICU 405 392 298 273 276 334 331 304 324 316NHS Fife QMH ICU 407 354 327 367 390 374 406 377 373 382VHK ICU/HDU 271 204 206 161 143 123 152 145 179 124NHS Forth Valley SRI ICU 177 219 192 183 171 215 267 480 471 443FDRI ICU 482 508 550 560NHS GrampianARI ICU 606 624 607 735 793 806 746 781 778 762NHS Greater Glasgow and. Clyd.eGRI ICU 384 387 385 317 319 310 320 321 348 395IRH ICU 188 156 148 165 116 114 155 122 104 105RAH ICU 426 359 278 288 276 316 310 318 367 359SGH ICU 250 280 228 231 255 302 287 279 296 301SGH Neurological ICU 76 454Stobhill ICU 242 236 260 207 210 218 199 220 201 235VI ICU 318 317 352 313 294 313 314 340 392 284Vale of Leven ICU 247 185 188 208 158 128WIG ICU/HDU 456 446 439 417 402 433 460 532 512 554NHS Highland.Raigmore ICU 317 336 326 374 359 390 436 391NHS LanarkshireHairmyres ICU/HDU 145 504 475 398 485 411 506 531 522 505MDGH ICU 331 334 284 297 252 265 264 307 301 278Wishaw ICU/HDU ** 266 239 469 796 751 739 745 757 829 620NHS Lothian RIE ICU/HDU 651 655 702 643 865 1123 1032 1059 1041 1093SJH ICU/HDU 260 281 248 241 261 218 225 352 367 443WGH ICU/HDU 339 383 358 369 449 453 497 504 714 772NHS Taysid.eNinewells ICU 337 339 332 310 330 327 339 352 370 404PRI ICU 190 236 170 159 186 150 119 163 151 156Total 7938 8040 8629 8748 9119 9519 8992 9895 10453 10419Total (22 units) 7546 7351 7167 7298 7600 8046 8127 8974 9419 9069
* Level 1 beds separated from 1/1/2008** Level 2 beds separated from 1/10/2008
NHS Health Boards.Shaded areas refer to periods with incomplete data collection.Combined ICU/HDU since …
4
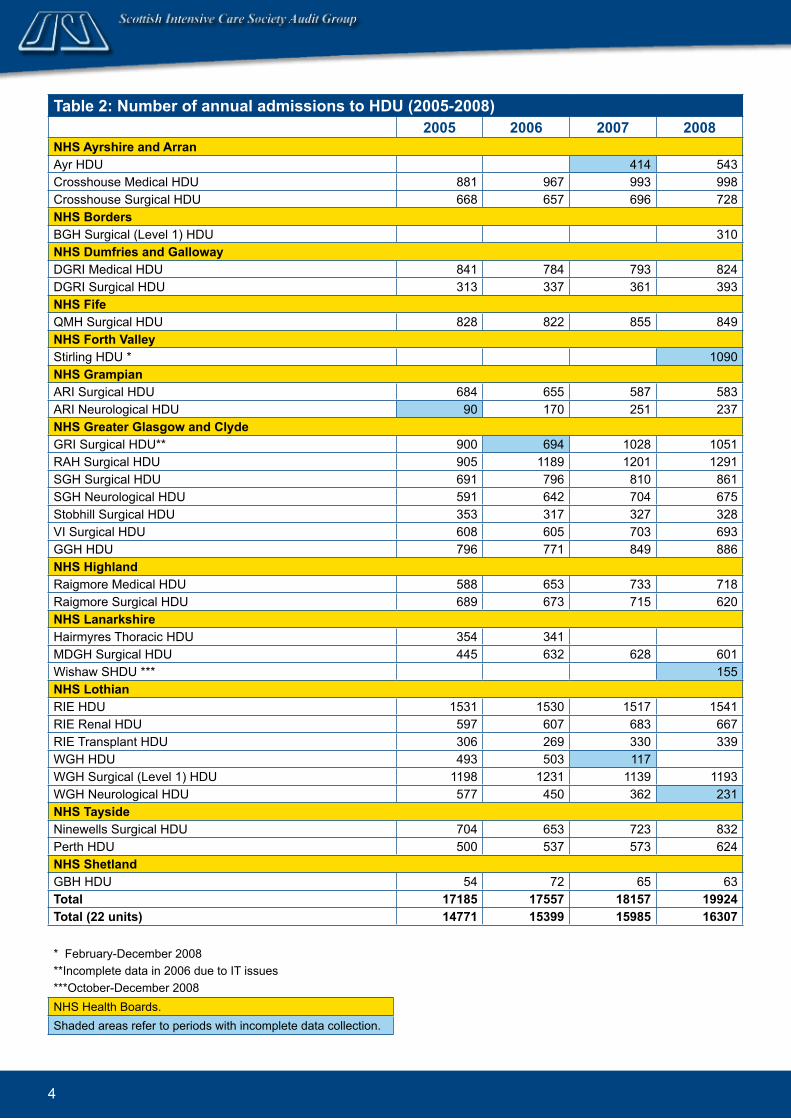
Table 2: Number of annual ad.missions to HDU (2005-2008) 2005 2006 2007 2008NHS Ayrshire and. ArranAyr HDU 414 543Crosshouse Medical HDU 881 967 993 998Crosshouse Surgical HDU 668 657 696 728NHS Bord.ersBGH Surgical (Level 1) HDU 310NHS Dumfries and. GallowayDGRI Medical HDU 841 784 793 824DGRI Surgical HDU 313 337 361 393NHS FifeQMH Surgical HDU 828 822 855 849NHS Forth ValleyStirling HDU * 1090NHS GrampianARI Surgical HDU 684 655 587 583ARI Neurological HDU 90 170 251 237NHS Greater Glasgow and. Clyd.eGRI Surgical HDU** 900 694 1028 1051RAH Surgical HDU 905 1189 1201 1291SGH Surgical HDU 691 796 810 861SGH Neurological HDU 591 642 704 675Stobhill Surgical HDU 353 317 327 328VI Surgical HDU 608 605 703 693GGH HDU 796 771 849 886NHS Highland.Raigmore Medical HDU 588 653 733 718Raigmore Surgical HDU 689 673 715 620NHS LanarkshireHairmyres Thoracic HDU 354 341MDGH Surgical HDU 445 632 628 601Wishaw SHDU *** 155NHS LothianRIE HDU 1531 1530 1517 1541RIE Renal HDU 597 607 683 667RIE Transplant HDU 306 269 330 339WGH HDU 493 503 117 WGH Surgical (Level 1) HDU 1198 1231 1139 1193WGH Neurological HDU 577 450 362 231NHS Taysid.eNinewells Surgical HDU 704 653 723 832Perth HDU 500 537 573 624NHS Shetland.GBH HDU 54 72 65 63Total 17185 17557 18157 19924Total (22 units) 14771 15399 15985 16307
* February-December 2008**Incomplete data in 2006 due to IT issues***October-December 2008NHS Health Boards.Shaded areas refer to periods with incomplete data collection.

5
Figure 3 Annual national bed. occupancy rates in ICU/Combined Units and HDU (1999-2008)
Over the last 4 years national bed occupancy has remained static at around 75% (figure 3), however there are wide variations in occupancy in different units around Scotland.
0%
20%
40%
60%
80%
100%
99 00 01 02 03 04 05 06 07 08
Year
Occ
upan
cy
ICU/Combined
HDU
Figure 4 Bed. occupancy rates for ICU and. Combined. Units (2008)
ICU Combined ICU/HDU
X
R
W
V
TSY
Q
M
U
N
K
P
OJ
E
H
G
F
L
I
DCB
A
50%
60%
70%
80%
90%
100%
0 200 400 600 800 1000 1200
Number of admissions
Occ
upan
cy
Figure 4 shows bed occupancy rates for ICU and combined units in 2008. There is marked variation in bed occupancy with units E and U having occupancy rates of just over 60% while unit V has a bed occupancy rate over 85%. Units with bed occupancy rates of over 75% may find it difficult to accommodate patients during peak levels of activity resulting in the need to transfer additional patients to other centres. This often results in the temporary loss of staff while they help transport the critically ill patient.
All units are within the outer curves and so we can only say that they may be different not that they are different.
High bed occupancy may be an early sign of stress or tension within a system and we are continuing to see across Scotland an increasing trend of difficulty in discharging patients out of ICU to lower levels of care. Further work is ongoing to try to establish just how much of a problem this is for individual units.

6
Figure 5 Bed. occupancy rates for HDU (2008)
HDU bed occupancy rates (figure 5) show much greater variation and while most occupancy rates are around 70-80%, some units have very high levels of activity above 90%. Again this will cause problems when dealing with peak levels of activity and may be due to difficulty in discharging patients to a lower level of care.
Units V2, Y2 and K2 show very high occupancy levels which are well over 90%. Units Y2 and K2 are outside the 99% confidence limits and so are different from the Scottish population. Unit V2 while showing very high occupancy is within the outer line due to the relatively small number of patients admitted.
Some HDUs have very low occupancy levels with units R4, U2 and Z1 having occupancy levels around 50%. Only unit U2 has statistically lower activity than other Scottish units.
One conclusion that may be drawn from the greater variation and scatter seen in the HDU data is that the distribution of HDU beds between the various health boards may indicate inequity of access. The Scottish Critical Care Delivery Group is co-ordinating a HDU needs assessments nationally in 2009.
Surgical General Medical Other
Note: Units H2 and N2 overlap almost completely.
Z1
V2
R4
W3
U2
D2X4
H3
E2
W2
I2
P3
C2X3
Y2
L2
P2G3
H2N2
O2F2 Q2
T2
G2
K2
R3
J2X2
40%
50%
60%
70%
80%
90%
100%
0 200 400 600 800 1000 1200 1400 1600Number of admissions
Occ
upan
cy

7
Figure 6 Mean length of stay in ICU and. Combined. Units (2008)
The mean length of stay in HDU is hardly changed since last year (from 2.9 to 2.8 days).The confidence intervals in this funnel plot (figure 7) are narrow reflecting the large number of patients and the small inter unit variation. There are outliers above and below the outer control limits. Units W3, G3 and U2 are far away from the outer confidence limits and as such will alter the overall shape and position of the curve.The mean length of stay for a patient in ICU at 4.8 days is significantly higher than for the HDU patient population. The reasons for this are likely to be multi-factorial but the increased severity of illness in the ICU population and the difficulty in effecting discharge from ICU are likely to contribute to this difference.
ICU Combined ICU/HDU
Figure 7 Mean length of stay in HDU (2008)
Surgical General Medical Other
XR
WV
TS
Y
Q
MU
N
K
PO
J
E
H
I
FLG
DC
BA
2
3
4
5
6
7
8
9
0 200 400 600 800 1000 1200
Number of admissions
Num
ber o
f day
s
X2
J2R3
K2G2
T2 Q2
F2
O2N2
H2
G3
P2
L2
Y2
X3
C2
P3
I2W2
E2
H3X4
D2
U2
W3
R4
V2
Z1
0
1
2
3
4
5
6
0 200 400 600 800 1000 1200 1400 1600
Number of admissions
Num
ber o
f day
s
The mean length of stay in ICU is hardly changed from last year (from 4.6 to 4.8 days). The individual units are tightly grouped with minimal scatter reflecting little variation across the country. All units are within the outer curves.

8
Figure 8 Top 20 Apache III d.iagnoses in ICU and. Combined. Units (2008)
The top 20 diagnoses in figure 9 covered 67% of all admissions to HDU. APACHE diagnosis in HDU is mainly entered by nursing staff.
As may be expected given the heterogeneity of the HDU population there are a wide number of common medical and surgical diagnoses. However we would also highlight the ongoing need to improve data quality and staff education as ‘not documented’ is ninth on this list.
Figure 9 Top 20 Apache III diagnoses in HDU (2008)
0 200 400 600 800 1000 1200
Aortic aneurysmOther neurological disorder
PancreatitisAsthma
Septic shock-lungsPneumonia-aspiration/toxic
Intracerebral haemTrauma-head/brain
Sub haem aneurysmOther GI surgery
Septic shock-unknown originSeizures
Other respiratory disorderGI obstruction (any cause)
Post cardiac arrestGI neoplasm
Self-inflicted overdoseOther miscellaneousGI perforation/rupturePneumonia-bacterial
Number of admissions
0 200 400 600 800 1000 1200 1400 1600 1800
Diabetic ketoacidosisSeptic shock-unknow n origin
Trauma-extremitiesRenal neoplasm
Sub haem aneurysmOther renal surgery
Cholangitis/cholecystitisBleeding-ulcer
GI inflammatory diseasePancreatitis
Other renal disorderNot Documented
Pneumonia-bacterialOther GI disorder
GI perforation/ruptureOther respiratory disorder
Other miscellaneousOther GI surgery
GI obstruction (any cause)GI neoplasm
Number of admissions
Note: Acute Physiology and Chronic Health Evaluation (APACHE)
The top 20 diagnoses in figure 8 covered 58% of all admissions to ICU and combined units in 2008. The APACHE diagnosis is entered by clinicians on admission to ICU and there may on occasion be more than one appropriate diagnosis within the APACHE table. Patients who are admitted with a primary respiratory diagnosis have a significantly longer length of stay than other groups of patients. This includes patients with bacterial pneumonia the most common diagnostic group. This is relevant to planning for a flu pandemic when it is predicted that very large numbers of patients will present with respiratory symptoms
9
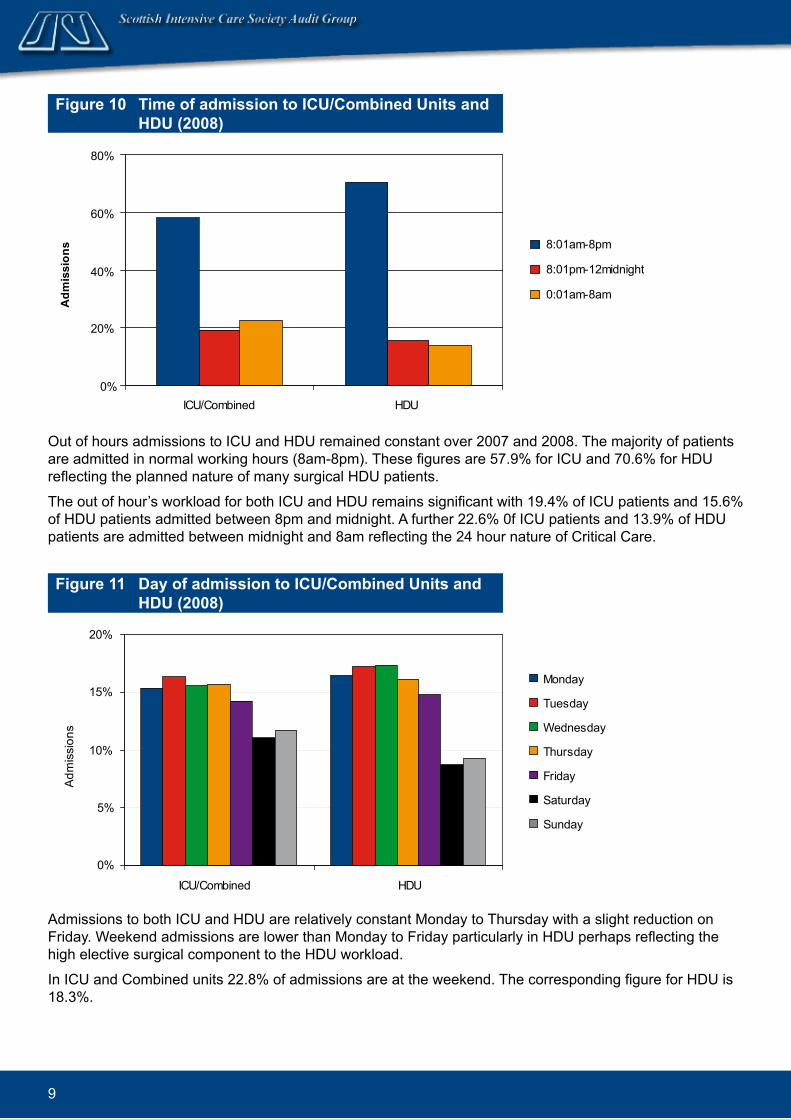
Admissions to both ICU and HDU are relatively constant Monday to Thursday with a slight reduction on Friday. Weekend admissions are lower than Monday to Friday particularly in HDU perhaps reflecting the high elective surgical component to the HDU workload.
In ICU and Combined units 22.8% of admissions are at the weekend. The corresponding figure for HDU is 18.3%.
Figure 10 Time of ad.mission to ICU/Combined. Units and. HDU (2008)
0%
20%
40%
60%
80%
ICU/Combined HDU
Adm
issi
ons 8:01am-8pm
8:01pm-12midnight
0:01am-8am
Figure 11 Day of ad.mission to ICU/Combined. Units and. HDU (2008)
0%
5%
10%
15%
20%
ICU/Combined HDU
Adm
issi
ons
Monday
Tuesday
Wednesday
Thursday
Friday
Saturday
Sunday
Out of hours admissions to ICU and HDU remained constant over 2007 and 2008. The majority of patients are admitted in normal working hours (8am-8pm). These figures are 57.9% for ICU and 70.6% for HDU reflecting the planned nature of many surgical HDU patients.
The out of hour’s workload for both ICU and HDU remains significant with 19.4% of ICU patients and 15.6% of HDU patients admitted between 8pm and midnight. A further 22.6% 0f ICU patients and 13.9% of HDU patients are admitted between midnight and 8am reflecting the 24 hour nature of Critical Care.

10
Figure 12 Percentage of ‘out of hours’ ad.missions to ICU and. Combined. Units (2008)
The mean level of out of hours admissions to HDU is unchanged at 40% of all admissions, however this masks some wide variations in activity. It is noteworthy that all 3 medical HDUs are outliers in the Scottish HDU population and this probably reflects lack of resource and the 24/7 nature of medical admissions. Unit X2 remains an outlier for a second year in succession. A major complicating factor in this unit (which is very large by Scottish standards) may be the ongoing difficulty in discharging patients to lower levels of care.
Figure 13 Percentage of ‘out of hours’ ad.missions to HDU (2008)
Note: Out of hours is defined as admissions between 8pm and 8am and all weekend.
X
R
W
V
T
SY
Q
M
U
N
K
PO
J
E
HG
F
L
I
D
C
BA
30%
40%
50%
60%
70%
0 200 400 600 800 1000 1200
Number of admissions
Out
of h
ours
adm
issi
ons
Z1V2
R4W3
U2
D2
X4H3
E2
W2
I2
P3
C2X3
Y2
L2
P2
G3
H2
N2
O2F2
Q2
T2
G2
K2
R3J2
X2
0%
10%
20%
30%
40%
50%
60%
0 200 400 600 800 1000 1200 1400 1600
Number of admissions
Out
of h
ours
adm
issi
ons
There is a continuing trend over the past year to an increased percentage of out of hour’s admissions to ICU and combined units. In the majority of units out of hour’s admissions are between 50 and 60% of all admissions. This represents a significant and increasing workload during this time that should be addressed when considering the staffing required for Critical Care areas
ICU Combined ICU/HDU
Surgical General Medical Other

11
Figure 14 Percentage of night time (8pm-8am) d.ischarges in ICU and. Combined. Units (2008)
XR
W
V
T
S
Y
Q
M
U
N
K
P
OJ
E
H
G
FL
I
D
C
BA
0%
5%
10%
15%
20%
25%
30%
0 200 400 600 800 1000 1200
Number of live discharges
Nig
httim
e di
scha
rges
The number of out of hours discharges has fallen markedly over the past year when compared with the 2007 report. While this may appear to be a very impressive change in practice over the past year it is simply a different definition of out of hours.
This year we report on night time (8pm to 8am) discharges while last year we added weekend discharges to these figures. It is often entirely appropriate that patients are discharged from ICU in daylight hours over the weekend and so we have narrowed the definition to reflect accepted practice in Scotland.
Goldfrad et al (2000) showed that those patients discharged out of daylight hours were placed at increased risk and may have a poorer outcome.
The graph shows a tight pattern with relatively small amounts of scatter, showing little variation around Scotland in the practice of out of hours discharges from Intensive Care.
ICU Combined ICU/HDU
12
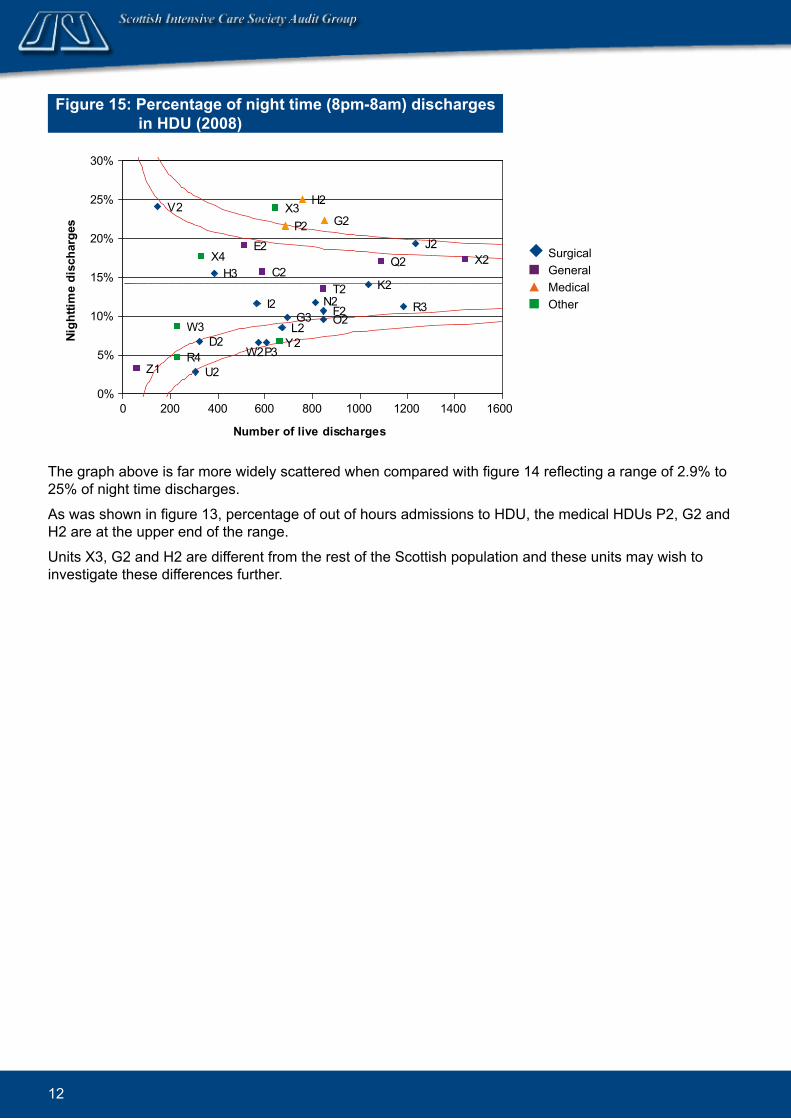
The graph above is far more widely scattered when compared with figure 14 reflecting a range of 2.9% to 25% of night time discharges.
As was shown in figure 13, percentage of out of hours admissions to HDU, the medical HDUs P2, G2 and H2 are at the upper end of the range.
Units X3, G2 and H2 are different from the rest of the Scottish population and these units may wish to investigate these differences further.
Figure 15: Percentage of night time (8pm-8am) d.ischarges in HDU (2008)
Z1
V2
R4
W3
U2
D2
X4H3
E2
W2
I2
P3
C2
X3
Y2L2
P2
G3
H2
N2O2F2
Q2
T2
G2
K2
R3
J2X2
0%
5%
10%
15%
20%
25%
30%
0 200 400 600 800 1000 1200 1400 1600
Number of live discharges
Nigh
ttim
e di
scha
rges
Surgical General Medical Other

13
Figure 16 Source of ad.missions to ICU and. Combined. Units (1999-2008)
Figure 17 Source of ad.missions to HDU (2005-2007)
The majority of HDU patients are admitted from theatre as the majority of HDU beds serve the surgical population. Numbers of admissions to HDU from the ward and from the Emergency Department are similar to previous years. The numbers of patients admitted to HDU from other hospitals did not change.
0
1000
2000
3000
4000
5000
99 (7938)
00 (8040)
01 (8629)
02 (8748)
03 (9119)
04 (9519)
05 (8992)
06 (9883)
07 (10453)
08 (10419)
Year (total number of admissions including all other sources of admissions)
Num
ber o
f adm
issi
ons
Theatre
Ward in this hospital
ED
Other hospital
0
2000
4000
6000
8000
10000
2005(16550)
2006(17556)
2007(18157)
2008
Year (total number of admissions)
Num
ber o
f adm
issi
ons
Theatre
Ward in this hospital
ED
Other hospital
(19924)
The rising trend of admissions directly from the Emergency Department continues (figure16). The number of admissions from the ward and from theatre remains almost unchanged. For the first time we show in figure 16, admissions to ICU and Combined units from other hospitals reflecting an increasing need to transfer critically ill patients between centres. This is most often as a result of lack of local capacity in beds/staff or to facilitate sub specialist treatment. SICSAG will look into this in more detail in subsequent reports

14
Figure 18 Numbers of organ d.onors in ICU and. Combined units (1999-2009)
0
20
40
60
80
99-00
00-01
01-02
02-03
03-04
04-05
05-06
06-07
07-08
08-09
Num
ber
Non heart beating donors
Heart beating donors
Year of admission (financial year)
Deceased donor numbers are at the highest level for 10 years. The increasing importance of Non-heart beating donation (donation after cardiac death) is clearly shown in this graph. Donor numbers have increased from 9.8 per million Scottish population in 2006/07 to 14.1per million population in 2008/09. This is well on the way to achieving the aims set out in the UK Organ Donation Task Force Report: Organs for transplants (2008).
The proportion of patients admitted to ICU with significant chronic health conditions has been stable over recent years (figure 19). In 2008 there was a small but noticeable increase that has not been translated into worse overall mortality (see section 3: outcomes). We await future years to see if this trend continues.
Figure 19 Number of admissions according to chronic health cond.itions in ICU and. Combined. Units (2005-2008)
0
500
1000
1500
2000
2500
3000
2005 2006 2007 2008
Adm
issi
ons
AIDS
Acute leukaemia
Chronic leukaemia
Lymphoma
Chronic renal replacement
Biopsy proven cirrhosis
Hepatic encephalopathy
Metastatic disease
Portal hypertension
Immunosuppression
Very severe cardiovascular disease
Severe respiratory disease
Source: Data from NHS Blood and Transplant
Note: Chronic health condition data is collected on the history page of WardWatcher.

15
Figure 20 Percentage of patients with d.elayed. d.ischarges in ICU and. Combined. Units (2005-2008)
Note: * Abnormal delays in January - March of 12 ICUs/Combined Units with upgraded WardWatcher
Figure 21 Reasons for d.elayed. d.ischarges in ICU and. Combined. Units*
Note: * Delayed discharges in January - March 2009 of 12 ICUs/Combined Units with upgraded WardWatcher.Normal delays excluded.
0%
5%
10%
15%
20%
25%
30%
2005 2006 2007 2008 2009 *
Year of admission
Adm
issi
ons
We have become aware that some units are experiencing increasing difficulty with discharge from ICU and HDU to lower levels of care due mostly to shortage of ward bed capacity (figures 20 and 21). This may be important if this defers discharge into night time and it may be reflected in a high proportion of night (delayed) admissions. The new version of WardWatcher (installation completed in June 2009) has the ability to examine the reasons for this in more detail and this will be reported in future reports in both ICU and HDU.
Ward bed shortageHDU bed shortageOther problemTransport problemICU bed shortageNursing staff shortageOther staff shortage

16
17
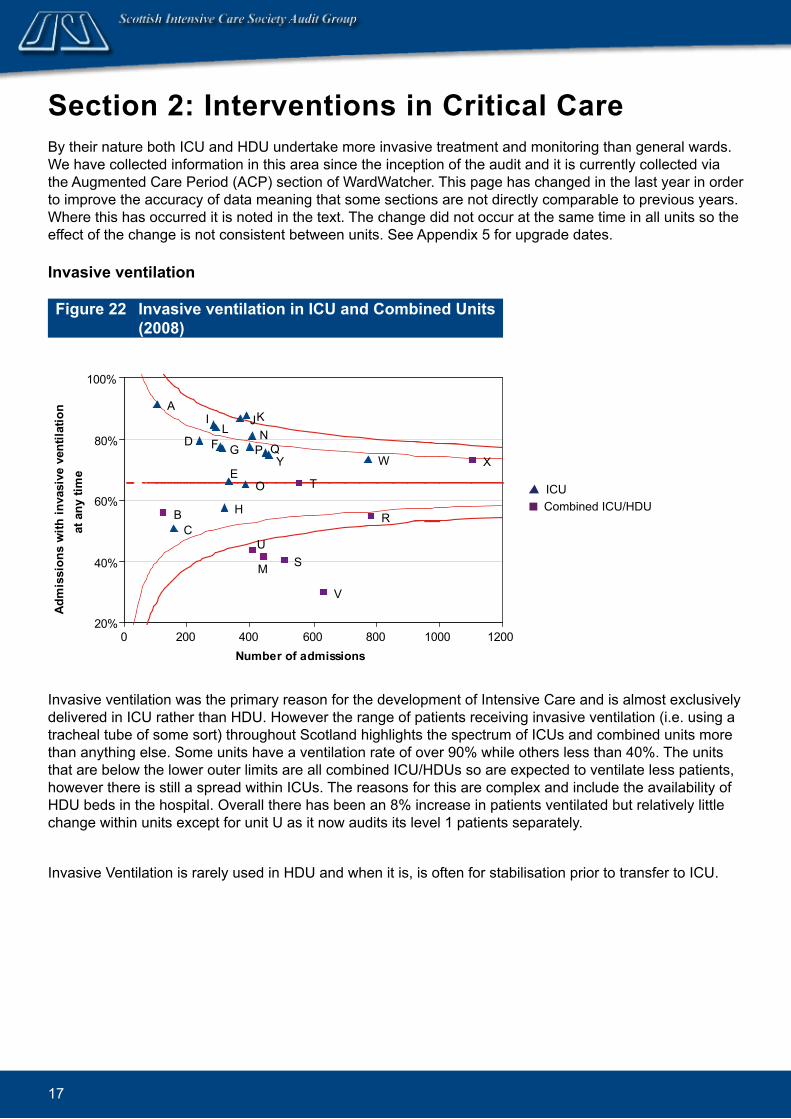
Section 2: Interventions in Critical Care By their nature both ICU and HDU undertake more invasive treatment and monitoring than general wards. We have collected information in this area since the inception of the audit and it is currently collected via the Augmented Care Period (ACP) section of WardWatcher. This page has changed in the last year in order to improve the accuracy of data meaning that some sections are not directly comparable to previous years. Where this has occurred it is noted in the text. The change did not occur at the same time in all units so the effect of the change is not consistent between units. See Appendix 5 for upgrade dates.
Invasive ventilation
Figure 22 Invasive ventilation in ICU and. Combined. Units (2008)
Invasive ventilation was the primary reason for the development of Intensive Care and is almost exclusively delivered in ICU rather than HDU. However the range of patients receiving invasive ventilation (i.e. using a tracheal tube of some sort) throughout Scotland highlights the spectrum of ICUs and combined units more than anything else. Some units have a ventilation rate of over 90% while others less than 40%. The units that are below the lower outer limits are all combined ICU/HDUs so are expected to ventilate less patients, however there is still a spread within ICUs. The reasons for this are complex and include the availability of HDU beds in the hospital. Overall there has been an 8% increase in patients ventilated but relatively little change within units except for unit U as it now audits its level 1 patients separately.
Invasive Ventilation is rarely used in HDU and when it is, is often for stabilisation prior to transfer to ICU.
X
R
W
V
T
S
YQ
M
U
NK
P
O
J
E
H
GFL
I
D
CB
A
20%
40%
60%
80%
100%
0 200 400 600 800 1000 1200Number of admissions
Adm
issi
ons
with
inva
sive
ven
tilat
ion
at a
ny ti
me
ICU Combined ICU/HDU
18
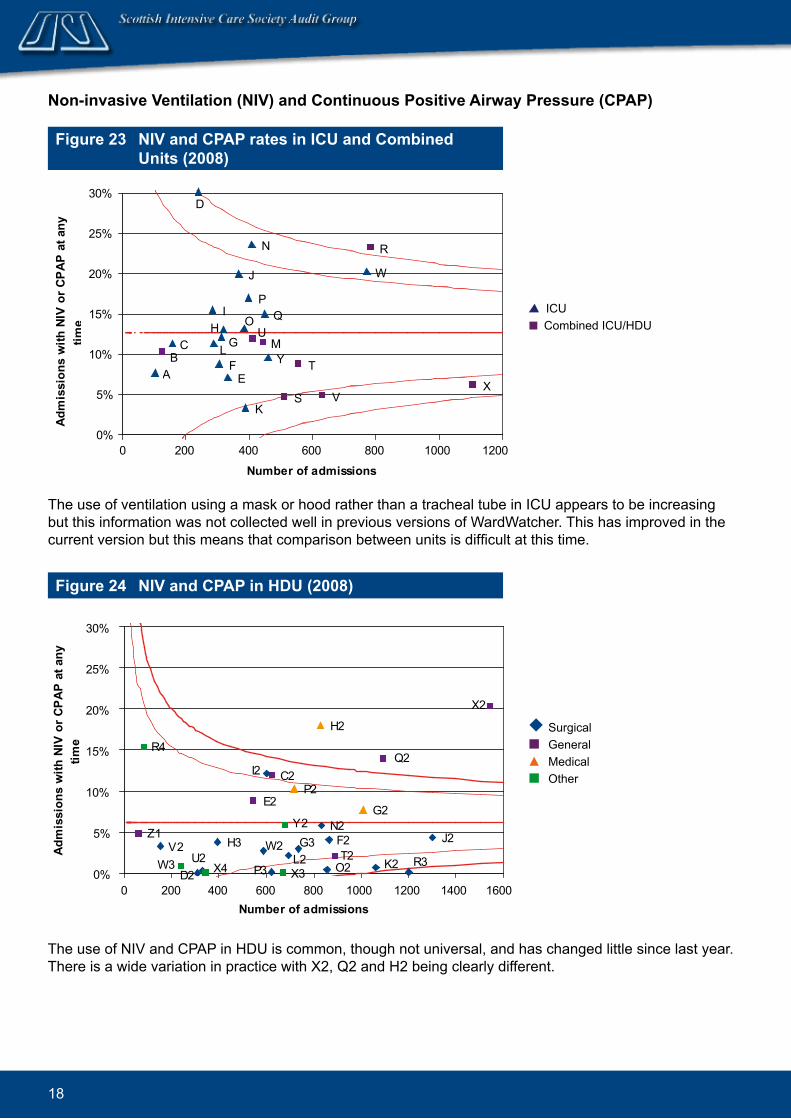
Figure 23 NIV and. CPAP rates in ICU and. Combined. Units (2008)
X
R
W
V
T
S
Y
Q
MU
N
K
P
O
J
E
HG
FL
I
D
CB
A
0%
5%
10%
15%
20%
25%
30%
0 200 400 600 800 1000 1200
Number of admissions
Adm
issi
ons
with
NIV
or C
PAP
at a
ny
time
Non-invasive Ventilation (NIV) and. Continuous Positive Airway Pressure (CPAP)
Figure 24 NIV and. CPAP in HDU (2008)
Z1V2
R4
W3 U2D2 X4
H3
E2
W2
I2
P3
C2
X3
Y2
L2
P2
G3
H2
N2
O2
F2
Q2
T2
G2
K2 R3
J2
X2
0%
5%
10%
15%
20%
25%
30%
0 200 400 600 800 1000 1200 1400 1600Number of admissions
Adm
issi
ons
with
NIV
or C
PAP
at a
ny
time
The use of NIV and CPAP in HDU is common, though not universal, and has changed little since last year. There is a wide variation in practice with X2, Q2 and H2 being clearly different.
The use of ventilation using a mask or hood rather than a tracheal tube in ICU appears to be increasing but this information was not collected well in previous versions of WardWatcher. This has improved in the current version but this means that comparison between units is difficult at this time.
ICU Combined ICU/HDU
Surgical General Medical Other

19
Figure 25 RRT in ICU and. Combined. units (2008)
X
R
W
V
T
S
Y
QM
U
N
KPO
J
E
H
GF
L
I
D
CB
A
0%
5%
10%
15%
20%
25%
30%
0 200 400 600 800 1000 1200Number of admissions
Adm
issi
ons
with
RRT
at a
ny ti
me
Renal Replacement Therapy (RRT)
The proportion of patients receiving renal replacement therapy has been stable with little change within the units. As in previous years some units who would expect to treat only a few patients elect to transfer such patients to units with greater experience.
The majority of HDUs do not use renal replacement therapy though there are a few, especially those in medical HDU with renal units in the hospital, who do.
ICU Combined ICU/HDU
Figure 26 Use of vasoactive d.rugs in ICU and. Combined. Units (2008)
Note: V and Y are outside the outer curves.
Vasoactive Drugs: Inotropes/vasopressors
XRW
V
TS
Y
Q
M
U
NK
P
O
J
E
HGF
L
ID
C
BA
0%
20%
40%
60%
80%
0 200 400 600 800 1000 1200
Number of admissions
Adm
issi
ons
with
in
otro
pes/
vaso
pres
sors
at a
ny ti
me
There has been a small increase from 40 to 42% of patients receiving vasoactive drugs in ICU and Combined units (figure 26) to maintain their blood pressure. Units V and Y have a lower use of these drugs, again the units with lowest use are the combined ICU/HDUs and the SGH Neurological ICU.
ICU Combined ICU/HDU

20
Figure 27 Use of vasoactive d.rugs in HDU (2008)
The use of cardiovascular support in HDU (figure 27) is similar to last year and is less common than in ICU. The pattern is similar to last year with the exception of P3, which has seen over a 70% increase in inotropic/vasopressor use. Unit Q2 is new to the audit and clearly has a different usage to other HDUs.
Z1
V2
R4
W3 U2
D2X4
H3
E2
W2
I2P3
C2
X3
Y2
L2
P2
G3
H2
N2
O2F2
Q2
T2
G2
K2
R3 J2
X2
0%
4%
8%
12%
16%
20%
0 200 400 600 800 1000 1200 1400 1600
Number of admissions
Adm
issi
ons
with
in
otro
pes/
vaso
pres
sors
at a
ny ti
me
Figure 28 Card.iac output monitoring in ICU and. Combined. Units (2008)
Note: Units D, G, N and O are outside the outer curves.
Measurement of the cardiac output is an important tool in managing sick patients. It was measured by using a pulmonary artery flotation catheter but technology and opinion has changed in this area and other techniques are now used. This required a change in data collection and WardWatcher now allows identification of the use of other methods. Unlike the other changes, information on ‘other cardiac output monitoring’ occurred before 2008 so data is complete.
As with other interventions there is a wide variation in use. There is some suggestion that there is some relationship between cardiac output monitoring and use of vasoactive drugs, but this is weak.
X
R
W
VTSY
Q
M
U
N
K
P
O
J
E
H
G
F
L
I
D
CB
A0%
10%
20%
30%
40%
50%
0 200 400 600 800 1000 1200
Number of admissions
Adm
issi
ons
with
car
diac
out
put
mon
itorin
g at
any
tim
e
Surgical General Medical Other
Surgical General Medical Other
21
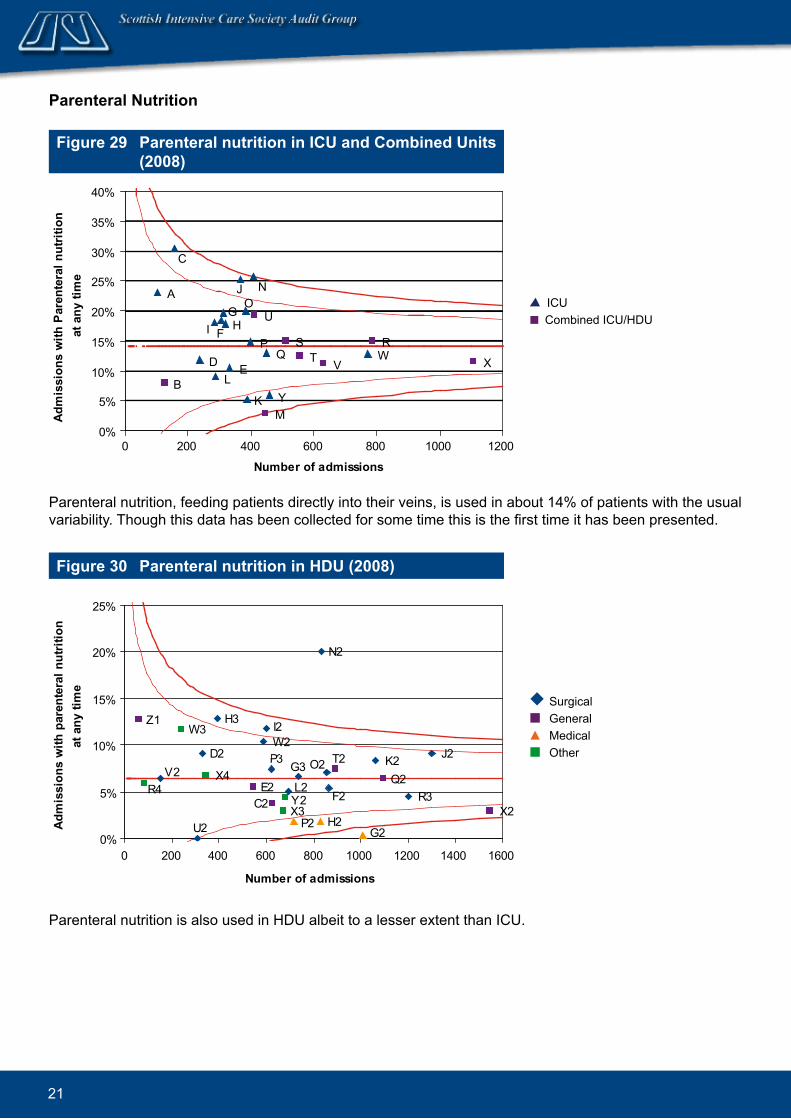
Figure 29 Parenteral nutrition in ICU and Combined Units (2008)
Parenteral Nutrition
X
RW
VTS
Y
Q
M
U
N
K
P
OJ
E
HG
F
L
I
D
C
B
A
0%
5%
10%
15%
20%
25%
30%
35%
40%
0 200 400 600 800 1000 1200
Number of admissions
Adm
issi
ons
with
Par
ente
ral n
utrit
ion
at a
ny ti
me
Figure 30 Parenteral nutrition in HDU (2008)
Parenteral nutrition is also used in HDU albeit to a lesser extent than ICU.
Z1
V2R4
W3
U2
D2
X4
H3
E2
W2I2
P3
C2 X3Y2L2
P2
G3
H2
N2
O2
F2Q2
T2
G2
K2
R3
J2
X2
0%
5%
10%
15%
20%
25%
0 200 400 600 800 1000 1200 1400 1600
Number of admissions
Adm
issi
ons
with
par
ente
ral n
utrit
ion
at a
ny ti
me
Parenteral nutrition, feeding patients directly into their veins, is used in about 14% of patients with the usual variability. Though this data has been collected for some time this is the first time it has been presented.
ICU Combined ICU/HDU
Surgical General Medical Other
22
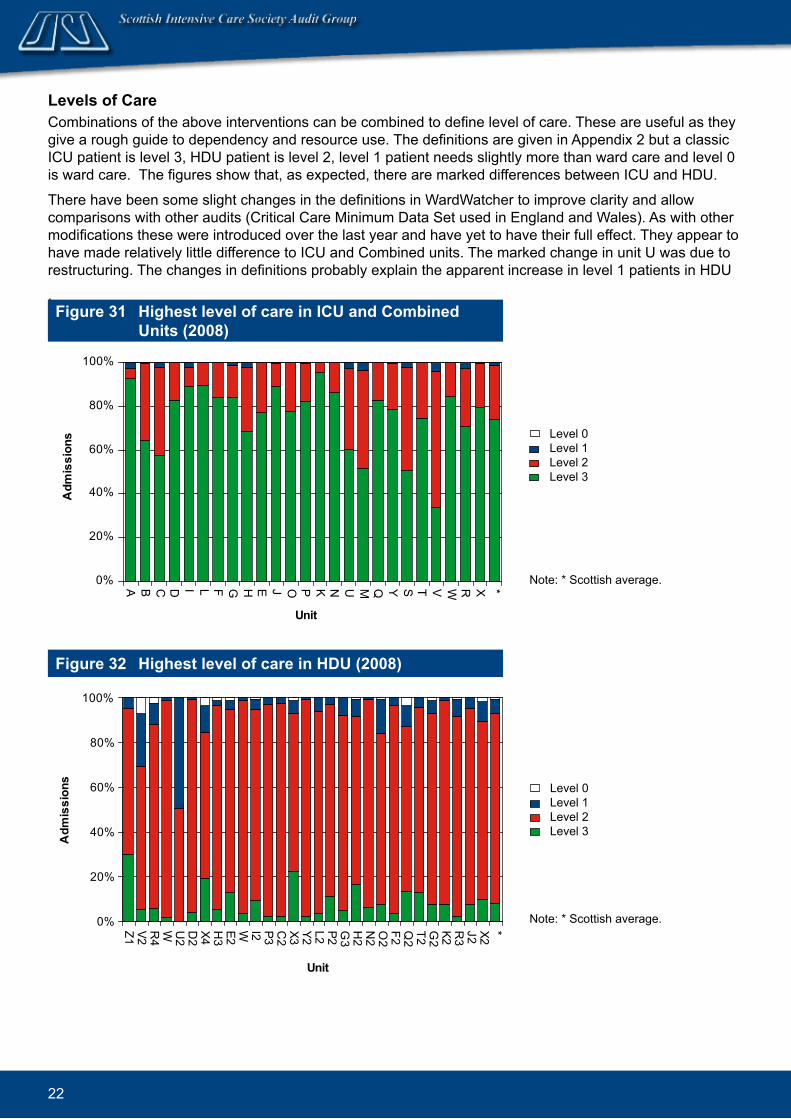
Levels of CareCombinations of the above interventions can be combined to define level of care. These are useful as they give a rough guide to dependency and resource use. The definitions are given in Appendix 2 but a classic ICU patient is level 3, HDU patient is level 2, level 1 patient needs slightly more than ward care and level 0 is ward care. The figures show that, as expected, there are marked differences between ICU and HDU.
There have been some slight changes in the definitions in WardWatcher to improve clarity and allow comparisons with other audits (Critical Care Minimum Data Set used in England and Wales). As with other modifications these were introduced over the last year and have yet to have their full effect. They appear to have made relatively little difference to ICU and Combined units. The marked change in unit U was due to restructuring. The changes in definitions probably explain the apparent increase in level 1 patients in HDU
. Figure 31 Highest level of care in ICU and. Combined.
Units (2008)
Note: * Scottish average.0%
20%
40%
60%
80%
100%
A B C D I L F G H E J O P K N U M Q Y S T V W R X *
Unit
Adm
issi
ons Level 0
Level 1Level 2Level 3
Figure 32 Highest level of care in HDU (2008)
Note: * Scottish average.0%
20%
40%
60%
80%
100%
Z1 V2 R4
W U2
D2
X4 H3
E2 W I2 P3 C2
X3 Y2 L2 P2 G3
H2
N2
O2
F2 Q2
T2 G2
K2 R3
J2 X2 *
Unit
Adm
issi
ons
Level 0Level 1Level 2Level 3
23
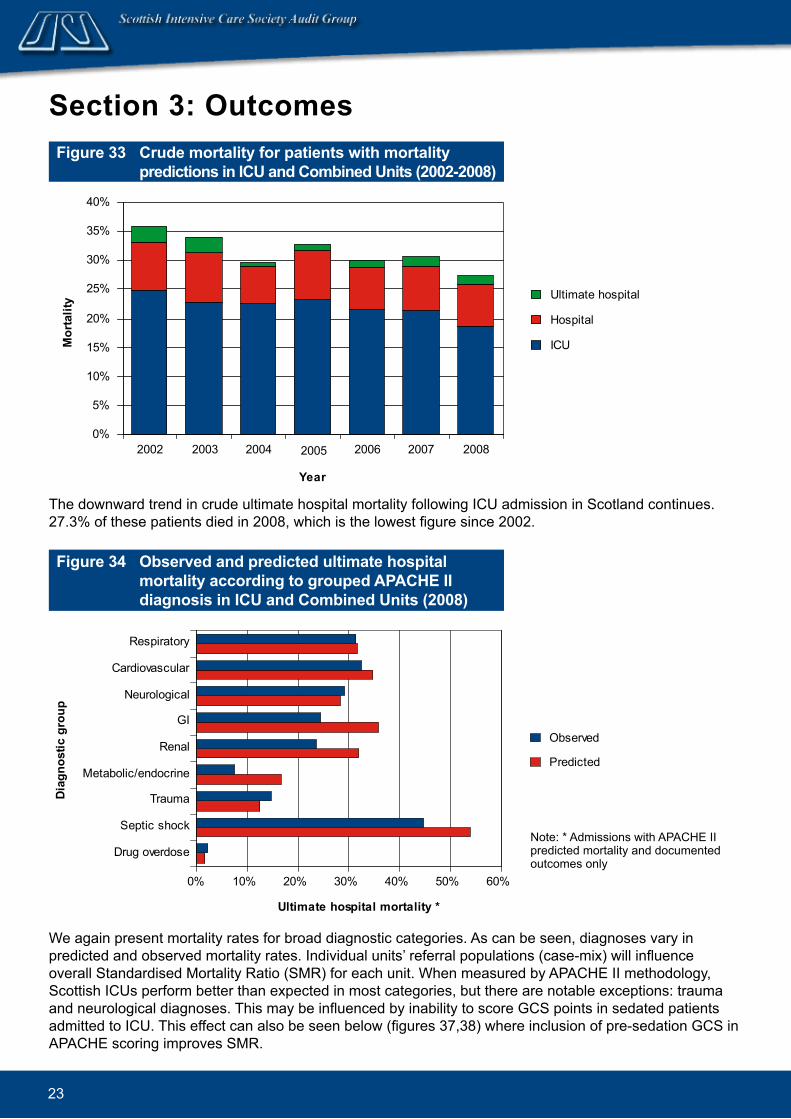
Section 3: Outcomes Figure 33 Crud.e mortality for patients with mortality
pred.ictions in ICU and. Combined. Units (2002-2008)
0%
5%
10%
15%
20%
25%
30%
35%
40%
2002 2003 2004 2005 2006 2007 2008
Year
Mor
talit
y Ultimate hospital
Hospital
ICU
The downward trend in crude ultimate hospital mortality following ICU admission in Scotland continues. 27.3% of these patients died in 2008, which is the lowest figure since 2002.
Figure 34 Observed. and. pred.icted. ultimate hospital mortality accord.ing to grouped. APACHE II d.iagnosis in ICU and. Combined. Units (2008)
0% 10% 20% 30% 40% 50% 60%
Drug overdose
Septic shock
Trauma
Metabolic/endocrine
Renal
GI
Neurological
Cardiovascular
Respiratory
Diag
nost
ic g
roup
Ultimate hospital mortality *
Observed
Predicted
We again present mortality rates for broad diagnostic categories. As can be seen, diagnoses vary in predicted and observed mortality rates. Individual units’ referral populations (case-mix) will influence overall Standardised Mortality Ratio (SMR) for each unit. When measured by APACHE II methodology, Scottish ICUs perform better than expected in most categories, but there are notable exceptions: trauma and neurological diagnoses. This may be influenced by inability to score GCS points in sedated patients admitted to ICU. This effect can also be seen below (figures 37,38) where inclusion of pre-sedation GCS in APACHE scoring improves SMR.
Note: * Admissions with APACHE II predicted mortality and documented outcomes only

24
Figure 35 Case-mix ad.justed. SMRs (APACHE II) in ICU and. Combined. Units (2000-2008)
This shows the effect of case-mix adjustment of crude mortality using the APACHE II system for Scottish ICU’s from 2000-08.
The SMR for all patients admitted to Scottish units in 2008 is 0.86 (95% CI’s 0.82 - 0.89). This is the lowest ever recorded and is significantly lower than any year prior to 2006 (figure 35).
0.80
0.85
0.90
0.95
1.00
1.05
1.10
1.15
2000 2001 2002 2003 2004 2005 2006 2007 2008
Year
Stan
dard
ised
Mor
talit
y Ra
tio
Figure 36 Stand.ard.ised. Mortality Ratios in ICU and. Combined. Units (2008)
Note: Units U and N are outside the inner curves.Units J and G overlap completely.
The pattern of SMRs across Scotland remains remarkably uniform. SICSAG uses 2 standard deviations (SD) from the mean (inner curves) to highlight units that might be different and 3 SD from the mean (outer curves) to highlight units that are different. There are many reasons that could explain statistical outliers, from mere chance, differences in data entry or diagnostic categories, different referral patterns or admission policies to real differences in resources or standards of care. Over the time that the audit has been running, various units have been statistical outliers one year and not the next. This strongly suggests that most variation is due to chance rather than true differences in care.
Units U and N might be different with significantly better outcomes, but no unit has a significant worse outcome on APACHE II case-mix adjusted SMR.
X
W
R
TKIA
B
C
D
UN
PQ
OV
YM
JGE
S
HF L
0.6
0.7
0.8
0.9
1.0
1.1
1.2
0 50 100 150 200 250 300 350
Expected mortality
Sta
ndar
dise
d M
orta
lity
Rat
io
ICU Combined ICU/HDU
25
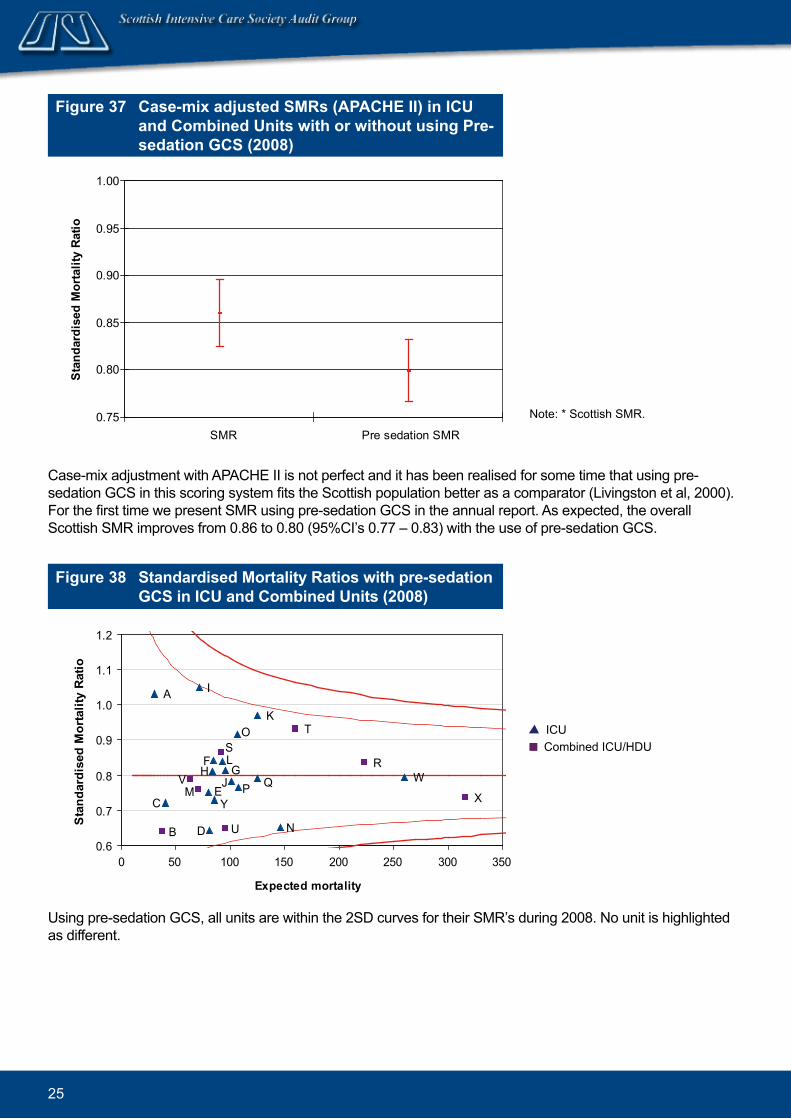
Figure 37 Case-mix ad.justed. SMRs (APACHE II) in ICU and. Combined. Units with or without using Pre-sed.ation GCS (2008)
Note: * Scottish SMR.
Case-mix adjustment with APACHE II is not perfect and it has been realised for some time that using pre-sedation GCS in this scoring system fits the Scottish population better as a comparator (Livingston et al, 2000). For the first time we present SMR using pre-sedation GCS in the annual report. As expected, the overall Scottish SMR improves from 0.86 to 0.80 (95%CI’s 0.77 – 0.83) with the use of pre-sedation GCS.
0.75
0.80
0.85
0.90
0.95
1.00
SMR Pre sedation SMR
Stan
dard
ised
Mor
talit
y Ra
tio
Figure 38 Stand.ard.ised. Mortality Ratios with pre-sed.ation GCS in ICU and. Combined. Units (2008)
Using pre-sedation GCS, all units are within the 2SD curves for their SMR’s during 2008. No unit is highlighted as different.
E
S
Y
F
P
D
J
U
LG
M
O
HQ
K
I
V
C
B
A
T
N
WR
X
0.6
0.7
0.8
0.9
1.0
1.1
1.2
0 50 100 150 200 250 300 350
Expected mortality
Sta
ndar
dise
d M
orta
lity
Rat
io
ICU Combined ICU/HDU

26
Figure 39 Case-mix adjusted SMRs (APACHE II) in ICU and. Combined. Units for non-operative and. post-operative patients (2008)
It is also well recognised that APACHE II case-mix adjustment for patients who are admitted to ICU from theatre after an operation (post-operative) is very different to that for other (non-operative) patients. Patients admitted to ICU after an operation, in general, have had a therapeutic intervention for their underlying problem, while non-operative patients are admitted needing to be resuscitated and treated for an ongoing problem.
As expected, post-operative patients’ SMR (0.64; 95%CI’s 0.59 – 0.70) across Scotland is significantly better than non-operative SMR (0.94; 95%CI’s 0.90 – 0.99). This may be important for individual units as an unusually high or low proportion of non-operative admissions might skew overall SMR. In view of the significant difference in these groups, individual units have been analysed and we have produced non-operative and post-operative SMR funnel plots below.
It should be recognised that increasing the number of comparisons in this way (now 75 instead of 25) makes the chance of a statistical outlier at the 2SD level likely (5% likelihood by chance).
0.50
0.60
0.70
0.80
0.90
1.00
1.10
Non-operative Post-operative
Sta
ndar
dise
d M
orta
lity
Rat
io
Figure 40 Stand.ard.ised. Mortality Ratios with pre-sed.ation GCS for non-operative patients in ICU and. Combined. Units (2008)
Distribution is similar to overall SMR with no units highlighted as different.
E
S
Y
F
P
D
J
U
L
G
M
O
H
Q
KI
VC
B
A
T
NW
R
X
0.6
0.7
0.8
0.9
1.0
1.1
1.2
0 50 100 150 200 250 300
Expected mortality
Sta
ndar
dise
d M
orta
lity
Rat
io
ICU Combined ICU/HDU
27
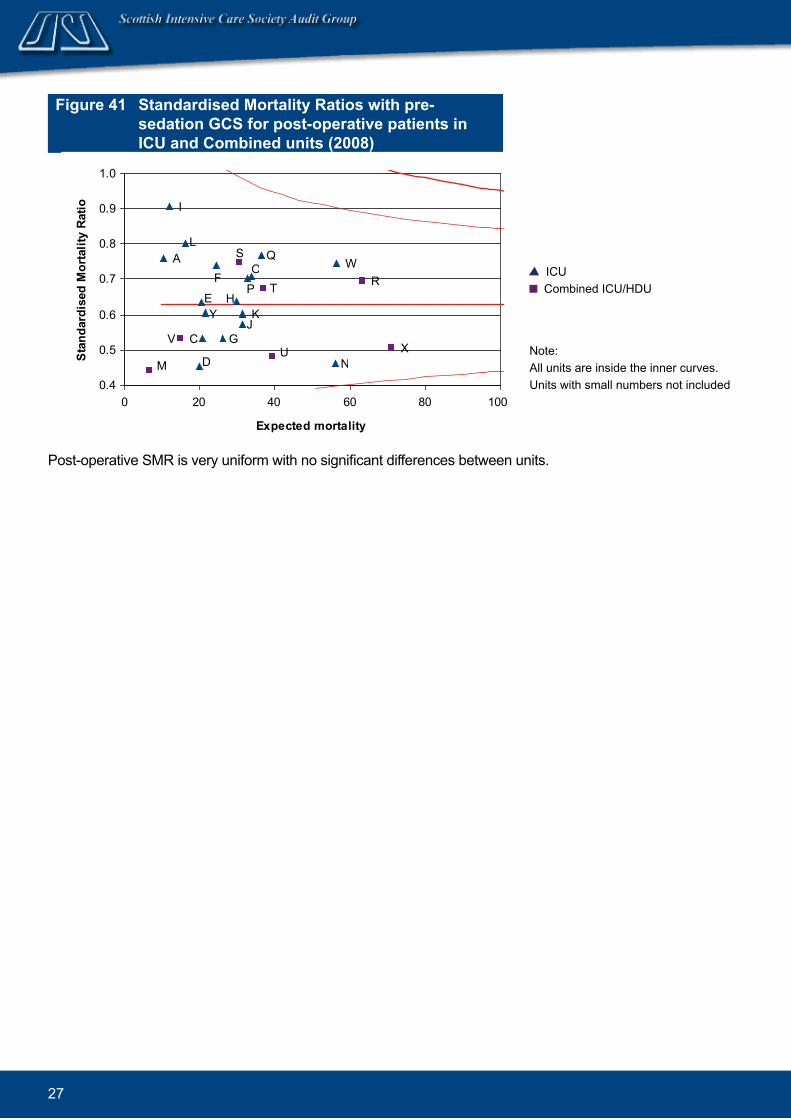
Figure 41 Stand.ard.ised. Mortality Ratios with pre-sed.ation GCS for post-operative patients in ICU and. Combined. units (2008)
Note: All units are inside the inner curves.Units with small numbers not included
Post-operative SMR is very uniform with no significant differences between units.
E
S
Y
FP
D
J
U
L
G
M
O
H
Q
K
I
V C
A
T
N
WR
X
0.4
0.5
0.6
0.7
0.8
0.9
1.0
0 20 40 60 80 100
Expected mortality
Stan
dard
ised
Mor
talit
y Ra
tio
ICU Combined ICU/HDU

28
ConclusionsCritical Care in Scotland remains in safe hands. This is reflected in clinical engagement with this audit and other quality improvement and patient safety programmes. It is no co-incidence that as a consequence, mortality outcomes are trending downwards with time.
There is still work to be done in the coming years to maintain this and if possible improve further. Variations in HDU bed provision require analysis and a ‘needs assessment’ to ensure equity of access for the Scottish population. Challenges remain how we will replace the vital roles and responsibilities of doctors who are training to be consultants as their numbers and working hours reduce with implementation of Modernising Medical Careers and the European Working Time Regulations.
The data presented continues to inform clinicians and managers who use this for benchmarking. Critical Care is expensive, and accurate information of this nature is essential for healthcare planning.
The SICSAG audit is owned by, and could not function without, the nurses and doctors who find time in their busy clinical workload to collect the data and information presented. The Scottish public should be reassured by the findings in this report and that an effective audit continues to examine what happens to the most severely ill and injured patients in our hospitals.

29
Critical Care Capacity (fund.ed. bed.s) 2008Hospital ICU
Level 3Combined. ICU/HDU Level 3/2
HDU Level 2/(L1)
Specialised. Units
Ayr 4.5 4.5 HDUCrosshouse 5.5 6/6 SHDU
6/6 MHDUBGH 4/2 1.4 SHDU (L1)DGRI 4 4 SHDU
8 MHDU/CCUQMH 7 8 SHDUVHK 3/0SRI 9 10 HDUARI 14 8 SHDU (ward 31//32) 4 NHDU (40) GRI 8 12 SHDUIRH 3RAH 7 12 SHDU*Stobhill 5 4 SHDUSGH 5 6 SHDU 4 NHDU
6 NICUVIG 5 8 SHDUWIG/ GGH
7/2 - 10 HDU
Raigmore 8 6 SHDU 4 MHDU
Hairmyres 5.25/4MDGH 5.3 8 SHDUWishaw** 5.3 6.7 SHDURIE 13/5 10 HDU 6 + 2 Renal/ HDU
4 Transplant HDUSJH 3.2/1.6WGH 9/7 10 SHDU (L1) 4 NHDUGBH-Shetland 1 HDU#NWD 7.5 10 SHDU PRI 3 4 HDUTOTAL (Using WW) 106.1 44.45/21.6 156.2/23.4 6/24 (Level 3/2)
Includes units participating in SICSAG Audit during 2008 only
KeyHDU: combined medical/surgical HDU, MHDU: medical HDU, SHDU: surgical HDU, NICU/HDU: neurological ICU/HDUNote* Predominantly Surgical HDU but does admit medical patients** Wishaw: ICU/Combined unit was split into separate ICU and SHDU in October 2008

30
Health Board. PopulationGreater Glasgow & Clyde 1,194,675Lothian 817,727Lanarkshire 561,174Grampian 539,630Tayside 396,942Ayrshire & Arran 367,510Fife 361,815Highland 309,900Forth Valley 290,047Dumfries & Galloway 148,580Borders 112,430Western Isles 26,200Shetland Islands 21,980Orkney Islands 19,890
ICU and/or HDU participating in audit (letter corresponds to hospital key on cover flap) HDU not participating in audit
New HDU in 2009 in hospitals without other units already participating.
ICUs and. HDUs in Scotland.

31
Contact Details
SICSAG Steering Group 2009Name Title Ad.d.ressMs Diana Beard Project Manager National Audit Team Information Services DivisionDr Stephen Cole Vice Chairman Intensive Care Medicine and Anaesthesia Ninewells Hospital, DundeeDr Brian Cook Chairman Critical Care Royal Infirmary of EdinburghDr Kevin Holliday Consultant Intensive Care and Anaesthetics Raigmore HospitalMiss Angela Kellacher Clinical Coordinator SICSAG Information Services DivisionDr Jan Kerssens Senior Statistician SICSAG Information Services DivisionMs Moranne MacGillivray Quality Assurance
ManagerSICSAG Information Services Division
Dr Simon Mackenzie President of SICS Critical Care Royal Infirmary of EdinburghDr Crawford McGuffie Consultant Emergency Department Crosshouse HospitalDr Peter O’Brien Trainee NHS TaysideDr Louie Plenderleith Consultant Critical Care Western Infirmary, GlasgowDr Sarah Ramsay Consultant Critical Care Western Infirmary, GlasgowDr Steve Stott Consultant Critical Care Aberdeen Royal InfirmaryMr Alan Timmins Pharmacist Pharmacy Queen Margaret Hospital,
DunfermlineDr Charles Wallis Consultant Critical Care Western General HospitalDr Roger White Consultant Critical Care Crosshouse HospitalDr Dewi Williams Consultant Critical Care Dumfries and Galloway
Royal Infirmary
Lead Audit Consultant: ICU/Combined units 2009Intensive Care Unit Lead. Aud.it ConsultantAberdeen Royal Infirmary Dr S StottAyr Hospital Dr I TaylorBorders General Hospital Dr J AldridgeCrosshouse Hospital, Kilmarnock Dr R WhiteDumfries & Galloway Royal Infirmary Dr D WilliamsGlasgow Royal Infirmary Dr M DanielHairmyres Hospital, East Kilbride Dr V WatsonInverclyde Royal Hospital Dr F Munro
Monklands Hospital, Airdrie Dr J RuddyNinewells Hospital, Dundee Dr S ColePerth Royal Infirmary Dr S WinshipQueen Margaret Hospital, Dunfermline Dr P NicholasRaigmore Hospital, Inverness Dr K HollidayRoyal Alexandra Hospital, Paisley Dr R SundaramRoyal Infirmary of Edinburgh Dr I MackleSt John’s Hospital, Livingston Dr S MoultrieStirling Royal Infirmary Dr C CairnsStobhill Hospital, Glasgow Dr C MillerSouthern General Hospital, Glasgow (General ICU) Institute of Neurological Sciences
Dr G Imrie Dr L Stewart
Victoria Infirmary, Glasgow Dr A DavidsonWestern General Hospital, Edinburgh Dr C WallisWestern Infirmary, Glasgow Dr L PlenderleithWishaw General Hospital Dr A Morrison
32
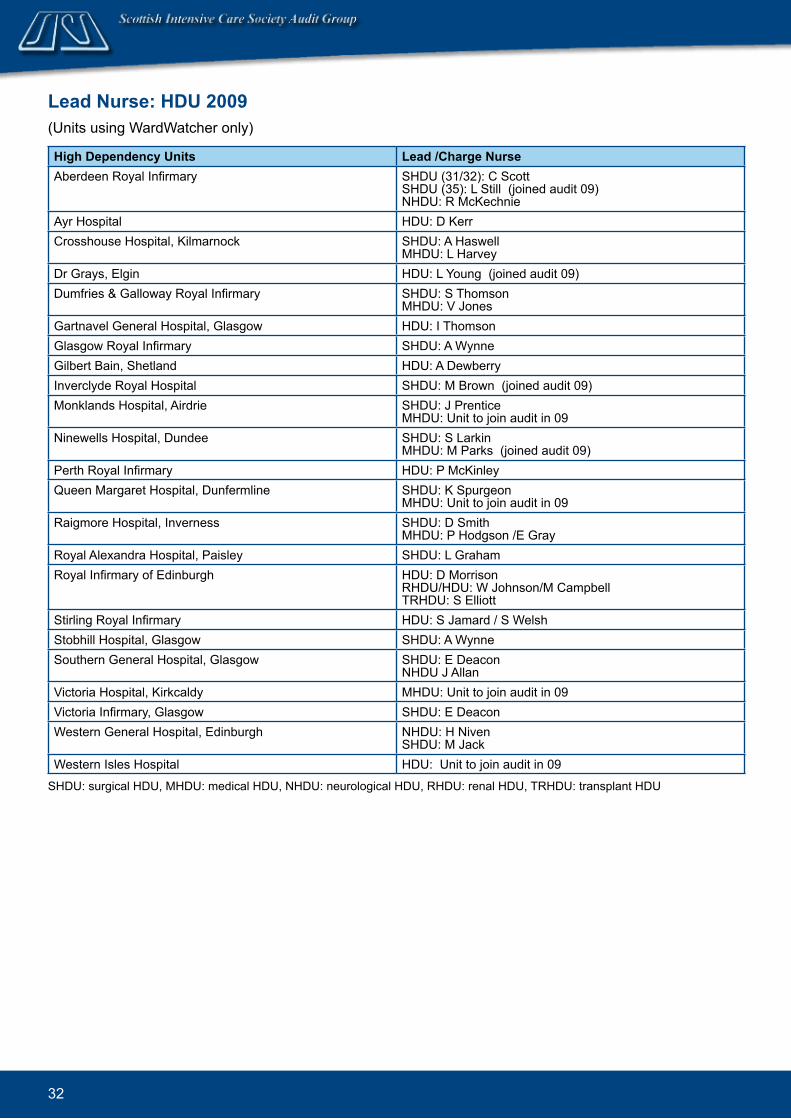
Lead Nurse: HDU 2009(Units using WardWatcher only)
High Depend.ency Units Lead. /Charge NurseAberdeen Royal Infirmary SHDU (31/32): C Scott
SHDU (35): L Still (joined audit 09) NHDU: R McKechnie
Ayr Hospital HDU: D KerrCrosshouse Hospital, Kilmarnock SHDU: A Haswell
MHDU: L HarveyDr Grays, Elgin HDU: L Young (joined audit 09)Dumfries & Galloway Royal Infirmary SHDU: S Thomson
MHDU: V JonesGartnavel General Hospital, Glasgow HDU: I ThomsonGlasgow Royal Infirmary SHDU: A WynneGilbert Bain, Shetland HDU: A DewberryInverclyde Royal Hospital SHDU: M Brown (joined audit 09)Monklands Hospital, Airdrie SHDU: J Prentice
MHDU: Unit to join audit in 09Ninewells Hospital, Dundee SHDU: S Larkin
MHDU: M Parks (joined audit 09)Perth Royal Infirmary HDU: P McKinleyQueen Margaret Hospital, Dunfermline SHDU: K Spurgeon
MHDU: Unit to join audit in 09Raigmore Hospital, Inverness SHDU: D Smith
MHDU: P Hodgson /E GrayRoyal Alexandra Hospital, Paisley SHDU: L GrahamRoyal Infirmary of Edinburgh HDU: D Morrison
RHDU/HDU: W Johnson/M Campbell TRHDU: S Elliott
Stirling Royal Infirmary HDU: S Jamard / S WelshStobhill Hospital, Glasgow SHDU: A WynneSouthern General Hospital, Glasgow SHDU: E Deacon
NHDU J AllanVictoria Hospital, Kirkcaldy MHDU: Unit to join audit in 09Victoria Infirmary, Glasgow SHDU: E DeaconWestern General Hospital, Edinburgh NHDU: H Niven
SHDU: M JackWestern Isles Hospital HDU: Unit to join audit in 09
SHDU: surgical HDU, MHDU: medical HDU, NHDU: neurological HDU, RHDU: renal HDU, TRHDU: transplant HDU
33
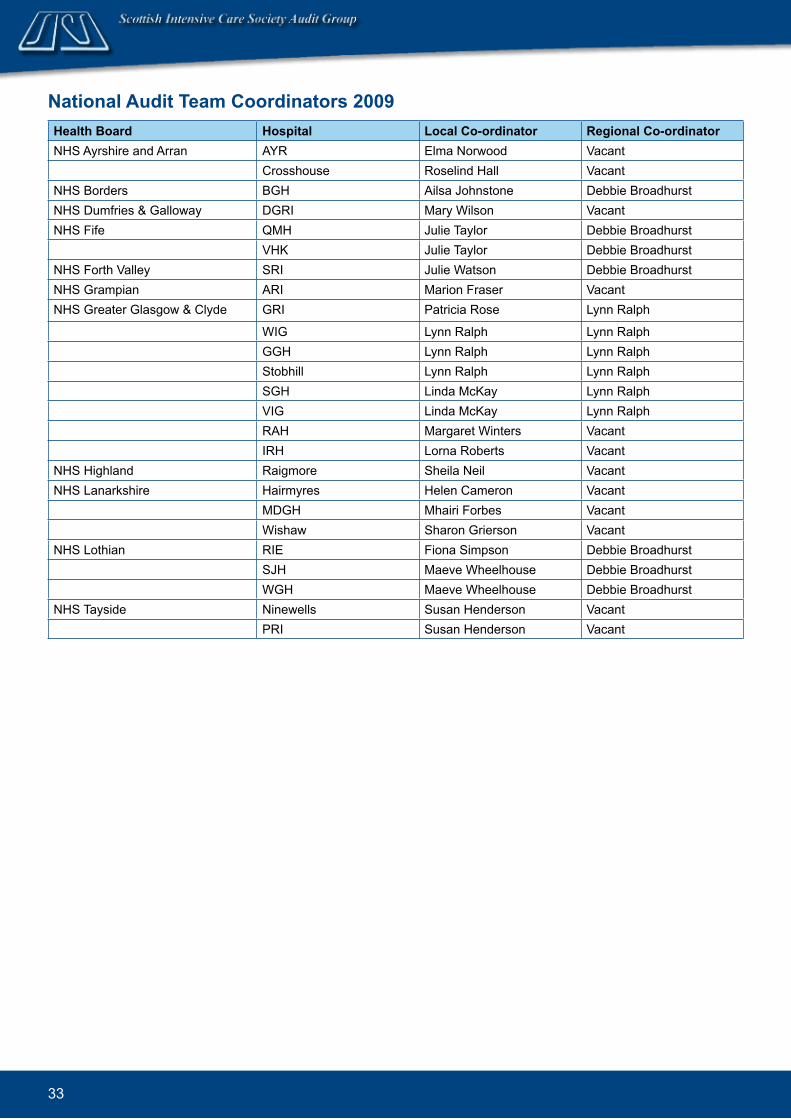
National Audit Team Coordinators 2009Health Board. Hospital Local Co-ord.inator Regional Co-ord.inatorNHS Ayrshire and Arran AYR Elma Norwood Vacant Crosshouse Roselind Hall VacantNHS Borders BGH Ailsa Johnstone Debbie BroadhurstNHS Dumfries & Galloway DGRI Mary Wilson VacantNHS Fife QMH Julie Taylor Debbie Broadhurst VHK Julie Taylor Debbie BroadhurstNHS Forth Valley SRI Julie Watson Debbie BroadhurstNHS Grampian ARI Marion Fraser VacantNHS Greater Glasgow & Clyde GRI Patricia Rose Lynn Ralph
WIG Lynn Ralph Lynn Ralph GGH Lynn Ralph Lynn Ralph Stobhill Lynn Ralph Lynn Ralph SGH Linda McKay Lynn Ralph VIG Linda McKay Lynn Ralph RAH Margaret Winters Vacant IRH Lorna Roberts VacantNHS Highland Raigmore Sheila Neil VacantNHS Lanarkshire Hairmyres Helen Cameron Vacant MDGH Mhairi Forbes Vacant Wishaw Sharon Grierson VacantNHS Lothian RIE Fiona Simpson Debbie Broadhurst SJH Maeve Wheelhouse Debbie Broadhurst WGH Maeve Wheelhouse Debbie BroadhurstNHS Tayside Ninewells Susan Henderson Vacant PRI Susan Henderson Vacant
34
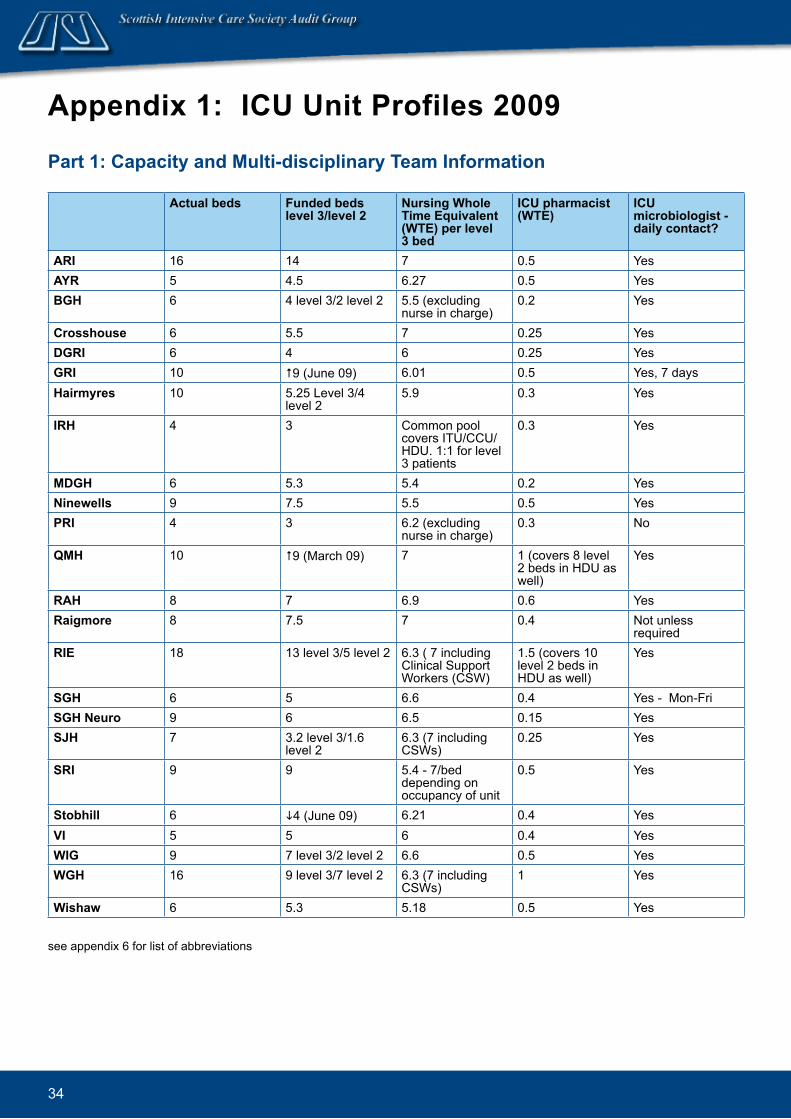
Appendix 1: ICU Unit Profiles 2009
Part 1: Capacity and. Multi-d.isciplinary Team Information
Actual bed.s Fund.ed. bed.s level 3/level 2
Nursing Whole Time Equivalent (WTE) per level 3 bed.
ICU pharmacist (WTE)
ICU microbiologist - d.aily contact?
ARI 16 14 7 0.5 YesAYR 5 4.5 6.27 0.5 YesBGH 6 4 level 3/2 level 2 5.5 (excluding
nurse in charge)0.2 Yes
Crosshouse 6 5.5 7 0.25 YesDGRI 6 4 6 0.25 YesGRI 10 #9 (June 09) 6.01 0.5 Yes, 7 daysHairmyres 10 5.25 Level 3/4
level 25.9 0.3 Yes
IRH 4 3 Common pool covers ITU/CCU/HDU. 1:1 for level 3 patients
0.3 Yes
MDGH 6 5.3 5.4 0.2 YesNinewells 9 7.5 5.5 0.5 YesPRI 4 3 6.2 (excluding
nurse in charge)0.3 No
QMH 10 #9 (March 09) 7 1 (covers 8 level 2 beds in HDU as well)
Yes
RAH 8 7 6.9 0.6 YesRaigmore 8 7.5 7 0.4 Not unless
requiredRIE 18 13 level 3/5 level 2 6.3 ( 7 including
Clinical Support Workers (CSW)
1.5 (covers 10 level 2 beds in HDU as well)
Yes
SGH 6 5 6.6 0.4 Yes - Mon-FriSGH Neuro 9 6 6.5 0.15 YesSJH 7 3.2 level 3/1.6
level 26.3 (7 including CSWs)
0.25 Yes
SRI 9 9 5.4 - 7/bed depending on occupancy of unit
0.5 Yes
Stobhill 6 i4 (June 09) 6.21 0.4 YesVI 5 5 6 0.4 YesWIG 9 7 level 3/2 level 2 6.6 0.5 YesWGH 16 9 level 3/7 level 2 6.3 (7 including
CSWs)1 Yes
Wishaw 6 5.3 5.18 0.5 Yes
see appendix 6 for list of abbreviations
35
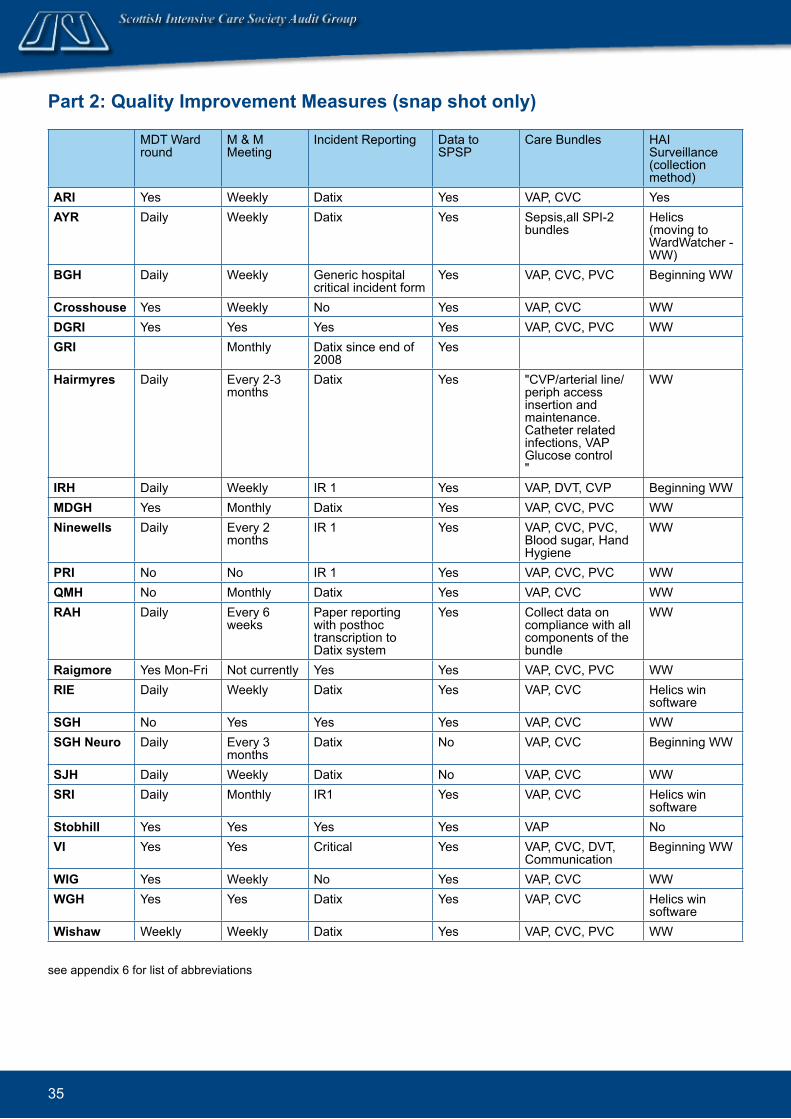
MDT Ward round
M & M Meeting
Incident Reporting Data to SPSP
Care Bundles HAI Surveillance (collection method)
ARI Yes Weekly Datix Yes VAP, CVC Yes AYR Daily Weekly Datix Yes Sepsis,all SPI-2
bundles Helics (moving to WardWatcher - WW)
BGH Daily Weekly Generic hospital critical incident form
Yes VAP, CVC, PVC Beginning WW
Crosshouse Yes Weekly No Yes VAP, CVC WWDGRI Yes Yes Yes Yes VAP, CVC, PVC WWGRI Monthly Datix since end of
2008Yes
Hairmyres Daily Every 2-3 months
Datix Yes "CVP/arterial line/periph access insertion and maintenance. Catheter related infections, VAP Glucose control "
WW
IRH Daily Weekly IR 1 Yes VAP, DVT, CVP Beginning WWMDGH Yes Monthly Datix Yes VAP, CVC, PVC WWNinewells Daily Every 2
monthsIR 1 Yes VAP, CVC, PVC,
Blood sugar, Hand Hygiene
WW
PRI No No IR 1 Yes VAP, CVC, PVC WWQMH No Monthly Datix Yes VAP, CVC WWRAH Daily Every 6
weeksPaper reporting with posthoc transcription to Datix system
Yes Collect data on compliance with all components of the bundle
WW
Raigmore Yes Mon-Fri Not currently Yes Yes VAP, CVC, PVC WWRIE Daily Weekly Datix Yes VAP, CVC Helics win
softwareSGH No Yes Yes Yes VAP, CVC WWSGH Neuro Daily Every 3
monthsDatix No VAP, CVC Beginning WW
SJH Daily Weekly Datix No VAP, CVC WWSRI Daily Monthly IR1 Yes VAP, CVC Helics win
softwareStobhill Yes Yes Yes Yes VAP NoVI Yes Yes Critical Yes VAP, CVC, DVT,
CommunicationBeginning WW
WIG Yes Weekly No Yes VAP, CVC WWWGH Yes Yes Datix Yes VAP, CVC Helics win
softwareWishaw Weekly Weekly Datix Yes VAP, CVC, PVC WW
see appendix 6 for list of abbreviations
Part 2: Quality Improvement Measures (snap shot only)

36
Consultant working day Mon-Fri
ICM Consultant out of hour rota? Consultant Special Interest Groups
ARI 8am-6pm Yes Research, education transport, auditAYR 9am-5pm No Clinical lead is SICSAG Audit lead, ICS link
etcBGH 9am-5pm No Outreach, HAI surveillance
Crosshouse 8.30am-5.30pm Yes YesDGRI 8am-6pm Yes SICSAG, Clinical trials, Outreach, ALERT,
Hospital at Night, SICS council, paediatricsGRI 8am-6pm Yes SICS council, SICS education group, SICS
evidence based medicine group, Research group, Audit, Medical student training in acute medical emergencies, IMPACT training, Electronic patient record group, SPSP fellow
Hairmyres 8.30am-5pm No - part of anaesthetic rota. Consultant dedicated to ITU up till 9pm weekdays and 5 pm weekends. After that responsibilities for theatre included
Yes
IRH 8am-6pm No - 1 cons tier on call nights and weekends
Yes
MDGH 8.30am-6pm No Unit audit/SPSA, teaching,SICSAG,research, pre-assessment
Ninewells 8am-6pm Yes SICSAG, SCCTG, Organ Donation, Sepsis, Tracheostomy care, Neurosurgery/head injuries, Blood Transfusion
PRI
9am-5pm No No
QMH 8.30am-5.30pm Yes YesRAH 8am-6pm Yes YesRaigmore
8am-6pm No Yes
RIE
08.30-21.00 1st on Consultant 08.30-17.30 2nd on Consultant
Yes Transplant anaesthesia, SICSAG, SICS, Emergency Medicine, Aeromedical Retrieval, eHealth Programme, STAG, SCCTG, UK Clinical Research Network for Critical Care
SGH 9am-5pm Yes YesSGH Neuro 8am-6pm No Audit,Organ Donation,College Tutor,
anaesthesia, Spinal InjuriesSJH 8.15am-5pm No SICS council, burns, nutrition, research –
multicentre trials mainly in infectionSRI
8.30am-6pm Yes Yes
Stobhill 9am-5pm Yes YesVI 9am-6pm Yes YesWIG 9am-5pm Yes Yes
WGH 8.30am-6.30pm Yes YesWishaw 8.30am-5pm No Yes
see appendix 6 for list of abbreviations
Part 3: Med.ical Staff Information

37
Trainees Trainee cover - other areas during day OR out of hours?
ARI Yes NoAYR Anaesthetic and ACCST Shared cover with emergency service after
5pmBGH Yes Trainees + Staff Grades cover OOH (inc
theatres / A+E/ CPR/ Obs)Crosshouse Anaesthetic TheatresDGRI Anaesthetic Cover all areas out of hours
GRI
Yes: Anaesthesia trainees; ACCS trainees, Acute medicine trainees, Final year general medical trainees
Arrest team only
Hairmyres
Anaesthetic/acute common stem/ advanced nurse practitioners
Not during day but after 9pm
IRH Anaesthetic ST/FY 1s & 2s Emergency theatre, resus, cardiac arrests, wards
MDGH Anaesthetic but certified for other ICM trainees to advanced No
Ninewells
ICM, Anaesthesia, Acute Common Stem No
PRI Trainees & Staff grades on rota Cover ICU/Critically ill and theatres out of hours. During the night, they are part of the Hospital@Night Team.
QMH Anaesthetic, multi disciplinary, ICM senior trainee at times NoRAH Anaesthetic, ACCS, Acute medicine NoRaigmore Anaesthesia ST 1, 2, 3. FY1. Occasional extras e.g. Remote
and Rural PractitionersOOH covers for part of the small obstetric workload.
RIE "9 man junior rota: 4 FY2 doctors, 1 ST1-2 anaesthetics, 3 ACCS anaesthetics or emergency medicine or acute medicine, 1 senior medical trainee. 6 man senior rota: 3 ST3-7 anaesthetics (daytime in transplant/hepatobiliary anaesthesia), 1 ST 3-7 anaesthics for ICM training, 1 advanced ICM trainee, 1 advanced ICM/research trainee "
See Trainees section
SGH Anaesthetic/ACCS NoSGH Neuro Anaesthetic Cover Neurosurgical theatre out of hours
SJH Anaesthetic Yes
SRI Mixture of anaesthetic, ACC,STs, FY2s, Occasional medical STs
Dedicated ICU trainee cover up to 23:00 M-Thurs. Up to 20:30hrs F-Sun. Overnight cover provided by anaesthetic trainee rota (also covers theatre etc)
Stobhill Anaesthetic, A&E,ICM NoVI Anaesthetic/multi disciplinary, ICM NoWIG Anaesthesia, ACCS. Other trainees on attachment but not on
rotaNo
WGH Multi disciplinary, ICM NoWishaw Anaesthetic/ACCS/ANPC No - but go to theatre where possible to
help/experience
see appendix 6 for list of abbreviations

38
Append.ix 2: Level of CareLevels of care are calculated on a daily basis from the Augmented Care Period (ACP) section of WardWatcher.
The ACP page has been updated in the last year in all units as part of the WardWatcher upgrade (see Appendix 5 for upgrade dates).
Calculating Levels of Care
1. New version (Ward.Watcher upgrad.e 2008) The updated version will score levels of care based on support of five different organ systems: respiratory, cardiovascular, renal, neurological and dermatological. The GI section is not included.
Level 3
Advanced respiratory support (connected to a ventilator via ETT or tracheostomy) OR ●Two or more organ systems are being supported (except basic respiratory and basic cardiac) OR ●One organ system is being supported and a different system is in chronic failure * ●
Level 2
One organ supported ●
Level 1
Epidural or/and ●General observations requiring more monitoring than can be provided on a general ward ●
Level 0
A patient is assessed as level 0 if not assessed as level 1, 2 or 3 (e.g. no organ support and adequate ●monitoring could be provided on a general ward)
2. Old. version of Ward.Watcher The old version of WardWatcher scored level of care based on the support of four different organ systems: respiratory, cardiovascular, renal and neurological.
Level 3
As in new version ●
Level 2
One organ system supported OR ●No organ is being supported but either there is a requirement for more observation or monitoring than ●could be provided safely on a general ward or there is a potential for deterioration
Level 1
A patient is assessed as level 1 if not assessed as level 2 or 3 ●
* Chronic failure is collected from the PMH section of the history page in WardWatcher.

39
Append.ix 3: Method.ologyData collectionData were collected prospectively from all general adult ICUs and the majority of HDUs using the WardWatcher system developed for this purpose. In the first half of 2008, staff from ISD worked closely with staff in units to facilitate the electronic uploading of encrypted data to secure ISD servers. These data were received by April 2009 and then merged into a number of large datasets. Validation queries relating to discharges, outcomes, ages and missing treatment information were then issued and fed back to individual units for checking by local and regional audit co-ordinators.
Along with the measures taken to ensure data validity, the comprehensiveness of the data and size of the merged datasets (incorporating data on all admissions to participating units during 2008) ensures that the findings included in this report have a high degree of reliability at a national, health board and individual unit level.
Presentation of the DataData presented in this report are for patients receiving care in a participating ICU or HDU between 1st January 2008 and 31st December 2008.
The analysis of the data and the presentation of the findings were broadly based on that adopted in previous annual reports. However, a few significant differences should be noted. Additional analyses address the most prevalent diagnoses within Critical Care units, the source of referral and delayed discharges. Furthermore, data from HDUs are included for the third time in this annual report, so some trends may begin to become apparent.
Figures not available in this report (along with more detailed information about subject areas that are included) are available on the SICSAG website www.sicsag.scot.nhs.uk.
Information about the two types of figures from this report that require some detailed explanation (confidence limits and funnel plots) are available on the SICSAG website. In relation to the latter, at this point it is sufficient to state that the presence of a unit outside the funnel should be interpreted with caution. While this indicates a statistically significant deviation from the mean for that variable, such variation is not explained in these figures nor do they define ‘good’ or ‘bad’ practice. There may be many reasons for such variations relating to case-mix, external factors, or different clinical approaches. We would encourage readers to use the data to examine practice in the context of the factors listed above.
40
Append.ix 4: APACHE IIThe outcome measure used by SICSAG is the patient’s survival status (alive or dead) when they finally leave hospital (even if this is not the original hospital). Patients admitted to ICU are at significant, but varied, risk of death. Simply comparing the proportion of patients who die in each unit can give a misleading impression because the severity of their illnesses is different. To overcome this, we use the APACHE II system to adjust for case-mix (Knaus et al, 1985). This is a validated scoring system (Livingston et al, 2000), which takes account of both the patient’s acute condition and their chronic health.
Certain groups of patients are excluded:
Less than 16 years of age ●Unit stay less than 8 hours ●Readmitted to unit during the same hospital admission ●Primary diagnosis for which the system was not developed: burns, coronary artery bypass graft, and ●liver transplant.
WardWatcher provides similar codes as reasons for excluding unit admissions from APACHE II scoring. Taking into account non-response, these were re-coded to reflect the hierarchy of decision-making within units. Automatic exclusions such as ‘diagnosis’, ‘patient under 16’ and ‘patient stayed for less than eight hours’ were excluded first and existing codes changed to reflect this prioritisation. Readmissions were excluded next, followed by ‘other’ cases where no rationale for automatic exclusion was provided. The remaining exclusions were optional, where it was possible to generate a score but this was not done (e.g. HDU patients).
If unit admissions are scored, case-mix adjusted mortality estimates may only be calculated in cases where an appropriate diagnosis is available. All exclusions and cases with missing or inappropriate diagnoses (e.g. liver transplant) are shown schematically in the decision tree on page 41.
APACHE II produces an expected mortality rate for a unit, which can be compared to the actual observed mortality rate to give a standardised mortality ratio (SMR). An SMR greater than 1 suggests that mortality is higher than expected, and a value of less than 1 that it is lower than expected. It is important to interpret SMRs with caution. It should be appreciated that whilst the APACHE II scoring system adjusts for case-mix, it does not do so perfectly. This scoring system is now nearly 30 years old. Many units admit a relatively small number of patients each year and the confidence intervals around the SMR are therefore wide. Exact confidence intervals for SMR are calculated by the method described by (Ulm 1990).

41
Eligibility for APACHE II scores and. selection for analysis
HDU19,924 (65.7%)
Despite APACHE II scores being
calculated for 325 (1.6%) HDU unit
admissions, these are excluded from
the SICSAG analysis.
ALL unit ad.missions30,343
ICU/HDU3,897 (12.8%)
Diagnosis
7 (0.2%)Under 16
24 (0.6%)<8hr stay
186 (3.8%)Readmission
191 (4.9%)Other
52 (1.3%)Optionally scored
patients
276 (7.1%)
Apache II Calculated.3,117 (80.0%)
No mortality prediction because:
No diagnosis
0 (0%)Liver transplant
59 (1.5%)
ICU6,522 (21.5%)
Diagnosis
27 (0.4%)Under 16
136 (2.1%)<8hr stay
139 (2.5%)Readmission
314 (4.8%)Other
26 (0.4%)Optionally scored
patients
501 (1.1%)
Apache II Calculated.5,050 (77.4%)
No mortality prediction because:
No diagnosis
4 (0.1%)Liver transplant
-
Apache II Analysed.3,058 (78.5%)
SIC
SAG
excl
usio
nsU
nit e
xclu
sion
s
6(0.2%)
Missing data:
Apache II Analysed.5,046 (77.4%)
26(0.07%)
43(0.07%)
-
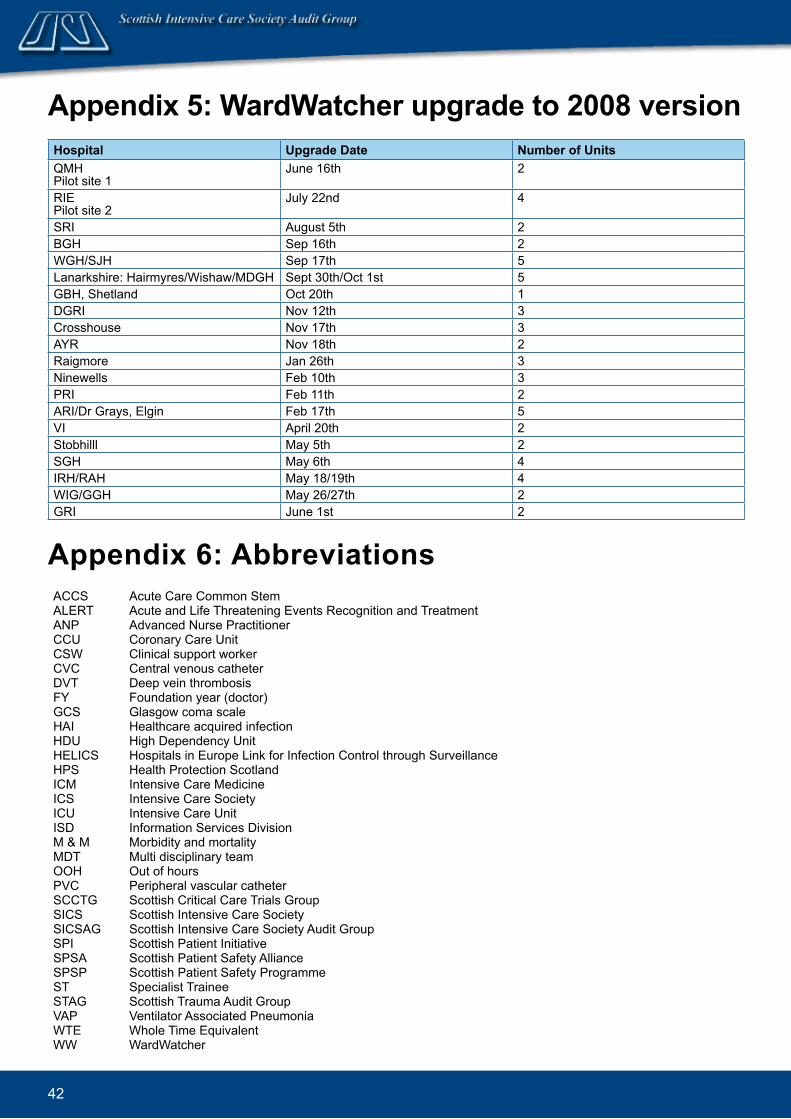
42
Append.ix 5: Ward.Watcher upgrad.e to 2008 versionHospital Upgrad.e Date Number of UnitsQMH Pilot site 1
June 16th 2
RIE Pilot site 2
July 22nd 4
SRI August 5th 2BGH Sep 16th 2WGH/SJH Sep 17th 5Lanarkshire: Hairmyres/Wishaw/MDGH Sept 30th/Oct 1st 5GBH, Shetland Oct 20th 1DGRI Nov 12th 3Crosshouse Nov 17th 3AYR Nov 18th 2Raigmore Jan 26th 3Ninewells Feb 10th 3PRI Feb 11th 2ARI/Dr Grays, Elgin Feb 17th 5VI April 20th 2Stobhilll May 5th 2SGH May 6th 4IRH/RAH May 18/19th 4WIG/GGH May 26/27th 2GRI June 1st 2
Append.ix 6: AbbreviationsACCS Acute Care Common StemALERT Acute and Life Threatening Events Recognition and TreatmentANP Advanced Nurse PractitionerCCU Coronary Care UnitCSW Clinical support workerCVC Central venous catheterDVT Deep vein thrombosisFY Foundation year (doctor)GCS Glasgow coma scaleHAI Healthcare acquired infectionHDU High Dependency UnitHELICS Hospitals in Europe Link for Infection Control through SurveillanceHPS Health Protection ScotlandICM Intensive Care MedicineICS Intensive Care SocietyICU Intensive Care UnitISD Information Services DivisionM & M Morbidity and mortalityMDT Multi disciplinary teamOOH Out of hoursPVC Peripheral vascular catheterSCCTG Scottish Critical Care Trials GroupSICS Scottish Intensive Care SocietySICSAG Scottish Intensive Care Society Audit GroupSPI Scottish Patient InitiativeSPSA Scottish Patient Safety AllianceSPSP Scottish Patient Safety ProgrammeST Specialist TraineeSTAG Scottish Trauma Audit GroupVAP Ventilator Associated PneumoniaWTE Whole Time EquivalentWW WardWatcher
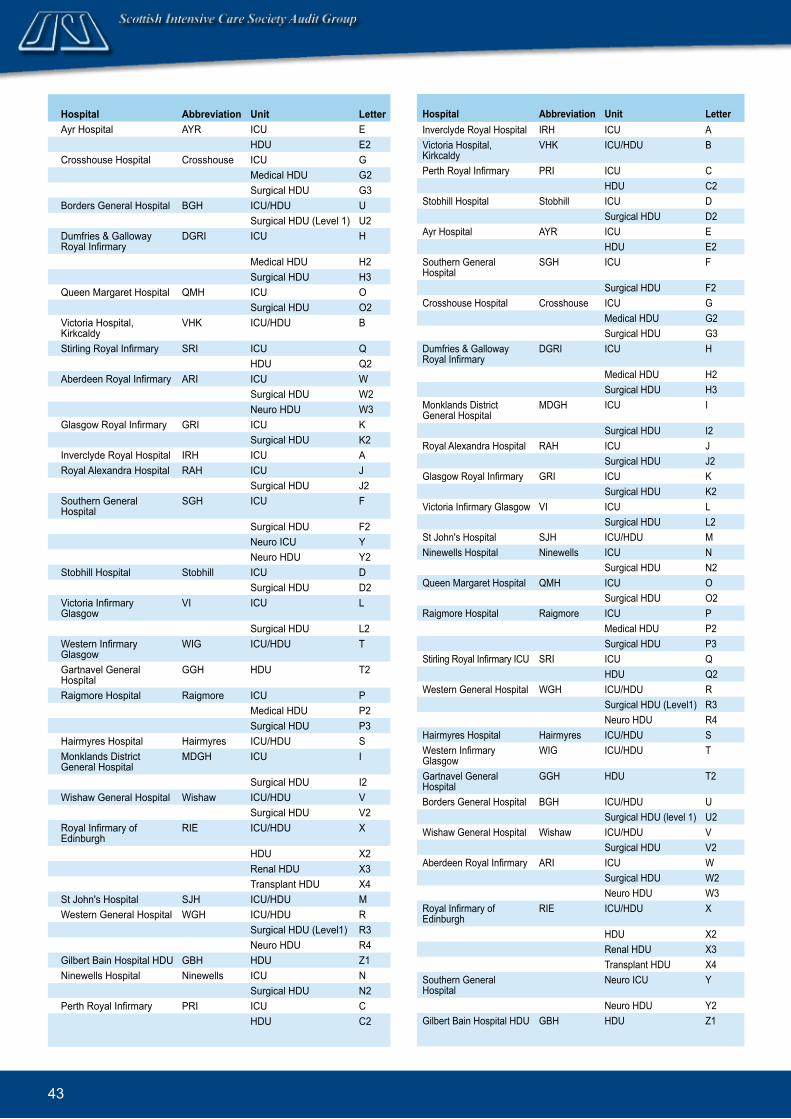
43
Hospital Abbreviation Unit LetterAyr Hospital AYR ICU E
HDU E2Crosshouse Hospital Crosshouse ICU G
Medical HDU G2Surgical HDU G3
Borders General Hospital BGH ICU/HDU USurgical HDU (Level 1) U2
Dumfries & Galloway Royal Infirmary
DGRI ICU H
Medical HDU H2Surgical HDU H3
Queen Margaret Hospital QMH ICU OSurgical HDU O2
Victoria Hospital, Kirkcaldy
VHK ICU/HDU B
Stirling Royal Infirmary SRI ICU QHDU Q2
Aberdeen Royal Infirmary ARI ICU WSurgical HDU W2Neuro HDU W3
Glasgow Royal Infirmary GRI ICU KSurgical HDU K2
Inverclyde Royal Hospital IRH ICU ARoyal Alexandra Hospital RAH ICU J
Surgical HDU J2Southern General Hospital
SGH ICU F
Surgical HDU F2Neuro ICU YNeuro HDU Y2
Stobhill Hospital Stobhill ICU DSurgical HDU D2
Victoria Infirmary Glasgow
VI ICU L
Surgical HDU L2Western Infirmary Glasgow
WIG ICU/HDU T
Gartnavel General Hospital
GGH HDU T2
Raigmore Hospital Raigmore ICU PMedical HDU P2Surgical HDU P3
Hairmyres Hospital Hairmyres ICU/HDU SMonklands District General Hospital
MDGH ICU I
Surgical HDU I2Wishaw General Hospital Wishaw ICU/HDU V
Surgical HDU V2Royal Infirmary of Edinburgh
RIE ICU/HDU X
HDU X2Renal HDU X3Transplant HDU X4
St John's Hospital SJH ICU/HDU MWestern General Hospital WGH ICU/HDU R
Surgical HDU (Level1) R3Neuro HDU R4
Gilbert Bain Hospital HDU GBH HDU Z1Ninewells Hospital Ninewells ICU N
Surgical HDU N2Perth Royal Infirmary PRI ICU C
HDU C2
Hospital Abbreviation Unit LetterInverclyde Royal Hospital IRH ICU AVictoria Hospital, Kirkcaldy
VHK ICU/HDU B
Perth Royal Infirmary PRI ICU CHDU C2
Stobhill Hospital Stobhill ICU DSurgical HDU D2
Ayr Hospital AYR ICU EHDU E2
Southern General Hospital
SGH ICU F
Surgical HDU F2Crosshouse Hospital Crosshouse ICU G
Medical HDU G2Surgical HDU G3
Dumfries & Galloway Royal Infirmary
DGRI ICU H
Medical HDU H2Surgical HDU H3
Monklands District General Hospital
MDGH ICU I
Surgical HDU I2Royal Alexandra Hospital RAH ICU J
Surgical HDU J2Glasgow Royal Infirmary GRI ICU K
Surgical HDU K2Victoria Infirmary Glasgow VI ICU L
Surgical HDU L2St John's Hospital SJH ICU/HDU MNinewells Hospital Ninewells ICU N
Surgical HDU N2Queen Margaret Hospital QMH ICU O
Surgical HDU O2Raigmore Hospital Raigmore ICU P
Medical HDU P2Surgical HDU P3
Stirling Royal Infirmary ICU SRI ICU QHDU Q2
Western General Hospital WGH ICU/HDU RSurgical HDU (Level1) R3Neuro HDU R4
Hairmyres Hospital Hairmyres ICU/HDU SWestern Infirmary Glasgow
WIG ICU/HDU T
Gartnavel General Hospital
GGH HDU T2
Borders General Hospital BGH ICU/HDU USurgical HDU (level 1) U2
Wishaw General Hospital Wishaw ICU/HDU VSurgical HDU V2
Aberdeen Royal Infirmary ARI ICU WSurgical HDU W2Neuro HDU W3
Royal Infirmary of Edinburgh
RIE ICU/HDU X
HDU X2Renal HDU X3Transplant HDU X4
Southern General Hospital
Neuro ICU Y
Neuro HDU Y2Gilbert Bain Hospital HDU GBH HDU Z1
44
ReferencesBetter Critical Care: Report of a Short-Life Working Group on ICU and HDU Issues. Scottish Executive Health Department. 2000; www.sehd.scot.nhs.uk/publications.Department of Health. Organs for transplants: a report from the Organ Donation Taskforce. London 2008. http://www.dh.gov.uk/en/Publicationsandstatistics/Publications/PublicationsPolicyAndGuidance/DH_082122 Department of Health. Acute Care Competency Framework 2008. Goldfrad C, Rowan K. Consequences of discharges from intensive care at night. Lancet 2000; 355 1138-1142.Health Protection Scotland. Surveillance of Intensive Care Unit Associated Infection 2000. http://www.documents.hps.scot.nhs.uk/hai/sshaip/publications/icu-surveillance/icu-surveillance-report.pdf Intensive Care Society. Levels of Critical Care For Adult Patients 2009. http://www.ics.ac.uk/downloads/Levels_of_Care_13012009.pdf Knaus WA, Draper EA, Wagner DP, Zimmerman JE. APACHE II: A Severity of Illness Classification System. Critical Care Medicine 1985; 13/10 818-829.Livingston, B, Mackenzie, S, MacKirdy, F, Howie, JC. on behalf of the Scottish Intensive Care Society Audit Group. Should the pre-sedation Glasgow Coma Scale value be used when calculating Acute Physiology and Chronic Health Evaluation scores for sedated patients? Critical Care Medicine 2000; 28: 389-94.Livingston M, MacKirdy F, Howie J C, Jones R, Norrie J. Assessment of the performance of Five Intensive Care Scoring Models Within a Large Scottish Database. Critical Care Medicine 2000; 28 1820-1827.NICE Guideline 50; Acutely Ill Patients in Hospital. 2007. http://www.nice.org.uk/nicemedia/pdf/CG50FullGuidance.pdfRubenfeld GD, McNamara-Aslin E, Rubinson L. The Pulmonary Artery Catheter, 1967-2007, Rest in Peace? JAMA 2007; 298 458-461.Spiegelhalter DJ. Handling over-dispersion of performance indicators. Quality and Safety in Health Care 2005; 14 347-351.The Scottish Government. The Scottish Medical and Scientific Advisory Committee; A Report on the Provision of HDU Beds in Scotland 2008. http://www.scotland.gov.uk/Resource/Doc/924/0067746.pdf Ulm K. A simple method to calculate the confidence interval of a standardized mortality ratio. American Journal of Epidemiology 1990; 131(2):373-375.
Acknowled.gementThis report was written and produced by the Report writing subgroup of SICSAG.
Members include:
Dr Stephen Cole, Dr Brian Cook, Angela Kellacher, Dr Jan Kerssens, Moranne MacGillivray and Dr Louie Plenderleith.

45
www.sicsag.scot.nhs.uk
www.scottishintensivecare.org.uk