hdu hqghg 'hfhpehu
TRANSCRIPT

Medibank Private Limited ABN 47 080 890 259 GPO Box 9999 <in your capital city> Telephone 132 331 medibank.com.au
24 February 2021
Medibank Private Limited (MPL) – Financial results for half year ended 31 December 2020
In accordance with the Listing Rules, Medibank releases the following documents to the market:
(a) HY21 Results – Appendix 4D, Directors’ Report and Financial Report;
(b) HY21 Results – Media Release; and
(c) HY21 Results – Investor Presentation.
These documents have been authorised for release by the Board.
Mei Ramsay
Company Secretary

_________________________________________________________________________________________
__________________________________________________________________________________________
APPENDIX 4D MEDIBANK PRIVATE LIMITED ABN 47 080 890 259
RESULTS FOR ANNOUNCEMENT TO THE MARKET
31 Dec 2020
$m
31 Dec 2019
$m
Movement
$m
Movement
%
Health Insurance premium revenue 3,328.9 3,316.7 12.2 0.4%
Medibank Health revenue 113.3 104.8 8.5 8.1%
Revenue (excluding net investment and
other income) from continuing operations 3,442.2 3,421.5 20.7 0.6%
Revenue from discontinued operations (1)
- 2.0 (2.0) (100.0%)
Total revenue from ordinary activities 3,442.2 3,423.5 18.7 0.5%
Net investment and other income 73.1 44.6 28.5 63.9%
Total income from operations 3,515.3 3,468.1 47.2 1.4%
Profit from continuing operations after tax
attributable to shareholders226.4 178.6 47.8 26.8%
Profit/(loss) from discontinued operations
after tax attributable to shareholders (1)
- (0.7) 0.7 (100.0%)
Net profit from ordinary activities 226.4 177.9 48.5 27.3%
Medibank Private Limited Group
Half-year ended
(1) Discontinued operations relate to the Garrison Health Services contract, which ceased on 30 June 2019.
The results are summarised as follows:
• Health Insurance premium revenue increased 0.4 percent or $12.2 million to $3,328.9 million
• Medibank Health revenue increased 8.1 percent or $8.5 million to $113.3 million
• Net investment and other income increased 63.9 percent or $28.5 million to $73.1 million
• Profit from continuing operations increased 26.8 percent or $47.8 million to $226.4 million
• Net profit attributable to shareholders increased 27.3 percent or $48.5 million to $226.4 million
For further information refer to the directors’ report in the attached interim financial report of Medibank Private Limited for the half-year period ended 31 December 2020.
Dividend information On 24 September 2020, a fully franked final ordinary dividend of 6.30 cents per ordinary share was paid to shareholders, in respect of the six months ended 30 June 2020.
A fully franked interim ordinary dividend of 5.80 cents per ordinary share was determined on 24 February 2021 in respect of the six months ended 31 December 2020. This dividend is payable on 25 March 2021 to shareholders on the register as at close of business on 4 March 2021.
Net tangible assets per ordinary share Net tangible assets are defined as the net assets of the Medibank Private Limited Group less intangible assets.
31 Dec 2020
cents
31 Dec 2019
cents
Net tangible assets per ordinary share 51.6 49.5
This report should be read in conjunction with the Medibank Private Limited annual financial report for the year ended 30 June 2020, together with any public announcements made by Medibank Private Limited in accordance with its continuous disclosure obligations, and is lodged with the ASX under Listing Rule 4.2A.

_________________________________________________________________________________________
__________________________________________________________________________________________
MEDIBANK PRIVATE LIMITED
ABN 47 080 890 259
INTERIM FINANCIAL REPORT 31 DECEMBER 2020

_________________________________________________________________________________________
__________________________________________________________________________________________
Table of contents
Directors’ report 1
Auditor’s Independence Declaration 4
Consolidated interim financial report
Consolidated statement of comprehensive income 5
Consolidated statement of financial position 6
Consolidated statement of changes in equity 7
Consolidated statement of cash flows 8
Notes to the consolidated interim financial report 9
Directors’ declaration 25
Independent auditor’s review report 26

Directors’ report
______________________________________________________________________________________
______________________________________________________________________________________ 1
The directors of Medibank Private Limited (Medibank) present their report on the consolidated entity consisting of Medibank and the entities it controlled (collectively referred to as the Group) for the half-year ended 31 December 2020. Directors The names of directors in office during the half-year and up to the date of this report, unless stated otherwise, are as follows: Current:
• Mike Wilkins AO - Chairman
• Craig Drummond - Chief Executive Officer
• Dr Tracey Batten
• Anna Bligh AC
• David Fagan
• Peter Hodgett
• Linda Bardo Nicholls AO
• Christine O’Reilly Former:
• Elizabeth Alexander AO (retired 1 October 2020) Review of operations Group Group net profit after tax on a continuing basis increased 26.8% to $226.4 million (1H20: $178.6 million). This was largely due to a $30.4 million or 13.6% increase in Health Insurance operating profit, a $5.5 million or 41.4% increase in Medibank Health operating profit, and an increase in net investment income of $33.3 million or 86.5% to $71.8 million. Health Insurance The solid result in our Health Insurance business was driven by strong policyholder growth, a continued focus on cost control and a lower level of claims growth. The COVID-19 pandemic impacted both premium revenue and claims expense with a net cost of $10 million. Health Insurance premium revenue was up 0.3% to $3,324.5 million. Our customer support measures in response to the COVID-19 pandemic reduced revenue by $109 million, including $92 million resulting from the six-month postponement of the 1 April 2020 premium increase to 1 October 2020. We saw strong policyholder growth for both brands driven by our successful dual brand strategy, a renewed focus on health and wellbeing in the community, and improved retention. On a reported basis, our resident policyholders increased by 2.7% or 49,000 in six months, with an increase of 17,600 policyholders for Medibank, and an increase of 31,400 policyholders for ahm. Despite the closure of the Medibank retail network in Victoria for much of the period, the acquisition rate was up 10 basis points to 5.6%, with particularly strong growth in the new to industry segment. There was a significant improvement in customer retention with the lapse rate falling by approximately 30%. The reported net claims expense was down 0.8%. Adjusting for the reduction in claims of $99 million due to COVID-19, net claims grew 2.6%. Risk equalisation was a $17.8 million payable compared to an $8.4 million receipt in the prior corresponding period. This reflects the fact that our claims growth continues to be below industry growth, lower claims in Victoria and continued strong growth in ahm policyholders. Underlying claims per policy unit which adjusts for both provisions and COVID-19 impacts grew 2.6%. Underlying hospital claims growth was 2.5% and includes the benefit of modest prostheses price reductions, and underlying extras claims growth of 3.1% now fully incorporates the additional customer benefits from the Members’ Choice Advantage dental network. Our COVID-19 claims liability, which is in recognition of claims that have likely been deferred during the pandemic, increased to $310 million (30 June 2020: $297 million).

Directors’ report (continued)
__________________________________________________________________________________________
______________________________________________________________________________________ 2
This was due to an increase in the hospital deferral liability, partially offset by reducing the deferral expectation for hospital claims to 85% down from 100%, and a reduction in the ancillary deferral liability following the reset of Medibank ancillary limits on 31 December 2020. Our productivity agenda and increasing scale were key to maintaining the management expense ratio at 7.5%. Management expenses were marginally higher (1.1% or $2.7 million) to $250.8 million with a small increase in operating expenses and flat non-cash costs. The increase in operating expenses was driven by higher incentive costs compared to the prior period, with cost inflation of around 2% more than offset by approximately $10 million of additional productivity savings. We are on track to deliver $20 million in productivity savings in FY21. Medibank Health Medibank Health revenue on a continuing basis increased 13.2% to $145.6 million with increased demand for in-home care and telehealth services, partly offset by soft demand in travel insurance. Our gross margin improved 80 basis points due to a combination of improved operating efficiency and increasing scale. Management expenses increased by 6.9% or $2.8 million due to underlying inflation and the full period impact of investments during FY20. The management expense growth rate was significantly below the rate of revenue growth leading to a management expense ratio improvement of 170 basis points. Operating profit on a continuing basis was $18.8 million, up from $13.3 million in 1H20, and the operating margin improved by 260 basis points. With this positive momentum Medibank Health is set up for further growth in FY22 and beyond and is on track to deliver on the organic operating profit growth milestone. Net investment income Net investment income increased from $38.5 million in 1H20 to $71.8 million, with higher returns from both the growth and defensive portfolios. The significantly improved performance in the growth portfolio reflects stronger returns in international and domestic equities, and a positive return in property. Income in the defensive portfolio was also higher, with the benefit of narrowing credit spreads more than offsetting a $7 million reduction in interest income due to the lower RBA cash rate. Consistent with previous practice, in order to calculate underlying NPAT for the purposes of determining the dividend for the period, we have adjusted net investment income to normalise for the impact of short-term market returns. After normalisation, the 1H21 net investment income was $38.9 million, marginally down from $39.7 million1 in 1H20. Dividend The directors have determined a fully franked interim ordinary dividend of 5.80 cents per share to be paid on 25 March 2021 to shareholders on the register as at close of business on 4 March 2021. Rounding of amounts
The amounts contained in this directors’ report and in the financial report have been rounded to the nearest hundred
thousand dollars (where rounding is applicable) unless specifically stated otherwise under the relief available
pursuant to ASIC Corporations (Rounding in Financial/Directors’ Reports) Instrument 2016/191. Medibank is an
entity to which that relief applies.
1 The adjustment normalises growth asset returns to long-term expectations and defensive asset returns for credit spread movements.
Normalisation of returns for 1H21 benchmark performance decreases the net investment income by $32.8 million (1H20: increased $1.2 million).

Directors’ report (continued)
__________________________________________________________________________________________
______________________________________________________________________________________ 3
Auditor’s independence declaration A copy of the Auditor’s independence declaration as required by section 307C of the Corporations Act 2001 is set out on page 4. This report is made in accordance with a resolution of the Directors.
Mike Wilkins AO Craig Drummond Chairman Chief Executive Officer 24 February 2021 Melbourne

PricewaterhouseCoopers, ABN 52 780 433 757 2 Riverside Quay, SOUTHBANK VIC 3006, GPO Box 1331, MELBOURNE VIC 3001 T: 61 3 8603 1000, F: 61 3 8603 1999, www.pwc.com.au Liability limited by a scheme approved under Professional Standards Legislation.
Auditor’s Independence Declaration As lead auditor for the review of Medibank Private Limited for the half-year ended 31 December 2020, I declare that to the best of my knowledge and belief, there have been:
a) no contraventions of the auditor independence requirements of the Corporations Act 2001 in relation to the review; and
b) no contraventions of any applicable code of professional conduct in relation to the review.
This declaration is in respect of Medibank Private Limited and the entities it controlled during the period.
CJ Heath Melbourne Partner 24 February 2021 PricewaterhouseCoopers
Consolidated interim financial report 31 December 2020 __________________________________________________________________________________________
______________________________________________________________________________________ 5
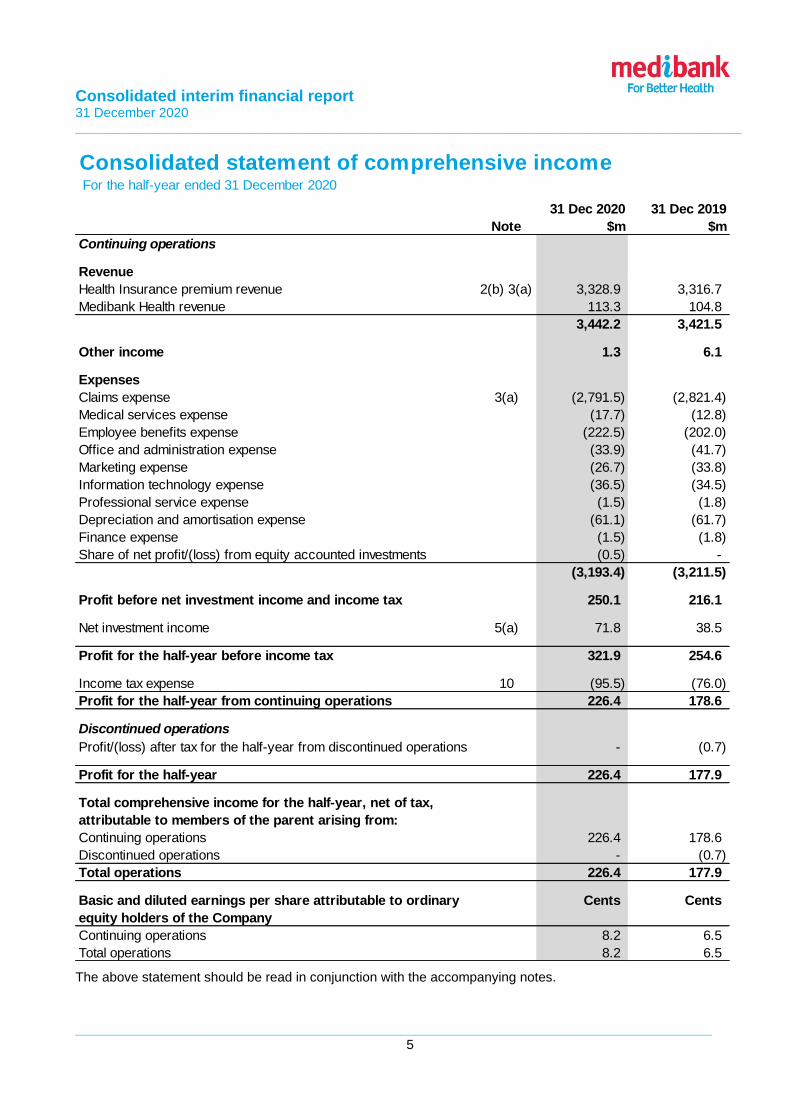
Consolidated statement of comprehensive income For the half-year ended 31 December 2020
Note
31 Dec 2020
$m
31 Dec 2019
$m
Continuing operations
Revenue
Health Insurance premium revenue 2(b) 3(a) 3,328.9 3,316.7
Medibank Health revenue 113.3 104.8
3,442.2 3,421.5
Other income 1.3 6.1
Expenses
Claims expense 3(a) (2,791.5) (2,821.4)
Medical services expense (17.7) (12.8)
Employee benefits expense (222.5) (202.0)
Office and administration expense (33.9) (41.7)
Marketing expense (26.7) (33.8)
Information technology expense (36.5) (34.5)
Professional service expense (1.5) (1.8)
Depreciation and amortisation expense (61.1) (61.7)
Finance expense (1.5) (1.8)
Share of net profit/(loss) from equity accounted investments (0.5) -
(3,193.4) (3,211.5)
Profit before net investment income and income tax 250.1 216.1
Net investment income 5(a) 71.8 38.5
Profit for the half-year before income tax 321.9 254.6
Income tax expense 10 (95.5) (76.0)
Profit for the half-year from continuing operations 226.4 178.6
Discontinued operations
Profit/(loss) after tax for the half-year from discontinued operations - (0.7)
Profit for the half-year 226.4 177.9
Total comprehensive income for the half-year, net of tax,
attributable to members of the parent arising from:
Continuing operations 226.4 178.6
Discontinued operations - (0.7)
Total operations 226.4 177.9
Basic and diluted earnings per share attributable to ordinary
equity holders of the Company
Cents Cents
Continuing operations 8.2 6.5
Total operations 8.2 6.5
The above statement should be read in conjunction with the accompanying notes.

Consolidated interim financial report 31 December 2020 __________________________________________________________________________________________
______________________________________________________________________________________ 6
Consolidated statement of financial position As at 31 December 2020
Note
31 Dec 2020
$m
30 Jun 2020
$m
Current assets
Cash and cash equivalents 606.2 871.4
Trade and other receivables 212.9 207.1
Financial assets at fair value 5(b) 2,142.7 1,994.7
Deferred acquisition costs 33.5 34.5
Other assets 24.6 22.9
Total current assets 3,019.9 3,130.6
Non-current assets
Property, plant and equipment 7 98.4 112.2
Intangible assets 8 378.5 386.0
Deferred acquisition costs 44.5 43.6
Deferred tax assets 74.3 84.0
Other assets 20.2 7.4
Total non-current assets 615.9 633.2
Total assets 3,635.8 3,763.8
Current liabilities
Trade and other payables 9 307.9 320.2
Claims liabilities 3(b) 688.3 628.3
Unearned premium liability 528.2 671.1
Tax liability 3.6 57.7
Provisions and employee entitlements 68.3 73.6
Total current liabilities 1,596.3 1,750.9
Non-current liabilities
Trade and other payables 9 74.2 84.2
Claims liabilities 3(b) 8.2 10.9
Unearned premium liability 62.8 75.0
Provisions and employee entitlements 29.7 28.9
Total non-current liabilities 174.9 199.0
Total liabilities 1,771.2 1,949.9
Net assets 1,864.6 1,813.9
Equity
Contributed equity 85.0 85.0
Reserves 20.2 22.4
Retained earnings 1,759.4 1,706.5
Total equity 1,864.6 1,813.9 The above statement should be read in conjunction with the accompanying notes.

Consolidated interim financial report 31 December 2020 __________________________________________________________________________________________
______________________________________________________________________________________ 7
Consolidated statement of changes in equity For the half-year ended 31 December 2020
Contributed
equity
$m
Reserves
$m
Retained
earnings
$m
Total
equity
$m
Balance at 1 July 2019 85.0 24.4 1,824.7 1,934.1
Profit for the half-year - - 177.9 177.9
Other comprehensive income - - - -
Total comprehensive income for the half-year - - 177.9 177.9
Transactions with owners in their capacity
as owners:
Dividends paid - - (272.6) (272.6)
Acquisition and settlement of share-based
payment, net of tax - (2.7) - (2.7)
Share-based payment transactions - 0.3 - 0.3
Balance at 31 December 2019 85.0 22.0 1,730.0 1,837.0
Balance at 1 July 2020 85.0 22.4 1,706.5 1,813.9
Profit for the half-year - - 226.4 226.4
Other comprehensive income - - - -
Total comprehensive income for the half-year - - 226.4 226.4
Transactions with owners in their capacity
as owners:
Dividends paid - - (173.5) (173.5)
Acquisition and settlement of share-based
payment, net of tax - (5.3) - (5.3)
Share-based payment transactions - 3.1 - 3.1
Balance at 31 December 2020 85.0 20.2 1,759.4 1,864.6 The above statement should be read in conjunction with the accompanying notes.

Consolidated interim financial report 31 December 2020 __________________________________________________________________________________________
______________________________________________________________________________________ 8
Consolidated statement of cash flows For the half-year ended 31 December 2020
Note
31 Dec 2020
$m
31 Dec 2019
$m
Cash flows from operating activities
Premium receipts 3,164.0 3,132.7
Medibank Health receipts 124.2 183.6
Other receipts 2.7 2.5
Payments for claims and levies (2,715.9) (2,823.1)
Payments to suppliers and employees (401.3) (459.8)
Income taxes paid (139.3) (104.9)
Net cash inflow/(outflow) from operating activities 6 34.4 (69.0)
Cash flows from investing activities
Interest received 7.3 16.3
Investment expenses (1.9) (2.2)
Proceeds from sale of financial assets 687.5 873.0
Purchase of financial assets (768.9) (731.7)
Purchase of equity accounted investments 12(c) (7.1) -
Loan to associate 12(c) (2.9) -
Purchase of plant and equipment (2.4) (3.2)
Purchase of intangible assets (13.8) (13.4)
Net cash inflow/(outflow) from investing activities (102.2) 138.8
Cash flows from financing activities
Purchase of shares to settle share-based payment (5.6) (3.8)
Lease principal and interest payments (18.3) (17.7)
Dividends paid (173.5) (272.6)
Net cash outflow from financing activities (197.4) (294.1)
Net increase/(decrease) in cash and cash equivalents (265.2) (224.3)
Cash and cash equivalents at beginning of the half-year 871.4 656.5
Cash and cash equivalents at end of the half-year 606.2 432.2 The above statement should be read in conjunction with the accompanying notes.

Notes to the consolidated interim financial report 31 December 2020 __________________________________________________________________________________________
______________________________________________________________________________________ 9
Note 1: Summary of significant accounting policies The principal accounting policies adopted in the preparation of these consolidated financial statements are consistent with those of the previous financial year and corresponding interim period, as set out in the annual financial report for the year ended 30 June 2020, except for the new accounting policy in relation to equity accounted investments (refer to note 12(c)). The financial statements are for the consolidated entity (the Group), consisting of Medibank Private Limited (Medibank Private or the Company) and its subsidiaries. Medibank Private is a company limited by shares whose shares are publicly traded on the Australian Securities Exchange (ASX). a) Basis of preparation of consolidated interim financial report The consolidated interim financial report for the half-year period ended 31 December 2020 has been prepared in accordance with AASB 134 Interim Financial Reporting and the Corporations Act 2001. The consolidated interim financial report does not include all notes of the type normally included in an annual financial report. Accordingly, this report is to be read in conjunction with the annual report for the year ended 30 June 2020 and any public announcements made by Medibank Private during the interim reporting period in accordance with the continuous disclosure requirements of the Corporations Act 2001. This report includes, where necessary, updates to prior period comparatives for changes in classification of amounts in the current reporting period. b) Critical accounting estimates and judgements The preparation of financial statements requires the use of certain critical accounting estimates. It also requires management to exercise judgement in the process of applying the Group’s accounting policies. The areas involving a higher degree of judgement or complexity, or areas where assumptions and estimates are significant to the financial statements, are:
• Claims liabilities, including the COVID-19 claims liability
• Intangible assets
• Deferred acquisition costs
• Income tax, including a deferred tax asset in relation to the COVID-19 claims liability

Notes to the consolidated interim financial report (continued) 31 December 2020 __________________________________________________________________________________________
______________________________________________________________________________________ 10
Note 2: Segment information a) Segment information provided to the Chief Executive Officer (CEO) The CEO measures the performance of the Group's reportable segments based on the operating profit of the segments. The segment information provided to the CEO for the half-year ended 31 December 2020 is as follows.
$3,315.5m $3,324.5m
$224.2m
$254.6m
2019 2020
Health Insurance
RevenueOperating profit
$128.6m
$145.6m$13.3m
$18.8m
2019 2020
Medibank Health
Revenue from continuing operationsOperating profit from continuing operations
Health
Insurance
Medibank
Health Total
31 Dec 2020 Note $m $m $m
Revenues
Total segment revenue 2(b)(iii) 3,324.5 145.6 3,470.1
Inter-segment revenue - (27.9) (27.9)
Revenue from external customers from continuing
operations 3,324.5 117.7 3,442.2
254.6 18.8 273.4
Items included in segment operating profit:
Depreciation and amortisation (51.4) (4.2) (55.6)
Share of profit/(loss) from equity accounted investments 12(c) - (0.5) (0.5)
Health
Insurance
Medibank
Health Total
31 Dec 2019 Note $m $m $m
Revenues
Total segment revenue 2(b)(iii) 3,315.5 128.6 3,444.1
Inter-segment revenue - (22.6) (22.6)
Revenue from external customers from continuing
operations 3,315.5 106.0 3,421.5
224.2 13.3 237.5
Items included in segment operating profit:
Depreciation and amortisation (51.3) (4.0) (55.3)
Share of profit/(loss) from equity accounted investments 12(c) - - -
Operating profit from continuing operations
Operating profit from continuing operations

Notes to the consolidated interim financial report (continued) 31 December 2020 __________________________________________________________________________________________
______________________________________________________________________________________ 11
Note 2: Segment information (continued) b) Other segment information (i) Segment operating profit or loss A reconciliation of the operating profit from continuing operations to the profit for the half-year before income tax from continuing operations of the Group is as follows:
Note
31 Dec 2020
$m
31 Dec 2019
$m
Total segment operating profit from continuing operations 273.4 237.5
Unallocated to operating segments:
Corporate operating expenses (18.2) (18.7)
Group operating profit from continuing operations 255.2 218.8
Net investment income 5(a) 71.8 38.5
Acquisition intangible amortisation 8 (3.4) (4.5)
AASB 16 Leases transition adjustment - 3.3
Other income/(expenses) (1.7) (1.5)
321.9 254.6
Profit for the half-year before income tax from continuing
operations (ii) Other items Segment operating profit excludes the following:
• Corporate operating expenses of $18.2 million (31 December 2019: $18.7 million) relating to the Group's corporate function.
• Net investment income, which comprises: o Interest and distribution income and related investment management expenses (refer to Note 5(a)),
as this arises from investments which are managed by a central treasury function. o Net gains and losses on disposals of and fair value movements on financial assets and liabilities (refer
to Note 5(a)), as they are not indicative of the Group's long-term performance.
• Acquisition intangible amortisation of $3.4 million (31 December 2019: $4.5 million) not allocated to segments.
• One-off income/(expenses) which are not allocated to the operating activities of the Group’s segments.
• Other expenses of $1.7 million (31 December 2019: $1.5 million) which do not relate to the current period’s trading activities of the Group’s segments, comprising primarily net sublease rent.
(iii) Loyalty program Segment revenue takes into account $4.4 million (31 December 2019: $1.2 million) of transfers between the Group’s operating segments in relation to the loyalty program.

Notes to the consolidated interim financial report (continued) 31 December 2020 __________________________________________________________________________________________
______________________________________________________________________________________ 12
Note 3: Insurance underwriting result
31 December 2020 underwriting result after expenses
Private healthinsurance premium
revenue
Net claims incurred Underwritingexpenses
Underwriting resultafter expenses
$3,324.5m
$(2,818.8)m
$(251.1)m
254.6m
100%
84.7%
7.6%
7.7%
a) Insurance underwriting result
Note
31 Dec 2020
$m
31 Dec 2019
$m
Private health insurance premium revenue (i) 3,324.5 3,315.5
Claims expense
Claims incurred (ii) (2,761.5) (2,825.7)
Movement in COVID-19 claims liability (iii) (13.2) -
State levies (26.6) (25.9)
Net Risk Equalisation Special Account rebates/(payments) (17.8) 8.4
Net claims incurred excluding claims handling costs (2,819.1) (2,843.2)
Movement in claims handling costs on outstanding claims liabilities 0.3 (0.7)
Net claims incurred (2,818.8) (2,843.9)
Underwriting expenses (251.1) (247.4)
Underwriting result after expenses 254.6 224.2 (i) Private health insurance premium revenue and underwriting expenses are after $4.4 million of transfers
between the Group’s other operating segments (31 December 2019: $1.2 million). (ii) Claims incurred are prior to elimination of transactions with the Group’s other operating segments of
$27.3 million (31 December 2019: $22.5 million). (iii) This balance relates to the COVID-19 claims liability. The liability is based on the best estimate, taking into
account relevant risks and uncertainties, of expenditure required to settle claims deferred as a result of surgeries and other health services being restricted for policyholders due to the COVID-19 pandemic. Medibank has an obligation to settle these claims as they become known in future periods. Refer to Note 3(b) for further information.
Notes to the consolidated interim financial report (continued) 31 December 2020 __________________________________________________________________________________________
______________________________________________________________________________________ 13
Note 3: Insurance underwriting result (continued)
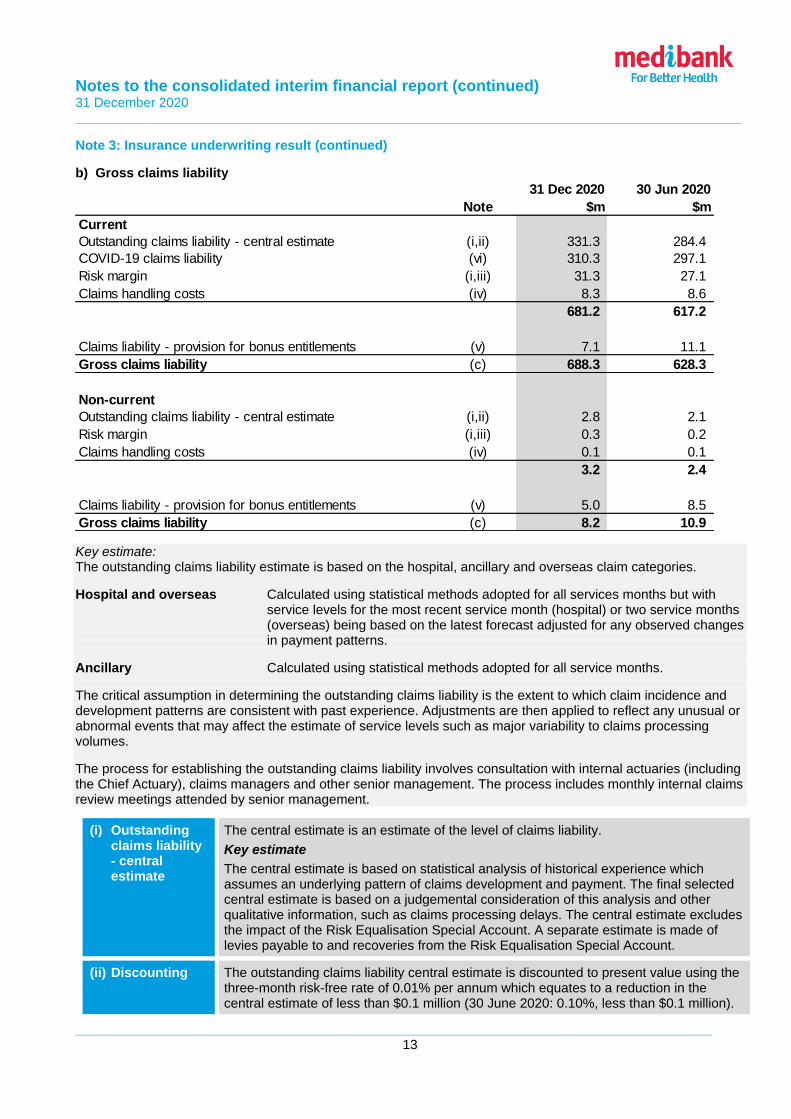
b) Gross claims liability
Note
31 Dec 2020
$m
30 Jun 2020
$m
Current
Outstanding claims liability - central estimate (i,ii) 331.3 284.4
COVID-19 claims liability (vi) 310.3 297.1
Risk margin (i,iii) 31.3 27.1
Claims handling costs (iv) 8.3 8.6
681.2 617.2
Claims liability - provision for bonus entitlements (v) 7.1 11.1
Gross claims liability (c) 688.3 628.3
Non-current
Outstanding claims liability - central estimate (i,ii) 2.8 2.1
Risk margin (i,iii) 0.3 0.2
Claims handling costs (iv) 0.1 0.1
3.2 2.4
Claims liability - provision for bonus entitlements (v) 5.0 8.5
Gross claims liability (c) 8.2 10.9
Key estimate: The outstanding claims liability estimate is based on the hospital, ancillary and overseas claim categories.
Hospital and overseas Calculated using statistical methods adopted for all services months but with service levels for the most recent service month (hospital) or two service months (overseas) being based on the latest forecast adjusted for any observed changes in payment patterns.
Ancillary Calculated using statistical methods adopted for all service months.
The critical assumption in determining the outstanding claims liability is the extent to which claim incidence and development patterns are consistent with past experience. Adjustments are then applied to reflect any unusual or abnormal events that may affect the estimate of service levels such as major variability to claims processing volumes.
The process for establishing the outstanding claims liability involves consultation with internal actuaries (including the Chief Actuary), claims managers and other senior management. The process includes monthly internal claims review meetings attended by senior management.
(i) Outstanding claims liability - central estimate
The central estimate is an estimate of the level of claims liability.
Key estimate
The central estimate is based on statistical analysis of historical experience which assumes an underlying pattern of claims development and payment. The final selected central estimate is based on a judgemental consideration of this analysis and other qualitative information, such as claims processing delays. The central estimate excludes the impact of the Risk Equalisation Special Account. A separate estimate is made of levies payable to and recoveries from the Risk Equalisation Special Account.
(ii) Discounting The outstanding claims liability central estimate is discounted to present value using the three-month risk-free rate of 0.01% per annum which equates to a reduction in the central estimate of less than $0.1 million (30 June 2020: 0.10%, less than $0.1 million).

Notes to the consolidated interim financial report (continued) 31 December 2020 __________________________________________________________________________________________
______________________________________________________________________________________ 14
Note 3: Insurance underwriting result (continued)
b) Gross claims liability (continued)
(iii) Risk margin An overall risk margin considers the uncertainty surrounding the outstanding claims liability. The risk margin applied to the Group’s outstanding claims central estimate (net of risk equalisation) at 31 December 2020 is 9.2% (30 June 2020: 9.2%).
Key estimate
The risk margin is based on an analysis of past experience, including comparing the volatility of past payments to the adopted central estimate. The risk margin has been estimated to equate to the Group’s objective of achieving a probability of adequacy of at least 95% (30 June 2020: 95%). The risk margin is not applied to the COVID-19 claims liability. Relevant risks and uncertainties have been taken into account in determining the best estimate of the COVID-19 claims liability.
(iv) Claims handling costs
The allowance for claims handling costs at 31 December 2020 is 2.5% of the outstanding claims liability (30 June 2020: 3.0%).
(v) Claims liability – provision for bonus entitlements
Certain private health insurance products (Package Bonus, Ultra Bonus and Membership Bonus) include benefits that carry forward. Package Bonus carries forward unused benefit entitlements in a calendar year for five calendar years. Membership Bonus carries forward unused benefit entitlements in a calendar year for 10 calendar years. Ultra Bonus carries forward unused benefit entitlements without limit.
The Group’s claims liabilities include a provision to cover expected future utilisation of these benefit entitlements of the current membership.
Key estimate
The bonus provision includes the total entitlement available to members under the terms of the relevant insurance policies, less any amounts utilised, with a probability of utilisation based on past experience and current claiming patterns applied. The true cost of these entitlements cannot be known with certainty until any unclaimed entitlements are processed.
(vi) COVID-19 claims liability
The liability relates to claims deferred as a result of surgeries and other health services being restricted for policyholders during the COVID-19 pandemic period. At 30 June 2020 this impacted health services for hospital, ancillary and overseas claims. Following the annual reset of ancillary limits at 31 December 2020, a COVID-19 claims liability is no longer required for ancillary claims with expired limits.
Key estimate – Hospital and Overseas
The liability is calculated by comparing the difference between the actual and expected volume of insured surgeries and other procedures since the commencement of restrictions in March 2020 (the COVID-19 period). Risks and uncertainties have been taken into account in the measurement of the liability and are reflected in the key inputs and judgements.
The key judgements and inputs into this liability estimate include:
• Statistical analysis of the expected claims level at the Single Equivalent Unit per policy (PSEU) during the COVID-19 period.
• The expected claims level is based on the estimated underlying claims growth per PSEU that would have occurred if the COVID-19 pandemic did not eventuate. It has then been applied to the average actual number of PSEUs during the COVID-19 period.
• The expected rate that deferred insured surgeries and other procedures will be caught up, which is based on the analysis and expert opinion of the Chief Medical Officer and internal analysis. The expected deferral rate also takes into consideration an allowance for policyholder lapse. The expected claims deferral rate is 85% (30 June 2020: 100%).

Notes to the consolidated interim financial report (continued) 31 December 2020 __________________________________________________________________________________________
______________________________________________________________________________________ 15
Note 3: Insurance underwriting result (continued) c) Reconciliation of movement in claims liabilities
Note
31 Dec 2020
$m
30 Jun 2020
$m
Balance at beginning of period (1 July) 639.2 377.6
Claims incurred during the period 2,746.6 5,120.0
Increase in COVID-19 claims liability (i) 13.2 297.1
Claims paid during the period (2,689.8) (5,180.8)
Amount (over)/under provided on central estimate (ii) (16.7) 22.3
Risk margin 4.3 1.7
Claims handling costs (0.3) 0.8
Movement in discount rate - 0.5
Balance at end of period 696.5 639.2 Note: movement includes both current and non-current. Claims incurred and claims paid exclude levies and rebates.
(i) The current period movement relates to the reduction in the hospital expected claims deferral rate from 100% to 85%, the utilisation of the liability and the recognition of deferred claims arising during the period.
(ii) The over provision recognised in the current period predominantly relates to the COVID-19 period. This has been recognised within the COVID-19 liability as at 31 December 2020 at the applicable deferral rate.
(d) Impact of changes in key variables on the claims liabilities Outstanding claims liability The central estimate, discount rate, risk margin and weighted average term to settlement are the key outstanding claims variables. A 10% increase/decrease in the central estimate would result in a $23.4 million decrease/increase to profit after tax and equity (30 June 2020: $20.1 million). A 1% movement in other key outstanding claims variables, including discount rate and risk margin and a one-month movement in the weighted average term to settlement, would result in an insignificant decrease/increase to profit after tax and equity. COVID-19 claims liability The following describe the individual impacts of changes in the key estimate on the COVID-19 claims liability:
• A 4% increase/decrease in the expected claims level would result in a $81.4 million decrease/increase to profit after tax and equity (30 June 2020: $44.8 million).
• An increase/decrease of 10 percentage points in the adopted deferral rate for COVID-19 hospital claims would result in a $24.8 million decrease/increase to profit after tax and equity (30 June 2020: $16.4 million). The reasonable possible range for the hospital deferral assumption is 75-100% (30 June 2020: 90-100%).

Notes to the consolidated interim financial report (continued) 31 December 2020 __________________________________________________________________________________________
______________________________________________________________________________________ 16
Note 4: Dividends
Cents per fully
paid share $m Payment date
31 Dec 2020
2020 final fully franked dividend 6.30 173.5 24 September 2020
31 Dec 2019
2019 final fully franked dividend 7.40 203.8 26 September 2019
2019 final fully franked special dividend 2.50 68.9 26 September 2019
(a) Dividends not recognised at the end of the reporting period On 24 February 2021, the directors determined an interim fully franked ordinary dividend for the six months ended 31 December 2020 of 5.80 cents per share. The dividend is expected to be paid on 25 March 2021 and has not been provided for as at 31 December 2020. (b) Calculation of dividend paid Medibank’s target dividend payout ratio for the 2021 financial year is 75-85% (2020: 75-85%) of full year normalised net profit after tax (underlying NPAT). Normalised net profit after tax is calculated based on statutory net profit after tax adjusted for short-term outcomes that are expected to normalise over the medium to longer term, most notably in relation to the level of gains or losses from investments and movement in credit spreads, and for one-off items, especially those that are non-cash, such as impairments.
31 Dec 2020
$m
31 Dec 2019
$m
Profit for the half-year 226.4 177.9
Normalisation for growth asset returns (13.2) 1.2
Normalisation for defensive asset returns – credit spread movement (9.8) (0.4)
Underlying NPAT 203.4 178.7

Notes to the consolidated interim financial report (continued) 31 December 2020 __________________________________________________________________________________________
______________________________________________________________________________________ 17
Note 5: Investment portfolio This note provides information on the Group’s net investment income and the carrying amounts of the Group’s investments.
Portfolio composition 31 Dec 2020 ($m)
Health Fund
Investment
Portfolio
Non-Health Fund
Investment
Portfolio
Total
Cash portfolio
Cash and cash equivalents (as reported in the
statement of financial position) (1) (2)
525.2 54.1 579.3
Cash investments with longer maturities 174.8 25.0 199.8
Less cash allocated to the fixed income
portfolio (66.9) - (66.9)
Fixed income portfolio
Fixed income (as reported in the statement of
financial position) (3)
1,544.7 148.5 1,693.2
Less cash investments with longer maturities (174.8) (25.0) (199.8)
Cash allocated to the fixed income portfolio 66.9 - 66.9
Growth portfolio
Equities and investment trusts 449.5 - 449.5
Total investment portfolio 2,519.4 202.6 2,722.0
Portfolio composition 30 Jun 2020 ($m)
Health Fund
Investment
Portfolio
Non-Health Fund
Investment
Portfolio
Total
Cash portfolio
Cash and cash equivalents (as reported in the
statement of financial position) (1) (2)
676.5 170.5 847.0
Cash investments with longer maturities 185.0 - 185.0
Fixed income portfolio
Fixed income (as reported in the statement of
financial position) (3)
1,480.7 47.2 1,527.9
Less cash investments with longer maturities (185.0) - (185.0)
Growth portfolio
Equities and investment trusts 466.8 - 466.8
Total investment portfolio 2,624.0 217.7 2,841.7
(1) Cash and cash equivalents as reported in the statement of financial position also include operational cash of $26.9 million (30 June 2020: $24.4 million).
(2) Cash and cash equivalents in the Health Fund Investment Portfolio includes $81.1 million (30 June 2020: $236.5 million) in relation to the Short-term Operational Cash sub-portfolio.
(3) Fixed income in the Health Fund Investment Portfolio includes $229.2 million (30 June 2020: $60.6 million) relating to the Short-term Operational Cash sub-portfolio.

Notes to the consolidated interim financial report (continued) 31 December 2020 __________________________________________________________________________________________
______________________________________________________________________________________ 18
Note 5: Investment portfolio (continued) The Health Fund Investment Portfolio excluding the Short-term Operational Cash sub-portfolio comprises the following:
a) Net investment income
Note
31 Dec 2020
$m
31 Dec 2019
$m
Interest (i) 8.4 17.2
Trust distributions 21.9 23.0
Investment management expenses (1.9) (2.2)
Net gain/(loss) on fair value movements on financial assets 20.9 (4.9)
Net gain/(loss) on disposal of financial assets 22.5 5.4
Net investment income 71.8 38.5
(i) Includes interest income of $0.3 million (31 December 2019: $0.8 million) relating to financial assets at fair value through other comprehensive income (Non-Health Fund Investments).
b) Fair value hierarchy The fair values of the Group’s investments are measured according to the following fair value measurement hierarchy:
• Level 1: Quoted prices (unadjusted current bid price) in active markets for identical assets or liabilities.
• Level 2: Inputs other than quoted prices included within level 1 that are observable for the asset or liability, either directly (as prices) or indirectly (derived from prices).
• Level 3: Inputs for the asset or liability that are not based on observable market data.
The following tables present the Group’s financial assets measured and recognised at fair value on a recurring basis.
$105.5mAustralian
equities$128.0m
International
equities
$165.4mProperty
$50.6mInfrastructure
$1,207.6mFixed income
$552.0mCash
Health Fund Investment Portfolio
Portfolio
composition
31 Dec 2020
Portfolio
composition
30 Jun 2020
Target asset
allocation
Growth
Australian equities 4.7% 6.3% 5.0%
International equities 5.8% 6.5% 6.0%
Property 7.5% 7.0% 7.0%
Infrastructure 2.3% 0.3% 2.0%
20.3% 20.1% 20.0%
Defensive
Fixed income 54.7% 53.0% 52.0%
Cash 25.0% 26.9% 28.0%
79.7% 79.9% 80.0%
100.0% 100.0% 100.0%

Notes to the consolidated interim financial report (continued) 31 December 2020 __________________________________________________________________________________________
______________________________________________________________________________________ 19
Note 5: Investment portfolio (continued) b) Fair value hierarchy (continued)
Level 1 Level 2 Level 3 Total
31 Dec 2020 $m $m $m $m
Financial assets at fair value through profit or loss
Australian equities (1)
- 105.5 - 105.5
International equities (1)
- 128.0 - 128.0
Property (1)
- 50.2 115.2 165.4
Infrastructure (1)
- - 50.6 50.6
Fixed income 87.3 1,457.4 - 1,544.7
Financial assets at fair value through other
comprehensive income - Fixed income - 148.5 - 148.5
Balance at 31 December 2020 87.3 1,889.6 165.8 2,142.7
Level 1 Level 2 Level 3 Total
30 Jun 2020 $m $m $m $m
Financial assets at fair value through profit or loss
Australian equities (1)
- 146.8 - 146.8
International equities (1)
- 151.6 - 151.6
Property (1)
- 162.5 - 162.5
Infrastructure (1)
- - 5.9 5.9
Fixed income 97.9 1,382.8 - 1,480.7
Financial assets at fair value through other
comprehensive income - Fixed income - 47.2 - 47.2
Balance at 30 June 2020 97.9 1,890.9 5.9 1,994.7
(1) Australian equities, international equities, property and infrastructure are indirectly held through unit trusts. The Group’s other financial instruments, being trade and other receivables and trade and other payables, are not measured at fair value. The fair value of these instruments has not been disclosed, as due to their short-term nature their carrying amounts are assumed to approximate their fair values. The Group did not measure any financial assets or financial liabilities at fair value on a non-recurring basis at 31 December 2020. The Group recognises any transfers into and transfers out of fair value hierarchy levels from the date of effect of the transfer. There were no transfers between level 1 and level 2 during the period. c) Valuation techniques The fair value of financial instruments traded in active markets (such as exchange traded equities) is based on quoted market prices at the end of the reporting period. The quoted market price used for financial assets held by the Group is the current bid price. These instruments are included in level 1. The fair value of level 2 financial instruments is determined using a variety of valuation techniques which make assumptions based on market conditions existing at the end of each reporting period. Valuation methods include quoted market prices or dealer quotes for similar instruments, yield curve calculations using the mid yield, vendor or independently developed models.

Notes to the consolidated interim financial report (continued) 31 December 2020 __________________________________________________________________________________________
______________________________________________________________________________________ 20
Note 5: Investment portfolio (continued)
c) Valuation techniques (continued) Fair value measurements using significant unobservable market data (level 3) As at 31 December 2020, the Group classified $50.6 million of infrastructure financial assets (30 June 2020: $5.9 million) and $115.2 million of property financial assets (30 June 2020: nil) as level 3 financial instruments. These instruments are held in unlisted unit trusts and are valued at the redemption value per unit as reported by the managers of such funds. These investments are classified within level 3 of the fair value hierarchy as they are not based on observable market data as they trade infrequently and therefore have limited price transparency. The following table presents the changes in level 3 financial instruments for the half-year ended 31 December 2020.
Note
Infrastructure
$m
Property
$m
Total
$m
Balance at 1 July 2020 5.9 - 5.9
Acquisitions 44.0 - 44.0
Net unrealised gain/(loss) on fair value movements 0.7 - 0.7
Transfer from level 2 (i) - 115.2 115.2
Balance at 31 December 2020 50.6 115.2 165.8
(i) As at 31 December 2020, $115.2 million of property financial assets were transferred from level 2 into level 3
due to changes in the observability of inputs.

Notes to the consolidated interim financial report (continued) 31 December 2020 __________________________________________________________________________________________
______________________________________________________________________________________ 21
Note 6: Reconciliation of profit after income tax to net cash flow from operating activities
Note
31 Dec 2020
$m
31 Dec 2019
$m
Profit for the half-year 226.4 177.9
Depreciation 6.6 6.2
Depreciation of right-of-use assets 13.3 13.1
Amortisation of intangibles assets 21.7 22.8
Amortisation of deferred acquisition costs 19.5 19.6
Net realised loss/(gain) on financial assets (22.5) (5.4)
Net unrealised loss/(gain) on financial assets (20.9) 4.9
Interest income (8.4) (17.2)
Trust distribution reinvested (21.9) (23.0)
Investment management expenses 1.9 2.2
Interest paid - leases 1.5 1.8
AASB 16 transition adjustment - recognition of finance subleases - 3.3
Non-cash share-based payments expense 3.1 0.3
Share of loss/(profit) from associates and joint ventures 0.5 -
Decrease/(increase) in trade and other receivables (5.8) 11.2
Decrease/(increase) in deferred acquisition costs (19.4) (19.0)
Decrease/(increase) in other assets (0.7) (8.3)
(Decrease)/increase in net deferred tax liabilities 9.7 18.9
(Decrease)/increase in trade and other payables (13.8) (82.8)
(Decrease)/increase in unearned premium liability (155.1) (168.2)
(Decrease)/increase in claims liabilities 57.3 30.1
(Decrease)/increase in income tax liability (54.1) (48.1)
(Decrease)/increase in provisions and employee entitlements (4.5) (17.7)
Decrease/(increase) in trade and other receivables - 67.1
(Decrease)/increase in trade and other payables - (47.7)
(Decrease)/increase in provisions and employee entitlements - (11.0)
Net cash inflow/(outflow) from operating activities 34.4 (69.0)
Change in operating assets and liabilities - continuing operations:
Change in operating assets and liabilities - discontinued operations:
Note 7: Property, plant and equipment
Note
31 Dec 2020
$m
30 Jun 2020
$m
Closing net book amount
Plant and equipment 6.3 6.1
Leasehold improvements 26.7 31.0
Assets under construction 1.3 3.0
Right-of-use assets 64.1 72.1
Total property, plant and equipment 98.4 112.2

Notes to the consolidated interim financial report (continued) 31 December 2020 __________________________________________________________________________________________
______________________________________________________________________________________ 22
Note 8: Intangible assets
Goodwill
$m
Customer
contracts and
relationships
$m
Software
$m
Assets under
construction
$m
Total
$m
Gross carrying amount
Balance at 1 July 2020 282.9 89.7 465.3 28.0 865.9
Additions - - 0.2 14.0 14.2
Transfers in/(out) - - 10.2 (10.2) -
Disposals - - - - -
Balance at 31 December 2020 282.9 89.7 475.7 31.8 880.1
Accumulated amortisation
and impairment
Balance at 1 July 2020 (78.4) (81.4) (320.1) - (479.9)
Amortisation expense - (3.4) (18.3) - (21.7)
Disposals - - - - -
Balance at 31 December 2020 (78.4) (84.8) (338.4) - (501.6)
Closing net book amount
As at 31 December 2020 204.5 4.9 137.3 31.8 378.5
As at 30 June 2020 204.5 8.3 145.2 28.0 386.0 a) Assessment of indicators of impairment Key judgement and estimate: Goodwill and intangible assets that have an indefinite useful life are not subject to amortisation and are tested annually for impairment, or more frequently if events or changes in circumstances indicate that they might be impaired. Finite life intangible assets are assessed for indicators of impairment whenever events or changes in circumstances indicate that the carrying amount may not be recoverable. Management have performed an assessment for indicators of impairment of the Group’s intangible assets as at 31 December 2020 and have concluded that no indicators of impairment existed. In assessing the goodwill for impairment, the recoverable amount of the cash-generating unit (CGU) was determined based on a value-in-use calculation. The key assumptions used in testing the CGU for impairment are outlined in the Group’s annual financial report for the year ended 30 June 2020.

Notes to the consolidated interim financial report (continued) 31 December 2020 __________________________________________________________________________________________
______________________________________________________________________________________ 23
Note 9: Trade and other payables
Note
31 Dec 2020
$m
30 Jun 2020
$m
Current
Trade creditors 225.1 230.2
Other creditors and accrued expenses 43.9 53.8
Lease liabilities 27.4 27.9
Other payables 11.5 8.3
Total current 307.9 320.2
Non-current
Lease liabilities 70.4 81.3
Other payables 3.8 2.9
Total non-current 74.2 84.2 Note 10: Income tax expense
31 Dec 2020
$m
31 Dec 2019
$m
Continuing operations
Current tax 85.5 55.2
Deferred tax 10.0 20.8
Income tax expense reported in the statement of comprehensive
income 95.5 76.0 Note 11: Contingencies From time to time, the Group is exposed to contingent liabilities which arise from the ordinary course of business, including:
• Losses which might arise from litigation.
• Investigations from internal reviews and by regulatory bodies such as the ACCC, ASIC or APRA, into past conduct on either industry-wide or Medibank specific matters.
It is anticipated that the likelihood of any unprovided liabilities arising is either remote or not material. Note 12: Other (a) New and amended standards adopted The Group has not elected to apply any pronouncements before their operative date in the half-year reporting period ended 31 December 2020. The amendments that became effective for the annual reporting period commencing on 1 July 2020 did not have a material impact on the Group’s accounting policies or on the consolidated interim financial report.

Notes to the consolidated interim financial report (continued) 31 December 2020 __________________________________________________________________________________________
______________________________________________________________________________________ 24
Note 12: Other (continued) (b) New accounting standards and interpretations not yet adopted AASB 17 Insurance Contracts is effective for reporting periods beginning on or after 1 January 2023 and will replace AASB 4 Insurance Contracts, AASB 1023 General Insurance Contracts and AASB 1038 Life Insurance Contracts. The Group will apply AASB 17 for the annual period beginning 1 July 2023. The standard introduces a new general measurement model for accounting for insurance contracts. However, a simplified premium allocation approach, similar in nature to the Group’s existing measurement basis under AASB 1023 is permitted in certain circumstances (such as for short-duration contracts). The Group has a comprehensive project underway to assess the potential impact on its consolidated financial statements. This includes identifying changes to the Group’s accounting policies, reporting requirements, systems, processes and controls. It is expected that the Group will be eligible to apply the simplified premium allocation approach to the majority of its insurance contracts and therefore the measurement basis is not expected to significantly change. However it is expected that under AASB 17 there will be substantial changes in presentation of the financial statements and disclosures. (c) Significant events since 30 June 2020 During the period, the Group acquired interests in the following entities over which the Group has significant influence or joint control. These are both accounted for under the equity method whereby the investment in associate or joint venture is initially recognised at cost and is increased or decreased to recognise the Group’s share of profit or loss. Equity accounting of losses is restricted to the Group’s interest in the associate or joint venture. The results of these equity accounted investments were not material for the period. Acquisition of East Sydney Day Hospital Pty Ltd On 6 August 2020, MH Solutions Investments Pty Ltd acquired a 49% shareholding in East Sydney Day Hospital Pty Ltd for $8.8 million, of which $4.4 million is payable 12 months following completion. An interest-bearing loan of $2.9 million was also advanced to East Sydney Day Hospital Pty Ltd on acquisition. Joint venture with Calvary Hospital During the period, Medibank, in a joint tender with Calvary Hospital, was determined to be the successful bidder on a tender for the South Australian Government’s “My Home Hospital” program. MH Investment Holdings Pty Limited has a 50% shareholding in the new entity, Calvary MHIH JV Pty Ltd, that was incorporated on 29 September 2020 for this program. The initial investment in this entity was $2.7 million. Note 13: Events occurring after the reporting period On 5 February 2021, Medibank announced the acquisition of 49% of the ordinary shares of Myhealth Medical Holdings Pty Ltd, which represents a 33.4% economic interest in the Myhealth Medical Group. Total expected consideration is $63 million, and completion is expected by 31 March 2021.

Directors’ declaration __________________________________________________________________________________________
______________________________________________________________________________________ 25
The directors declare that, in the opinion of the directors:
(a) the financial statements and notes set out on pages 5 to 24 are in accordance with the Corporations Act 2001, including:
i. giving a true and fair view of the Group’s financial position as at 31 December 2020 and of its
performance for the half-year ended on that date; and ii. complying with Australian Accounting Standards, the Corporations Regulations 2001 and other
mandatory professional reporting requirements; and
(b) there are reasonable grounds to believe that the Company will be able to pay its debts as and when they become due and payable.
This declaration is made in accordance with a resolution of the directors. On behalf of the Board,
Mike Wilkins AO Craig Drummond Chairman Chief Executive Officer 24 February 2021 Melbourne
PricewaterhouseCoopers, ABN 52 780 433 757 2 Riverside Quay, SOUTHBANK VIC 3006, GPO Box 1331, MELBOURNE VIC 3001 T: 61 3 8603 1000, F: 61 3 8603 1999, www.pwc.com.au Liability limited by a scheme approved under Professional Standards Legislation.
Independent auditor's review report to the members of Medibank Private Limited
Report on the half-year financial report Conclusion We have reviewed the half-year financial report of Medibank Private Limited (‘the Company’) and the entities it controlled during the half-year (together ‘the Group’), which comprises the consolidated statement of financial position as at 31 December 2020, the consolidated statement of comprehensive income, consolidated statement of changes in equity and consolidated statement of cash flows for the half-year ended on that date, significant accounting policies and explanatory notes and the directors' declaration.
Based on our review, which is not an audit, we have not become aware of any matter that makes us believe that the accompanying half-year financial report of Medibank Private Limited does not comply with the Corporations Act 2001 including:
1. giving a true and fair view of the Group's financial position as at 31 December 2020 and of its performance for the half-year ended on that date
2. complying with Accounting Standard AASB 134 Interim Financial Reporting and the Corporations Regulations 2001.
Basis for conclusion We conducted our review in accordance with ASRE 2410 Review of a Financial Report Performed by the Independent Auditor of the Entity (ASRE 2410). Our responsibilities are further described in the Auditor’s responsibilities for the review of the half-year financial report section of our report.
We are independent of the Group in accordance with the auditor independence requirements of the Corporations Act 2001 and the ethical requirements of the Accounting Professional & Ethical Standards Board’s APES 110 Code of Ethics for Professional Accountants (including Independence Standards) (the Code) that are relevant to our audit of the annual financial report in Australia. We have also fulfilled our other ethical responsibilities in accordance with the Code.
Responsibility of the directors for the half-year financial report The directors of the Company are responsible for the preparation of the half-year financial report that gives a true and fair view in accordance with Australian Accounting Standards and the Corporations Act 2001 and for such internal control as the directors determine is necessary to enable the preparation of the half-year financial report that gives a true and fair view and is free from material misstatement whether due to fraud or error.

Auditor's responsibility for the review of the half-year financial report Our responsibility is to express a conclusion on the half-year financial report based on our review. ASRE 2410 requires us to conclude whether we have become aware of any matter that makes us believe that the half-year financial report is not in accordance with the Corporations Act 2001 including giving a true and fair view of the Group's financial position as at 31 December 2020 and of its performance for the half-year ended on that date, and complying with Accounting Standard AASB 134 Interim Financial Reporting and the Corporations Regulations 2001.
A review of a half-year financial report consists of making enquiries, primarily of persons responsible for financial and accounting matters, and applying analytical and other review procedures. A review is substantially less in scope than an audit conducted in accordance with Australian Auditing Standards and consequently does not enable us to obtain assurance that we would become aware of all significant matters that might be identified in an audit. Accordingly, we do not express an audit opinion.
PricewaterhouseCoopers
CJ Heath Melbourne Partner
24 February 2021