˘ ˇ - european commission · on the impact of foreign r&d stocks and the presence of...
TRANSCRIPT

�
�
�
�
����������������� ���������
�����
����������� ������������� ���
���� ����� �������������
���� �������� ���� ��� ��� ����������
���������� ����������� ���� ��� ����
������� ��������
�
�
�
�
�
������������ ���������������������� ���� ������ ������������ ��� ���!"� ���#����������������$���������
�� %�&��'�� ���(���)� * � ����� �� ���(��� �(����+����� ���� �,��� ������ � �� ��� #������� ������+��%�'�
�������)��������� �,����� �� ��-������������ �������������������� ����,� ���#����������������)�.�� ����
���#������������������������������� �'��������,��,� ���������������������������,��� �������&�����
��'� ���������,� ����������� ��)�
�
�
�
������������������
� ����/�00���
��������������� ���������������������������������������� ����!�
#+����1�2��+�3+����� ���� 4��)������)���
���)1�536�7866996:3�
;�-1�536�7866993�:�
�
�
� ��������������
� ��1<<��)������)��<2���
�
�
�����87�7�
�
*��.��93�+76�9� ����!�
�
�
�
��(����"�����1�#����������������"������
�
=�#�������>��"������
�
������� �������� ����������(��� ���������������%�&��'�)�
�
�
�
?�&� ���� �1��������"��)���������"��)� ����!)��������� +����,,�� ���,�%�&��'��� ���(��'���,����;@*���
�&� ���� ��� � ��"� ���� A��%�'� B������ �� ������� �� �C@� �� *�(� ��� .�� ��<����"� ��� � ���������
�� ��)�
�
�������'���=�#�������>��������
�
�
�
�
�
�
�
�
����� �������������������������� ����������������������������������� ����� �����������(�����
�,�� ����/�00�������������� ���&� ��������������"����-����"�;�����?��(D�"�E�����%���"�B�� ���
�����+B� ��F+��� ����"����-�������%����@�����/�� ����� � ���#�����������������G���� ����������
�� ��H� �������� ������� ���(��� ��������� ������� �,� #�������� �� ���'��� "� >�(���� I� J����� ��
���-�����!H� #����� �� ������� >�(���� �� �,� ����'�!H������� /�(������� >�(���� K� �� ������ ��� ������ �����"�
����!)�
��������A��%�'�B��������������� ���C@���*�(� ��������������������������������������� �� ��
��� ������������������(� ����� �� �������� � �(������,� ���#���������� ��)�������������� ��
������� ����� �� �� ��� �������� ������ �"� ����� ���� ������� ����(� � �����+� �'�� ���� �,��� �� ������
��'���'� �'� ������� ������� ���)� ������ &��%�'� ������� ���� ��� � �� �������� �� �� �� ����� �������
����������� ��������� ,��'�"� '���� �������������� ��� � ��� ����� ����� �� ,��� ,�� ���� �����(��� �)�
�������������(�����'������������(��&��������)�
����� A��%�'� B����� ��� ������ �� ��� �� �- � �,� ��� *�� ����� ��������� �� *�(� ��� ��� ���'� ��
�������� *�*��**!��� �(� ���� �� �����2�� ������������ ���� ���#����������������L����� ������������ ���
���!� G� ���� ��� �� �"� M��& �� �� *�(� ��� �� ��� @���� ��� �� M������ ��������� �� *�(� ��� +�
@���� ��� ���"�B������@�(������ ��������� ��)�

The short-run effects of knowledge intensive greenfield FDI
on new domestic entry∗
Sara Amoroso†1 and Bettina Muller2
1Joint Research Centre (JRC) - European Commission2Centre for European Economic Research (ZEW)
March 21, 2017
Abstract
Existing evidence on the impact of foreign direct investment on domestic economies re-
mains ambiguous. Positive technology spillovers of foreign investment may be outweighed by
negative crowding out effect due to increased competition. In this paper, we employ a unique
country/sector-level data set to investigate the impact of what is considered the ‘best’ type
of foreign investment —greenfield knowledge intensive FDI— on domestic entry. Our results
suggest that, in the short run, this type of FDI is positively related to the entry rate in the host
country, if the domestic sector is either dynamic, or highly R&D intensive. These sectors may
be respectively characterized by lower entry costs, which encourage a ‘trial-and-error’ learning
business approach, and by a higher level of absorptive capacity which increases the chance of
technology transfer.
Keywords: foreign direct investments; knowledge spillovers; new firm entry
JEL classification L26; F21; O30
∗We are grateful to Georg Licht, Vivien Procher, Alex Coad, Giacomo Damioli, Daniel Vertesy, Cristiana Benedetti
Fasil, Al Link for many helpful comments on a previous version of the paper. Any remaining errors are ours alone.
The views expressed are purely those of the authors and may not in any circumstances be regarded as stating an
official position of the European Commission.†Corresponding author: [email protected]
1

1 Introduction
Foreign direct investment (FDI) is expected to transfer knowledge and technology, enhance pro-
ductivity, competitiveness, and ultimately boost long-run growth of the domestic economy. Many
studies have investigated what factors and government strategies attract such type of investment
(Guimon, 2009; Blonigen and Piger, 2014), and what the net benefits are. The empirical literature
is, however, far from arriving at a unanimous opinion on the net effects of FDI. In fact, the extent
to which FDI is enhancing growth depends on the degree of complementarity and substitution be-
tween foreign and domestic investment (De Mello, 1999; Munemo, 2014). On the one hand, FDI has
a complementary effect when the surge in foreign capital is associated with positive technological
spillovers that increase the productivity of local enterprises and stimulate domestic investment and
new local entry. Studies have shown that the extent to which an economy can reap the benefits from
these knowledge externalities depends on its available stock of human capital (Borensztein et al.,
1998; Bruno van Pottelsberghe de la Porterie, 2001). On the other hand, FDI has a substitution
effect when the foreign investment crowds out equal amounts of investment from domestic sources
by competing in product or financial markets. The increased competitive pressure might lead to
the exit of local businesses and to a slow replacement of new local entry.
Most of the relevant literature looks at the impact of FDI on proxies of economic growth
such as capital accumulation, total factor productivity (TFP) growth, and gross domestic product
(GDP) growth. More recently, an increasing number of studies deals with the relationship between
FDI (cross-border mergers and acquisitions, M&A) and new local firm’s entry or firm’s survival
(De Backer and Sleuwaegen, 2003; Ayyagari and Kosova, 2010; Munemo, 2014; Danakol et al.,
2016). The generation of new businesses - or entrepreneurship in general - offers a new perspective
to look at the effects of FDI on the host economy. The entry of new domestic firms is often seen as
a key driver of economic growth and job creation, and it has become a primary goal for policy mak-
ers. As with the relationship between FDI and other measures of growth, the interaction between
FDI and entrepreneurship is shaped by complex dynamics such as vertical and horizontal industry
spillovers (Markusen and Venables, 1999) and business start-up regulations (Munemo, 2014). Con-
sequently, the empirical literature provides ambiguous predictions about the relationship between
FDI and entrepreneurship.
In addition, FDI inflows have different impacts on the host countries depending on the types
of FDI such as greenfield FDI1 (new foreign firm) or cross-border M&A (foreign acquisition of
an existing domestic firm). The traditional view on the impacts of FDI suggests that greenfield
FDI is expected to increase the productivity, employment and capital formation of host countries,
while cross-border M&A only involves a change from local to foreign ownership of existing assets
and production capacity (Norback and Persson, 2005; Johnson et al., 2006; Ashraf et al., 2015).
Moreover, quite a few cases of cross-border M&As have been criticized as speculative funds seeking
only the arbitrage profits with no value-adding contribution such as technology transfer or new
1A greenfield investment is the creation of a subsidiary from scratch by non-resident investors (www.imf.com).
2

investment for technological innovation (Kim, 2009).
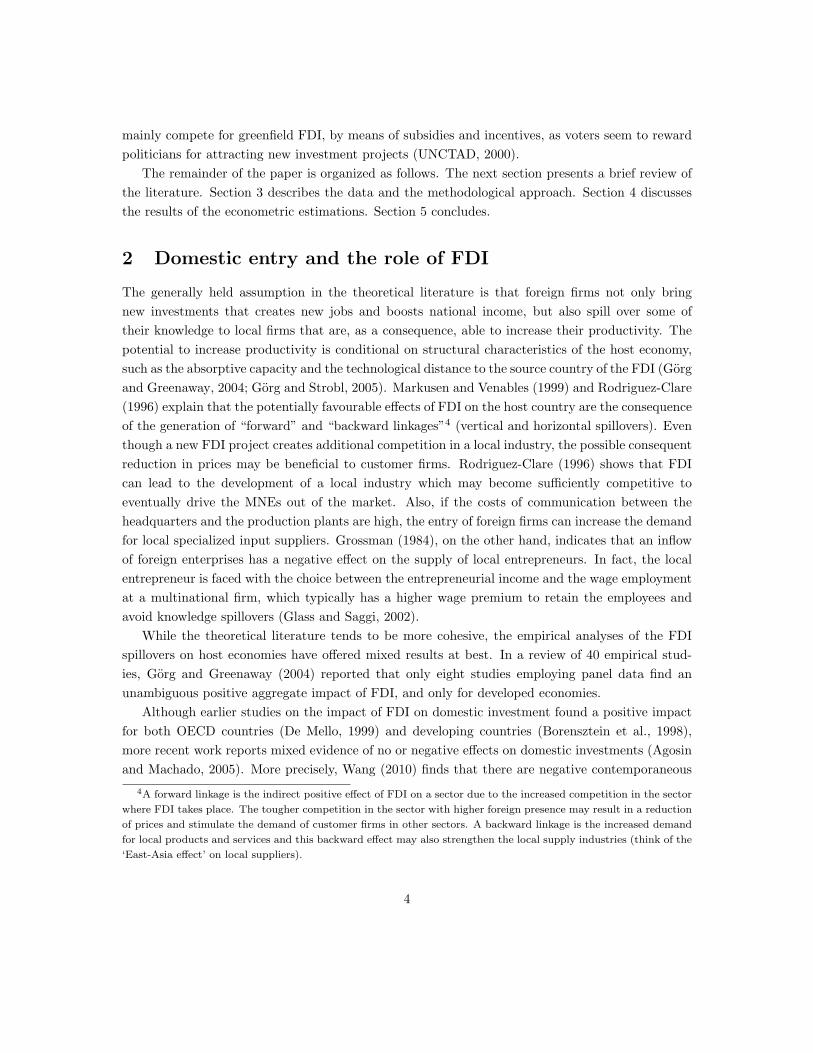
Due to the lack of reliable data on greenfield FDI, the contribution of this type of investment to
economic growth has been underinvestigated.2 However, greenfield FDI inflows in Europe account
for more than 40% of total FDI. Fig. 1 reports the values of both cross-border M&A and greenfield
investment projects inflows in Europe. The figure shows both the pre- and post-crisis fluctua-
tions and the recent slow growth recovery during 2014–2015. During the entire period 2003–2015,
greenfield FDI and cross-border M&A amounted to USD 2.2 and 2.8 trillion, respectively.
<Insert Fig. 1 about here>
In this paper, we use a novel data set on greenfield FDI from the fDi Market (www.fDimarkets.com)
online database3 that allows us to investigate the less explored (short-term) effects of greenfield FDI
on a specific dimension of the host economy, i.e. the entry of new domestic firms. We constructed
a unique sector/country-level panel data set by matching information on greenfield FDI projects
to domestic business birth rates from Eurostat and additional data on sector and country control
variables from the Organization for Economic Cooperation and Development (OECD).
Previous empirical findings could be viewed as inconclusive because they typically rely on overall
FDI inflows or only cross-border M&A. Our analysis complements the literature on the entry effects
of inward FDI, as we are the first to evaluate the effects of greenfield investment on new domestic
entry. Moreover, while the impact of FDI on firms and host economies has been largely studied,
knowledge about the impact of knowledge intensive investment is limited. Although knowledge
intensive activities such as R&D are still highly concentrated in headquarters, evidence shows that
knowledge intensive FDI has grown substantially and more rapidly than the other types of FDI in the
past decade (De Backer and Basri, 2008; Hall et al., 2011). In contrast with general FDI, evidence
on the impact of foreign R&D stocks and the presence of foreign-owned high-tech firms points
to a potential unambiguous positive influence on the domestic economy (Coe et al., 2009; Keller
and Yeaple, 2009). Indeed, more than other types of FDI, investments such as design and R&D
seem to favour the formation of specialized clusters and allow host locations to integrate in more
competitive global value chains (Cantwell and Piscitello, 2000; Carlsson, 2006). For this reason, we
narrow our focus on the effects of knowledge intensive greenfield FDI and investigate whether the
‘most desirable’ type of FDI (greenfield and knowledge intensive) is indeed a transmission channel
of knowledge and entrepreneurial skills or if, as with other types of foreign investment, there are
the opposing effects on the creation of domestic businesses found in the literature.
The main contribution of our paper consists in adding a new piece of evidence to the FDI-
entrepreneurship puzzle which may be extremely relevant from a policy perspective. Indeed, na-
tional governments have adopted several competitive strategies to attract greenfield FDI, and in
particular knowledge intensive investment. Blomstrom et al. (2003) observe that policymakers
2See Ashraf et al. (2016) for a recent review3fDi Markets is an online database maintained by fDi Intelligence, a division of the Financial Times Ltd.
3
mainly compete for greenfield FDI, by means of subsidies and incentives, as voters seem to reward
politicians for attracting new investment projects (UNCTAD, 2000).
The remainder of the paper is organized as follows. The next section presents a brief review of
the literature. Section 3 describes the data and the methodological approach. Section 4 discusses
the results of the econometric estimations. Section 5 concludes.
2 Domestic entry and the role of FDI
The generally held assumption in the theoretical literature is that foreign firms not only bring
new investments that creates new jobs and boosts national income, but also spill over some of
their knowledge to local firms that are, as a consequence, able to increase their productivity. The
potential to increase productivity is conditional on structural characteristics of the host economy,
such as the absorptive capacity and the technological distance to the source country of the FDI (Gorg
and Greenaway, 2004; Gorg and Strobl, 2005). Markusen and Venables (1999) and Rodriguez-Clare
(1996) explain that the potentially favourable effects of FDI on the host country are the consequence
of the generation of “forward” and “backward linkages”4 (vertical and horizontal spillovers). Even
though a new FDI project creates additional competition in a local industry, the possible consequent
reduction in prices may be beneficial to customer firms. Rodriguez-Clare (1996) shows that FDI
can lead to the development of a local industry which may become sufficiently competitive to
eventually drive the MNEs out of the market. Also, if the costs of communication between the
headquarters and the production plants are high, the entry of foreign firms can increase the demand
for local specialized input suppliers. Grossman (1984), on the other hand, indicates that an inflow
of foreign enterprises has a negative effect on the supply of local entrepreneurs. In fact, the local
entrepreneur is faced with the choice between the entrepreneurial income and the wage employment
at a multinational firm, which typically has a higher wage premium to retain the employees and
avoid knowledge spillovers (Glass and Saggi, 2002).
While the theoretical literature tends to be more cohesive, the empirical analyses of the FDI
spillovers on host economies have offered mixed results at best. In a review of 40 empirical stud-
ies, Gorg and Greenaway (2004) reported that only eight studies employing panel data find an
unambiguous positive aggregate impact of FDI, and only for developed economies.
Although earlier studies on the impact of FDI on domestic investment found a positive impact
for both OECD countries (De Mello, 1999) and developing countries (Borensztein et al., 1998),
more recent work reports mixed evidence of no or negative effects on domestic investments (Agosin
and Machado, 2005). More precisely, Wang (2010) finds that there are negative contemporaneous
4A forward linkage is the indirect positive effect of FDI on a sector due to the increased competition in the sector
where FDI takes place. The tougher competition in the sector with higher foreign presence may result in a reduction
of prices and stimulate the demand of customer firms in other sectors. A backward linkage is the increased demand
for local products and services and this backward effect may also strengthen the local supply industries (think of the
‘East-Asia effect’ on local suppliers).
4

effects on the ratio of gross fixed capital formation to GDP, especially among developed economies,
whereas he finds positive cumulative effects for developing countries. Munemo (2014) investigates
the impact of FDI and entry regulation on domestic investment and shows that FDI crowds out
domestic investment if the entry costs are too high.
Other studies have investigated the impact of foreign investment on local firms’ productivity
using firm-level data. Results point, in general, to the effects of negative spillovers on the domes-
tic firms for transition economies (Konings, 2001; Javorcik and Spatareanu, 2008; Djankov and
Hoekman, 2000)5, Southern European economies(Barbosa and Eiriz, 2009; Garcıa et al., 2013),
and developing economies (Aitken and Harrison, 1999). However, the negative firm-level effect
disregards the fact that technology transfer is a process that requires time and learning resources.
Liu (2008) finds that an increase in FDI lowers the short-term productivity level but raises the
long-term productivity growth rate of domestic Chinese firms in the same industry. Furthermore,
the effect of FDI may differ between firms. As Iacovone et al. (2015) show for the case of Walmart
entering the Mexican market that firms in the lowest quartile of the size distribution are affected
negatively, while larger local firms may benefit from FDI.
The literature on firm entry/exit and occupational choice also deals with the impact of FDI
on domestic economies, and it points to both positive and negative effects of the foreign presence
on local economies. Extending Jovanovic’s (1994) model of firm formation to allow for entry of
foreign firms, the study of De Backer and Sleuwaegen (2003) predicts that the foreign firms crowd
out local ventures. They argue that since MNEs pay higher wages and skim the labour market, the
stronger rise in wages than in entrepreneurial income stimulates people to become workers instead of
entrepreneurs. However, their empirical results also suggest that “the importance of positive long-
term structural effects - learning, demonstration, networking and linkage effects- between foreign
and domestic firms can moderate or even reverse crowding out effects” (De Backer and Sleuwaegen,
2003, pp. 16-17). Similar results are found in the study of Zajc Kejzar (2011) who tests the
effects of greenfield FDI and cross-border M&A and finds that only greenfield FDI decrease the
survival probability of Slovenian firms. However, the crowding-out effect diminishes as the export
propensity of local firms increases, while the presence of foreign affiliates reduces the exit probability
of their downstream local customers, via positive forward linkages. Ferragina and Mazzotta (2014)
investigate the effects of forward and backward linkages between foreign and Italian firms and find
no clear evidence of an impact of foreign presence on the exit of local firms. They do, however,
find that FDI reduces the probability of exit of highly productive firms or of firms in medium and
low-tech sectors. These results may be explained by the differences in absorptive capacity.
The study of Burke et al. (2008) develops an additional conceptual framework to explain the
contrasting positive industrial spillovers and the crowding out effects. They hypothesize that the
impact of FDI varies between dynamic and static industries. Dynamic markets, typically char-
5In contrast, Javorcik (2004) finds positive FDI productivity spillovers via linkages with local suppliers in upstream
sectors for Lithuanian firms.
5

acterized by a high rate of firm churn, are more innovative and competitive. In these markets,
foreign firms are more likely to displace domestic firms, as foreign companies are more innovative
and have more competitive technologies. In contrast, static markets are associated with later stages
of innovation diffusion. In static industries domestic firms are more imitative and have more scope
to benefit from the foreign technology spillovers.
More recently, a growing number of studies have recognized the importance of exploring the
relationship between FDI and entrepreneurship, as this may drive economic growth (Acs, 2006;
Fritsch and Wyrwich, 2016). According to the knowledge spillover theory of entrepreneurship
(Acs et al., 2009, 2013), the creation of new firms also provides a ‘conduit’ with which knowledge
brought into the country by FDI is transferred to the local economy. By comparing Ireland and
Wales, (Acs et al., 2012) hypothesise that, depending on the type of FDI and the accompanying
local entrepreneurship policies, FDI may increase knowledge-based entrepreneurship in a country.
On the one hand, studies that have focused on one single country find evidence of positive
spillovers from FDI on domestic entrepreneurship (Liu et al., 2014; Anwar and Sun, 2015 for China;
Ayyagari and Kosova, 2010 for the Czech Republic; Barrios et al., 2005 for Ireland). Similar to
Barrios et al. (2005), Lee et al. (2014) show that the positive effect only holds up to a certain degree
of FDI intensity in a region. Beyond a certain threshold, local entrepreneurship tends to diminish
because of too high competition and entry costs and a comparably high attractiveness of foreign
firms as workplaces for potential entrepreneurs.
On the other hand, results from cross-country/industry analyses point to the opposite direction.
In particular, Albulescu and Tamasila (2015) does not find any association between inward or
outward FDI on entrepreneurial activity in 16 European countries. Colantone and Sleuwaegen
(2010), using data on eight countries from the “Business Demography Statistics” database by
Eurostat, find a strong displacement exit and a slow replacement entry due to trade exposure.
Pathak et al. (2015) analyse cross-country Global Entrepreneurship Monitor (GEM) survey data
on entrepreneurs from 38 countries and find that inbound FDI is negatively associated with five
types of entrepreneurship (nascent, new, early-stage, established, and high-growth). Similarly,
Danakol et al. (2016), find a negative impact of M&A on three different types of entrepreneurship,
controlling for corruption and cultural characteristics.
The few existing cross-country studies suggest a neutral or negative relation between inward
FDI and domestic entrepreneurship; however, we still do not know whether we could generalize and
conclude that all FDI inflows have the same impact on the formation of new local businesses.
To address this issue, our study contributes to this latter emerging literature with the analysis of
the role of a specific type of FDI, namely the greenfield knowledge intensive FDI. Greenfield FDI,
differently from cross-border M&A, is considered to increase the productivity of domestic firms,
and knowledge intensive FDI activities, or FDI activities in knowledge intensive sectors (Antonietti
et al., 2015), are regarded as the investment with the highest potential for knowledge spillovers for
both international investors and local competitors, universities and research institutes (Castellani
6

and Pieri, 2014; Castellani et al., 2014).
3 Data and descriptive statistics
This section describes our dataset (Section 3.1), the variables used (Section 3.2) and descriptive
statistics (Section 3.3).
3.1 Dataset construction
For our empirical analysis, we created a data set from three data sources which allow us to analyse
the impact of knowledge intensive greenfield FDI on business entry in the host country for the first
time: the fDI Markets database of the Financial Times, the Structural Business Statistics (SBS) of
Eurostat, and industry level information from OECD databases.
The fDi Markets is an on-line database maintained by fDi Intelligence, a division of the Fi-
nancial Times Ltd. Since 2003, fDi Intelligence collects available information from company data
and media sources on greenfield foreign direct investments and monitors cross-border investments
covering all sectors and countries worldwide. Data from the fDi Markets database are used by the
UNCTAD to present global investment trends in the World Investment Reports series6 and have
been used in publications by the Economist Intelligence Unit and in recent academic research (e.g.
Crescenzi et al., 2013; Paniagua and Sapena, 2014; Castellani and Pieri, 2014; Castellani et al.,
2014; Amoroso et al., 2015; Antonietti et al., 2015). The data are provided at the project level
and includes information on the project date (the month when the FDI project started), the name
of the investing company, the source and destination addresses of investment at the city level, the
estimated amount of capital invested, the industry sector in which the investment takes place, and
the type of activity. The latter covers five different classes of knowledge intensive activities which
are design, development, and testing; education and training; headquarters activities7; information
and communication technologies and Internet infrastructure; and research and development.
Our second data source is the structural business statistics (SBS). The SBS is a database on
firm dynamics maintained by Eurostat, which covers, among others, the number of firm births, the
number of firm closures and the number of active enterprises in the EU member states. The data are
available for the EU-28 countries since their respective entry into the EU. As with all other statistics
from Eurostat, the data for the SBS are assembled by statistical agencies of member states and
originate in the national business registers. The national statistical offices collect the data based on
internationally harmonised rules for data collection and preparation. The data are available at the
6http://unctad.org/en/pages/DIAE/World%20Investment%20Report/WIR-Series.aspx7Headquarter activities in MNEs are high-skill activities such as R&D, marketing and management (Bandick
et al., 2014). Although the decision to open a headquarter abroad is mainly driven by low corporate taxes, HQs
are located in areas with similar industry specialization and with high levels of business services, which are typically
knowledge intensive (Falk, 2012).
7

sector level. Based on this information firms can be classified into different subgroups according to
their sector affiliation.
In order to control for factors that are found to be relevant for the formation of new firms at
the sector level we make use of two databases from the OECD. The first is the OECD Main Science
and Technology Indicators database (OECD-MSTI) which provides information on the activities of
the OECD countries in the field of science and technology such as R&D expenditures. The second
is the database for Structural Analysis (STAN) which includes measures of output and inputs at
the industry level. From this database, we extract the value added, the gross operating surplus
and mixed income, the gross capital stock, the labour costs, the number of employees and the
production value.
Our data sample covers the period between 2005 and 2012. The focus on this period is mainly due
to the availability of the relevant data at the time of the analysis. Because we lag our independent
variables by one year in order to avoid simultaneity bias, the data on the cross-border greenfield
projects from the fDi Markets database as well as the aggregate production and R&D statistics
from the OECD cover the period 2004–2011.
Matching and integrating heterogenenous data sources allows us to analyse the impact of knowl-
edge intensive greenfield FDI on the local entrepreneurship; it presents, however, several challenges.
One above all is the very small matched sample size (45 to 88 observations) deriving from the dif-
ferent patterns of missing observations across the various data sets. To mitigate this problem, we
decided to impute the missing values of the total number of active firms in the SBS8 (needed to
compute both foreign and domestic entry rates). To impute the number of total active firms, we
assume that the stock of firms has grown at a constant rate between 2004 and 2012. We calculate
the average growth rate with the available data points, and then extrapolate the time series back-
wards. We checked whether this data manipulation affects our results by comparing the outcomes
of our estimations with and without the imputed values. We do not detect any qualitative differ-
ences.9 For the analyses, we consider all the observations for which data on the full set of variables
(dependent and independent) is available. The resulting sample of 454 observations covers 10 EU
countries and 20 industries.
3.2 Variables specification
Table 1 shows the variables used in the analysis including their data sources. Our dependent
variable is what we call the ’domestic entry rate’ which is defined as the number of births of
enterprises relative to the number of active enterprises in a given year and sector (Ayyagari and
Kosova, 2010; Kosova, 2010). SBS data on enterprise births refer to the birth of firms that are
8Data from SBS is still under construction. The values for the number of active firms are absent for the earlier
years of our period of observation. This, in turn, is mainly due to the notorious difficulty in determining the number
of firm exits which are needed for the calculation of the stock of the firms.9The results of the comparison are available upon request from the authors.
8

not foreign-controlled.10 Dividing the number of births by the number of active firms makes the
number of firm births comparable between economies of different size.
<Insert Table 1 about here>
Our focal right-hand-side variable is the foreign entry rate; it is defined similarly to other studies
(De Backer and Sleuwaegen, 2003; Colantone and Sleuwaegen, 2010; Zajc Kejzar, 2011) as ratio
between the number of knowledge intensive greenfield FDI projects from the fDi Markets database
and the number of active firms in the host country, for each year.
We include a set of control variables that have been shown to be relevant for the formation of new
firms at the firm level. In particular, we control for the R&D intensity of the sectors. In particular,
we group sectors into low-tech and medium/high-tech sectors to analyse whether the potential
knowledge spillovers differ between the levels of R&D of sectors. For this grouping we applied a
classification from the OECD (see Table 2). R&D provides a source of new ideas that entrepreneurial
businesses can transform into new products —i.e. R&D opens up new opportunities. Wennekers
et al. (2002) report evidence that technology change is one of the main reasons for expanded
entrepreneurial opportunities. In addition, Audretsch et al. (2008) show that a high regional R&D
activity and proximity to research institutions such as universities increase the opportunities to
start new knowledge-based businesses.
<Insert Table 2 about here>
Moreover, researchers studying domestic entry and exit argue that firm entry is the response
to profitable opportunities that depend on price-cost margins (profitability) and on the economic
growth of the domestic industry (Hause and Du Rietz, 1984; Shapiro and Khemani, 1987; Geroski,
1989; De Backer and Sleuwaegen, 2003). Past profitability signals profitable opportunities to do-
mestic entrepreneurs and a rapid growth of the sectoral GDP of the domestic market indicates a
large market potential which leads to a high entry rate of firms. The sectoral growth rate also
allows us to control for other sector specific cyclical effects which may impact entry. We therefore
include profit over sales as an approximation of the price-cost margin and the GDP growth at the
sectoral level in the regression.
Theoretical and empirical models have shown that entry into a market can be deterred in the
presence of high entry costs in the form of capital requirements (Khemani and Shapiro, 1986). To
capture this effect we control for the capital intensity of an industry in the regressions.
In addition, we follow the idea of Burke et al. (2008) and analyse differences between dynamic
and static industries. For this, we group the industries by their firm churn rate. The churn rate
is commonly defined as the number of firm entries plus exits relative to the stock of firms. We
calculate the firm churn rate using the number of firm births, firm deaths and active firms provided
10http://ec.europa.eu/eurostat/statistics-explained/index.php/Structural business statistics overview
9

by Eurostat and define an industry to be dynamic (static) if the firm churn rate is above (below)
the threshold value of 15% across all industries.
Overall, we expect the coefficients of our control variables to be consistent with the findings
of the literature, i.e. new firms enter in rapidly growing industries, with relatively high price-cost
margins and low entry costs, and where there is a relatively high level of technological opportunity
or R&D intensity (Acs and Audretsch, 1989).
3.3 Descriptive statistics
Table 3 shows summary statistics of our sample. The average domestic firm birth rate is 7.12%,
while the number of knowledge intensive greenfield foreign projects is 0.02%. Although having a
comparatively low average value, the foreign entry rate is among the variables with the highest
dispersion. The coefficient of variation (sd/mean) of this variable is 4 which makes it the second
most dispersed variable. The variable with the highest dispersion is GDP growth (coefficient of
variation 17.12). The coefficient of variation of the other variables ranges between 0.52 (firm churn
rate) and 1.19 (capital intensity).
<Insert Table 3 about here>
Fig. 2 reports the averages over years and sectors of domestic and foreign entry rates as well
as firm churn rate. The period of the European financial crisis 2007/2008 visually appears to
have changed the trend in the series of all three variables. Both domestic entry and firm churn
rate increased noticeably after these years. In contrast, the entry rate of new knowledge intensive
foreign firms significantly went down in the years after the crisis.
<Insert Figure 2 about here>
Table 4 reports the averages over years and sectors of domestic and foreign entry rates, as
well as the sectoral churn rate by country. There is observed variation among the countries. The
domestic entry rate varies from 3.92% in Belgium to 15.04% in Estonia. Austria, Belgium, and
the Netherlands have the highest inflows of knowledge intensive greenfield FDI projects (4 per 10
thousand active firm in the period of observation). The firm churn rate varies from 6.49% for
Belgium to 27.84% for Estonia.
<Insert Table 4 about here>
Table 5 displays and tests the difference in the means of the variables by R&D level and by firm
churn rate. The domestic entry rates do not differ significantly between medium/high-tech and
low-tech sectors. However, the foreign entry rates are higher in medium/high-tech sectors than in
low-tech sectors. Also, as expected, the price-cost margin, the capital intensity, and the sectoral
GDP growth are higher in the more technology intensive sectors.
10

Comparing static and dynamic sectors, domestic entry is higher in dynamic sectors than in static
ones. In contrast, the foreign entry rate is lower in dynamic sectors. This is perhaps a consequence
of the fact that multinational companies seem to be concentrated in countries with a lower firm
churn rate (see Table 4). There is no significant difference in the price-cost margin, capital intensity,
and GDP growth between static and dynamic sectors.
<Insert Table 5 about here>
Table 6 displays the correlation coefficients for all the variables used in the empirical speci-
fication. Domestic entry is negatively correlated with foreign entry rates and (highly) positively
correlated with firm turnover, profitability (price-cost margin), and capital intensity. Foreign entry
in knowledge intensive activities is positively correlated with higher level of technological capa-
bilities, and negatively correlated with the level of firm churn rate, which formally supports the
observation from Table 4 that knowledge intensive FDI projects tend to be carried out in countries
with low firm churn.
<Insert Table 6 about here>
4 Econometric analysis and results
4.1 Empirical model
To investigate the impact of greenfield foreign entry on domestic entry, we regress the domestic
entry rate of sector j of country i at time t on the past value of domestic entry rate, knowledge
intensive greenfield foreign entry rate and a set of control variables, which have been identified by
the literature as key determinants of entry. The empirical model is as follows
DomEntryijt = α+ βDomEntryijt−1 + γForEntryijt−1 + δ′Xijt−1 + ϵijt, (1)
where X is a vector of lagged control variables at sector-level, including the growth rate of gross
domestic product (∆gdp), profitability (pcm), capital intensity (CapInt), the firms churn rate
dummy (Dyn), and the level of technology (Tech). ϵijt is a composite error term which includes
year, country and sector fixed effects, and a remainder error assumed to follow an iid normal
distribution. The coefficient β measures the impact of greenfield foreign entry rate (or the relative
foreign entry rate) on the domestic entry rate.
Given the ambiguous results found in the literature concerning the sign of the impact of foreign
entry, we test whether this coefficient vary by sector classification. In particular, following some of
the predictions in the literature, we interact the greenfield foreign entry variable with:
- the churn rate dummy, Dyn, a dummy taking value of one if the sector has a churn rate above
15% (dynamic sector), and zero otherwise (static sector)
11

- the technological classification of the sector, Tech, a dummy taking value of 1 if the sector is
a medium/high-tech one, zero otherwise
4.2 Estimation technique
Our data set is an unbalanced panel with observations clustered by country, sector and year. Our
regression analysis is based on generalized least square (GLS) accounting for panel heteroskedasticity
(the variance varies for each country-sector pair). All control variables are lagged by one year to
potentially correct for issues of reverse causality. Nonetheless, the endogeneity deriving from the
characteristics of the host market that affect the choice of FDI location and type of investment
may yield inconsistent results. Fig. 2 reports both new domestic and new foreign greenfield entry
rates, and the firm churn rate. While the churn rate and the domestic entry rate follow a similar
increasing trend over time, the greenfield investments seem to have dramatically dropped after the
crisis. However, there could be unobserved confounders (omitted variables) that are correlated with
both the domestic entry rate and the foreign entry rate (e.g. government regulations, labour market
arrangements, macroeconomic stability, etc.). Moreover,
We account for these potential endogeneity biases and rely on the instrumental variable ap-
proach. Namely, we use a 2-stage least squares (2SLS) estimator. In line with Danakol et al.
(2016), we use the weighted average geographical distance11 between source and host country as
instrument, as this is a priori not linked to the domestic entry rate, while it largely influences the
location decisions of foreign affiliates (Carr et al., 2001). In the first stage the foreign entry rate is
regressed on the weighted distance, country, sector and year fixed effects, while in the second stage,
we estimate eq. 1 where we replace the lagged foreign entry rate with the predicted values of the
first stage.
4.3 Estimation results
Table 7 presents the estimation results of eq. (1). The first column (1) reports the estimated
regression coefficients of a simple specification where the domestic entry depends only on past
greenfield foreign entry rate and country, sector, and year dummies. The coefficient associated with
past foreign investment is positive and significant. A one percentage point increase in the foreign
entry rate corresponds to a 3 percent increase in the domestic entry rate.
<Insert Table 7 about here>
Column 2 displays the regression coefficients from a full specification that takes into account
the past domestic new entry rate, sectoral knowledge capabilities, physical capital intensity, and
11We use foreign capital expenditure to weight the geographical distance. Following a common practice in the
literature, we take the great circle distance between nations’ capital cities where a sphere is used to approximate the
shape of the earth.
12

the profitability and the growth of sectors’ output. The marginal effect of past foreign investment
in knowledge intensive activities on new domestic entry is not significant when taking these factors
into consideration.
On the one hand, our results differ from those of Colantone and Sleuwaegen (2010) and De Backer
and Sleuwaegen (2003) who find entry-discouraging effects due to increased trade exposure in man-
ufacturing industries of eight European countries. On the other hand, results for the estimated
coefficients of the control variables confirm the empirical and theoretical findings of the relevant
literature.
The coefficient measuring the impact of industry capital intensity (a proxy for potential entry
costs) on entry rate has the expected negative sign. In particular, while capital intensity affects
positively the probability of firms’ survival (Doms et al., 1995; Bernard and Jensen, 2002), the role of
capital intensity as a barrier to entry is well recognized (Khemani and Shapiro, 1986) and observed
in the empirical literature (Scarpetta et al., 2002; De Backer and Sleuwaegen, 2003; Feizpour and
Moradi, 2014). Anwar and Sun (2015) control for capital intensity at firm level rather than industry
level and find contrasting results. Industry price-cost margin and gross product growth have a
modest positive effect on domestic entry rate. A 10% increase in the lagged profit margin or past
industry growth is associated with 0.4 or 0.2% increase in the entry rate, respectively.
In columns (3), (4) and (5) we include the interaction between knowledge intensive foreign entry
and the firm churn rate dummy (3), the technological level of the sector (4), and both (5). When
interacting the knowledge intensive foreign entry with the business churn dummy, we find that as
foreign entry rate increases, the domestic entry rate of dynamic sectors increases 8% faster than that
of static sectors. Higher industry turnover is typically associated with lower barriers to business.
This, in turn, attracts both domestic and foreign businesses. Contrarily, static industries may be
characterized by older incumbents and higher entry costs. In these industries, MNEs have larger
capital to face the barriers to entry and would eventually discourage the entry of local businesses.
Our results contrast the “surprising” positive effects in static industries found by Burke et al. (2008,
p. 403); however, their study takes into consideration the survival of new firms, while we look at the
formation of new domestic businesses. Also, they rely on firm-level data for just one country, UK,
and proxy the foreign presence using the share of employment by MNEs, without distinguishing
between the knowledge intensity of their activities.
In column (4), we include the interaction of knowledge intensive foreign entry rate and technology
intensity.12 In line with the predictions of Acs et al. (2013), we find that the impact of foreign entry
on domestic entry depends on the level of technology intensity: new foreign entry in high- and
medium-tech sectors yields a 14% faster increase in the domestic entry rate (compared to low-tech
sectors). Indeed, higher technological capabilities increase the level of absorptive capacity and
the pool of unexplored knowledge, which is then commercialized and transformed into economic
12The official classification adopted by the Eurostat http://ec.europa.eu/eurostat based on the average R&D
intensities of the manufacturing and service sectors. So, for example, the sector of rubber and plastic products is
defined as medium-low-tech for all years and all countries.
13

knowledge (new products and services). Different from the specification in column (3), the marginal
effect of the foreign entry rate is negative and statistically significant (-3%). Anwar and Sun
(2015) do not find any evidence of such positive R&D-entry relationship, however their measure of
technological intensity is at the firm-level. Although the theoretical argument of Audretsch et al.
(2005) and Acs et al. (2013) —regional knowledge capacity attracts FDI and results in knowledge
intensive entrepreneurship— could apply also to firm-level R&D, the pool of latent entrepreneurs
may benefit from the sectoral level of R&D. According to Feldman (1999), sectoral R&D is a proxy
for the quality of human capital in the form of scientific and technical expertise. In addition, the
level of sectoral R&D intensity accounts for intra-sectoral knowledge spillovers which may contribute
to create the right climate to enable potential entrepreneurs to spot the profit opportunity and start
a business.
These results are also in line with those of Gorg and Strobl (2005), who argue that firms in high-
tech sectors have a greater absorptive capacity and are able to benefit from the foreign technology
spillovers, but they contrast with the results of Ferragina and Mazzotta (2014) who find that firms
in high-tech sectors do not benefit from horizontal FDI while in low- and medium-tech sectors
they do. Indeed, the presence of multinationals in high-tech sectors may increase the competitive
pressure for domestic firms causing a costly reallocation of economic resources within and across
sectors.
Finally, in column (5), we consider both the interactions with the sectoral turnover and the
technological intensity. The results confirm that the new foreign knowledge intensive entry corre-
sponds to 6.5 and 16% faster new domestic entry rates in dynamic and high/medium-tech sectors,
respectively. The marginal effect of greenfield FDI is non-statistically significant.
Table 8 reports the results from 2SLS estimations, which point to a lack of association between
new foreign and domestic entry rates. Below the estimation results, we present the results from
the first stage, where the variable ForEntry is regressed on the logarithm (and squared logarithm)
of the weighted geographical distance between the investing origin countries and the destination
country. We also report a set of test statistics to assess the goodness of fit (F-statistic and R2), the
endogeneity of the foreign entry rate, and the relevance of the instruments used (test of underiden-
tification). Using the 2SLS approach, differently from Danakol et al. (2016), we do not find any
significant effect of the greenfield foreign entry rate on the domestic entry rate. In addition, the
hypothesis of endogeneity of the knowledge intensive gFDI is always rejected, making the feasible
GLS our preferred estimator for this empirical model.
<Insert Table 8 about here>
5 Discussion and conclusions
Foreign direct investment (FDI) is an essential part of an international economic system and poten-
tially a major catalyst for economic development. The catalytic potential arises from the fact that
14

FDI is usually accompanied with a transfer of technology and knowledge from the country of origin
to the host country. In particular, this applies to knowledge intensive FDI where R&D activities
are outsourced to another country than the country of the headquarter.
Yet, the benefits from FDI do not accrue automatically and evenly across countries and sectors.
The main reason is that most of the knowledge is not codified but tacit. Thus, some transforma-
tive mechanism is needed to ensure that the knowledge transfer actually takes place. One such
mechanism is the start-up of new firms. Individuals might be inspired to new business ideas by the
knowledge existing in foreign firms and set up a new firm thereby transferring the knowledge from
the foreign firm to the local economy.
In this paper, we constructed a unique country/sector-level panel data set to analyse how knowl-
edge intensive greenfield FDI affects domestic economy, looking at the impact on the generation
of new local businesses. Our main contribution to the literature on FDI spillovers is that we ex-
plore the empirically underinvestigated relationship between greenfield FDI and domestic entry.
Compared to previous studies that rely on the largely available information on M&A, we build our
analyses on the less explored data on greenfield knowledge intensive FDI, which is considered to be
the ‘best’ type of FDI with the highest potential of positive effects for the host country.
We find that the short-run impact of this type of FDI on domestic entrepreneurship is generally
positive as one would expect from greenfield knowledge intensive investment, and that the benefits
from this type foreign entry are larger in more dynamic and technologically intensive sectors, than
in static and low-tech sectors. The observed positive effects for dynamic and high- and medium-tech
sectors validate some of the hypotheses advanced by the literature on knowledge spillover theory
of entrepreneurship (Audretsch et al., 2006; Acs et al., 2012), and resonate with similar empirical
studies (Liu et al., 2014; Antonietti et al., 2015), as in these sectors knowledge may spill over faster.
The knowledge transfer process, however, does not exclude the possibility to observe some initial
negative effects on the domestic entry rate, due to adjustments. Potential entrepreneurs have to
first learn about new business opportunities resulting from the FDI project by engaging with this
new source of knowledge.
Moreover, as Acs et al. (2013) argue, for knowledge spillovers to take place, linkages to the
source of knowledge are necessary. This is due to the tacit character of most of the knowledge.
Individuals have to enter into direct exchange with knowledge carriers to take up new insights.
Two possible ways in which this can occur are if individuals from the domestic workforce become
employees in the affiliates of the foreign firm or if they serve as business partners (Fu, 2012). In
both ways, the process of knowledge spillover takes time.
Although we are able to make an important step forward to analyse the effect of the most
desirable type of FDI, our analysis has its limitations, due to the lack of appropriate data. First,
we consider only the short-run effect of knowledge intensive greenfield FDI on the local start-up
rate. Admittedly, knowledge spillovers from FDI to the local economy is a complex matter which is
not fully captured by considering only one year lag in the regressions. However, testing the effects of
15

greenfield FDI with a longer lag specification would result in a smaller sample size. Second, we only
estimate the direct effect of FDI and do not consider indirect effects through backward and forward
linkages, although these have been shown to be relevant in the literature. In fact, we only have
quite rough information on the sector in which the FDI occurs (at most on the two-digit level). This
implies that we cannot distinguish between vertical and horizontal spillovers, and therefore cannot
map the linkage structure. Third, as discussed in Section 3, we imputed the data on the stock of
active firms. We tested the importance of the bias from imputing the total number of active firms
and we found it to be negligible. Fourth, because of the low number of full observations available,
we use a parsimonious regression model. In particular, we only included the capital intensity to
capture entry costs. There are, of course, other factors that influence domestic entry, such as red
tape or institutional factors (e.g., corruption, the degree of enforcement of property rights, etc.).
However, like other studies before ours, we assume these factors are captured by country and sector
dummies.
Nevertheless, we think that some policy implications can be derived from our results. Based on
the positive spillovers expected from greenfield or knowledge intensive foreign investment, national
governments have adopted several competitive strategies to attract FDI, often racing to bottom of
labor and fiscal standards (Javorcik, 2004; Olney, 2013). While technologies and knowledge may
eventually spill over on the host economy, policy makers should also consider that, in the short run,
these spillovers mainly concern the entrepreneurial activity in high-tech and dynamic sectors. In
terms of industrial policy, this suggests that the focus on leading sectors —where both incumbent
and younger entrepreneurial firms have representatives— requires an alignment of industrial and
firm-level policies. New industrial policies (e.g., targeted policies in advanced manufacturing, green
economy, etc.) can be seen as public sector interventions aimed at changing the distribution of
resources across economic sectors, while firm-level policies play an important role in reallocating
resources to market segments that might become more productive. In this regard, in addition to
generic enterprise policies (e.g., strengthening innovation framework, improve access to risk and
human capital, etc.), a specific policy for leading sectors that focuses on the interaction between
national and local governments, research institutes, and young innovative enterprises, may increase
the return to public funds to R&D.
Further research efforts should explore the long-run effects of knowledge intensive FDI, the
role of country-specific institutions, and the type of entrepreneurship that is affected by foreign
investment. Our future research agenda therefore includes the analysis of greenfield FDI and its
impact on different types of start-ups, controlling for information on knowledge infrastructure at
the regional level.
16

References
Acs, Z. (2006). How is entrepreneurship good for economic growth? Innovations, 1(1):97–107.
Acs, Z. J. and Audretsch, D. B. (1989). Small-firm entry in US manufacturing. Economica,
56(222):255–265.
Acs, Z. J., Audretsch, D. B., and Lehmann, E. E. (2013). The knowledge spillover theory of
entrepreneurship. Small Business Economics, 41(4):757–774.
Acs, Z. J., Braunerhjelm, P., Audretsch, D. B., and Carlsson, B. (2009). The knowledge spillover
theory of entrepreneurship. Small Business Economics, 32(1):15–30.
Acs, Z. J., Brooksbank, D. J., O’Gorman, C., Pickernell, D., and Terjesen, S. (2012). The Knowledge
Spillover Theory of Entrepreneurship: An Application to Foreign Direct Investment. International
Journal of Entrepreneurship and Small Business, 15(2):237–261.
Agosin, M. and Machado, R. (2005). Foreign Investment in Developing Countries: Does it Crowd
in Domestic Investment? Oxford Development Studies, 33(2):149–162.
Aitken, B. J. and Harrison, A. E. (1999). Do domestic firms benefit from direct foreign investment?
evidence from venezuela. American Economic Review, 89(3):605–618.
Albulescu, C. T. and Tamasila, M. (2015). Exploring the role of fdi in enhancing the entrepreneurial
activity in europe: a panel data analysis. International Entrepreneurship and Management Jour-
nal, pages 1–29.
Amoroso, S., Dosso, M., and Moncada-Paterno-Castello, P. (2015). The impact of skill endowments
and collective bargaining on knowledge-intensive greenfield FDI. Working Papers on Corporate
R&D and Innovation 2015-08, Joint Research Centre.
Antonietti, R., Bronzini, R., and Cainelli, G. (2015). Inward greenfield fdi and innovation. Economia
e Politica Industriale, 42(1):93–116.
Anwar, S. and Sun, S. (2015). Foreign direct investment in R&D and domestic entrepreneurship in
China’s manufacturing industries. Applied Economics, (ahead-of-print):1–19.
Ashraf, A., Herzer, D., and Nunnenkamp, P. (2015). The effects of greenfield FDI and cross-border
M&As on total factor productivity. The World Economy.
Ashraf, A., Herzer, D., and Nunnenkamp, P. (2016). The Effects of Greenfield FDI and Cross-border
M&As on Total Factor Productivity. The World Economy, 39(11):1728–1755.
Audretsch, D. B., Bonte, W., and Keilbach, M. (2008). Entrepreneurship capital and its impact on
knowledge diffusion and economic performance. Journal of Business Venturing, 23(6):687–698.
17

Audretsch, D. B., Keilbach, M., and Lehmann, E. (2005). The knowledge spillover theory of
entrepreneurship and economic growth. Research on Technological Innovation, Management and
Policy, 9:37–54.
Audretsch, D. B., Keilbach, M. C., and Lehmann, E. E. (2006). Entrepreneurship and economic
growth. Oxford University Press.
Ayyagari, M. and Kosova, R. (2010). Does FDI Facilitate Domestic Entry? Evidence from the
Czech Republic. Review of International Economics, 18(1):14–29.
Bandick, R., Gorg, H., and Karpaty, P. (2014). Foreign acquisitions, domestic multinationals, and
R&D. The Scandinavian Journal of Economics, 116(4):1091–1115.
Barbosa, N. and Eiriz, V. (2009). Linking corporate productivity to foreign direct investment: An
empirical assessment. International Business Review, 18(1):1–13.
Barrios, S., Gorg, H., and Strobl, E. (2005). Foreign direct investment, competition and industrial
development in the host country. European Economic Review, 49(7):1761–1784.
Bernard, A. B. and Jensen, J. B. (2002). The Deaths of Manufacturing Plants. NBER Working
Papers 9026, National Bureau of Economic Research, Inc.
Blomstrom, M., Kokko, A., and Mucchielli, J.-L. (2003). The Economics of Foreign Direct Invest-
ment Incentives, pages 37–60. Springer Berlin Heidelberg, Berlin, Heidelberg.
Blonigen, B. A. and Piger, J. (2014). Determinants of foreign direct investment. Canadian Journal
of Economics/Revue canadienne d’economique, 47(3):775–812.
Borensztein, E., Gregorio, J. D., and Lee, J.-W. (1998). How does foreign direct investment affect
economic growth? Journal of International Economics, 45(1):115 – 135.
Bruno van Pottelsberghe de la Porterie, F. L. (2001). Does foreign direct investment transfer
technology across borders? The Review of Economics and Statistics, 83(3):490–497.
Burke, A., Gorg, H., and Hanley, A. (2008). The impact of foreign direct investment on new firm
survival in the UK: Evidence for static versus dynamic industries. Small Business Economics,
31(4):395–407.
Cantwell, J. and Piscitello, L. (2000). Accumulating technological competence: Its changing impact
on corporate diversification and internationalization. Industrial and Corporate Change, 9(1):21–
51.
Carlsson, B. (2006). Internationalization of innovation systems: A survey of the literature. Research
Policy, 35(1):56–67.
18

Carr, D. L., Markusen, J. R., and Maskus, K. E. (2001). Estimating the knowledge-capital model
of the multinational enterprise. The American Economic Review, 91(3):693–708.
Castellani, D., Meliciani, V., and Mirra, L. (2014). The determinants of inward foreign direct
investment in business services across European regions. Regional Studies, (ahead-of-print):1–21.
Castellani, D. and Pieri, F. (2014). Outward investments and productivity: Evidence from European
regions. Regional Studies, (ahead-of-print):1–20.
Coe, D. T., Helpman, E., and Hoffmaister, A. W. (2009). International R&D spillovers and insti-
tutions. European Economic Review, 53(7):723–741.
Colantone, I. and Sleuwaegen, L. (2010). International trade, exit and entry: A cross-country and
industry analysis. Journal of International Business Studies, 41(7):1240–1257.
Crescenzi, R., Pietrobelli, C., and Rabellotti, R. (2013). Innovation drivers, value chains and the
geography of multinational corporations in Europe. Journal of Economic Geography, page lbt018.
Danakol, S., Estrin, S., Reynolds, P. D., and Weitzel, U. (2016). Foreign direct investment and
domestic entrepreneurship: Blessing or curse? Small Business Economics, page forthcoming.
De Backer, K. and Basri, E. (2008). The internationalisation of R&D. Staying Competitive in the
Global Economy: Compendium of Studies on Global Value Chains, pages 219–248.
De Backer, K. and Sleuwaegen, L. (2003). Does foreign direct investment crowd out domestic
entrepreneurship? Review of Industrial Organization, 22(1):67–84.
De Mello, L. R. (1999). Foreign direct investment-led growth: evidence from time series and panel
data. Oxford Economic Papers, 51(1):133–151.
Djankov, S. and Hoekman, B. (2000). Foreign investment and productivity growth in czech enter-
prises. The World Bank Economic Review, 14(1):49–64.
Doms, M., Dunne, T., and Roberts, M. J. (1995). The role of technology use in the survival and
growth of manufacturing plants. International Journal of Industrial Organization, 13(4):523–542.
Falk, M. (2012). Determinants of greenfield investment in knowledge intensive business services.
FIW Research Reports series IV-002, FIW.
Feizpour, M. A. and Moradi, M. (2014). Determinants of new firm formation: Evidence from iranian
manufacturing industries. Journal of Economic Cooperation & Development, 35(4):135.
Feldman, M. P. (1999). The new economics of innovation, spillovers and agglomeration: A review
of empirical studies. Economics of Innovation and New Technology, 8(1-2):5–25.
19

Ferragina, A. M. and Mazzotta, F. (2014). FDI spillovers on firm survival in italy: absorptive
capacity matters! The Journal of Technology Transfer, 39(6):859–897.
Fritsch, M. and Wyrwich, M. (2016). The effect of entrepreneurship on economic developmentan
empirical analysis using regional entrepreneurship culture. Journal of Economic Geography, page
lbv049.
Fu, X. (2012). Foreign direct investment and managerial knowledge spillovers through the diffusion
of management practices. Journal of Management Studies, 49(5):970–999.
Garcıa, F., Jin, B., and Salomon, R. (2013). Does inward foreign direct investment improve the
innovative performance of local firms? Research Policy, 42(1):231 – 244.
Geroski, P. A. (1989). The effect of entry on profit margins in the short and long run. Annales
d’conomie et de Statistique, (15/16):pp. 333–353.
Glass, A. J. and Saggi, K. (2002). Multinational firms and technology transfer. The Scandinavian
Journal of Economics, 104(4):495–513.
Gorg, H. and Greenaway, D. (2004). Much ado about nothing? Do domestic firms really benefit
from foreign direct investment? The World Bank Research Observer, 19(2):171–197.
Gorg, H. and Strobl, E. (2005). Spillovers from foreign firms through worker mobility: An empirical
investigation. Scandinavian Journal of Economics, 107(4):693–709.
Grossman, G. M. (1984). International Trade, Foreign Investment, and the Formation of the
Entrepreneurial Class. The American Economic Review, 74(4):606–614.
Guimon, J. (2009). Government strategies to attract R&D-intensive FDI. The Journal of Technology
Transfer, 34(4):364–379.
Hall, B. H. et al. (2011). The internationalization of R&D. Technical report, United Nations
University-Maastricht Economic and Social Research Institute on Innovation and Technology
(MERIT).
Hause, J. C. and Du Rietz, G. (1984). Entry, industry growth, and the microdynamics of industry
supply. The Journal of Political Economy, pages 733–757.
Iacovone, L., Javorcik, B., Keller, W., and Tybout, J. (2015). Supplier responses to walmart’s
invasion in mexico. Journal of International Economics, 95(1):1 – 15.
Javorcik, B. S. (2004). Does foreign direct investment increase the productivity of domestic firms?
In search of spillovers through backward linkages. The American Economic Review, 94(3):605–
627.
20

Javorcik, B. S. and Spatareanu, M. (2008). To share or not to share: Does local participation
matter for spillovers from foreign direct investment? Journal of Development Economics, 85(1-
2):194–217.
Johnson, A. et al. (2006). The effects of FDI inflows on host country economic growth. The Royal
Institute of Technology. Centre of Excellence for Studies in Science and Innovation http://www.
infra. kth. se/cesis/research/publications/working papers.
Jovanovic, B. (1994). Firm formation with heterogeneous management and labor skills. Small
Business Economics, 6(3):185–191.
Keller, W. and Yeaple, S. R. (2009). Multinational enterprises, international trade, and productivity
growth: firm-level evidence from the united states. The Review of Economics and Statistics,
91(4):821–831.
Khemani, R. S. and Shapiro, D. M. (1986). The determinants of new plant entry in Canada. Applied
Economics, 18(11):1243–1257.
Kim, Y.-H. (2009). Cross-border M&A vs. greenfield FDI: Economic integration and its welfare
impact. Journal of Policy Modeling, 31(1):87–101.
Konings, J. (2001). The effects of foreign direct investment on domestic firms. Economics of
transition, 9(3):619–633.
Kosova, R. (2010). Do foreign firms crowd out domestic firms? Evidence from the Czech Republic.
The Review of Economics and Statistics, 92(4):861–881.
Lee, I. H., Hong, E., and Sun, L. (2014). Inward Foreign Direct Investment and Domestic En-
trepreneurship: A Regional Analysis of New Firm Creation in Korea. Regional Studies, 48(5):910–
922.
Liu, Q., Lu, R., and Zhang, C. (2014). Entrepreneurship and spillovers from multinationals: Evi-
dence from chinese private firms. China Economic Review, 29:95–106.
Liu, Z. (2008). Foreign direct investment and technology spillovers: Theory and evidence. Journal
of Development Economics, 85(12):176 – 193.
Markusen, J. R. and Venables, A. J. (1999). Foreign direct investment as a catalyst for industrial
development. European Economic Review, 43(2):335–356.
Munemo, J. (2014). Business start-up regulations and the complementarity between foreign and
domestic investment. Review of World Economics, 150(4):745–761.
Norback, P.-J. and Persson, L. (2005). Privatization policy in an international oligopoly. Economica,
72(288):pp. 635–653.
21

Olney, W. W. (2013). A race to the bottom? employment protection and foreign direct investment.
Journal of International Economics, 91(2):191–203.
Paniagua, J. and Sapena, J. (2014). Is FDI doing good? A golden rule for FDI ethics. Journal of
Business Research, 67(5):807–812.
Pathak, S., Laplume, A., and Xavier-Oliveira, E. (2015). Inbound foreign direct investment and
domestic entrepreneurial activity. Entrepreneurship & Regional Development, 27(5-6):334–356.
Rodriguez-Clare, A. (1996). Multinationals, linkages, and economic development. The American
Economic Review, pages 852–873.
Scarpetta, S., Hemmings, P., Tressel, T., and Woo, J. (2002). The role of policy and institutions
for productivity and firm dynamics: Evidence from micro and industry data.
Shapiro, D. and Khemani, R. (1987). The determinants of entry and exit reconsidered. International
Journal of Industrial Organization, 5(1):15 – 26.
UNCTAD (2000). World investment report 2000: Cross-border mergers and acquisitions and de-
velopment. Technical report, New York: United Nations.
Wang, M. (2010). Foreign direct investment and domestic investment in the host country: evidence
from panel study. Applied Economics, 42(29):3711–3721.
Wennekers, S., Uhlaner, L., and Thurik, R. (2002). Entrepreneurship and its Conditions: A Macro
Perspective. International Journal of Entrepreneurship Education, 1(1):25–64.
Zajc Kejzar, K. (2011). The role of foreign direct investment in the host-country firm selection pro-
cess: firm-level evidence from slovenian manufacturing. Review of World Economics, 147(1):169–
193.
22

Figure 1: Values of cross-border M&A and announced greenfield projects in Europe
Source: UNCTAD - Annex Tables
23

Table 1: Variable description
Variable name Description Source
Domestic entry rate
(DomEntry)
The ratio between the number of births of enterprises and
the total number of active enterprises at time t in 20 busi-
ness sectors (except activities of holding companies) and
in 10 countries. Data are collected for the reference period
2004-2012
Structural business statistics - Eu-
rostat
Foreign entry rate
(ForEntry)
The ratio between the number of knowledge intensive
greenfield projects and the total number of active enter-
prises at time t. Knowledge intensive greenfield FDI are
defined as cross-border greenfield investment projects in
R&D, design, development and testing, education and
training, headquarters activities†, and information and
communication technologies. The data are at project level,
however we aggregate the total number of projects per sec-
tor and year, as the other data sources are aggregated at
sector- or country-level.
fDi Markets database.
Dyn A dummy with value of one if firms churn rate -sum of
domestic entries and exits, divided by the total number of
active firms- is larger than 15%, zero otherwise.
Structural business statistics - Eu-
rostat
Tech A dummy with value of one if the NACE sector is a
medium/high-tech sector, zero if it is a low-tech sector.
(For the division of the sectors into medium/high-tech and
low-tech sectors see next Table 2)
”
Price-cost margin
(pcm)
An approximation of the price-cost margin, p−cp
, is given
by multiplying and diving by the demanded quantity q to
obtain profits over sales. For this calculation, we divide
the gross operating surplus and mixed income by the pro-
duction value.
Authors’ calculations based on the
variables provided in the OECD
STAN database.
Industrial gross
domestic product
growth (∆gdp)
Growth rate of the gross production per sector. ”
Capital intensity
(CapInt)
The capital to labour ratio, given by the gross capital stock
divided by the labour costs.
”
† Headquarter activities in MNEs are high-skill activities such as R&D, marketing and management (Bandick et al.,
2014). Although the decision to open a headquarter abroad is mainly driven by low corporate taxes, HQs are found
to be located in areas with similar industry specialization and with high levels of business services, which are typically
knowledge intensive (Falk, 2012).
24

Table 2: Industry grouping
ISIC sector name ISIC sector name
low-tech sectors medium/high-tech sectors
10t12 Food products, beverages and tobacco 05t09 Mining and quarrying
13t15 Textiles, wearing apparel, leather 19t22 Manufacture of coke and refined petroleum
products; chemicals and chemical products;
basic pharmaceutical products and phar-
maceutical preparations; rubber and plastic
products
16 Wood/wood products (except furniture) 23 Manufacture of other non-metallic mineral
products
17t18 Paper and printing 24t25 Manufacture of basic metals and fabri-
cated metal products, except machinery
and equipment
45t47 Wholesale and retail 26t28 Manufacture of machinery and equipment
n.e.c.
55t56 Hotels and restaurants 29t30 Manufacture of motor vehicles, trailers,
semi-trailers and of other transport equip-
ment
31t32 Manufacture of furniture; other manufac-
turing
35t39 Electricity, gas, steam and air condition-
ing supply; Water supply; sewerage, waste
management and remediation activities
41t43 Construction
49t53 Transportation and storage
58t63 Information and communication
64t66 Financial and insurance activities except
activities of holding companies
68t82 Administrative and support service activi-
ties
84t99 Education; human health and social work
activities; arts, entertainment and recre-
ation; other service activities
25

Table 3: Summary statistics
Mean Median SD Min Max N
DomEntry 7.12 6.01 4.48 1.43 42.34 454
ForEntry 0.02 0.00 0.08 0.00 1.06 454
Tech 0.72 1.00 0.45 0 1 454
Churn 13.38 12.02 6.95 2.51 59.48 454
Dyn 0.34 0 0.48 0 1 454
CapInt 10.38 5.58 12.34 0.98 71.76 304
∆gdp 0.79 0.94 13.50 -36.46 82.93 370
Figure 2: Trend over time of domestic entry rate, firm turnover and foreign entry rate (yearly
averages, %)
26

Table 4: Domestic, foreign entry rates, and firm turnover by country (averages, %)
Country DomEntry ForEntry Churn
Austria 5.35 0.04 9.66
Belgium 3.92 0.04 6.49
Czech Republic 8.75 0.01 16.26
Denmark 9.56 0.01 19.84
Estonia 15.04 0.01 27.84
Finland 6.81 0.00 13.48
France 8.59 0.02 15.29
Germany 9.21 0.01 15.92
Italy 6.24 0.00 12.42
Netherlands 7.17 0.04 14.52
Table 5: Means of variables by sector type
Sector low-tech medium/high-tech static dynamic
DomEntry 6.55 7.35 4.88 11.41∗
ForEntry 0.00 0.03∗ 0.03 0.01∗
pcm 15.64 23.86∗ 20.36 24.11
CapInt 5.72 12.22∗ 9.71 11.74
∆gdp -2.41 2.09∗ 0.70 0.97
Note: ‘*’ mean-difference test significant at 1%-level. The classification of the industries into low-tech and
medium/high-tech can be taken from Table 2 in the appendix. Static (dynamic) industries are those with a firm
churn rate below (above) the median churn rate in the sample.
Table 6: Correlation table
Variables (1) (2) (3) (4) (5) (6) (7)
(1)DomEntry 1.00
(2)ForEntry -0.13* 1.00
(3)Dyn 0.69* -0.13* 1.00
(4)Tech 0.08 0.14* -0.04 1.00
(5)Pcm 0.24* -0.13 0.11 0.24* 1.00
(6)CapInt 0.20* -0.11 0.08 0.24* 0.73* 1.00
(7)∆gdp 0.05 0.03 0.01 0.15* 0.13 0.12 1.00
Note: ‘*’ correlation coefficient significant at 1%-level
27

Table 7: Results from a feasible generalized least squares regression of
DomEntryijt = α+ βDomEntryijt−1 + γForEntryijt−1 + δ′Xijt−1 + ϵijt.
Dep. var:
DomEntry (1) (2) (3) (4) (5)
DomEntryLag 0.209*** 0.260*** 0.207*** 0.205***
(0.020) (0.016) (0.019) (0.019)
ForEntry 3.049*** -0.236 0.768 -14.374*** -16.328***
(0.875) (0.683) (0.484) (4.011) (3.525)
Dyn 4.102*** 4.086*** 4.118*** 4.025***
(0.164) (0.159) (0.162) (0.167)
Tech -0.164 0.328*** -0.182 -0.170
(0.264) (0.079) (0.260) (0.260)
CapInt -0.062*** 0.008 -0.062*** -0.075***
(0.009) (0.007) (0.009) (0.012)
pcm 0.039*** 0.011* 0.038*** 0.036***
(0.007) (0.006) (0.007) (0.007)
∆gdp 0.018*** 0.017*** 0.018*** 0.018***
(0.005) (0.005) (0.005) (0.005)
constant 6.275*** 3.482*** 2.552*** 3.501*** 3.567***
(0.411) (0.277) (0.161) (0.272) (0.277)
Dyn× ForEntry 8.116* 6.546*
(4.713) (4.012)
tech× ForEntry 14.355*** 16.020***
(4.048) (3.562)
(ForEntrydydx) 4.824* -3.022*** -1.907
(2.588) (1.380) (2.890)
Observations 454 454 454 454 454
Country, Sector, and Time FE X X X X X
Standard errors in parentheses
*** p<0.01, ** p<0.05, * p≤0.1Note: ForEntrydydx is the marginal effect of ForEntry calculated at means of Dyn and Tech
28

Table 8: Results from 2SLS estimation of
DomEntryijt = α+ βDomEntryijt−1 + γForEntryijt−1 + δ′Xijt−1 + ϵijt.
Dep. var:
DomEntry (1) (2) (3) (4) (5)
DomEntryLag 0.558*** 0.381*** 0.388*** 0.345***
(0.080) (0.104) (0.112) (0.108)
ForEntry -10.017 -14.549 -4.763 -13.557 -275.150
(15.181) (15.808) (27.345) (36.891) (235.085)
ForEntry ×Dyn 16.667
(39.326)
ForEntry × Tech 275.530
(105.612)
Dyn 3.751*** 3.616*** 3.741***
(0.607) (0.626) (0.733)
Tech -1.261 -1.489 -0.150
(1.629) (1.890) (0.784)
CapInt -0.058* -0.067* -0.040
(0.032) (0.037) (0.040)
pcm 0.039 0.027 0.047
(0.030) (0.044) (0.034)
∆gdp 0.019 0.025 0.022
(0.029) (0.033) (0.026)
constant 7.060*** 3.029*** 1.508 1.674** 2.823**
(0.986) (0.915) (0.942) (0.808) (1.274)
Results from the first-stage
distGEO 0.185* 0.185* 0.045 0.027 0.010
(0.101) (0.101) (0.099) (0.099) (0.013)
dist2GEO -0.012* -0.012* -0.003 -0.002 -0.001
(0.007) (0.007) (0.007) (0.007) (0.001)
Observations 267 267 267 267 267
R-squared 0.264 0.451 0.677 0.597 0.221
Uncentered R2 0.792 0.845 0.909 0.886 0.780
Endogeneity p-value 0.433 0.321 0.841 0.718 0.363
Underidentification p-value 0.0176 0.0179 0.504 0.582 0.110
F-stat 0.000 0.000 0.000 0.000 0.000
Robust standard errors in parentheses
*** p<0.01, ** p<0.05, * p<0.1
29
