unambiguous full multinuclear nmr assignment of 4 …
TRANSCRIPT
i
UNAMBIGUOUS FULL MULTINUCLEAR NMR ASSIGNMENT OF 4-AMINO-1,1,2,2,9,9,10,10-
OCTAFLUORO[2.2]PARACYCLOPHANE & NMR DIFFERENTIATION OF ITS ENANTIOMERS,
AND RELATED COMPOUNDS
by
SHERYL RABINOWITZ
A thesis submitted to the
Graduate School-Camden
Rutgers, The State University of New Jersey
in partial fulfillment of the requirements
for the degree of Master of Science
Graduate Program in
Chemistry
written under the direction of
Professor Alex J. Roche
and approved by
Alex J. Roche
George A. Kumi
Belgin Canturk
Camden, New Jersey January 2013

ii
Abstract
UNAMBIGUOUS FULL MULTINUCLEAR NMR ASSIGNMENT OF 4-
AMINO-1,1,2,2,9,9,10,10-OCTAFLUORO[2.2]PARACYCLOPHANE & NMR DIFFERENTIATION OF ITS ENANTIOMERS,
AND RELATED COMPOUNDS
by
SHERYL RABINOWITZ
THESIS DIRECTOR:
PROFESSOR ALEX J. ROCHE
For the first time the full multinuclear 1H, 13C, and 19F assignments were
established for 4-amino-1,1,2,2,9,9,10,10-octafluoro[2.2]paracyclophane
(OFP-NH2). These were achieved by using a combination of 1D, COSY,
and HETCOR NMR techniques. The assignments were later confirmed by
nOe experiments. The interaction of OFP-NH2 with different chiral shift
reagents was explored, and it was shown that it is possible to clearly detect
both enantiomers of the planar chiral OFP-NH2 (in both the 1H and 19F
NMR). This method of chiral discrimination was also shown to be
applicable to other similar chiral OFP derivatives.

iii
Dedication
THIS THESIS IS DEDICATED TO MY HUSBAND LARRY AND
CHILDREN DAVID AND JASON. THE LOVE AND SUPPORT THEY
GAVE ME THROUGHOUT THIS PROCESS GAVE ME THE POWER
TO COMPLETE THIS THESIS.

iv
Acknowledgements With the utmost gratitude, I would like to express my thanks to Dr. Roche. I chiefly thank
you for sharing your masterful experience of Organic Chemistry with me. From you, I
learned how to be a teacher to others and I have now seen the interest in Chemistry ignite
in my students’ minds just as you had sparked my interest in Organic Chemistry. You
truly are the BPE!
I am also thankful to the other members of my thesis committee, Dr. George Kumi and
Dr. Belgin Canturk. I most appreciate Dr. Kumi using his valuable time to assist me with
this endeavor. My former Roche Research Group fellow member and mentor, Belgin, in
2003, encouraged me to speak to Dr. Roche about becoming a member of his group and
now she serves as a member of my Committee! Who would have ever thought?
THANK YOU!!!
My research partner, Alex Marchione also has my sincere appreciation for collaboration
on work discussed in our paper.
Mr. Steven “Buzz” Chew is acknowledged as a great lab assistant for the research
presented here.
To Anne Loyle Langholz, I am seriously appreciative and thankful to you for choosing
me to be your lab assistant and helping me to the very end just because you are my
friend.
To Anna, My “Roomie”, thank you for always helping me with my ChemDraw, being
my friend through it all, and being the best cheerleader ever!

v
Table of Contents
Abstract .............................................................................................................................. ii
Dedication ......................................................................................................................... iii
Acknowledgements .......................................................................................................... iv
Table of Contents .............................................................................................................. v
List of Figures .................................................................................................................. vii
List of Spectra ................................................................................................................ viii
List of Schemes ................................................................................................................. xi
Abbreviations .................................................................................................................. xii
Chapter 1: Introduction ................................................................................................... 1
Cyclophanes ............................................................................................................................... 1 Paracyclophane (PCP) .............................................................................................................. 2 Nomenclature of Cyclophanes .................................................................................................. 3 Octafluoro[2.2]Paracyclophane (OFP) .................................................................................... 4 Chirality ...................................................................................................................................... 7 Nomenclature of Enantiomers .................................................................................................. 8 Nuclear Magnetic Resonance (NMR) .................................................................................... 11
Chapter 2: Experimental and Basic NMR Introduction ............................................. 12
Experimental ............................................................................................................................ 12 NMR Characterization of OFP and OFP-NH2 ...................................................................... 12 1H NMR Analysis of OFP-NH2 ............................................................................................... 13 1H NMR of OFP-diNH2 ........................................................................................................... 17 19F NMR Analysis of OFP-NH2 .............................................................................................. 18
Chapter 3: Unambiguous Atomic Assignment of the 1H,13C, and 19F NMR for OFP-
NH2 ................................................................................................................................... 25 1H and 13C NMR assignments ................................................................................................. 25 13C NMR spectrum of OFP-NH2 ............................................................................................ 30 Correlation Spectroscopy (COSY) ......................................................................................... 46 19F Assignments of OFP-NH2 .................................................................................................. 58 Karplus Equation .................................................................................................................... 67 Assignments Confirmed by nOe Experiments ...................................................................... 70 Conclusion ................................................................................................................................ 72
Chapter 4: Chirality and OFP-NH2 .............................................................................. 73
Enantiomeric Differentiation .................................................................................................. 73 Diastereomers .......................................................................................................................... 76

vi
Chiral Lanthanide Shift Reagents .......................................................................................... 78 1H NMR Analysis of OFP-NH2 ............................................................................................... 80 1H spectra with Ytterbium (Yb) HFC .................................................................................... 82 1H spectra with Eu-HFC ......................................................................................................... 86 19F OFP-NH2 Analysis ............................................................................................................. 88 Praseodymium (Pr)-HFC ........................................................................................................ 93 Chiral Solvating Agents .......................................................................................................... 93 Conclusion ................................................................................................................................ 94
Chapter 5: Chirality and ortho’-di NH2 ........................................................................ 95
Enantiomeric Differentiation of ortho’-di NH2 ..................................................................... 95 19F NMR of ortho’-di NH2 ....................................................................................................... 99 Analysis of Achiral Shift Reagents ....................................................................................... 100 Conclusion .............................................................................................................................. 107
Chapter 6: Conclusion and Future Work ................................................................... 108
Conclusion .............................................................................................................................. 108 Future Work .......................................................................................................................... 109
Appendix……………………………………………………………………………….111
Endnotes......................................................................................................................... 123
Bibliography…………………………………………………………………………...125

vii
List of Figures FIGURE 1.1: [2.2]METACYCLOPHANE ................................................................................. 1 FIGURE 1.2: [2.2]PARACYCLOPHANE (PCP) ........................................................................ 2 FIGURE 1.3: NUMBERING SCHEME FOR CYCLOPHANES ....................................................... 3 FIGURE 1.4: OCTAFLUORO[2.2]PARACYCLOPHANE (OFP) .................................................. 4 FIGURE 1.5: MONOSUBSTITUTED OFP DERIVATIVES .......................................................... 6 FIGURE 1.6: DISUBSTITUTED ANALOGS OF OFP ................................................................. 6 FIGURE 1.7: CHIRALITY AND HANDEDNESS ........................................................................ 7 FIGURE 1.8: S AND R ENANTIOMERS OF ALANINE .............................................................. 9 FIGURE 1.9: BINAP, AN EXAMPLE OF AXIAL CHIRALITY ................................................. 10 FIGURE 1.10: PLANAR CHIRALITY DESIGNATION OF ENANTIOMERS ................................. 11 FIGURE 2.1: SYNTHESIZED MONO- AND DI-SUBSTITUTED COMPOUNDS ........................... 12 FIGURE 2.2: EIGHT CHEMICALLY IDENTICAL PROTONS OF OFP ....................................... 13 FIGURE 2.3: MONOSUBSTITUTED OFP-NH2 ...................................................................... 14 FIGURE 2.4: AB PATTERN DIAGRAM 34 ............................................................................. 16 FIGURE 2.5: DI-NH2 DERIVATIVES: PSEUDO META, PSEUDO PARA, PSEUDO ORTHO ............ 17 FIGURE 2.6: ANTI AND SYN FLUORINES INDICATED ON OFP-NH2 ...................................... 19 FIGURE 2.7: THE FOUR AB QUARTETS OF OFP DERIVATIVES ........................................... 22 FIGURE 2.8: ANTI AND SYN FLUORINES INDICATED ON ORTHO’ OFP-DINH2 ...................... 23 FIGURE 3.1: CHEMICALLY DIFFERENT ATOMS OF OFP-NH2 ............................................ 26 FIGURE 3.2: NUMBERING SCHEME AND ARYL POSITIONS FOR OFP-NH2 ......................... 26 FIGURE 3.3: CARBONS OF OFP-NH2 ................................................................................. 30 FIGURE 3.4: UNAMBIGUOUSLY ASSIGNED ATOMS OF OFP-NH2 (AT THIS POINT) ............. 46 FIGURE 3.5: 1H/1H CORRELATION SPECTROSCOPY GIVES ORTHO’ FROM GEM ................... 47 FIGURE 3.6: KNOWN ATOMIC ASSIGNMENTS AT THIS POINT ........................................... 53 FIGURE 3.7: GEM HYDROGEN GIVES THREE CARBONS THROUGH 3JC-H =8HZ ................... 54 FIGURE 3.8: COMPLETED ASSIGNMENT OF HYDROGEN AND CARBONS OF OFP-NH2 ....... 56 FIGURE 3.9: 2JF-C =27HZ HETCOR: KNOWN CARBONS GIVE TWO UNKNOWN FLUORINES
................................................................................................................................... 63 FIGURE 3.10: PAIRS OF FLUORINES ON EACH CARBON ..................................................... 66 FIGURE 3.11: KARPLUS EQUATION COUPLING CONSTANT ................................................ 68 FIGURE 3.12: ASSIGNED FLUORINES FOR OFP-NH2 .......................................................... 69 FIGURE 4.1: R AND S DESIGNATION OF ENANTIOMERS OF OFP-NH2................................ 74 FIGURE 4.2: R AND S ENANTIOMERS OF THALIDOMIDE .................................................... 75 FIGURE 4.3: ALANINE METHYL GROUP 1H NMR 300 MHZ WITH ACETONITRILE-D (A) NO
CLSR, (B)0.02M YTTERBIUM(III)NITRATE, (C) 0.05M YTTERBIUM (III) NITRATE39 77 FIGURE 4.4: MOST COMMON CLSR’S (SHOWN IN THEIR 1R, 2S FORM) ............................ 78 FIGURE 4.5: COORDINATION OF CLSR WITH OFP-NH2 .................................................... 79 FIGURE 4.6: PROTON POSITIONS FOR OFP-NH2 ................................................................ 81 FIGURE 4.7: FLUORINE POSITIONS FOR OFP-NH2 ............................................................. 88 FIGURE 4.8: PIRKLE’S ALCOHOL AND PIRKLE’S DIFUNCTIONAL ANALOGUE .................... 94 FIGURE 5.1: DI SUBSTITUTED SHOWING ORTHO AS GEM .................................................... 98 FIGURE 5.2: ACHIRAL REAGENT TRIS(2,2,6,6-TETRAMETHYL-3,5-
HEPTANEDIONATO)YTTERBIUM YB(TMHD)3 ............................................................. 101 FIGURE 5.3: STRUCTURE OF RESOLVE-ALTM YBFOD ..................................................... 105

viii
List of Spectra SPECTRUM 2.1: 1H NMR SPECTRUM OF OFP-NH2 ........................................................... 15 SPECTRUM 2.2: 1H NMR OF OFP-DINH2 .......................................................................... 18 SPECTRUM 2.3: 19F NMR OF OFP ..................................................................................... 19 SPECTRUM 2.4: 19F NMR SPECTRUM OF OFP-NH2 .......................................................... 20 SPECTRUM 2.5: EXPANDED 19F NMR OF OFP-NH2 W/INTEGRATION ................................ 21 SPECTRUM 2.6: 19F NMR OF OFP-NH2 ............................................................................ 22 SPECTRUM 2.7: 19F NMR OF ORTHO’ OFP-DINH2 ............................................................ 24 SPECTRUM 3.1: 1H NMR OF OFP-NH2 D6-ACETONE ........................................................ 27 SPECTRUM 3.2: EXPANDED 1H NMR OF OFP-NH2 ........................................................... 28 SPECTRUM 3.3: EXPANDED 1H NMR OF OFP-NH2 WITH SOME PROTON DESIGNATIONS 29 SPECTRUM 3.4: 13C NMR OF OFP-NH2 ............................................................................ 31 SPECTRUM 3.5: EXPANDED 13C {1H} NMR OF OFP-NH2 ................................................. 32 SPECTRUM 3.6: EXPANDED 13C {1H} NMR OF OFP-NH2 (COLOR CODED) ....................... 33 SPECTRUM 3.7: EXPANDED 13C {1H} NMR OF OFP-NH2-BRIDGEHEAD CARBONS .......... 34 SPECTRUM 3.8: EXPANDED 13C {1H} NMR OF OFP-NH2 COUPLING ................................ 35 SPECTRUM 3.9: EXPANDED 13C {1H} NMR OF OFP-NH2 ................................................. 37 SPECTRUM 3.10: 13C {19F} NMR OF OFP-NH2 ................................................................ 38 SPECTRUM 3.11: EXPANDED 13C {19F} NMR OF OFP-NH2 .............................................. 39 SPECTRA 3.7 & 3.11 OVERLAPPED .................................................................................... 40 SPECTRUM 3.12: EXPANDED 13C {19F} NMR OF OFP-NH2 .............................................. 41 SPECTRUM 3.13: EXPANDED 13C {19F} NMR OF OFP-NH2 (DOUBLETS) .......................... 42 SPECTRUM 3.14A: EXPANDED 13C {19F} NMR OF OFP-NH2 ............................................ 43 SPECTRUM 3.14B: EXPANDED 13C {19F} NMR OF OFP-NH2 (DOUBLETS) ....................... 44 SPECTRA 3.8 & 3.13 OVERLAPPED .................................................................................... 45 SPECTRUM 3.15A: 1H/1H COSY NMR OF OFP-NH2 ........................................................ 47 SPECTRUM 3.15B: 1H/1H COSY NMR OF OFP-NH2 COUPLING OF GEM TO ORTHO’ ........ 48 SPECTRUM 3.15C: 1H/1H COSY NMR OF OFP-NH2: ATOMS AND 3JH-H COUPLED ATOMS.
................................................................................................................................... 49 SPECTRUM 3.16: PAIRED PROTONS OF OFP-NH2 .............................................................. 50 SPECTRUM 3.17A: C-H HETCOR (1JC-H= 140 HZ) ........................................................... 51 SPECTRUM 3.17B: C-H HETCOR KNOWN H’S GIVE UNKNOWN C’S ............................... 52 SPECTRUM 3.17C: C-H HETCOR KNOWN CARBONS GIVE UNKNOWN HYDROGENS ....... 53 SPECTRUM 3.18A: 3JC-H HETCOR .................................................................................... 55 SPECTRUM 3.18B: 3JC-H HETCOR GEM HYDROGEN TO CORRESPONDING CARBONS ........ 56 SPECTRUM 3.19: FULLY ASSIGNED
1H NMR FOR OFP-NH2 ............................................. 57 SPECTRUM 3.20: COMPLETE 13C {1H} NMR ASSIGNMENTS OF OFP-NH2 ....................... 58 SPECTRUM 3.21: 8 DOUBLETS OF 19F NMR OF OFP-NH2 ................................................. 59 SPECTRUM 3.22: 19F/19F COSY OF OFP-NH2 ................................................................... 60 SPECTRUM 3.23: RIGHT SIDE EXPANSION OF 19F/19F COSY OF OFP-NH2 ....................... 61 SPECTRUM 3.24: LEFT SIDE EXPANSION OF 19F/19F COSY OF OFP-NH2 .......................... 62 SPECTRUM 3.25: DESIGNATED GEMINAL FLUORINES IN THE 19F OF OFP–NH2 ................ 63 SPECTRUM 3.26: 2JF-C =27HZ HETCOR OF OFP-NH2 ..................................................... 64 SPECTRUM 3.27: 2JF-C HETCOR KNOWN CARBONS TO FLUORINE DOUBLETS ................. 65 SPECTRUM 3.28: 2JF-C HETCOR KNOWN CARBONS TO FLUORINE AB QUARTETS ........... 66

ix
SPECTRUM 3.29: KNOWN FLUORINE AB QUARTETS ......................................................... 67 SPECTRUM 3.30: PAIRS OF FLUORINE WITH 3JF-C = 7 HZ ................................................... 68 SPECTRUM 3.31: ASSIGNED FLUORINES FOR OFP-NH2 .................................................... 69 SPECTRUM 3.32: EXPANSION OF THE 400 MHZ 19F NMR SPECTRUM OF OFP-NH2 WITH
ASSIGNED FLUORINES (SPECTRUM 3.32 REPRODUCED FROM REFERENCE 35 WITH PERMISSION FROM THE AUTHORS) .............................................................................. 70
SPECTRUM 3.33: EXPANSION OF F-H HOESY OF OFP-NH2 (SPECTRUM 3.33 REPRODUCED FROM REFERENCE 35 WITH PERMISSION FROM THE AUTHORS) ................................... 71
SPECTRUM 4.1: ( REVISITED) EXPANSION OF THE 400 MHZ 1H NMR SPECTRUM OF OFP-NH2 WITH ASSIGNED PROTONS (SPECTRUM 4.1 REPRODUCED FROM REFERENCE 35 WITH PERMISSION FROM THE AUTHORS) ..................................................................... 80
SPECTRUM 4.2: 1H NMR OFP-NH2 .................................................................................. 82 SPECTRUM 4.3: 1H NMR OF OFP-NH2 WITH 0-1.0 EQUIVALENTS OF YB-HFC ................ 83 SPECTRUM 4.4: 1H NMR OFP-NH2 WITH 2-4 EQUIVALENTS OF YB-HFC ........................ 84 SPECTRUM 4.6: 1H NMR WITH 0.5 EQUIVALENTS OF EU-HFC ......................................... 86 SPECTRUM 4.7: 1H NMR WITH 2.0 EQUIVALENTS OF EU-HFC ......................................... 87 SPECTRUM 4.8: EXPANSION OF THE 400 MHZ 19F SPECTRUM OF OFP-NH2 WITH ASSIGNED
FLUORINES (REPRODUCED FROM REFERENCE 35 WITH PERMISSION FROM THE AUTHORS) REVISITED ................................................................................................. 88
SPECTRUM 4.9: 19F NMR OFP-NH2 ................................................................................. 89 SPECTRUM 4.10: 19F NMR OFP-NH2 WITH 0.5 EQUIVALENTS OF EU-HFC ...................... 90 SPECTRUM 4.11: 19F NMR OFP-NH2 WITH 1.0 & 3.0 EQUIVALENTS OF EU-HFC ............. 91 SPECTRUM 4.12: 19F NMR OFP-NH2 WITH 1.5-5.0 EQUIVALENTS OF YB-HFC................ 92 SPECTRUM 5.1: 1H NMR OF ORTHO’ OFP-DINH2 ............................................................. 95 SPECTRUM 5.2: 1H NMR OF OFP-DI AMINO WITH 0.5 AND THEN 0.75 EQS. OF YB-CLSR 96 SPECTRUM 5.3: 1H NMR OF DI-NH2 OFP WITH YB-CLSR ............................................... 97 SPECTRUM 5.4: 1H NMR OF OFP-NH2 (REVISITED) ....................................................... 102 SPECTRUM 5.5: 1H NMR OFP-NH2 0.5 EQ YB(TMHD)3 ACHIRAL LSR ........................... 103 SPECTRUM 5.6: 1H NMR OF OFP-NH2 1.0-2.0 EQUIVALENTS OF YB(TMHD)3 ACHIRAL
LSR ......................................................................................................................... 104 SPECTRUM 5.8: 1H NMR OF OFP-NH2 WITH 1.0-2.0 EQUIVALENTS OF ACHIRAL LSR, . 106 YBFOD.................................................................................................................... 106 SPECTRUM A.1: 1H NMR OFP-NH2 WITH 0.5-5 EQUIVALENTS OF PR-HFC .................. 111 SPECTRUM A.2: 19F NMR OFP-NH2 WITH 0.5-2.0 EQUIVALENTS OF PR-HFC ............... 112 SPECTRUM A.3: 19F NMR OFP-DINH2 0.5 EQUIVALENTS OF YB-HFC ......................... 113 SPECTRUM A.4: 19F NMR OFP-DINH2 1.0-3.0 EQUIVALENTS YB-HFC ......................... 114 SPECTRUM A.5: 1H NMR OFP-NH2 0.5 EQUIVALENTS PIRKLE’S ALCOHOL .................. 115 SPECTRUM A.6: 19F NMR OFP-NH2 1.0-4.0 EQUIVALENTS PIRKLE’S ALCOHOL ........... 116 SPECTRUM A.7: 1H NMR OFP-DINH2 0.75 EQUIVALENTS PIRKLE’S ............................. 117 SPECTRUM A.8: 1H NMR OF ORTHO’DINH2 WITH 2.5 AND 3.5 EQUIVALENTS PIRKLES
ALCOHOL ................................................................................................................. 118 SPECTRUM A.9: 19F NMR OF ORTHO’ DINH2 WITH 0.75 AND 1.5 EQUIVALENTS OF PIRKLES
ALCOHOL ................................................................................................................. 119 SPECTRUM A.10: 19F NMR OF ORTHO’DINH2 WITH 2.5 AND 3.5 EQUIVALENTS PIRKLES
ALCOHOL ................................................................................................................. 120 SPECTRUM A.11: 19F NMR OFP-DINH2 0.5 EQUIVALENTS YB-HFC ............................. 121

x
SPECTRUM A.12: 19F NMR OFP-DINH2 1.0-3.0 EQUIVALENTS EU-HFC ....................... 122

xi
List of Schemes SCHEME 1.1: SYNTHESIS OF OFP VIA A 1,6 REDUCTIVE ELIMINATION ............................... 5 SCHEME 1.2: FORMATION OF THE PARYLENE POLYMER ..................................................... 5 SCHEME 2.1: SYNTHESIS OF OFP-NH2 (5) ........................................................................ 12 SCHEME 3.1: THE PROTOCOL FOR ASSIGNING THE LOWER DECK ATOMS. (SCHEME 3.1
REPRODUCED FROM REFERENCE 35 WITH PERMISSION FROM THE AUTHORS) ............. 72
xii
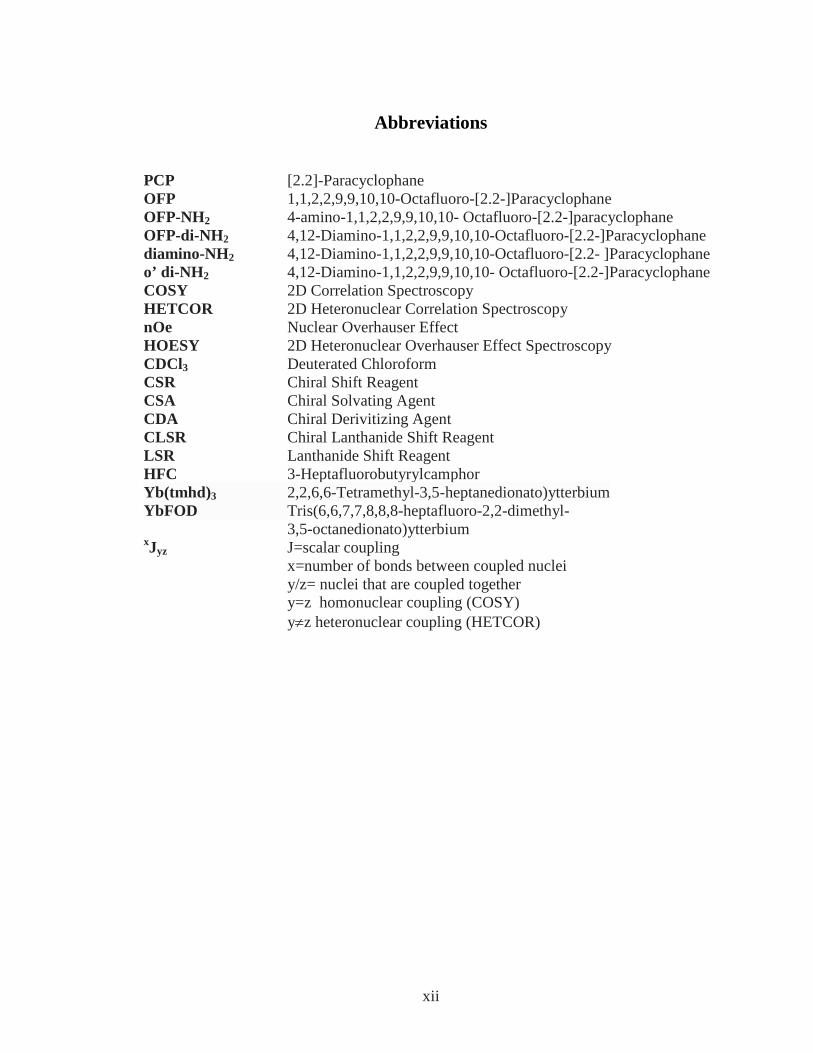
Abbreviations
PCP [2.2]-Paracyclophane OFP 1,1,2,2,9,9,10,10-Octafluoro-[2.2-]Paracyclophane OFP-NH2 4-amino-1,1,2,2,9,9,10,10- Octafluoro-[2.2-]paracyclophane OFP-di-NH2 4,12-Diamino-1,1,2,2,9,9,10,10-Octafluoro-[2.2-]Paracyclophane diamino-NH2 4,12-Diamino-1,1,2,2,9,9,10,10-Octafluoro-[2.2- ]Paracyclophane o’ di-NH2 4,12-Diamino-1,1,2,2,9,9,10,10- Octafluoro-[2.2-]Paracyclophane COSY 2D Correlation Spectroscopy HETCOR 2D Heteronuclear Correlation Spectroscopy nOe Nuclear Overhauser Effect HOESY 2D Heteronuclear Overhauser Effect Spectroscopy CDCl3 Deuterated Chloroform CSR Chiral Shift Reagent CSA Chiral Solvating Agent CDA Chiral Derivitizing Agent CLSR Chiral Lanthanide Shift Reagent LSR Lanthanide Shift Reagent HFC 3-Heptafluorobutyrylcamphor Yb(tmhd)3 2,2,6,6-Tetramethyl-3,5-heptanedionato)ytterbium YbFOD Tris(6,6,7,7,8,8,8-heptafluoro-2,2-dimethyl- 3,5-octanedionato)ytterbium xJyz J=scalar coupling x=number of bonds between coupled nuclei y/z= nuclei that are coupled together y=z homonuclear coupling (COSY) y≠z heteronuclear coupling (HETCOR)

1
Chapter 1: Introduction
Cyclophane chemistry is a well-established field because the first cyclophane,
[2.2]metacyclophane (1) (Fig.1.1) was first prepared by Pelligrin over a century ago
(1899).1 The field of cyclophane chemistry continues to grow and the discovery of new
derivatives and new synthetic strategies is principally due to the increasing field of
supramolecular chemistry.
1
Figure 1.1: [2.2]Metacyclophane
The incorporation of atoms and/or functional groups into the cyclophane framework
alters the chemical and physical properties making them desirable for a number of
applications in material science, which include polymers with very stable surfaces for
printed circuits, new materials for medical application and drug delivery, and use as
ligands in stereoselective synthesis.2-13 The research presented in this thesis will focus on
the NMR spectroscopic analyses of specific fluorinated[2.2]paracyclophanes.
Cyclophanes Cyclophanes, first described by Cram, 14 Shubert, 15 and Smith, 2 consist of aromatic rings
that are joined together by an aliphatic chain that forms a bridge between the aromatic

2
systems. Cyclophanes have received widespread attention in organic chemistry as they
are synthetically challenging and offer interesting physical and chemical properties.16
Some of these properties include interesting transannular interactions, directing effects
and spectroscopic properties. Because of their distinctive structure, cyclophanes are
widely studied and offer versatility.2
Paracyclophane (PCP) Paracyclophanes contain aromatic rings and aliphatic bridges connecting the rings. In
these molecules, the bridges connect the aromatic rings at the para position. This can
bring the rings into close proximity so that the π-orbitals are directly interacting to form
an extended aromatic system.14 The interaction between the aromatic rings creates an
interesting phenomenon, the transannular effect.7 It was observed that when a
substituent was attached to one of the rings, the electronic properties of other rings are
affected. This has been proven by both spectroscopic and reactivity studies.13
2
Figure 1.2: [2.2]Paracyclophane (PCP)
The smallest stable paracyclophane is referred to as [2.2] Paracyclophane (PCP) (2). PCP
was originally known as ‘di-p-xylene’ and was first isolated by Brown and Farthing in
1949.17 In order to study the electronic interactions between “face to face” arranged
aromatic systems described earlier, Cram and Steinberg synthesized the same cyclophane

3
two years later by a designed new synthetic strategy.14
PCP was the foundation for many substituted moieties with substituents ranging from
simple single unit species, such as a halogen, to complex ring structures, such as another
cyclophane. These substituted analogs displayed prime examples of the “transannular
effect” and have served as the backbone for bridge-substituted analogs, which are
discussed later in the chapter.
Nomenclature of Cyclophanes Cram introduced a nomenclature system for cyclophanes, which was complementary to
the IUPAC rules.14 Later on, Schubert15, Smith2, and Vogtle4 systematized it.
Cyclophane nomenclature requires the number of carbons in the bridge be placed in order
of decreasing length in square brackets in front of the name. The position of the bridge is
designated by bridge connectivity as ortho, meta, or para.
3
Figure 1.3: Numbering Scheme for Cyclophanes
The numbering of a [2.2]paracyclophane begins at the bridge carbon (C-1) and continues
down the bridge to the lower deck, assuming that C-2 through C-9 are in the same plane,
and proceeding in a clockwise progression. Numbering continues to the upper deck

4
through C-10 and around the upper ring in a counter clockwise progression ending with
C-16. Once substituents are introduced to the rings, they must each be numbered such
that the lowest possible value is given to each substituent according to their position on
the ring. Therefore, the molecule in Fig. 1.3 would be correctly referred to as 4-
Iodo[2.2]paracyclophane (3).
Octafluoro[2.2]Paracyclophane (OFP) Fluorination of a cyclophane induces special aspects to the aromatic ring system. These
include influencing the directing effects of electrophilic aromatic substitution and the
transannular communication.18 Exploration of these effects led to the first synthesis of
the fully bridge fluorinated analog, 1,1,2,2,9,9,10,10-octafluoro[2.2]paracyclophane
(OFP) (4) (Fig. 1.4) performed by Chow, et al. in 1970.19 This method involved a
pyrolitically-induced synthesis of OFP and had a relatively low yield of 9-28%.
4
Figure 1.4: Octafluoro[2.2]paracyclophane (OFP)
In 2000, Dolbier, et al. performed a synthesis of OFP by the 1,6 reductive elimination of
CF2X groups where X=Cl.20 This synthesis provided a much more practical lab procedure
and also had an increased yield of 60% (Scheme 1.1).
5
Scheme 1.1: Synthesis of OFP via a 1,6 Reductive Elimination
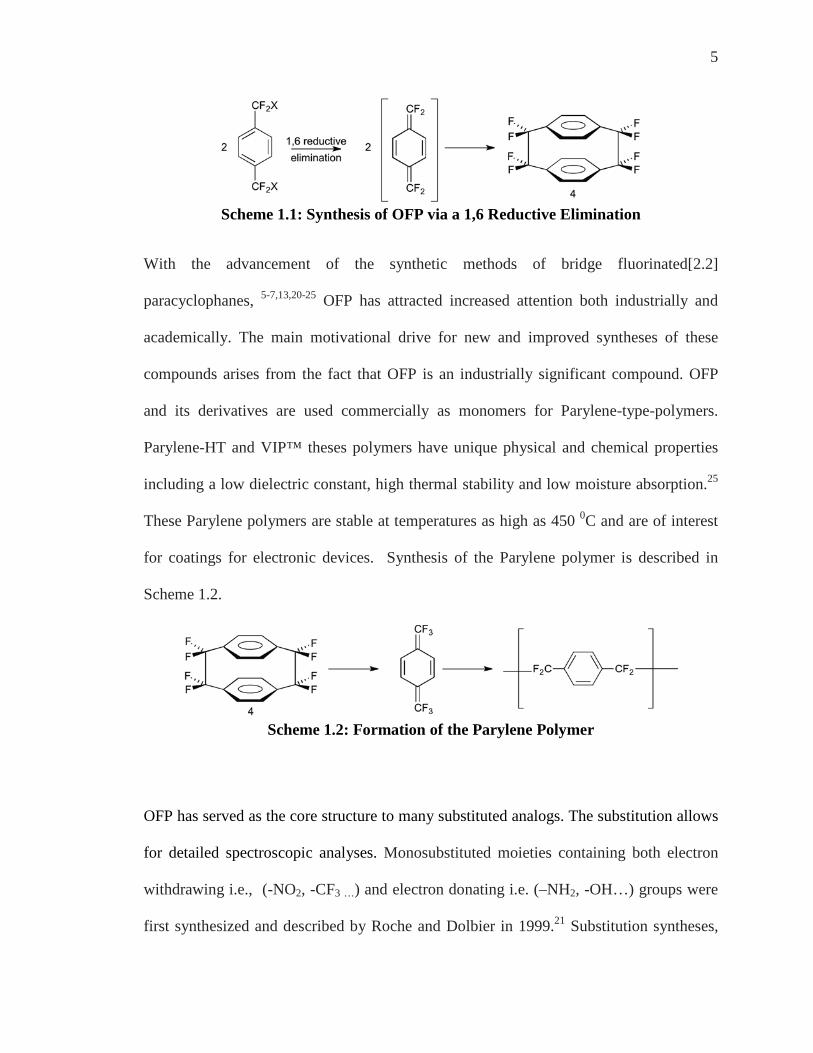
With the advancement of the synthetic methods of bridge fluorinated[2.2]
paracyclophanes, 5-7,13,20-25 OFP has attracted increased attention both industrially and
academically. The main motivational drive for new and improved syntheses of these
compounds arises from the fact that OFP is an industrially significant compound. OFP
and its derivatives are used commercially as monomers for Parylene-type-polymers.
Parylene-HT and VIP™ theses polymers have unique physical and chemical properties
including a low dielectric constant, high thermal stability and low moisture absorption.25
These Parylene polymers are stable at temperatures as high as 450 0C and are of interest
for coatings for electronic devices. Synthesis of the Parylene polymer is described in
Scheme 1.2.
Scheme 1.2: Formation of the Parylene Polymer
OFP has served as the core structure to many substituted analogs. The substitution allows
for detailed spectroscopic analyses. Monosubstituted moieties containing both electron
withdrawing i.e., (-NO2, -CF3 …) and electron donating i.e. (–NH2, -OH…) groups were
first synthesized and described by Roche and Dolbier in 1999.21 Substitution syntheses,

6
including aromatic ring substitutions were subsequently reported by Roche and Canturk
in 2005 (Fig. 1.5).22
Figure 1.5: Monosubstituted OFP Derivatives
In addition to the many monosubstituted derivatives that have been synthesized to date,
many disubstituted derivatives have been synthesized as well. With disubstituted analogs
reported here, substitution always takes place on the previously unsubstituted ring. Three
disubstituted isomers are shown in Figure 1.6.
Figure 1.6: Disubstituted Analogs of OFP
Roche and Dolbier first synthesized all the analogs shown in Fig. 1.6 in 2000.24
Candidates for the research presented in this thesis were selected from Figures 1.5 and
1.6. The 1H, 13C, and 19F NMRs were taken for each of the mono- and di- substituted
derivatives described. The NMR spectra of OFP-NH2 gave the best spread of peaks and
the most resolution of these peaks for all of these nuclei. It is for this reason that OFP-
NH2 was chosen to begin this research.

7
Chirality Chirality is one of the most important concepts in nature and science and particularly
significant in biological processes. Chirality describes why seemingly similar molecules
can behave very differently. Many of the molecules that are biologically important are
chiral, these include proteins (and their constituent amino acids), and the nucleic acids
DNA and RNA, which hold the information necessary for proteins to be synthesized. 26,27
Chirality implies the need for handedness when it comes to identifying the
stereochemistry of chiral molecules. Molecules display chirality if they have non-
superimposable mirror images.
Common examples of chirality include hands and feet and the importance of this topic
was evident in 1966 when Cahn, Ingold and Prelog famously stated “Chirality expresses
the necessary and sufficient conditions for the existence of enantiomers”. 28
Figure 1.7: Chirality and Handedness

8
The hands shown in Fig. 1.7 are mirror images of each other. If they were stacked on top
of each other, the thumbs would be pointing in different directions and are therefore
deemed as chiral species. There are three types of chirality: central, axial, and planar. A
molecule that exhibits central chirality usually includes a tetrahedral atom with four
different substituents. A molecule that includes restricted rotation about an axis, such as
DNA, can exhibit axial chirality, which is chirality about the axis. Planar chirality can be
observed in a molecule when there is restricted rotation about a plane. Cyclophanes
studied for this research all exhibit planar chirality.
Nomenclature of Enantiomers The R/S system is used for denoting enantiomers. According to the Cahn–Ingold–Prelog
(CIP), convention rules each chiral element (either tetrahedral center, axial, or planar) is
identified as R or S according to a system by which its substituents are each assigned a
priority that is based on atomic number. For a chiral tetrahedral center, the molecule is
oriented so that the lowest-priority of the four is pointed away from a viewer, then two
possibilities are seen. If the priority of the remaining three substituents decreases in
clockwise direction, it is labeled R (for Rectus, Latin for right), if it decreases in
counterclockwise direction, it is S (for Sinister, Latin for left). 29 The two enantiomers of
the amino acid, alanine, are shown in Figure 1.8.

9
Figure 1.8: S and R Enantiomers of Alanine
Axial chirality is a special case of chirality where the molecule does not possess a chiral
center. Instead, the element of chirality is presented as chirality about an axis. The axis
of chirality is recognized as an axis about which a set of substituents is held in a spatial
arrangement that is not superimposable on its mirror image. Enantiomers of axially
chiral compounds are usually given the stereochemical labels Ra and Sa (where the
subscript “a” denotes axial chirality). The enantiomers of axially chiral compounds are
designated with the same CIP priority rules for tetrahedral centers.30 The chiral axis is
viewed end-on and the nearest and two furthest substituents on the axial unit are ranked
by priority. A 3D structure is required to determine the R and S conformations of axial
chiral molecules. BINAP (2,2'-bis(diphenylphosphino)-1,1'-binaphthyl) is a molecule
that exhibits axial chirality (Fig. 1.9).

10
R S
Figure 1.9: BINAP, an Example of Axial Chirality
Planar chirality is observed in molecules that have two planar or pseudo planar rings that
have restricted rotation about the connecting bond. Designations of enantiomers
exhibiting planar chirality are assigned as follows: enantiomers, Rp and Sp (where the
subscript “p” denotes planar chirality), are initiated by selecting a plane that contains as
many atoms as possible. The descriptor is determined by viewing the chiral plane from
the out-of-plane atom closest to the atom of highest priority, which is chosen according to
the Cahn-Ingold-Prelog (CIP) system. This atom is denoted as the pilot atom and
assigned as atom number one. If the three adjacent atoms, labeled a, b, c, have a
clockwise array in the chiral plane when viewed from the pilot atom, the descriptor is Rp.
If they have a counterclockwise array, then the descriptor is Sp.

11
Figure 1.10: Planar Chirality Designation of Enantiomers
Appropriately substituted [2.2]Paracyclophane derivatives can exhibit planar chirality
and are designated R and S as described in Fig. 1.10.
Nuclear Magnetic Resonance (NMR) Nuclear Magnetic Resonance (NMR) is one of the most common techniques used for the
analysis of chiral compounds.31 NMR has unmatched versatility as an analytical
technique as much information can be revealed about chemical compounds from a small
sample. NMR can be used for many types of compounds and over half of the elements
on the periodic table have an NMR active isotope. In order to be NMR active, isotopes
must have an odd atomic number or an odd atomic mass. Fluorine-19, Carbon-13, and
Hydrogen-1 are all NMR active nuclei and they represent the major amount of atoms in
each of the samples analyzed in this thesis. Organic chemists prefer NMR to other types
of spectroscopic analysis as NMR provides a convenient, informative, and non-
destructive technique. For these reasons, the use of NMR to determine enantiomeric
purity is desirable.
Some of the most common NMR machines are 300 MHz and have the capability to
measure proton spectra at 300 MHz, carbon spectra at 75.5 MHz and fluorine spectra at
282 MHz.23 Most of the spectra presented in this thesis were run on a Varian 300 MHz
NMR machine.

12
Chapter 2: Experimental and Basic NMR Introduction
Experimental Each of the compounds to be used for analyses (Fig.2.1) were synthesized and/or purified
according to the literature procedures.21,24 The synthesis scheme of one of these
derivatives, OFP-NH2, is demonstrated in Scheme 2.1. The primary method of
purification was column chromatography using silica gel.
Figure 2.1: Synthesized Mono- and Di-substituted Compounds
Scheme 2.1: Synthesis of OFP-NH2 (5)
NMR Characterization of OFP and OFP-NH2 Cyclophanes have very appealing spectroscopic properties, which increased the interest
13
in analyzing these compounds. 1H and 19F NMR spectra of all the above compounds
(Fig.2.1) were obtained and studied but only the compounds providing the most resolved
and separated spectra will be thoroughly investigated. 1H and 19F NMR is often used to
explore the spectroscopic and structural properties of bridge fluorinated compounds such
as those synthesized for this research.
1H NMR Analysis of OFP-NH2
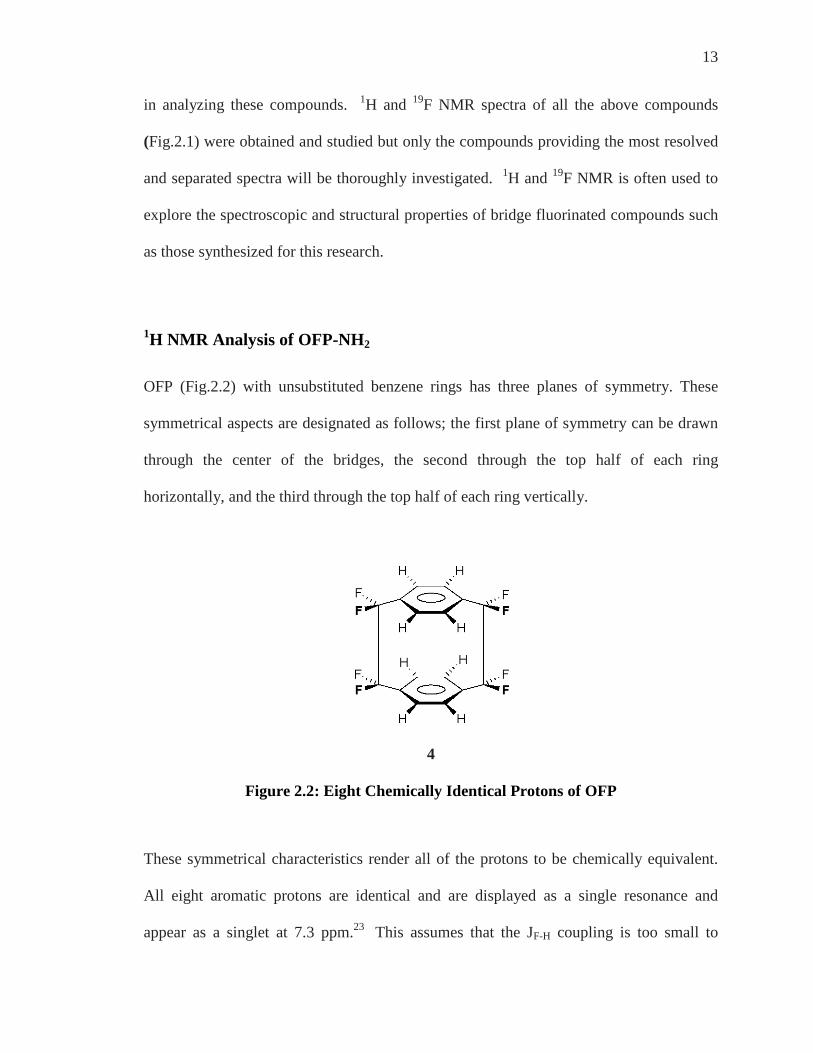
OFP (Fig.2.2) with unsubstituted benzene rings has three planes of symmetry. These
symmetrical aspects are designated as follows; the first plane of symmetry can be drawn
through the center of the bridges, the second through the top half of each ring
horizontally, and the third through the top half of each ring vertically.
4
Figure 2.2: Eight Chemically Identical Protons of OFP
These symmetrical characteristics render all of the protons to be chemically equivalent.
All eight aromatic protons are identical and are displayed as a single resonance and
appear as a singlet at 7.3 ppm.23 This assumes that the JF-H coupling is too small to
14
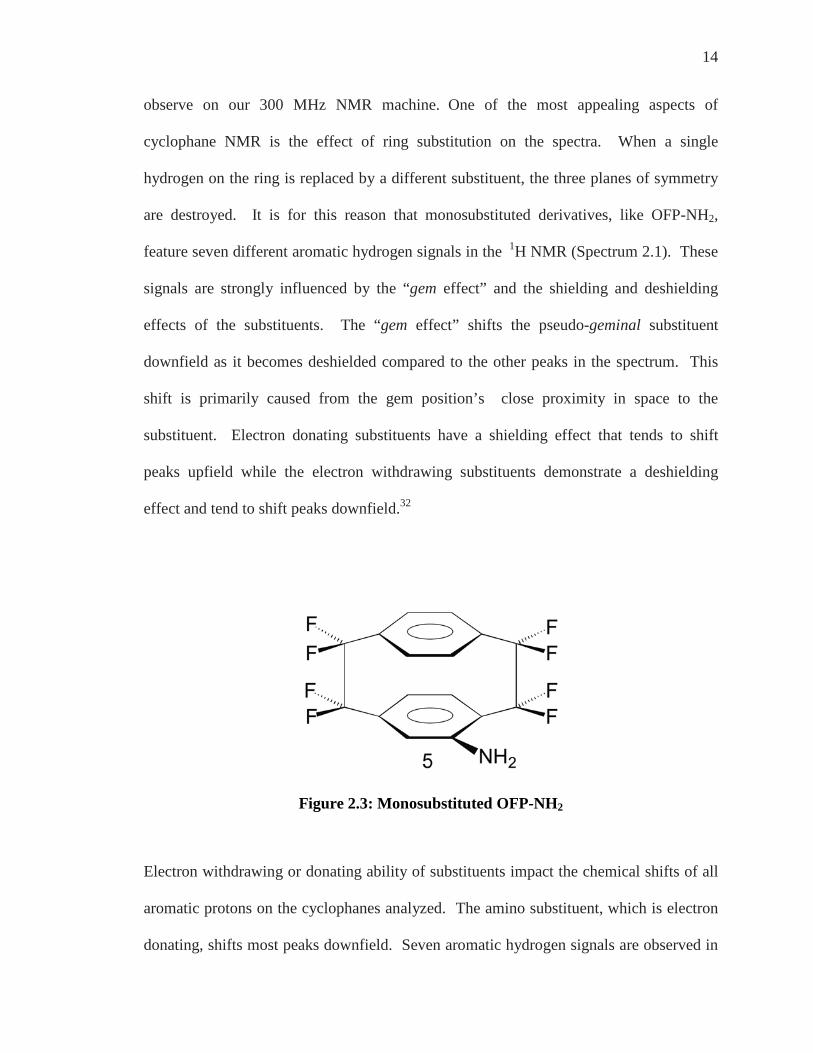
observe on our 300 MHz NMR machine. One of the most appealing aspects of
cyclophane NMR is the effect of ring substitution on the spectra. When a single
hydrogen on the ring is replaced by a different substituent, the three planes of symmetry
are destroyed. It is for this reason that monosubstituted derivatives, like OFP-NH2,
feature seven different aromatic hydrogen signals in the 1H NMR (Spectrum 2.1). These
signals are strongly influenced by the “gem effect” and the shielding and deshielding
effects of the substituents. The “gem effect” shifts the pseudo-geminal substituent
downfield as it becomes deshielded compared to the other peaks in the spectrum. This
shift is primarily caused from the gem position’s close proximity in space to the
substituent. Electron donating substituents have a shielding effect that tends to shift
peaks upfield while the electron withdrawing substituents demonstrate a deshielding
effect and tend to shift peaks downfield.32
Figure 2.3: Monosubstituted OFP-NH2
Electron withdrawing or donating ability of substituents impact the chemical shifts of all
aromatic protons on the cyclophanes analyzed. The amino substituent, which is electron
donating, shifts most peaks downfield. Seven aromatic hydrogen signals are observed in

15
the 1H NMR spectrum of OFP-NH2, like all mono substituted OFP derivatives, but there
is also a signal that stems from the protons from the amino substituent (-NH2).
Spectrum 2.1: 1H NMR Spectrum of OFP-NH2
The aromatic hydrogen signal that appears at approx. 5.9 ppm (Spectrum 2.1) was
predicted to be the singlet from the ortho proton. The ortho proton would be the only aryl
proton to not have a 3JH-H coupling as the amino substituent is located three bonds away.
A sharp singlet would be observed from this proton only. Like most 1H NMR spectra of
paracyclophane derivatives, the doublet that is shifted furthest downfield should stem
from the gem proton, which is transannularly adjacent to the functional group. This
effect stems from that particular substituent being affected through the close proximity in
space to the amino group, or other, substituent.4
Splitting patterns for NMR are often seen as with varying peak multiplicity (doublets,
triplets, etc.), however, when the chemical shift difference in Hertz is of the same order

16
as the J coupling, new patterns in the spectrum are revealed. These patterns are most
often seen as a leaning of a pair of doublets towards one another. The resultant pairs of
doublets are referred to as an AB system. The AB designation is used to indicate the
closeness in chemical shift of the two nuclei as A and B are close to each other in the
alphabet. (Other letters may be used to indicate an increased difference in chemical shift
such as an AX system where X can be any letter of the alphabet. The further from X=B,
the increased difference in chemical shift). Figure 2.4 demonstrates how a decrease in
the J coupling constant can bring the AB quartets closer to one another.34 AB quartets are
seen in the 1H and 19F NMR spectra of OFP derivatives and will appear in spectra
throughout this thesis.
Figure 2.4: AB Pattern Diagram 34

17
1H NMR of OFP-diNH2 For the compounds studied here, if a second substitution takes place on the unsubstituted
ring, the substitution reintroduces an element of symmetry. Shown in Fig. 2.5 are the
three isomers that are formed from this additional substitution.
Figure 2.5: Di-NH2 Derivatives: pseudo meta, pseudo para, pseudo ortho
1H spectra of ortho’ diNH2 show one singlet at approximately 6.78 ppm and two
doublets, one at approximately 6.40 ppm and one at 6.94 ppm (Spectrum 2.2). The three
peaks that are shown stem from the aromatic ring protons. The amino peak that is not
shown, would be further upfield at approximately 5.25 ppm. The 1H NMR of the
pseudo ortho derivative (Fig. 2.5c) is shown in Spectrum 2.2.

18
Spectrum 2.2: 1H NMR of OFP-diNH2
A prime example of an AB quartet is seen in Spectrum 2.2. The doublet that appears at
6.40 ppm and the doublet at approximately 6.94 ppm arise from adjacent protons on the
aromatic ring of OFP-NH2. Doublets slope towards one another, which is typically a
characteristic of an AB pattern.
19F NMR Analysis of OFP-NH2
The unsubstituted OFP molecule has the three planes of symmetry discussed earlier in the
1H NMR section. It is due to this symmetry that all eight bridge fluorines are chemically
equivalent and therefore give a single signal which is a singlet (if the JFH is too small) in
the 19F NMR at approximately δ = –117 ppm.

19
Spectrum 2.3: 19F NMR of OFP
Once again, the substitution of an amino group for an aromatic ring hydrogen destroys all
of the symmetry and renders all eight fluorines as both chemically and magnetically
different (eight fluorine signals).
Figure 2.6: anti and syn Fluorines Indicated on OFP-NH2
The 19F NMR spectrum of OFP-NH2 has many peaks spread out in a very small area
spanning from approximately -105 to -120 ppm with 2JF-F values of about 240 Hz. This
full spectrum is shown below (Spectrum 2.4).

20
Spectrum 2.4: 19F NMR Spectrum of OFP-NH2
For analysis, the spectrum needs to be expanded to reveal the information contained in
this concentrated spread of peaks (Spectrum 2.5). The integration of 1:1:2:1:3 is shown
in this spectrum and verifies that all eight fluorines are represented. With eight fluorines
giving sixteen peaks, it was evident that each of the bridge fluorines gave rise to a
doublet.

21
Spectrum 2.5: Expanded 19F NMR of OFP-NH2 w/Integration
These eight doublets are members of an AB system and, in actuality, four AB quartets.
The four geminal pairs of fluorines, which give rise to this AB pattern, are shown in Fig.
2.7. Each of the bridge fluorines show a strong coupling to and are split by their geminal
partner (2JFF). It is because of this splitting that each fluorine gives rise to a doublet in the
spectrum. The splitting patterns and coupling constants are in place such that an AB
pattern is present.

22
Figure 2.7: The Four AB quartets of OFP Derivatives
As depicted in Figure 2.7 the four AB quartets consist of each pair of bridge fluorines,
F-1s and F-1a, F-2s and F-2a, etc. It is the strong coupling of each fluorine to its geminal
fluorine partner that gives rise to these eight doublets (four AB quartets).
Spectrum 2.6: 19F NMR of OFP-NH2
Splitting Spectrum 2.6 into two parts by dividing it at -114 ppm, two AB quartets will be
present in each of the two halves. The quartets that are furthest upfield from -115 to -119
ppm are almost perfectly symmetrical with the two doublets that are more shielded
sloping away from each other and the two deshielded doublets doing the same but having

23
a greater difference in peak intensity. The half of the spectrum that is furthest downfield
also has a pair of AB quartets that are slightly less obvious to identify the coupled
doublets initially.
One doublet in Spectrum 2.6 appears as a doublet of doublets but none of the other
doublets show this effect. Upon assignment of the doublets at -109 to -110 ppm, it was
shown that particular fluorine atom showed a strong coupling to its geminal fluorine but
it also had a weaker coupling to a vicinal fluorine on the bridge. The strong coupling
results in the doublet and that doublet is split into a doublet of doublets by the weaker
coupling to the vicinal fluorine.
The 19F NMR of the disubstituted analog displays eight peaks. The increase in symmetry
results in the F-1s and F-1a being equivalent to F-9s and F-9a. Also, F-2a and F-2s are
equivalent to F-10a and F-10s. The four resultant doublets visible in this spectrum each
arise from the two different geminal pairs of fluorines on the bridge.
6
Figure 2.8: anti and syn Fluorines Indicated on ortho’ OFP-diNH2
The four doublets are more specifically, two AB quartets. From this spectrum it also
appears that the doublet that is furthest downfield at -108 ppm is a doublet of doublets
(Spectrum 2.7). F-1s shows the same splitting patterns as the mono substituted analog.

24
So the two fluorines at that particular position on the bridge will be strongly split by their
geminal partner but will also show a weaker coupling and therefore smaller splitting to a
vicinal fluorine.
Spectrum 2.7: 19F NMR of ortho’ OFP-diNH2

25
Chapter 3: Unambiguous Atomic Assignment of the 1H,13C, and 19F
NMR for OFP-NH2
NMR characterization of cyclophanes has been of major analytical importance to organic
chemists for many reasons including those discussed earlier in this thesis. Previously, the
NMR of these cyclophanes had been used for structural confirmation but individual
unambiguous atomic assignments were not yet assigned. The research presented here led
to a change in that reality. Designation of these unambiguous assignments was
accomplished with several NMR experiments, 1D and 2D, COSY and HETCOR
performed on a Varian 300 MHz NMR machine. These findings were further verified
with additional NMR experiments, Nuclear Overhauser Effect (nOe) performed on a
higher field NMR machine, which also had multiple high field channels. The work
discussed here was published in the journal of Magnetic Resonance in Chemistry in 2005.
Much of the research contained in this chapter is taken from that paper.35
1H and 13C NMR assignments OFP is a symmetrical molecule as discussed in chapter two and the addition of any ring
substituent gives rise to chemically non-equivalent nuclei and therefore more complicated
spectra. Similar effects are seen for all the nuclei studied i.e., 1H, 19F, and 13C, and each
will be analyzed in this thesis.
4-Amino-1,1,2,2,9,9,10,10-octofluoro[2.2]paracyclophane, (OFP-NH2), is the resulting
compound when an amino substituent is added to one of the rings. This amino
substitution affects the NMR spectra for all of the nuclei on the compound. The once

26
chemically equivalent nuclei are now all distinctly unique. The rest of this chapter will
give insight into the experimentation and analysis that allowed for the unambiguous proof
of which atom gives rise to which peak for each of the atomic nuclei in OFP-NH2.
Figure 3.1: Chemically Different Atoms of OFP-NH2
There are eight chemically different hydrogen and fluorine atoms and sixteen different
carbon atoms in one molecule of OFP-NH2. Analysis begins with the hydrogen
assignments. As well as the usual numbering of the hydrogen atoms (Fig. 3.2) the eight
chemically different hydrogens are given specific name designations.
Figure 3.2: Numbering Scheme and Aryl Positions for OFP-NH2
Hydrogen-5 (H-5) is deemed the ortho position, H-7 the para position, and H-8 the meta
position. As the identification moves to the upper deck, the protons are labeled with the

27
same name but now with a prefix of pseudo. H-12 is the pseudo ortho (ortho’), H- 15
pseudo meta (meta’), and H-16 pseudo para (para’). The last proton that is located
directly above the amino substituent, H-13, is given the position name of pseudo gem ,the
geminal or “twin” position. The pseudo gem proton may also be simply referred to as the
gem proton as there is no gem position on the lower ring for comparison. The latter
naming will be used throughout this thesis.
The eight chemically different hydrogens give rise to the 1H NMR spectrum of OFP-NH2
(Spectrum 3.1).
Spectrum 3.1: 1H NMR of OFP-NH2 d6-Acetone
The ten peaks in Spectrum 3.1 could be presumed and explained as one peak from each
of the chemically different hydrogens and one from the solvent (along with the expected

28
deuterated acetone solvent peak, 1.99 ppm, and dissolved water, 2.79 ppm) but which
peak arises from which Hydrogen?
Spectrum 3.2: Expanded 1H NMR of OFP-NH2
An expanded view of 1H NMR of OFP-NH2 (Spectrum 3.2) shows an integration of
1:1:2:1:1:1:2 for a total of nine hydrogens. The integration at approximately 6.80-7.15
ppm is resultant of the two doublets under that integration curve but the only other peak
with integration of two is seen at approximately 5.4 ppm. This peak, which is a broad
singlet, could only be derived from one possible signal, the nitrogen’s protons. The two
hydrogens that are a part of the amino substituent are the only two hydrogens that are
chemically equivalent and therefore would be interpreted by NMR to give a single signal
with integration of two. Therefore, this broad singlet must be derived from the amino
hydrogens, green dot above it. The other singlet at approximately 5.9 ppm has an
integration of one. The only hydrogen on the molecule anticipated to be a singlet with an
integration of one would be the ortho hydrogen (H-5). The ortho hydrogen does not have

29
any adjacent neighbors to couple to or be split by and so a single signal, a singlet, would
arise only from the ortho hydrogen, light blue dot above it.
Spectrum 3.3: Expanded 1H NMR of OFP-NH2 With Some Proton Designations
One other signal can be assigned just upon inspection; the doublet that appears at
approximately 7.8 ppm with an integration of one would arise from the gem position
hydrogen. The gem shift would shift this positioned proton downfield, because of the
deshielding of this nucleus, and away from the other aromatic proton signals and would
have to be this doublet. The doublet arises from the splitting of the gem position proton,
red dot above it, with the pseudo ortho proton.

30
13C NMR spectrum of OFP-NH2
There are sixteen chemically different carbons and four different types of carbons on
OFP-NH2. The four red carbons are positioned on the bridge and described as bridge
carbons. The four blue carbons are designated as bridgehead carbons. The green carbons
are on the aromatic ring and form C-H bonds and the light blue carbon is also on the ring,
shown, but forms a C-N bond.
Figure 3.3: Carbons of OFP-NH2
These sixteen carbons give rise to the 13C NMR spectrum below (Spectrum 3.4). The 13C
NMR spectrum of OFP-NH2 shows that most of the peaks are located between 110 - 140
ppm.

31
Spectrum 3.4: 13C NMR of OFP-NH2
Expanding the spectrum in this area can allow for clear investigation.

32
Spectrum 3.5: Expanded 13C {1H} NMR of OFP-NH2

33
Spectrum 3.6: Expanded 13C {1H} NMR of OFP-NH2 (color coded)
Chemical shifts, intensity, and apparent coupling allowed for initial peak approximations
that correlate to the distinct positions on this structure. The carbon attached directly to
the nitrogen (C-4) is located furthest downfield at approximately 147.8 ppm as this
carbon is deshielded and has a light blue dot above it. The four bridge carbons are
located between 119.0-120.2 ppm and have red dots above them. The blue dots indicated
the bridge head carbons and are found in the region of 134-137 ppm and one further
upfield at approximately 116 ppm. The aromatic carbons give rise to the most prominent
peaks on the spectrum and are designated with a green dot above them. In order to
analyze these peaks, isolated expansions will need to be shown. Both Spectra 3.6 and 3.7
are proton decoupled, {1H}, and this allows for the proton coupling to be eliminated so

34
that the carbon-fluorine coupling can be explored. Decoupling is the result of continually
exciting the coupling nuclei, which eliminates the coupling interactions to the detected
nuclei.
Spectrum 3.7: Expanded 13C {1H} NMR of OFP-NH2-Bridgehead Carbons
Bridgehead carbons give rise to triplets spread out through 136.3-133.9 ppm three triplets
are present, each stemming from one of the bridgehead carbons. Each of these carbons is
two bonds away from two fluorines and thus is presented as a triplet. Carbon-3 is in blue
above and two bonds away from the two blue fluorines. This carbon would also be two
bonds away from the meta hydrogen and the splitting would be more complex so this is
the reason for the decoupled experiment. The triplet at approximately 135.8 ppm appears

35
as a true triplet but the other two triplets are actually overlapping and appear to be a
quartet but are in fact two triplets.
Spectrum 3.8: Expanded 13C {1H} NMR of OFP-NH2 coupling
Various forms of 3JF-C coupling are seen in this most interesting spectrum. The apparent
quartet at approximately 132.1 ppm is in actuality a doublet of doublets. Each of the
fluorines on a bridge carbon will both couple to a carbon that is three bonds away
resulting in a doublet. Because the coupling of the two fluorines with the same carbon
atom are similar but not exactly equal, the peaks overlap slightly to give what would at
first glance be a quartet. If the coupling of these two doublets had been equal, then a
triplet would have been observed.

36
The doublet at approximately 130.5 ppm stems from Carbon-15 (established later). Due
to the slight rotation of the upper deck ring upon bottom deck substitution, the upper deck
rotates slightly away from the substituent and affects the coupling of Carbon-15 to each
of the fluorines on Carbon-1. This allows for the Karplus equation to be applied to this
specific carbon. The geometry of the slightly rotated carbon forms a dihedral angle of
approximately 1800 to one fluorine and approximately 900 to the other. The carbon-
fluorine coupling for the 1800 angle will be approximately 7 Hz and will result in a
doublet. The carbon-fluorine coupling for the dihedral angle close to 900 will have close
to a 0 Hz coupling and so no splitting will be observed from this coupling. C-15 is
presented as one signal, which is the only apparent doublet in Spectrum 3.8. Two
triplets, one at approximately 128.2 and one at 129.2 ppm, are the result of aromatic ring
carbons coupling to two geminal fluorines. Each fluorine couples to one carbon slightly
differently and a triplet is observed from each carbon.

37
Spectrum 3.9: Expanded 13C {1H} NMR of OFP-NH2
Tripletesque peaks indicated with a red dot in Spectrum 3.9 are formed from 1JF-C
coupling of bridge carbons to their attached fluorines, each one bond away. They are
imperfect triplets because there is also a 2JF-C coupling being detected and shown in the
signals. Various 3JF-C coupling from ring carbons and geminal fluorine pairs are indicated
with a green dot above. All of these spectra presented so far help with conformational
analysis but few of them can give unambiguous atom to peak assignments.
The 13C{1H} spectra were examined so far, but further investigation by decoupling the
fluorine signals allowed new information to be revealed.

38
Spectrum 3.10: 13C {19F} NMR of OFP-NH2
Fluorine decoupling now allows for carbon-hydrogen coupling to be explored. A
concentrated area of peaks is seen between 118-136 ppm and this region will need to be
expanded for analysis.

39
Spectrum 3.11: Expanded 13C {19F} NMR of OFP-NH2
3JC-H allows for all of the bridgehead carbons to be split by two hydrogens that are each
three bonds away and result in a triplet, indicated with blue dots in Spectrum 3.11. The
only exception is C-6, which is three bonds away from one hydrogen and three bonds
away from the amino group’s nitrogen. C-6 will result in a doublet and is indicated with
a green dot at approximately 136.0 ppm.

40
Spectra 3.7 & 3.11 Overlapped
Overlapping Spectra 3.7 and 3.11 allows for comparison of the peaks at approximately
136 ppm. In Spectrum 3.7, on top , the signal in this region resulted in a triplet, this
NMR experiment was {1H} so only F-C coupling is observed. That same region in the
bottom spectrum shows a doublet. The bottom spectrum was {19F} and only C-H
coupling was observed which resulted in a doublet. The multiplicity seen with the
decoupled experiments could only arise from the C-6 carbon and therefore the C-6
carbon can be unambiguously assigned.

41
Spectrum 3.12: Expanded 13C {19F} NMR of OFP-NH2
There are seven signals spread out between 127.0-133.5 ppm in Spectrum 3.12. Those
signals appear to be five doublets and two singlets. Taking the relative coupling
constants into consideration the doublets and singlets can be matched to form pairs of
doublets.

42
Spectrum 3.13: Expanded 13C {19F} NMR of OFP-NH2 (Doublets)
Two singlets appear in Spectrum 3.13 and they can be identified by the relative coupling
constant to find that they are a doublet. This doublet arises from the 1JC-H coupling of
Carbon-8 to the attached hydrogen, H-8, and is marked in blue in Spectrum 3.13. The red
marked peaks are not just doublets but doublet of doublets, which arise from both the
1JC-H and the 3JC-H coupling of the C-5 and C-7 to their adjacent hydrogen and the
hydrogen that is three bonds away.

43
Spectrum 3.14a: Expanded 13C {19F} NMR of OFP-NH2
Aryl carbons appear in the spectrum from 115.4-124.2 ppm (Spectrum 3.13). Complex
peaks revealed in Spectrum 3.13 can be assigned using the previous technique.

44
Spectrum 3.14b: Expanded 13C {19F} NMR of OFP-NH2 (Doublets)
The doublets above arise from the aryl carbons 1JC-H and 3JC-H coupling and are paired
based on coupling constants. There are actually three doublets of doublets shown in
Spectrum 3.14.

45
Spectra 3.8 & 3.13 Overlapped
Overlapping Spectra 3.8 and 3.13 allows for comparison of the peaks, doublets, which
are furthest downfield in each of these spectra. In Spectrum 3.8, only C-F coupling is
observed as it has been proton decoupled. This gives a doublet of doublets as two
geminal fluorines each with slightly different coupling split this carbon. In Spectrum
3.13, on the bottom, the fluorines have been decoupled and now a doublet is seen. This
doublet stems from the carbon being coupled to and split by a singlet adjacent hydrogen.

46
The only carbon that could display this type of splitting pattern is C-8 and therefore it is
unambiguously assigned.
Figure 3.4: Unambiguously Assigned Atoms of OFP-NH2 (at this point)
Correlation Spectroscopy (COSY) Using these known atoms there is a method that can be applied to correlate one known
signal to another unknown. Correlation Spectroscopy (COSY) relates peaks from like
atomic nuclei that exhibit coupling to each other. The NMR machine can be set to
identify specific coupling such as correlating hydrogens that are three bonds away from
each other by utilizing a 1H/1H COSY using 3JH-H = 8 Hz, for example. The gem position
hydrogen, H-13, is known as of this point and COSY can give the ortho’ peak as well
(Fig. 3.5).
47
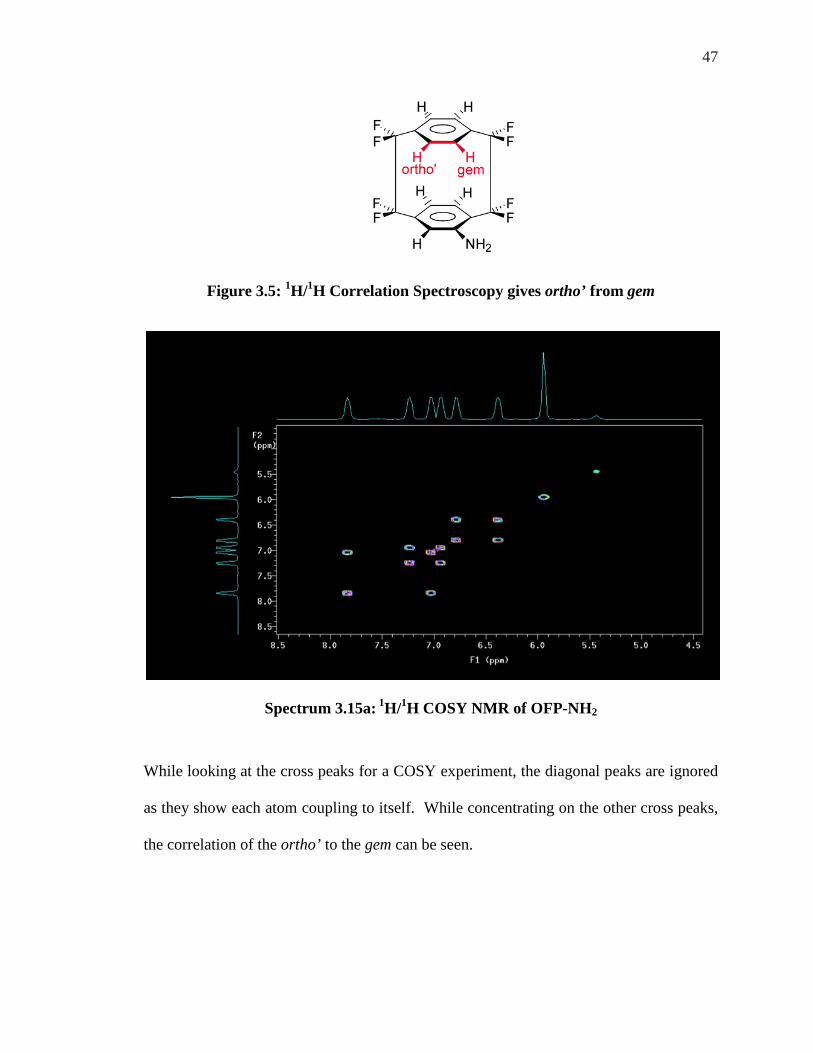
Figure 3.5: 1H/1H Correlation Spectroscopy gives ortho’ from gem
Spectrum 3.15a: 1H/1H COSY NMR of OFP-NH2
While looking at the cross peaks for a COSY experiment, the diagonal peaks are ignored
as they show each atom coupling to itself. While concentrating on the other cross peaks,
the correlation of the ortho’ to the gem can be seen.
48
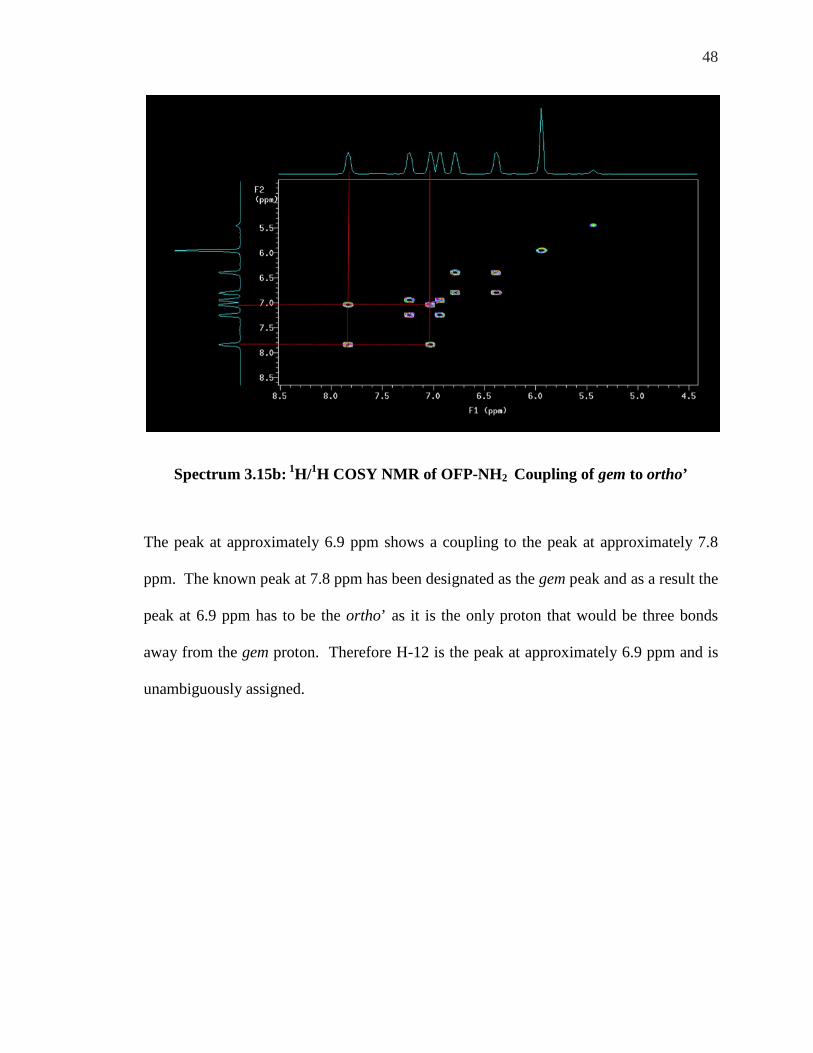
Spectrum 3.15b: 1H/1H COSY NMR of OFP-NH2 Coupling of gem to ortho’
The peak at approximately 6.9 ppm shows a coupling to the peak at approximately 7.8
ppm. The known peak at 7.8 ppm has been designated as the gem peak and as a result the
peak at 6.9 ppm has to be the ortho’ as it is the only proton that would be three bonds
away from the gem proton. Therefore H-12 is the peak at approximately 6.9 ppm and is
unambiguously assigned.

49
Spectrum 3.15c: 1H/1H COSY NMR of OFP-NH2: Atoms and 3JH-H Coupled atoms.
Couplings of the meta to the para hydrogen and also the meta’ to the para’ hydrogen are
evident from the COSY in Spectrum 3.15. Although the pairings are identified, the
assignments of these aromatic protons required further investigation. At this point, the
following pairs are known (Spectrum 3.16).

50
Spectrum 3.16: Paired Protons of OFP-NH2
A similar experiment can be used to help to clarify the assignments of different nuclei.
Heteronuclear Correlation (HETCOR) allows for such an experiment to be completed by
correlating two different nuclei through their coupling interactions. Known hydrogens
can now reveal attached carbons and known carbons attached hydrogens. Using a
HETCOR optimized for 1JC-H = 140 Hz these correlations can be determined.

51
Spectrum 3.17a: C-H HETCOR (1JC-H= 140 Hz)
There are no diagonal peaks in a HETCOR experiment as spectra of different nuclei line
each of the axes here Spectrum 3.17a. Upon inspection of Spectrum 3.17b there is a clear
correlation of the 1H NMR peak at approximately 7.18 ppm to the 13C NMR peak at
about 128.4 ppm just as there is a correlation of the 1H peak at approximately 7.96 ppm
to the 13C peak at about 123.1 ppm.

52
Spectrum 3.17b: C-H HETCOR Known H’s Give Unknown C’s
The known gem hydrogen at approximately 7.96 ppm is correlated to the gem position
Carbon, C-13, at approximately 123.1 ppm. The known ortho’ hydrogen peak at
approximately 7.18 ppm is coupled to the carbon at approximately 128.4 ppm which
must be the ortho’ Carbon, C-12. At this time, known carbons can give previously
unassigned hydrogens.

53
Spectrum 3.17c: C-H HETCOR Known Carbons Give Unknown Hydrogens
The known meta carbon at approximately 132.4 ppm shows a coupling to the hydrogen at
approximately 6.86 ppm so that hydrogen must be the meta hydrogen, H-8. The
unambiguously assigned atoms that are known at this point are shown in Fig. 3.6.
Figure 3.6: Known Atomic Assignments At This Point

54
The atoms in red on the left side diagram were known and using C-H HETCOR 1JC-H , the
blue atoms were assigned. The atoms in green on the right side were all determined
using 1H/1H COSY. The pink atom was determined using 1JC-H HETCOR.
Three addition carbon assignments can be determined from the gem proton. Optimizing a
3JC-H HETCOR for 8 Hz can give each of the carbons that are three bonds away from the
gem proton (Fig. 3.7). Implementing this experiment gives Spectrum 3.18.
Figure 3.7: gem Hydrogen Gives Three Carbons Through 3JC-H =8Hz

55
Spectrum 3.18a: 3JC-H HETCOR
The known gem hydrogen is, once again, seen at approximately 7.96 ppm couples to
three carbons that are each three bonds away.

56
Spectrum 3.18b: 3JC-H HETCOR gem Hydrogen to Corresponding Carbons
As seen in Spectrum 3.18b the gem hydrogen couples to the C-1, C-11, and C-15
carbons. From the indicated regions of carbons in Spectrum 3.6, the carbons can be
assigned according to their chemical shift region. Therefore C-1, C-11 and C-15 can be
unambiguously assigned. This same technique was utilized to complete the assignment
of the other atoms.
Figure 3.8: Completed Assignment of Hydrogen and Carbons of OFP-NH2

57
The red atoms were all already known and the blue atoms were assigned using C-H
HETCOR 3JC-H. The pink hydrogens were assigned from C-H HETCOR but now with
1JC-H. The 1H assignments in Spectrum 3.19 are in full agreement with all 1D, COSY and
HETCOR experiments!
Spectrum 3.19: Fully Assigned 1H NMR for OFP-NH2

58
Spectrum 3.20: Complete 13C {1H} NMR Assignments of OFP-NH2
The complete 13C {1H} NMR assignments of OFP-NH2 in Spectrum 3.20 are all in
agreement with 1D, COSY and HETCOR experiments so the unambiguous assignments
of all carbons and hydrogens are complete. These unambiguous assignments assist in the
assignment of the fluorine atoms.
19F Assignments of OFP-NH2 As described earlier introduction of the amino, or any, substituent to the OFP molecule
makes each of the eight formerly chemically identical fluorines now each chemically
unique. This monosubstitution affects the 19F NMR spectrum and now instead of one
single peak there are sixteen peaks generated from the eight fluorines.

59
The sixteen peaks are in fact eight doublets and are indicated with blue slashes in
Spectrum 3.21.
Spectrum 3.21: 8 Doublets of 19F NMR of OFP-NH2
Each doublet arises from a single fluorine coupling to another fluorine attached to the
same carbon atom. In order to identify which fluorine corresponds to which doublet 19F
COSY was implemented.

60
Spectrum 3.22: 19F/19F COSY of OFP-NH2
The full 19F/19F COSY of OFP-NH2 is shown in Spectrum 3.22 but in order to investigate
this spectrum’s information, expansion of each half of the spectrum will need to be
explored.
Spectrum 3.23 shows a coupling of the doublet with peaks at approximately -114.8 and -
115.8 ppm with the peaks at approximately -118.4 and -119.2 ppm. Also the peaks at
approximately -116.3 and -117.2 show a coupling to the peaks at -118.0 and -117.6 ppm
pairing another set of doublets.

61
Spectrum 3.23: Right Side Expansion of 19F/19F COSY of OFP-NH2
These couplings show that the outside two doublets are coupled to each other and
indicated with yellow slashes while the inner two doublets are coupled to each other and
indicated with burnt sienna dashes. Pairing of the doublets was evident upon initial
inspection of the spectrum but the COSY experiment legitimized this presumption.

62
Spectrum 3.24: Left Side Expansion of 19F/19F COSY of OFP-NH2
The initial inspection of these peaks did not lead to a quick analysis as it did with the
right hand side of the spectrum. The off diagonal peaks shows coupling from the peaks
at -106.0 and -107 ppm with the peaks at -112.2 and -113.0 ppm. These paired doublets
are indicated with pink slashes. Peaks of -108.4 and -109.3 ppm couple to peaks at
-112.9 and -113.8 ppm and are indicated with purple slashes.

63
Spectrum 3.25: Designated Geminal Fluorines in the 19F of OFP–NH2
Two AB quartets coming from each bridge are color coded in Spectrum 3.25.
Determining which fluorines are attached to which carbon can be achieved with F-C
HETCOR experiments. Heteronuclear correlation set for 2JF-C =27 Hz will give fluorines
that are two bonds away from each carbon.
Figure 3.9: 2JF-C =27Hz HETCOR: Known Carbons Give Two Unknown Fluorines
The known 13C spectrum running along the Y-axis of spectrum will show a correlation to
the fluorine pairs on the X-axis.

64
Spectrum 3.26: 2JF-C =27Hz HETCOR of OFP-NH2
The known bridgehead carbons will give two fluorines each. The correlation of these
carbons to the fluorine doublets is revealed in Spectrum 3.27.

65
Spectrum 3.27: 2JF-C HETCOR Known Carbons to Fluorine Doublets
As C-3, C-6, C-11 and C-14 are already known, the above spectrum indicates correlation
of these peaks to the pairs of fluorines. It can be seen above that C-3, at approximately
116.2 ppm can be correlated to the fluorines at -106.2 and -107.2 ppm and -112.4 and
-113.2ppm. C-14, at approximately 134.2 ppm, shows a coupling to the fluorines at
approximately -108.4 and -109.4 ppm and -112.8 and -113.8 ppm. C-6, at approximately
-136 ppm, shows a coupling to the fluorines at -114.8 and -115.8 ppm and -118.4 and
-119.4 ppm.

66
Spectrum 3.28: 2JF-C HETCOR Known Carbons to Fluorine AB quartets
Finally, C-11, at approximately 135.0 ppm, shows coupling to the fluorines at -117.2 and
-118.2 ppm and 117.4 and -118.4 ppm. Spectrum 3.28. Each fluorine pair has been
coupled to its geminal neighbor and each pair has been paired with a vicinal neighbor, but
which fluorine is anti and which is syn?
Figure 3.10: Pairs of Fluorines on Each Carbon

67
Spectrum 3.29: Known Fluorine AB Quartets
Karplus Equation Distinguishing between anti and syn fluorines was accomplished with the implementation
of the Karplus equation. Due to the fixed geometry of the rigid OFP skeleton, the
Karplus equation could be employed to the 3JF-C coupling.38 The Karplus equation allows
for large and small 3JF-C coupling as governed by the dihedral angle, φ. When φ is close
to a 180° angle there is a large coupling seen at about 7 Hz. When φ is close to a 90°
angle there is a small coupling constant that is very close to 0 Hz(Fig. 3.11.).

68
Figure 3.11: Karplus Equation Coupling Constant
Spectrum 3.30: Pairs of Fluorine with 3JF-C = 7 Hz
Utilizing 3JF-C with a coupling constant optimized at 7 Hz could finally differentiate
between the pairs of fluorine by providing the anti, with respect to the substituent,
fluorines on the molecule. C-13 gave the anti fluorine at -112 ppm. C-4 gave the anti
CF
F
F
F
F
F
F
F
NH2
CF
F
F
F
F
F
F
F
NH2φ = close to 180o
= large coupling ~ 7Hz
φ = close to 90o
= small coupling ~ 0 Hz

69
fluorine at approximately -113 ppm. C-16 gave the anti fluorine at approximately -116
ppm and C-5 gave the anti fluorine at -188.6 ppm.
The anti designations then allowed for the unambiguous assignment of the syn partners.
At last, all of the fluorines have been unambiguously assigned.
Figure 3.12: Assigned Fluorines for OFP-NH2
Spectrum 3.31: Assigned Fluorines for OFP-NH2

70
Assignments Confirmed by nOe Experiments
The findings in this thesis were all conducted on a 300 MHz machine with traditional 1D,
COSY, and HetCor experiments. All of these were verified by nOe experiments using a
400 MHz machine at DuPont by Alexander A. Marchione. The figure above indicates
the assignments with the 400 MHz machine. A brief explanation of Marchione’s analysis
is given here.
Spectrum 3.32: Expansion of the 400 MHz 19F NMR spectrum of OFP-NH2 with assigned Fluorines (Spectrum 3.32 reproduced from reference 35 with permission
from the authors)

71
Spectrum 3.33: Expansion of F-H HOESY of OFP-NH2 (Spectrum 3.33 reproduced from reference 35 with permission from the authors)
Beginning with H-5 the only hydrogen with initial clear assignment, it was shown to have
a nOe with F-9s. 19F COSY indicated F-9a and in turn F-9a exhibited a nOe to H-7. A
1H COSY showed an H-7 interaction with H-8. With the lower deck hydrogens
designated, it was found that using the weaker nOe interactions between fluorine and
hydrogen atoms on the same side but on different decks could be used.
Beginning with F-9s, a strong nOe was shown with H-5 and a weaker nOe with H-12, the
hydrogen that was located directly above H-5. Once H-12 was assigned, a 1H COSY was
used to reveal the neighbor, H-13, the geminal position. F-1a displayed a nOe to H-15
and then 1H COSY was used to give H-16. This gave all of the 1H atoms their permanent
assignments. This further proved the assignments of all of the atoms on a molecule of
OFP-NH2.

72
Scheme 3.1: The Protocol for Assigning the Lower Deck Atoms. (Scheme 3.1
reproduced from reference 35 with permission from the authors)
Conclusion Two different methods were used to assign all of the atoms on OFP-NH2. With both of
these experimental methods confirming the same assignments, the first full multinuclear
unambiguous atomic assignments of OFP-NH2 was complete. These results were
published in the Journal of Magnetic Resonance in Chemistry in 2005.35

73
Chapter 4: Chirality and OFP-NH2
For all experiments conducted to determine the enantiomeric discrimination of
compounds, OFP-NH2 and OFP-diNH2, an “in tube” method was utilized. Samples of
each substrate were added to a 5mm NMR tube and solvated in d-chloroform, CDCl3.
To this same tube, varying but increasing equivalents of each chiral shift reagent was
added and coordination occurred in situ. Analysis of the 1H and 19F NMR of the
coordinated species were realized by implementing the 300 MHz Varian NMR machine.
Enantiomeric Differentiation Determination of the enantiomeric excess (e.e.) of organic molecules by NMR can be
carried out by various methods as described by Wenzel and Wilcox.39 These techniques
are based on the formation of diastereomeric entities which give different physical
features and then different spectral characteristics to both enantiomers of a compound.38
Objectives of enantiomeric differentiation include monitoring of the enantiomeric excess
and determination of absolute configuration of a given enantiomer that is isolated from a
mixture. A fundamental theorem in stereochemistry states that chirality can be
recognized only in the presence of a chiral reference.38-40 As NMR spectroscopy is an
achiral method, a chiral environment must be created such that each enantiomer can be
differentiated.
The strategy that has been most exploited, as first recognized from Raban and Mislow in
1965,41 is to use optically pure chiral reagents to distinguish a pair of enantiomers through
the formation of non-equivalent diastereomeric complexes. Diastereomers have different

74
chemical and physical properties from one another and their differentiation is a critical
part of this research.
When a racemic mixture of R and S enantiomers is subjected to a chiral enantiopure
environment, X, as long as they interacted in some fashion whether by coordination,
hydrogen bonding, or covalent bonding, a new species is formed. Species of R---X and
S---X that are the results of this interaction are called diastereomers. When this
interaction occurs, it changes the relationship from enantiomeric, which is
indistinguishable by NMR, to diastereomeric, which is distinguishable by NMR. OFP-
NH2 is a prime example of a molecule that displays planar chirality. The R and S
enantiomers are displayed in Fig. 4.1.
Figure 4.1: R and S Designation of Enantiomers of OFP-NH2
The seemingly trivial difference in these molecules is vitally important to the
pharmaceutical industry as enantiomers of medications can have different
pharmacological effects on the body. As chemical synthesis advances and new
medicines are being developed, the importance of enantiomers and their pharmacology
are being explored. The mechanisms by which they interact with the body’s chemistry

75
have been uncovered/displayed through studies, drug trials and experimentation on both
single enantiomers and racemic mixtures. One of the most devastating effects of the
result of a racemic mixture in prescription medication was the effect of the well-known
drug, Thalidomide.
R S
Figure 4.2: R and S Enantiomers of Thalidomide
Thalidomide, a sedative originally used to treat morning sickness in the 1960’s and
currently in use to treat leprosy and multiple myeloma, is also a teratogen that induces
birth defects in humans such as limb truncations and microphthalmia.42
The R enantiomer quelled morning sickness of pregnant women and served as a sedative,
while the S enantiomer was teratogenic. With the knowledge of these adverse side
effects being directly related to the different enantiomers, the need for enantiopure
medications was imminent. The rapid surge in enantioselective synthesis has since
produced a demand for accurate, reliable and convenient methods for measuring
enantiomeric purity. This is so important that it has been deemed as one of the most
critical facets of chiral chemistry and McCreary et al. reports that, “the direct

76
determination of enantiomeric purity is the central problem in the chemistry of chiral
substances”. 43
One problem exists in the NMR analysis of these enantiomers and this is because
enantiomers are not distinguishable by NMR. Enantiomers can only be distinguished in a
chiral environment. The easiest way to induce this environment is the use of an
enantiopure NMR solvent. However, deuterated enantiopure solvents are an extremely
expensive option and therefore not practical in the research lab. There are more feasible
options which can prove to be not only less expensive but more convenient to use, and
they can give better results. Three options are available that fit this description which
include Chiral Shift Reagents (CSR), Chiral Solvating Agents (CSA), and Chiral
Derivatizing Agents (CDA). Each of these can be used to create a chiral environment
and enable each enantiomer to be detected by NMR as diastereomers.
Diastereomers Induction of a chiral environment within the NMR tube was effectively completed with
the use of several CSRs and one CSA. Both types of chiral reagents form a coordination
bond to the ligand and work in a similar manner.
An example of how useful a chiral reagent can be is demonstrated in Fig. 4.3. The
spectra here show the separation of the D and L enantiomers of the amino acid alanine.
D and L are terms which are commonly used for enantiomers of amino acids as they
relate chiral amino acids, like alanine to its parent molecule, glyceraldehyde.

77
Figure 4.3: Alanine Methyl Group 1H NMR 300 MHz with Acetonitrile-d (a) No CLSR, (b)0.02M Ytterbium(III)Nitrate, (c) 0.05M Ytterbium (III) Nitrate39
The D and L labels have no direct correlation to R and S. However, the D and L
molecules respond similarly to the R and S enantiomers of our compounds and this
separation is a useful example of the effectiveness of a chiral shift reagent.
The methyl hydrogens would give a doublet, Fig. 4.3a, as they are next to a CH group
and the three equivalent hydrogens from the CH3 group are split by the single neighbor
from the CH group. With the addition of 0.02M of Yb(NO3)3 , the peaks becomes broader
and appears to start to become a quartet. With the addition of 0.05M Yb(NO3)3, the peaks
have actually resolved into two doublets with each one coming from each of the isomers
of alanine. The increase in peak height of the right side doublet is caused from the
sample having an excess of the L moiety. Samples with less e.e. would show a
separation of the peaks, but they would be of similar NMR integration.

78
Chiral Lanthanide Shift Reagents One possible way to induce this effect is by the use of Chiral Lanthanide Shift Reagents
(CLSRs). The discovery of the effect that paramagnetic lanthanide ions had on NMR
spectra was one of the most significant developments in the entire field of NMR shift
reagents.44
The first established use of CLSRs to determine enantiomeric purity was reported by
Whitesides and Lewis in 1970.45 Certain lanthanide+3 ions are paramagnetic which cause
NMR perturbations that result in chemical shift effects of coordinated atoms. With
achiral ligands, these are known as Lanthanide Shift Reagents (LSR), but when an
enantiopure chiral ligand is bound to a lanthanide ion, the result is a CLSR. Ln3+ metals
Europium (Eu) and Ytterbium (Yb) are downfield shift reagents while Praseodymium
(Pr), is an upfield shift reagent. With CLSRs the substrate can be thought of as binding
to the coordinately unsaturated metal.44
Figure 4.4: Most Common CLSR’s (Shown in their 1R, 2S form)
Ligands are often tris β-diketonate camphor derivatives. 3-Heptafluorobutyrylcamphor
(1R, 2S) (HFC) derivatives were designated as a useful reagent for these studies as HFCs
R
O
OM
3
R = C3F7 = hfcR =CF3 = tfcR = tButyl = pvc(+) forms shown

79
have shown to be a feasible auxiliary with substrates containing amino substituents. The
heptafluoro groups of this ligand enhances the Lewis acidity of the lanthanide ion and
results in stronger coordination to the substrate. 44 Literature has proven that the CLSR
would display different NMR perturbations for the different enantiomers of the substrate,
and thus allow observation of both enantiomers. OFP-NH2 served as a feasible specimen
for this research.
The basic structure of an OFP-NH2 molecule exhibits planar chirality and therefore exists
as enantiomers (Fig. 4.1). NMR analysis takes place when a single enantiomer of the
CLSR, which has been designated as CLSR[R], was assumed to react with the R and S
substrates of the analyzed species, OFP-NH2. This coordination would result in the
formation of two diastereomers, R-CLSR[R] and S-CLSR[R]. Because diastereomers are
indeed distinguishable by NMR, the newly formed moiety should prove to be able to be
identified as different species from the other. The interaction would take place between
the metal+3 ion of the CLSR and would coordinate with the lone pair of electrons on the
nitrogen of the amino substituent. Coordination of the lanthanide metal and the lone pair
on the nitrogen of the amino group of OFP-NH2 are shown in Figure 4.5.
Figure 4.5: Coordination of CLSR with OFP-NH2

80
Three Ln3+ HFCs were used to analyze their effectiveness. Eu3+, Pr3+, and Yb3+ CLSRs.
These CLSRs were implemented in increasing equivalent concentrations for each sample.
These three were chosen to analyze the effects of both upfield and downfield shift
reagents and to further determine if the direction of field shift affects the resolution of the
NMR spectra.
1H NMR Analysis of OFP-NH2 These experiments were performed for each chiral reagent and both 1H and 19F spectra
were predicted to give good resolution of peaks. Analysis discussed in Chapter 3 allows
for the following peak assignments, which was a crucial stepping-stone for the next
portion of the analysis. The proton assignments are listed in Spectrum 4.1.
Spectrum 4.1: ( revisited) Expansion of the 400 MHz 1H NMR Spectrum of OFP-NH2 with Assigned Protons (Spectrum 4.1 reproduced from reference 35 with
permission from the authors)

81
With the coordination of the CLSR, the 1H spectrum would be expected to resolve into
two sets of peaks, each resulting from one of the two newly formed diastereomers. The
NH2 peak was expected to be the most affected peak on the spectrum, as the lone pair on
the nitrogen would be coordinating directly with the metal ion of the CLSR. The site of
coordination being on the peak at 5.5 ppm should reveal a splitting of this singlet into two
separate singlets. The CLSR metal should dictate the chemical shift of these peaks.
Figure 4.6: Proton Positions for OFP-NH2
With the ortho hydrogen (H-5) being adjacent to the amino substituent, it was predicted
that the singlet produced from this atom would appear to split and become an apparent
doublet, that would in fact be two singlets, again, each arising from one of the two
enantiomers. With through space interactions, it was predicted that the gem hydrogen
(H-13) should also undergo a change in chemical shift. As the gem is shown in the 1H
spectrum as a doublet, two doublets should appear when the CLSR is implemented.
Indeed, all of the peaks should show separation and chemical shift change but these
experiments will indicate where the separation takes place.

82
Spectrum 4.2: 1H NMR OFP-NH2
1H spectra with Ytterbium (Yb) HFC For 1H spectra, Yb-HFC served as a CLSR, as predicted, by bonding with the lone pair
on the nitrogen of the amino group to form diastereomers. This CLSR did exactly what
was predicted of it by giving some anticipated separation of the peaks, but some
unanticipated results were also seen. The ortho peak seen at approximately 5.8 ppm
should have shown some resolution into two distinct singlets.

83
Spectrum 4.3: 1H NMR of OFP-NH2 with 0-1.0 equivalents of Yb-HFC
With as little as half of an equivalent added to the sample, the beginning of
diastereomeric separation began. The singlet from the amino group began to split into
two singlets, each one arising from each of the newly formed diastereomers. This almost
immediate result was expected and predictably appeared as, once again, the CLSR has
coordinated to the amino substituents giving rise to these peaks.

84
Spectrum 4.4: 1H NMR OFP-NH2 with 2-4 equivalents of Yb-HFC
In addition to the amino group peak separation, the gem peaks showed excellent
resolution with the Yb-HFC CLSR. With the initial addition of half an equivalent, the
doublet peaks at approximately 7.8 ppm began to appear to shift downfield. The addition
of a one total equivalent showed the original doublet becoming what appeared to be
triplet. That triplet was in fact the beginning of the resolution of the two doublets that
would be formed and can be seen as early as the addition of three equivalents were
added. Also at this point, the amino peaks have been clearly separated and can be seen to
be moving further and further downfield with each addition. With the addition of four
85
equivalents, the two doublets arising from the gem protons are fully resolved. The amino
singlets have shifted so far downfield that they are now interfering with the ortho
hydrogen peak. These two peaks had fully resolved and demonstrated exactly what was
predicted of them. The ortho peak had been expected to also display similar results and
this singlet shifted downfield as each increasing equivalents was added to the tube and
began to broaden with as little as 1.0 equivalents added. Increasing increments of the Yb
HFC continued to shift the peak downfield and after 4.0 equivalents were added, the
singlet split into a “doublet’ or more correctly, two singlets, each from one of the
diastereomers.
The excellent results from the Yb-HFC were encouraging and other CLSRs were
investigated. The results from the Eu-HFC are discussed next.

86
1H spectra with Eu-HFC
Spectrum 4.6: 1H NMR with 0.5 equivalents of Eu-HFC
With just one half of an equivalent of the Eu-CLSR, the singlet at 4.4 ppm begins to
resolve in what appears to be a doublet. That “doublet” is in actuality a singlet from the
amino substituent of each of the diastereomers. The peak at approximately 6.1 ppm is
non-existent in the original 1H spectrum and grows with each increased equivalent so it
was deduced that it could only arise from the CLSR itself. These effects are clearly
indicated in the 0.5 and 2.0 equivalents spectra.

87
Spectrum 4.7: 1H NMR with 2.0 equivalents of Eu-HFC
With just two equivalents, there was a clear separation of the two singlet peaks at 4.7
ppm. The gem shift peaks at around 7.9 ppm began to show signs of resolution into two
doublets as the peak has become broader and has shifted downfield. More equivalents
may have given the doublet separation that was anticipated. The baseline distortion of
these peaks would not allow for accurate integration so that true quantification of these
peaks could be obtained. In conjunction with the increased enormity of the peak at 6.1
ppm revelation that only further baseline distortion would come from the addition of
more equivalents.

88
19F OFP-NH2 Analysis It was expected that the 19F spectra would be equally as effected as the 1H spectra were
while using the same CLSR. Analyzing the effect of each CLSR with the 19F spectra
should further prove the enantiomeric differentiation. The 19F assignments from Chapter
3 are revisited.
Spectrum 4.8: Expansion of the 400 MHz 19F spectrum of OFP-NH2 with assigned Fluorines (reproduced from reference 35 with permission from the authors)
revisited
Figure 4.7: Fluorine Positions for OFP-NH2
It would be predicted that the F-2a and F-2s peaks would show the biggest chemical shift
change when coordination with the CLSR took place. This is because the ligand would

89
be predictably close in bonds and through space to the F-2 atoms. Using the same
methodology, the F-9a and the F-9s Fluorines should also show some resolution of peaks
as they are proximal to the site of coordination. Also the F-1a and F-1s atoms could
show a chemical shift change as well as coordination takes place on the same bridge side
of the molecule. The only place that would not entirely be expected to have a significant
shift change would be the F-10 atoms as they are the furthest away from the ligand both
through bonds and through space.
For comparative purposes, the Expanded 19F spectrum of OFP-NH2 is shown here.
Spectrum 4.9: 19F NMR OFP-NH2

90
Spectrum 4.10: 19F NMR OFP-NH2 with 0.5 equivalents of Eu-HFC
The F-1s and the F-2s doublets show the largest variation with this CLSR. With the
addition of one equivalent of the CLSR the doublets are beginning to show resolution as
the peaks begin to appear to broaden and overlap. This is the beginning transition that
leads to the enantiomeric peak separation.

91
Spectrum 4.11: 19F NMR OFP-NH2 with 1.0 & 3.0 equivalents of Eu-HFC
With each addition of the CLSR, the peaks in the range of -110 to-107 ppm (F-1s and
F-2s) were still the most responsive to this effect. The doublets began to separate and
become a pair of doublets. Each individual doublet arose from each of the diastereomers.
These doublets were stemming from the same atoms but now had different chemical
shifts.
With the addition of three equivalents, the F-1s and F-2s were resolving into what would
appear to be a quartet. An additional Eu-HFC equivalent showed that the quartet was in

92
fact resolving into two doublets that stemmed from the two different diastereomers. This
was the best result that had been seen at this point and the effect of the Yb-CLSR on the
19F spectra was the next step of this research.
Spectrum 4.12: 19F NMR OFP-NH2 with 1.5-5.0 equivalents of Yb-HFC
The F-1s and F-2s region of these spectra seen between -110 and -107 ppm did begin to
reveal a possibility of good separation. Upon the addition of multiple equivalents, the
peaks did not further resolve and these peaks were minimally affected.

93
Praseodymium (Pr)-HFC Proton NMR analysis with the Pr-HFC CLSR at first appeared to be giving the same type
of resolution of the Amino substituent peak as the Eu-HFC had given. The gem position
peaks also appeared to mimicking the Eu-HFC as well. With several equivalents of the
Pr-HFC, the amino peak began to split was compromised by a hump of a peak at
approximately 4.5 ppm. This CLSR would interfere with the shifts of the analyzed peaks
for this system. The higher the concentration of shift reagent, the more distorted the
spectra became. Analysis of the 19F spectra also proved to no avail as very little to no
resolution was seen and baseline distortion began from -111 to -108 ppm. Further Pr-
HFC exploration was suspended. The spectra for these experiments can be found in the
Appendix.
Chiral Solvating Agents Chiral Solvating Agents are similar to CLSRs as they will interact with the substrate and
form diastereomers. Unlike the CLSR’s co-ordination, these interactions are usually
hydrogen bonding and polarity based. 2,2,2-trifluoro-1-(9-anthryl)ethanol (Pirkle’s
alcohol) is a widely used CSA in part because it’s very effective ability to bond with
Lewis bases such as amino groups.

94
Pirkle’s alcohol Pirkles Difuctional Analogue
Figure 4.8: Pirkle’s Alcohol and Pirkle’s Difunctional Analogue
Trials run with Pirkle’s alcohol showed degeneration of the spectra giving very complex
coupling and therefore very complicated peak revelation. It is for this reason that further
investigation was suspended. The spectra derived from analysis with Pirkle’s alcohol can
be found in the Appendix.
No Chiral Derivatizing Agents were employed in this research, as they form covalent
bonds with the substrate and this type of bonding would have been difficult to remove
from the compounds studied.
Conclusion The Yb-HFC worked very well in discriminating between the enantiomers in the 1H
NMR of OFP-NH2. Baseline separation was achieved for both the amino and the gem
position hydrogens to give true integration and quantification of results. Eu-HFC worked
best for the 19F NMR of OFP-NH2 although the full resolution of peaks was not achieved
for the 19F spectra.
HCF3
HO HCF3
HO
F3CH
OH

95
Chapter 5: Chirality and ortho’-di NH2
Enantiomeric Differentiation of ortho’-di NH2 With the application of the chiral lanthanide shift reagent on the di-substituted pseudo
ortho-di-NH2 molecule, it was expected that the effect of the shift reagent would be
increased, as there could now be two possible sites of coordination. If results were seen
when one amino group was coordinated to the lanthanide ion, then it was predicted that
two amino groups could give even better results. Although it is possible to have two
points of coordination, one at each of the nitrogen’s lone pairs, it is most often seen that
only one coordination per molecule takes place due to the kinetically unstable
conformation of two sites of coordination per molecule.27 Having two possible sites of
coordination in each molecule would statistically increase the likelihood of molecules
coordinating so an increased effect would be presumed.
Spectrum 5.1: 1H NMR of ortho’ OFP-diNH2

96
The 1H NMR of ortho’ OFP-diNH2 in Spectrum 5.1 shows the two doublets and the
singlet that have already been assigned by Roche and Marchione as follows: the para
Hydrogen (H-7) appears as a doublet at 6.38 ppm, the ortho Hydrogen (H-5) is a singlet
at approximately 6.68 ppm and the meta Hydrogen (H-8) appears as a doublet at
approximately 6.98 ppm.32
The proton NMR showed the best results with the mono substituted OFP-NH2 when
coordinated to the Yb+3 HFC CLSR. For this reason, the Yb+3 CLSR was utilized to test
the effects on the disubstituted analog.
Spectrum 5.2: 1H NMR of OFP-di amino with 0.5 and then 0.75 eqs. of Yb-CLSR
With the first addition of 0.5 equivalents, the amino peak began to broaden and the ortho
showed a slight broadening as well. The employment of 0.75 equivalents began to show

97
peak resolution of both the amino and ortho peaks. As these peaks shift downfield, the
base of the amino peak is the most affected as far as line broadening. The ortho peak is
also resolved into two singlets and the effect was most prevalent with the addition of one
equivalent of the Yb-HFC CLSR.
Spectrum 5.3: 1H NMR of di-NH2 OFP with Yb-CLSR
With each increase of the Yb+3 CLSR, the amino peak continued to separate. 1.0
equivalent shows the amino peak resolving but not quite as completely as it was
anticipated to do. The ortho peak, however, has achieved near baseline separation at this
point. With the additional half equivalent, a total of 1.5 eq., the amino peak becomes
even more resolved and the ortho peak, which had baseline separation before, now is

98
shifted downfield and overlapped with other peaks on the spectrum. With only 2.0
equivalents of the chiral reagent, the amino peaks have achieved baseline separation and
the ortho peak has merged with other peaks and is barely detectable at this point. Each of
these new amino singlets was derived from the one original singlet after coordination.
Each singlet arises from each of the enantiomers just as it did with the mono substituted
OFP-NH2.
The most fascinating aspect of this experiment was seen with the ortho peak as it showed
no splitting with the mono substituted OFP-NH2 but did resolve with the di substituted
molecule. As more of the CLSR is added, the ortho peak, at approximately 7.9 ppm,
begins to split. The original singlet is seen in the spectrum with 0.5 equivalents of shift
reagent at approximately 6.7 ppm. With just 0.75 equivalents, the peak already begins to
shift downfield and resolve not into a doublet, but into two singlets at close but different
chemical shifts.
The reason for the splitting of the ortho peak in the di-substituted moiety does not stem
from the proton being solely in the ortho position. In the di substituted derivative, the
ortho site to one of the amino groups is also the gem site to the other amino group!
Figure 5.1: Di substituted Showing ortho as gem

99
As the proton is simultaneously ortho to one amino substituent and gem to the other
substituent, the gem shift effect is being demonstrated at that position. The gem effect is
prevalent as it is a result of the electronic interactions of the molecule. Not only are there
two aromatic rings that are attached in a rigid position, which has profound effects on the
1H NMR before any substitution takes place, but with the addition of an amino group,
which is an excellent lone pair donator, the lone pair of electrons also interact with the
electronics of the rings. This gem shift is seen in the mono substituted OFP-NH2, which
has one of these lone pairs available for donation, and once there is disubstitution of the
amino groups, two lone pairs of electrons are available to interact with the ring. This
electronic interaction allows for the gem position proton to be affected and detected
differently by NMR. These interactions are the reason for the splitting of the ortho peak
in the di amino derivative.
19F NMR of ortho’-di NH2
Although the enantiomeric discrimination of the monosubstituted derivative was not
effective with the 19F NMR spectra, it was expected that the ortho’-di NH2 could
potentially show better results. Experiments were run with the Yb-HFC CLSR which
showed very little effect on the disubstituted analog. The 19F NMR of these trials can be
found in the Appendix.

100
Analysis of Achiral Shift Reagents To indisputably establish the effectiveness of the CLSR in these NMR spectra, it was an
integral part of this research to prove that it was indeed the different enantiomers of OFP-
NH2 that caused the resolution of the peaks and not another reason. One such cause
could stem from the coordination of any Lanthanide Shift Reagent to the lone pair on the
nitrogen. The possibility that any coordination could enable the two hydrogens on the
amino group to somehow behave differently from one another could allow each of these
hydrogens to be detected by NMR to be different entities.
Without any complexation of the amino peak, the hydrogens on the amino group are
chemically equivalent. This gives a single signal as a broad singlet whose broadness is
due to the rotation and exchange of the hydrogens on the amino group with the hydrogens
from the solvent. Upon complexation of the nitrogen with the LSR or bonding with
another chiral reagent, the hydrogens become chemically different to each other and
could potentially give separate NMR peaks.
There are three possible reasons for the splitting of the amino peak in the 1H NMR
spectra. When the achiral LSR is added, the differences in equilibrium and rotation along
with the varying rate of exchange on the “NMR time scale” could give two sharp singlets,
two broad singlets, or one very broad singlet. The NMR time scale is the averaging of
two peaks and is the reciprocal of the difference in the frequency of the peaks. This gives
the time that the frequencies would have to remain distinct in order to be distinguishable
by NMR. This is dependent upon the fixed rigidity of the complex, which can be in
equilibrium with slow rotation or fast equilibrium with rapid rotation or minimal
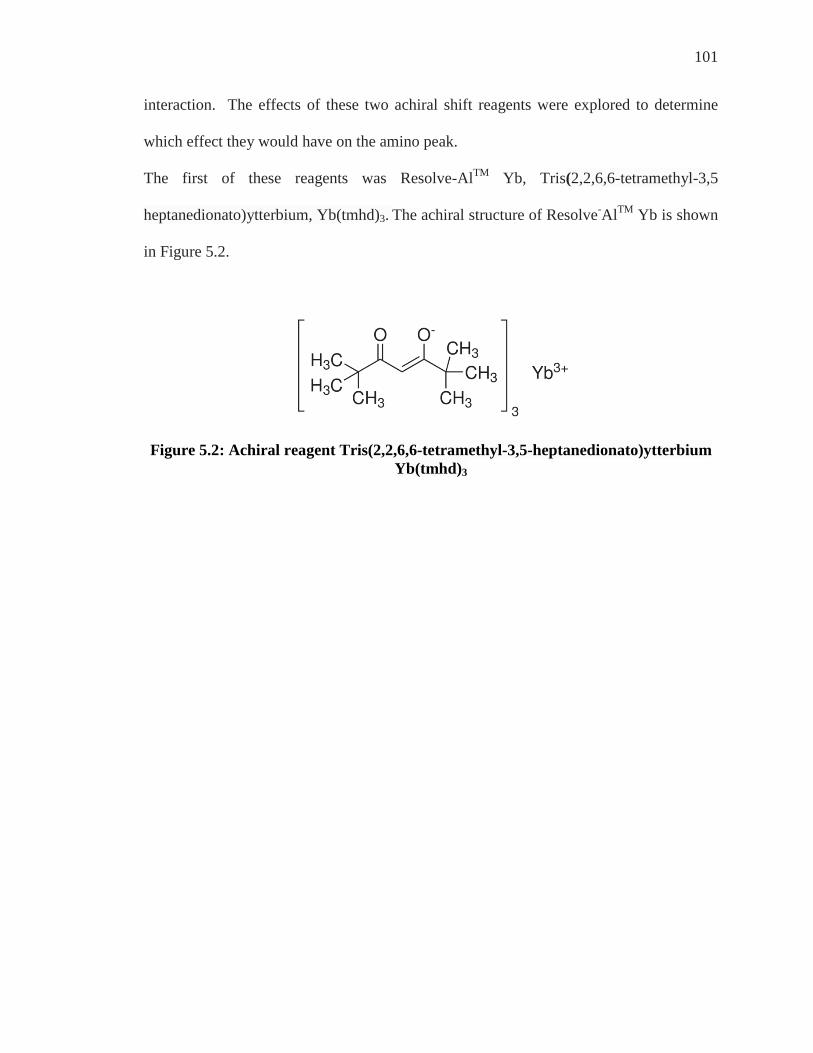
101
interaction. The effects of these two achiral shift reagents were explored to determine
which effect they would have on the amino peak.
The first of these reagents was Resolve-AlTM Yb, Tris(2,2,6,6-tetramethyl-3,5
heptanedionato)ytterbium, Yb(tmhd)3. The achiral structure of Resolve-AlTM Yb is shown
in Figure 5.2.
Figure 5.2: Achiral reagent Tris(2,2,6,6-tetramethyl-3,5-heptanedionato)ytterbium Yb(tmhd)3

102
Spectrum 5.4: 1H NMR of OFP-NH2 (revisited)
The 1H OFP-NH2 spectrum is reintroduced here for comparison. Previous analysis has
shown a separation and chemical shift change of the amino peak with as little as 0.5
equivalents of the Yb-CLSR. Therefore it was presumed if the amino peak was going to
split with the achiral shift reagent that it would be rapidly evident.

103
Spectrum 5.5: 1H NMR OFP-NH2 0.5 eq Yb(tmhd)3 Achiral LSR
Using the Yb-LSR and paying close attention to the amino peak at approximately 4.4
ppm, the effects of the LSR was analyzed. The very large and broad peak that spans
from 4.5-5.2 ppm was not seen in the original 1H spectrum of OFP-NH2 and also was not
seen in any of the spectra that used any CLSR. The only cause of this peak could be from
the LSR itself. This was an unfortunate property of this particular shift reagent peak as it
happened to fall almost exactly on the peak of interest. Additional equivalents were
added in hopes that the large and broad peak would shift further downfield than the
amino peak to enable analysis of the amino peak.
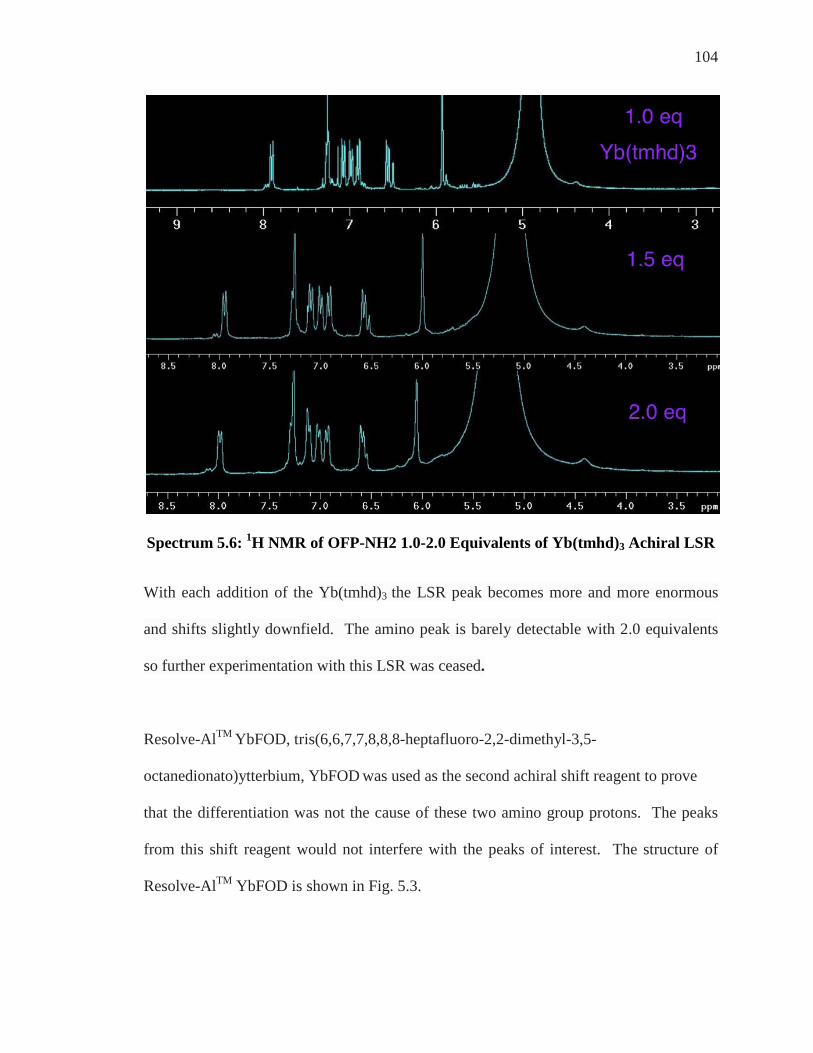
104
Spectrum 5.6: 1H NMR of OFP-NH2 1.0-2.0 Equivalents of Yb(tmhd)3 Achiral LSR
With each addition of the Yb(tmhd)3 the LSR peak becomes more and more enormous
and shifts slightly downfield. The amino peak is barely detectable with 2.0 equivalents
so further experimentation with this LSR was ceased.
Resolve-AlTM YbFOD, tris(6,6,7,7,8,8,8-heptafluoro-2,2-dimethyl-3,5-
octanedionato)ytterbium, YbFOD was used as the second achiral shift reagent to prove
that the differentiation was not the cause of these two amino group protons. The peaks
from this shift reagent would not interfere with the peaks of interest. The structure of
Resolve-AlTM YbFOD is shown in Fig. 5.3.

105
Figure 5.3: Structure of Resolve-AlTM YbFOD
Achiral shift reagent, Resolve-AlTM YbFOD was utilized with same method as the
previous LSR. Expectations of almost immediate results were anticipated if this LSR
were going to have an effect on this 1H NMR spectrum.
With the addition of one equivalent of the LSR very little change in chemical shift was
apparent. The amino peak has shown no indication of resolving and, fortunately, no large
shift from this LSR is visible in this spectrum Additional equivalents were added to try
ensure that a larger concentration of the LSR would not effect this amino peak.

106
Spectrum 5.8: 1H NMR of OFP-NH2 with 1.0-2.0 Equivalents of Achiral LSR,
YbFOD
In these spectra, it is evident that the amino peak is shifting downfield with as little as one
equivalent; the peak is seen at approximately 4.45 ppm. With the additional half
equivalents added, the chemical shift change continues as it appears at 4.50 ppm. The
amino peak continues to shift with the two equivalents but no separation is perceptible at
all.
This indicates that it is not the two hydrogens that are behaving differently to one
another. This proves that the two diastereomers that are formed by coordination are
giving rise to the two singlets that each stem from the amino group on each of the
enantiomers.

107
Conclusion As predicted, the Yb-HFC worked very well in discriminating between the enantiomers
in the 1H NMR of ortho’ OFP-diNH2 just as it did with the monosubstituted derivative.
Conclusive evidence of the discrimination of these newly formed diastereomers was
confimed by the use of an achiral Lanthanide Shift Reagent, Yb-FOD. The achiral LSR
showed no separation of any of the peaks on the 1H NMR spectrum of OFP-NH2.

108
Chapter 6: Conclusion and Future Work
Conclusion For the very first time, a full multinuclear unambiguous assignment of 1H, 13C, and 19F
spectra for a monosubstituted OFP derivative, OFP-NH2 has been described. This
significant accomplishment was realized with the utilization of several NMR
experimental techniques. NMR (1D) was used in conjunction with 2D, COSY and
HETCOR NMR, to definitively establish these assignments. The assignments were
confirmed using a 400 MHz NMR machine and nOe experiments, NOESY and HOESY,
further corroborated these results. This research led to the publication in the Journal of
Magnetic Resonance in Chemistry in 2005.35
These assignments allowed for the chiral discrimination of enantiomers of OFP-NH2.
Shift reagents, which included Chiral Lanthanide Shift Reagents and Chiral Solvating
Agents, were used to determine the effectiveness of differentiating between the
enantiomers. The CLSRs proved to be best method for this investigation, but the CLSR
that worked best for the 1H NMR spectra did not work best for the 19F NMR spectra. Yb-
HFC showed the best resolution of peaks for the proton spectra while Eu-HFC worked
best for the fluorine spectra.
The method utilized for enantiomeric discrimination of a monosubstituted derivative also
was successful for a disubstituted derivative, ortho’ OFP-diNH2.

109
Future Work These unambiguous assignments led to the enantiomeric differentiation of both a mono-
and di- substituted OFP derivative. The disubstituted analog studied in this thesis was the
ortho’ isomer. Upon completion of this research and using the methods described in this
thesis, it was possible to do the same unambiguous multinuclear assignments on both the
para’ and meta’ isomers. This research was done and published in the MRC as this
thesis was being written, during the Fall 2012.46
Other work completed and discussed in this thesis established a methodological use to
distinguish each enantiomer in an NMR spectrum. This method is applicable to
discriminate enantiomers of other compounds and can therefore be used to monitor chiral
resolution of these compounds. In the future, this approach could be used to monitor the
chiral resolution of both OFP-NH2 and ortho’-diNH2.
Once enantiopure forms of OFP-NH2 and ortho’-diNH2 become available, those
enantiopure versions, R and S from OFP-NH2 and R,R and S,S, from the di-substituted
compound, could themselves be used as chiral shift reagents. There is potential for the
pharmaceutical industry to utilize any of these new chiral shift reagents to produce
enantiomerically pure forms of medications, which could reduce or eliminate unwanted
or harmful side effects from both common and novel medications.
The analysis that was described and applied to discriminate the ortho’ diNH2 could be
applied to both the meta’ and para’diNH2 isomers. The chiral discrimination method
used in this thesis was then utilized by a former researcher from the Roche Group, Kasey

110
Cox. Kasey was able to complete the chiral discrimination of both of these disubstituted
isomers with CLSRs. The results of the chiral discrimination of OFP-NH2 and ortho’
OFP-diNH2 discussed in this thesis along with the chiral results work completed by
Kasey will be written and submitted for publication sometime this year (2013).
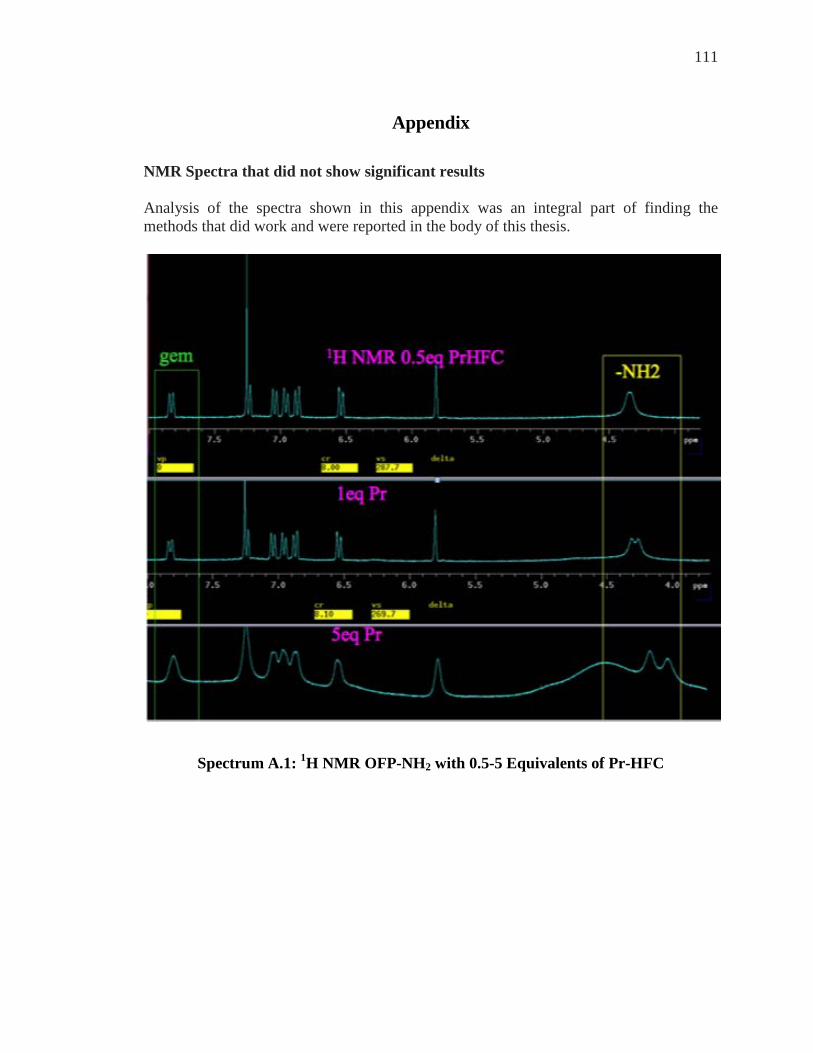
111
Appendix NMR Spectra that did not show significant results Analysis of the spectra shown in this appendix was an integral part of finding the methods that did work and were reported in the body of this thesis.
Spectrum A.1: 1H NMR OFP-NH2 with 0.5-5 Equivalents of Pr-HFC

112
Spectrum A.2: 19F NMR OFP-NH2 with 0.5-2.0 Equivalents of Pr-HFC

113
Spectrum A.3: 19F NMR OFP-diNH2 0.5 Equivalents of Yb-HFC

114
Spectrum A.4: 19F NMR OFP-diNH2 1.0-3.0 Equivalents Yb-HFC

115
Spectrum A.5: 1H NMR OFP-NH2 0.5 Equivalents Pirkle’s Alcohol

116
Spectrum A.6: 19F NMR OFP-NH2 1.0-4.0 Equivalents Pirkle’s Alcohol

117
Spectrum A.7: 1H NMR OFP-diNH2 0.75 Equivalents Pirkle’s

118
Spectrum A.8: 1H NMR of ortho’diNH2 With 2.5 and 3.5 Equivalents Pirkles Alcohol

119
Spectrum A.9: 19F NMR of ortho’ diNH2 with 0.75 and 1.5 Equivalents of Pirkles Alcohol

120
Spectrum A.10: 19F NMR of ortho’diNH2 With 2.5 and 3.5 Equivalents Pirkles Alcohol

121
Spectrum A.11: 19F NMR OFP-diNH2 0.5 Equivalents Yb-HFC

122
Spectrum A.12: 19F NMR OFP-diNH2 1.0-3.0 Equivalents Eu-HFC

123
Endnotes 1) M. M Pellegrin, Rect. Trav. Chim., Pays-Bas, 1899, 18, 457. 2) B. H. Smith, Bridged Aromatic Compounds, Academic Press, New York, 1964. 3) L. Rossa, F. Vögtle, V. Boekelheide, I. Tabushi, K. Yamamura, Top. Curr.
Chem., 1983, 113, 1–185. 4) F. Vögtle, Top. Curr. Chem., 1983, 115, 1–163. 5) F. Diederich, Cyclophanes, Royal Society of Chemistry, London, 1991. 6) F. Vögtle, Cyclophane Chemistry, Wiley, New York, 1993. 7) E. Weber, Top. Curr. Chem., 1994, 172, 1–210. 8) V. V. Kane, W. H. de Wolf, F. Bickelhaupt, Tetrahedron, 1994, 50, 4575–
4622. 9) G. J. Bodwell, Angew. Chem. Int. Ed. Engl., 1996, 35, 2085–2088. 10) A. de Meijere, B. König, Synlett, 1997, 11, 1221–1232. 11) G. J. Bodwell, in Organic Synthesis Highlights IV (Ed: H. G. Schmalz),
Wiley-VCH, New York, 2000, pp. 289–300. 12) H. Hopf, Classics in Hydrocarbon Chemistry, Wiley-VCH, Weinheim, 2000. 13) R. Gleiter, H. Hopf, Modern Cyclophane Chemistry, Wiley-VCH, Weinheim,
2004. 14) D. J. Cram, H. Steinberg, J. Am. Chem. Soc., 1951, 73, 5691- 5704. 15) W. M. Schubert, W. A. Sweeney, H. K. Latourette, J. Am. Chem. Soc., 1954,
76, 5462-5466. 16) D. J. Cram, J. M. Cram, Acc. Chem. Res., 1971, 4, 201-213. 17) C. J. Brown, A. C. Farthing, Nature, 1949, 164, 915-916. 18) J. F. Leibman, A. Greenberg, Chem. Rev., 1976, 76, 311–365. 19) S. W. Chow, L. A. Pilato, W.L. Wheelwright, J. Org. Chem., 1970, 35, 21-22. 20) W. R. Dolbier Jr., J. X. Duan, A. J. Roche, Org. Lett., 2000, 2, 1867-1869. 21) A. J. Roche, W. R. Dolbier Jr., J. Org. Chem., 1999, 64, 9137-9143. 22) A. J. Roche, B. Canturk, J. Fluorine Chem., 2005, 126, 483-490. 23) W. R. Dolbier Jr., Guide to Fluorine NMR for Organic Chemists, John Wiley
& Sons, Hoboken, 2009. 24) A. J. Roche, W. R. Dolbier, Jr., J. Org. Chem., 2000, 65, 5282-5290. 25) W. R. Dolbier Jr., W. F. Beach, J. Fluorine Chem., 2003, 1, 97-104. 26) E. Eliel, S. H. Eilen, M. P. Doyle, Basic Organic Stereochemistry, Wiley, New
York, 1994. 27) H. Duddeck, E. D. Gomez, Chirality, 2009, 21, 51-68. 28) R. S. Cahn, C. K. Ingold, V. Prelog, Angew. Chem. Int. Ed Engl., 1966, 5,
385-415. 29) R. S. Cahn, C. K. Ingold, V. Prelog, Experimenta, 1959, 12, 81-124. 30) A. D. McNaught, A. R. Wilkinson, The Compendium of Chemical
Terminology, John Wiley & Sons, Hoboken, 1997. 31) A. E. Lovely, T. J. Wenzel, Chirality, 2008, 20, 370-378. 32) A. J. Roche, A. A. Marchione, Magn. Reson. Chem., 2009, 47, 428-436. 33) L. Ernst, K. Ibrom, Modern Cyclophane Chemistry, Wiley-Weinheim,
Hoboken, 2004, 381.

124
34) N. E. Jacobson, NMR Spectroscopy Explained, John Wiley & Sons, Hoboken, 2007, 64-69.
35) A. J. Roche, A. A. Marchione, S. A. Rabinowitz, Magn. Reson. Chem., 2005, 43, 1016-1022.
36) J. Battiste, R. A. Newmark, Prog. Nucl. Magn. Reson. Spectrosc., 2006, 48, 1-23.
37) R. H. Contreras, J. E. Peralta, Prog. Nucl. Magn. Reson. Spectrosc., 2000, 37, 321-425.
38) D. A. Lanfranchi, M.Blanc, M. Velluntini, P. Bradesi, J. Casanova, F. Tomi, Magn. Reson. Chem., 2008, 46, 1188-1194.
39) T. J. Wenzel, J. D. Wilcox, Chirality, 2003, 15, 256-270. 40) D. A. Lanfranchi, M.Blanc, M. Velluntini, P. Bradesi, J. Casanova, F. Tomi,
Spectroscopy Letters, 2010, 43, 36-43. 41) M. Raban, K. Mislow, Tetrahedron Lett., 1965, 4249-4353. 42) J. Knobloch, J. D. Shaughnessy Jr., U. Rüther, FASEB, 2007, 21, 1410–21. 43) M. D. McCreary, D.W. Lewis, D. L. Wernick, G.M. Whitesides, J. Am. Chem.
Soc., 1974, 96, 1038-1054. 44) T. J. Wenzel, Discrimination of Chiral Compounds Using NMR Spectroscopy,
Wiley, Hoboken, 2007. 45) G. M. Whitesides, D.W. Lewis, J. Am. Chem. Soc., 1970, 92, 6979-6980. 46) A. J. Roche, A. A. Marchione, Magn. Reson. Chem., 2012, 50, 809-812.

125
Bibliography
Battiste, J. Newmark, R. A., Prog. Nucl. Magn. Reson. Spectrosc., 2006, 48, 1-23.
Bodwell, G. J., Angew. Chem. Int. Ed. Engl., 1996, 35, 2085–2088.
Bodwell, G. J., in Organic Synthesis Highlights IV (Ed: H. G. Schmalz), Wiley-VCH, New York, 2000, pp. 289–300.
Brown, C. J., Farthing, A. C., Nature, 1949, 164, 915-916.
Cahn, R. S., Ingold, C. K., Prelog, V., Angew. Chem. Int. Ed Engl., 1966, 5, 385-415.
Cahn, R. S., Ingold, C. K., Prelog, V., Experimenta, 1959, 12, 81-124.
Chow, S. W., Pilato, L. A., Wheelwright, W.L., J. Org. Chem., 1970, 35, 21-22.
Contreras, R. H., Peralta, J. E., Prog. Nucl. Magn. Reson. Spectrosc., 2000, 37, 321-425.
Cram, D. J., Cram, J. M., Acc. Chem. Res., 1971, 4, 201-213.
Cram, D. J., Steinberg, H., J. Am. Chem. Soc., 1951, 73, 5691- 5704.
de Meijere, A., König, B., Synlett, 1997, 11, 1221–1232.
Diederich, F., Cyclophanes, Royal Society of Chemistry, London, 1991.
Dolbier Jr., W. R., Guide to Fluorine NMR for Organic Chemists, John Wiley & Sons, Hoboken, 2009.
Dolbier Jr., W. R., Beach, W. F., J. Fluorine Chem., 2003, 1, 97-104.
Dolbier Jr.,W. R., Duan, J. X., Roche, A. J., Org. Lett., 2000, 2, 1867-1869.
Duddeck, H., Gomez, E. D., Chirality, 2009, 21, 51-68.
Eliel, E., Eilen, S. H., Doyle, M. P., Basic Organic Stereochemistry, Wiley, New York, 1994.
Ernst, L., Ibrom, K. Modern Cyclophane Chemistry, Wiley-Weinheim, Hoboken, 2004, 381.

126
Gleiter, R., Hopf, H., Modern Cyclophane Chemistry, Wiley-VCH, Weinheim, 2004.
Hopf, H., Classics in Hydrocarbon Chemistry, Wiley-VCH, Weinheim, 2000.
Jacobson, N. E., NMR Spectroscopy Explained, John Wiley & Sons, Hoboken, 2007, 64-69.
Kane, V. V., de Wolf, W. H., Bickelhaupt, F., Tetrahedron, 1994, 50, 4575–4622.
Knobloch, J., Shaughnessy Jr., J. D., Rüther, U., FASEB, 2007, 21, 1410–21.
Lanfranchi, D. A., Blanc, M., Velluntini, M., Bradesi, P., Casanova, J., Tomi, F. Magn. Reson. Chem., 2008, 46, 1188-1194.
Lanfranchi, D. A., Blanc, M., Velluntini, M., Bradesi, P., Casanova, J., Tomi, F. Spectroscopy Letters, 2010, 43, 36-43.
Leibman, J. F., Greenberg, A., Chem. Rev., 1976, 76, 311–365.
Lovely, A. E., Wenzel, T. J., Chirality, 2008, 20, 370-378.
McCreary, M. D., Lewis, D.W., Wernick, D. L., Whitesides, G.M., J. Am. Chem. Soc., 1974, 96, 1038-1054.
McNaught, A. D., Wilkinson, A. R., The Compendium of Chemical Terminology, John Wiley & Sons, Hoboken, 1997.
Pellegrin, M. M., Rect. Trav. Chim., Pays-Bas, 1899, 18, 457.
Roche, A. J., Canturk, B., J. Fluorine Chem., 2005, 126, 483-490.
Roche, A. J., Dolbier Jr., W. R., J. Org. Chem., 1999, 64, 9137-9143.
Roche, A. J., Dolbier Jr., W. R., J. Org. Chem., 2000, 65, 5282-5290.
Roche, A. J., Marchione, A. A., Magn. Reson. Chem., 2009, 47, 428-436.
Roche, A. J., Marchione, A. A., Magn. Reson. Chem., 2012, 50, 809-812.
Roche, A. J., Marchione, A. A., Rabinowitz, S. A., Magn. Reson. Chem., 2005, 43, 1016-1022. Rossa, L., Vögtle, F., Boekelheide, V., Tabushi, I.,Yamamura, K., Top. Curr. Chem., 1983, 113, 1–185.

127
Raban, M., Mislow, K., Tetrahedron Lett., 1965, 4249-4353.
Schubert, W. M., Sweeney, W. A., Latourette, H. K., J. Am. Chem. Soc., 1954, 76, 5462-5466.
Smith, B. H., Bridged Aromatic Compounds, Academic Press, New York, 1964.
Vögtle, F., Top. Curr. Chem., 1983, 115, 1–163.
Vögtle, F., Cyclophane Chemistry, Wiley, New York, 1993.
Weber, E., Top. Curr. Chem., 1994, 172, 1–210.
Wenzel, T. J., Discrimination of Chiral Compounds Using NMR Spectroscopy, Wiley, Hoboken, 2007.
Wenzel, T. J., Wilcox, J. D., Chirality, 2003, 15, 256-270.
Whitesides, G. M., Lewis, D.W., J. Am. Chem. Soc., 1970, 92, 6979-6980.