© 2004 wipfli young © 2005 wipfli llp example title screen # 1 example sub title financial...
TRANSCRIPT

© 2005 Wipfli LLP© 2004 Wipfli Young
Example Title Screen # 1
Example Sub Title
Financial Analysis for Nonprofit Organizations
Presented by:Karl Pnazek, CAP Services, Inc.
John Hemming, Wipfli, LLP
NASCSP Monitoring Training May 2006
© 2005 Wipfli LLP
Introduction
• Financial Analysis covers all aspects of an organization and can be incorporated into, and obtained from, many aspects of an organization, including: Program reports Program financial statements Agency financial statements

© 2005 Wipfli LLP
Introduction
• You will learn how organization’s should be looking at internal information and what you should be asking to ensure fiscal stability within the organization.

© 2005 Wipfli LLP
Introduction
• Currently, what tools does the organization use?
• How often do they use them?
• How do they work?
• What is their biggest frustration?

© 2005 Wipfli LLP
Agenda
• What we will cover: What information should the
organization be looking at on a monthly basis?
• Agency-wide information• Program information• Trends• Key numbers• Supporting information
© 2005 Wipfli LLP
• What information should the organization be looking at on an annual basis?
Agency-wide information
Analyticals
Program information
Agenda

© 2005 Wipfli LLP
Key #’s
Overview
• How does all this fit together?
• Easy!! It leads to a more productive and better informed organization!!
B/S
Audit
I/S
Ratios
TrendsReports
ScheduleA
Tax Returns

© 2005 Wipfli LLP
Topic 1 – Monthly Financial Procedures
• Most important item to review is the agency-wide trial balance
(How often is the organization reviewing their agency-wide trial balance? It should be monthly)
(What should a monitor look for?)

© 2005 Wipfli LLP
FOUR (4) KEY QUESTIONS TO ASK AND ANSWER
• What is it?
• Where is it from?
• What does it mean?
• What do we do with it?
Topic 1 – Monthly Financial Procedures
© 2005 Wipfli LLP
• First thing to know about the trial balance is where do the numbers come from.
• Must have a review system in place that requires balances to be reviewed, reconciled, and adjusted on a regular basis.
Topic 1 – Monthly Financial Procedures

© 2005 Wipfli LLP
• If the numbers aren’t supported by reliable information, the rest of analytical process is a waste of time.
• Also, if numbers aren’t reliable the information reported to funding agencies, program directors and your board is incorrect. (And a waste of their time!)
Topic 1 – Monthly Financial Procedures

© 2005 Wipfli LLP
• What should you be looking for on the agency-wide balance sheet?
Does the balance sheet balance?!
Does the bank reconciliation agree to the general ledger?
Are there any credit balances in the asset accounts?
Topic 1 – Monthly Financial Procedures
© 2005 Wipfli LLP
• What should you be looking for… (continued)
Do subsidiary ledgers support the reported amounts on the balance sheet?
Did the organization buy any equipment this month with agency funds? Was it recorded properly?
Topic 1 – Monthly Financial Procedures

© 2005 Wipfli LLP
• What should you be looking for… (continued)
Are there any debit balances in the liability accounts?
Was any new debt incurred? If so, was it recorded properly? (Can be a very detrimental adjustment at year-end if not recorded properly)
Topic 1 – Monthly Financial Procedures

© 2005 Wipfli LLP
• Overall, does it look reasonable? Any odd looking accounts? If so, were they looked into?
Topic 1 – Monthly Financial Procedures

© 2005 Wipfli LLP
• If the balance sheet is correct, then the revenues and expenses are usually correct, but may be misclassified.
Topic 1 – Monthly Financial Procedures

© 2005 Wipfli LLP
• Next, analyze the individual program trial balances and results.
Any odd looking balances in the revenues?
Any odd looking balances in the expenses?
Topic 1 – Monthly Financial Procedures

© 2005 Wipfli LLP
• Next, analyze the individual program trial balances... (continued)
Have all revenues been recorded properly?
What is the bottom line? Are they over spent?
Have they recorded all of your invoices properly or receivables properly?
Topic 1 – Monthly Financial Procedures
© 2005 Wipfli LLP
• Next, analyze the individual program trial balances... (continued)
How is the program doing compared to budget?
Any significant over spent areas?
Do they need to get modification from their funding source?
Topic 1 – Monthly Financial Procedures

© 2005 Wipfli LLP
Current Date in Grant Period May 31, 2006
Total CSBG Grant annually 3,000,000$
Grant period 01/01/06 THRU 12/31/06
Year to Date Expenditures 2,000,000$
Percentage of Grant Expenditures Spent to Date 67%
Percentage of Grant Period Expired 42%
Favorable/Unfavorable Variance UNFAVORABLE(Grant Spending vs. Grant Period)
Topic 1 – Monthly Financial Procedures

© 2005 Wipfli LLP
• A true budget reflects anticipated activity during certain times of the year, not equally throughout the year
Topic 1 – Monthly Financial Procedures

© 2005 Wipfli LLP
Topic 2 – Annual Analytical Procedures
• On the agency-wide trial balance, be sure that all accounts reconcile with supporting information
© 2005 Wipfli LLP
Topic 2 – Annual Information
• Compare the year- end balances to prior year- end balances.
• Can the organization explain the variances?
© 2005 Wipfli LLP
Topic 2 – Annual Information
• What should you look for?
• Is the cash balance up from prior years? If so, why?
• Are their receivables down?
• Are their payables down?
• What is their deferred revenue balance?
Each of these has a direct effect on their cash balance, both positively and negatively!
© 2005 Wipfli LLP
Topic 2 – Annual Information
• Are their prepaid balances comparable to prior year? If not, why? • If they have increased, have their
corresponding expenses increased too?
• Or have their expenses not been recorded in the proper period?
© 2005 Wipfli LLP
Topic 2 – Annual Information
• Does their physical inventory of property and equipment agree with their property and equipment on their general ledger.
• Required to be done once every two years!!
• If their property and equipment balances increased, has their depreciation expense increased?
• If property and equipment is down, and disposals were sold, was the sale recorded properly?
© 2005 Wipfli LLP
Topic 2 – Annual Information
• Are their accounts payable up? If so, are their overall expenses up as well?
• Or, are they experiencing cashflow problems, which may become greater when carried over to the next year.

© 2005 Wipfli LLP
Topic 2 – Annual Information
• Are their accrued wages up in proportion to the increase in wage rates?
• Have they added new programs therefore adding new staff? If so, did their accrued vacation increase proportionately too?
• What about other benefit accruals? Do they make sense given the level of employees?

© 2005 Wipfli LLP
Topic 2 – Annual Information
• How do their deferred revenues compare to prior years? Can they explain the variances from prior years?
• Finally, most important number to verify is net assets. Do they agree with their prior year audit? If not, why?
• There should be NO adjustments to this account during the year.

© 2005 Wipfli LLP
Topic 2 – Annual Information
• What other accounts do they have? What would account for their fluctuations? Can they explain the variances?
© 2005 Wipfli LLP
Topic 2 – Annual Information
• Next, look at their income statement in comparison to prior years.
• Are revenues up? • Did they get new programs? • Did they get increases in your existing
programs?

© 2005 Wipfli LLP
Topic 2 – Annual Information
• How do their overall expenses look?• Are salaries up? If so, is this increase
comparable to wage increases, or did it come from new staff and new programs? (Remember to relate this to their balance sheet amounts for accrued payroll and benefits.)
• Are they renting new facilities? • Or have their lease costs increased? • Are they budgeting for anticipated (or
built in) rental cost increases?

© 2005 Wipfli LLP
Topic 2 – Annual Information
• How does their depreciation expenses compare to prior years? Again, relate this to their balance sheet analysis for property and equipment.
• How about interest expense?• Does it agree with their year end statement
from their bank?
• How have they planned for or budgeted for their insurance increases?
© 2005 Wipfli LLP
Topic 2 – Annual Information
• Overall, what is their bottom line?
• Excess revenues over expenses?
• If so, why? • Fee for service activities? • Fund-raising campaign?

© 2005 Wipfli LLP
Topic 2 – Annual Information
• Overall, what is your bottom line?
• Excess expenses over revenues?• Are programs overspent? • Did they lose funding and not cut expenses?
© 2005 Wipfli LLP
Topic 2 – Annual Information
• The organization should be able to answer all of these questions. They will be asked by all who use their statements.
© 2005 Wipfli LLP
• Parts of an Audit Report• Financial
Opinion Statement of Financial Position Statement of Activities Cashflow Statement
• Notes to the Financial Statements
Topic 3 – Audited Financial Statements

© 2005 Wipfli LLP
• Parts of an Audit Report
Internal Control Over Financial Statements
Compliance and Internal Control Over Major Programs
Supplemental
Funding Source Requirements
Topic 3 – Audited Financial Statements

© 2005 Wipfli LLP
• Footnotes to the financial statements provide the reader with information to further understand the financial information.
• It describes the significant account policies.
• Provides more detailed information to material account balances.
Topic 3 – Audited Financial Statements
© 2005 Wipfli LLP
• Basis of Presentation
Accrual
How do they record grant awards?
Description of Cost Allocation Plan
Topic 3 – Audited Financial Statements

© 2005 Wipfli LLP
• Other disclosures: Concentration of cash, if cash
balances are over $100,000 (the FDIC insured limit)
Terms of notes receivable and payable
Related parties
Subsequent events
Commitments and contingencies
Functional classification of expenses
Topic 3 – Audited Financial Statements

© 2005 Wipfli LLP
• Other disclosures:
Retirement plan
Leases
Related parties
Property and equipment
Descriptions of material balance sheet items
Topic 3 – Audited Financial Statements

© 2005 Wipfli LLP
• Other disclosures:
Revolving loans (housing)
Notes/mortgages payable
Changes in accounting policy
Prior period adjustments
Topic 3 – Audited Financial Statements

© 2005 Wipfli LLP
• Schedule of Federal Expenditures has two purposes:
Fulfills A-133 requirements for disclosing expenses based on CFDA #’s (Catalog of Federal and Domestic Assistance).
Breaks down annual activity by individual grant.
Topic 3 – Audited Financial Statements

© 2005 Wipfli LLP
Topic 3 – Audited Financial Statements
Schedule ASchedule of Program ActivityYear Ended December 31, 2004
FEDERAL PROGRAMS
Department of Agriculture DHHS
10.558 93.600
USDA Child and Adult Care Food Program
Child and Child and Full-Year, Total
Adult Care Adult Care 10.558 Part-Day Federal GAAP TOTAL Agency
Total Food Program Food Program Subtotal O6CH0201/22 Programs Adjustments PROGRAMS Activity
(1) (2) (2) (3) (4)
REVENUE
Grant revenue 3,341,110$ 160,570$ 71,412$ 231,982$ 3,109,128$ 3,341,110$ 0$ 3,341,110$ 0$
Donations 70,301 0 0 0 0 0 0 0 70,301
In kind contributions 32,168 0 0 0 783,622 783,622 751,454)( 32,168 0
Total Revenue 3,443,579 160,570 71,412 231,982 3,892,750 4,124,732 751,454)( 3,373,278 70,301
EXPENSES
Personnel 2,114,378 36,594 10,632 47,226 2,052,152 2,099,378 0 2,099,378 15,000
Fringe benefits 372,265 0 0 0 367,918 367,918 0 367,918 4,347
Occupancy 220,015 0 0 0 363,780 363,780 144,866)( 218,914 1,101
Travel 21,422 0 0 0 21,442 21,442 0 21,442 20)(
Equipment repairs and maintenance 91,343 390 0 390 60,822 61,212 35,145)( 26,067 65,276
Food 186,526 115,491 47,837 163,328 23,198 186,526 0 186,526 0
Supplies 117,654 4,821 5,744 10,565 107,089 117,654 0 117,654 0
Other 169,739 3,274 7,199 10,473 112,727 123,200 13,046)( 110,154 59,585
In kind expenses 32,168 0 0 0 783,622 783,622 751,454)( 32,168 0
Total Expenses 3,325,510 160,570 71,412 231,982 3,892,750 4,124,732 944,511)( 3,180,221 145,289
Change in Net Assets 118,069 0 0 0 0 0 193,057 193,057 74,988)(
Net assets - December 31, 2003 861,740 0 0 0 0 0 0 0 861,740
NET ASSETS - DECEMBER 31, 2004 979,809$ 0$ 0$ 0$ 0$ 0$ 193,057$ 193,057$ 786,752$

© 2005 Wipfli LLP
• Which programs do they subsidize on an annual basis?
• How much reserves do they have on hand and how long will they last if they continue to subsidize?
• Every program should be analyzed to gain information
Topic 3 – Audited Financial Statements
© 2005 Wipfli LLP
• How should you use this schedule? Review each grant and program to see if
it appears reasonable Which programs are overspent? Which programs are under spent? If there is an over expenditure, who is
paying for it? CSBG $$, Agency $$, private funding
sources
Topic 3 – Audited Financial Statements

© 2005 Wipfli LLP
• If a grant is completed, did they spend it all?
• Are the individual line items in line within the grant budget?
• If they didn’t spend it all, have they requested carryover?
• Or do they have to return unspent funds?
Topic 3 – Audited Financial Statements

© 2005 Wipfli LLP
• Are there any negative expenses? If so why? Is there something that should be reclassified?
• What was the outcome of their agency activity?
• Did they have to use reserves to fund overspent grants?
• Did they add to your unrestricted net asset balance? Or take away?
Topic 3 – Audited Financial Statements

© 2005 Wipfli LLP
• What is the balance of their temporarily restricted net assets? And what are they restricted for?
• What is the balance of their unrestricted net assets? And how is it funded? i.e., property and equipment, receivables, loans, or cash?
• If either one (temporarily or unrestricted net assets) is in a deficit position, this needs to be addressed ASAP!!
Topic 3 – Audited Financial Statements
© 2005 Wipfli LLP
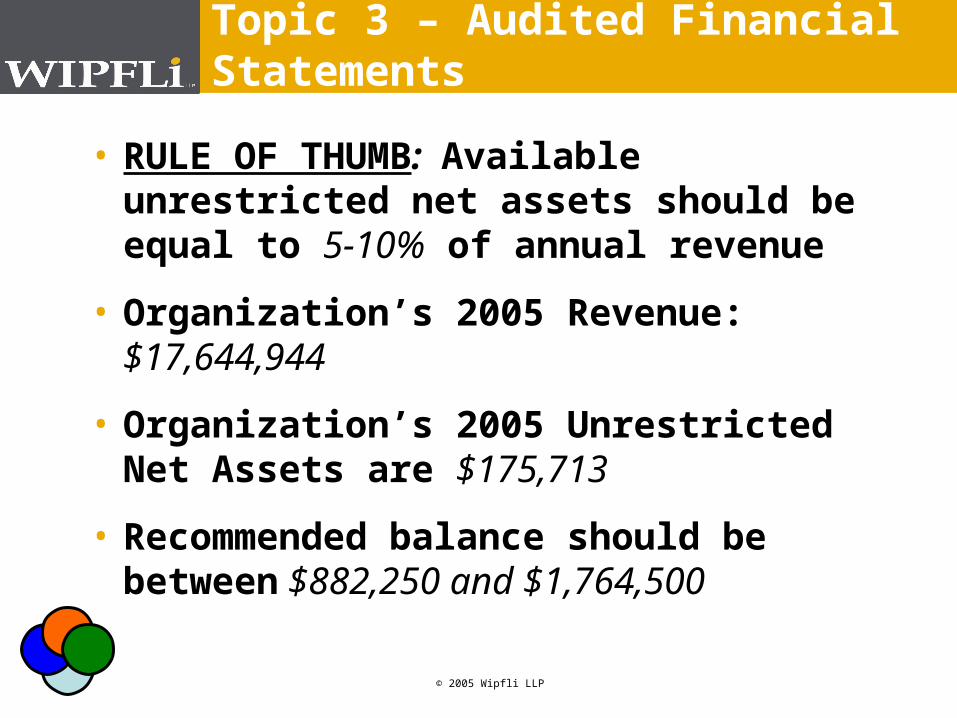
• RULE OF THUMB: Available unrestricted net assets should be equal to 5-10% of annual revenue
• Organization’s 2005 Revenue: $17,644,944
• Organization’s 2005 Unrestricted Net Assets are $175,713
• Recommended balance should be between $882,250 and $1,764,500
Topic 3 – Audited Financial Statements
© 2005 Wipfli LLP
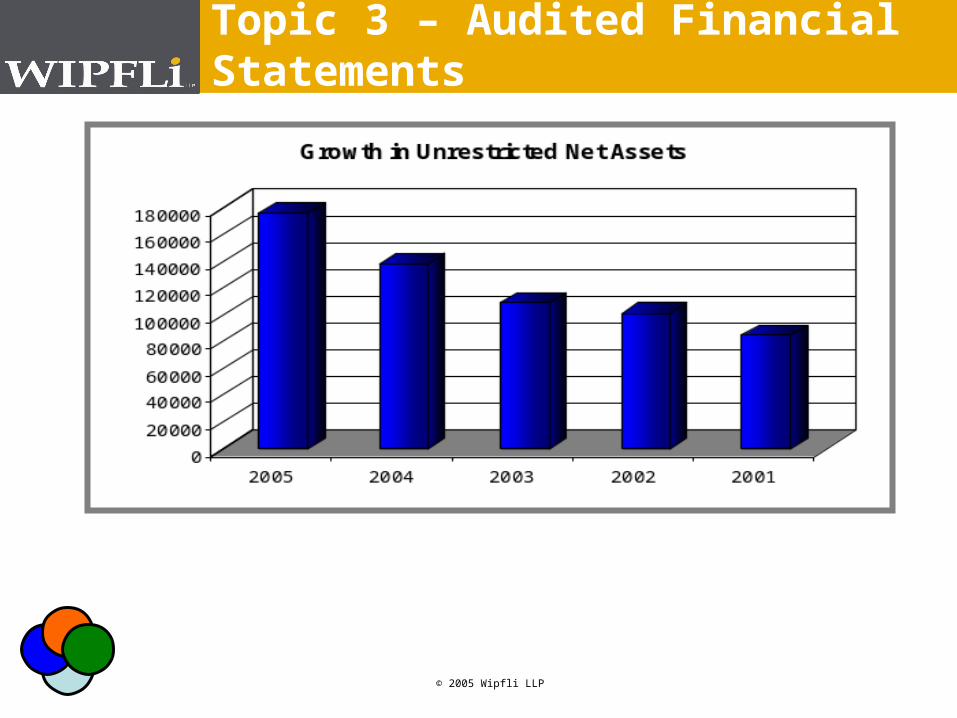
Topic 3 – Audited Financial Statements

© 2005 Wipfli LLP
Analyzing A Statement of Financial Position
Assets Liabilities and Net Assets
Current assets: Current liabilities:Cash 826,740$ Mortgages payable - current portion 669,348$ Grants receivable 696,534 Notes payable - current portion 193,661 Accounts receivable 487,451 Current portion of obligation for loans pledged 187,989 Weatherization materials 169,291 Accounts payable 603,423 Current portion of loans receivable 66,735 Accrued payroll and related expenses 374,842 Current portion of discount on loans pledged 17,000 Accrued vacation and personal leave 496,119 Housing rehabilitation in progress 424,104 Security deposits 39,694 Prepaid expenses 163,449 Other liabilities 29,358
Total current assets 2,851,304 Grant funds received in advance 664,309 Total current liabilities 3,258,743
Other assets:Restricted cash 381,815 Discount on loans pledged to bank 68,000 Long-term liabilities:Investment in limited liability partnerships and companies 85,200 Mortgages payable 7,916,175 Notes receivable 1,358,936 Notes payable 323,519
Total other assets 1,893,951 Obligation for loans pledged to bank 677,352 Deferred mortgages payable 947,578
Loans receivable: Deferred revenue 130,744 Loans receivable 9,188,403 Deferred revenue - LLCs 1,241,936 Allowance for loans receivable 1,254,867)( Security deposits 12,140
Loans receivable, net 7,933,536 Other liabilities 142,513 Weatherization advance 27,144
Land, buildings, and equipment: Total long-term liabilities 11,419,101 Land 1,501,402 Building and building improvements 16,937,021 Total liabilities 14,677,844 Construction in progress 123,248 Equipment 1,595,724 Net assets:
Subtotal 20,157,395 Unrestricted 581,273 Accumulated depreciation 5,588,445)( Temporarily restricted 7,929,482 Valuation reserve 4,671,142)( Total net assets 8,510,755
Land, buildings, and equipment, net 9,897,808
Goodwill 612,000
Total assets 23,188,599$ Total liabilities and net assets 23,188,599$
Page 9

© 2005 Wipfli LLP
Analyzing A Consolidated Statement of Activities
TemporarilyUnrestricted Restricted Total
Revenue:Grant revenue 146,982$ 7,876,784$ 8,023,766$ Program contributions 1,043,363 227,316 1,270,679 Donations 36,506 560,964 597,470 Rental income 1,707,699 0 1,707,699 Interest income 69,199 240,409 309,608 Sales 206,443 0 206,443 Gain on sale of property 16,568 17,570 34,138 Other income 412,632 0 412,632 Cash match and in kind contributions 1,382,019 0 1,382,019 Net assets released from restriction throughsatisfaction of program restrictions 8,386,824 8,386,824)( 0
Total revenue 13,408,235 536,219 13,944,454
Expenses:Personnel 5,117,534 0 5,117,534 Contractual/consultant costs 844,212 0 844,212 Travel/training 368,672 0 368,672 Supplies 535,896 0 535,896 Occupancy 368,449 0 368,449 Operating expenses 590,336 0 590,336 Client/participant costs 1,271,215 0 1,271,215 Other expenses 725,129 0 725,129 Depreciation 478,609 0 478,609 Bad debt 214,464 0 214,464 Property expenses 1,281,747 0 1,281,747 Cash match and in kind expenses 1,382,019 0 1,382,019
Total expenses 13,178,282 0 13,178,282 Change in net assets 229,953 536,219 766,172
Net assets - December 31, 2003, as previously stated 526,203 7,324,881 7,851,084 Prior period adjustments 174,883)( 68,382 106,501)(
Net assets - December 31, 2003, as restated 351,320 7,393,263 7,744,583 Net assets - December 31, 2004 581,273$ 7,929,482$ 8,510,755$
Page 6

© 2005 Wipfli LLP
Analyzing Expenses
CommunityServices
16%
WeatherizationAssistance
8%
Food 1%
Housing, Housing Rehab. & Econ.
Devel.18%
Family Services
8%
Child Education
26%
Job Training
4%
Other4%
Unrestricted Activities
15%
1995
JobTraining
5%
FoodPrograms
1% Other3%
Weatherization Assistance
12%
CommunityServices
8%
Housing, Housing Rehab. & Econ.
Devel.37%
FamilyServices
6%
ChildEducation
28%
2004
Housing, Housing Rehab. & Econ.
Devel.29%
JobTraining
2%
Community Services
20%
WeatherizationAssistance
9%
FoodPrograms
1%
Other4%
ChildEducation
29%
FamilyServices
6%
2002
Page 12

© 2005 Wipfli LLP
Analyzing Unrestricted Net Assets
RULE OF THUMB: Unrestricted net assets should be equal to 5-10% of expenditures with 50% of unrestricted net assets in cash.
CAP Services, Inc.’s 2004 expenditures were $13.2 million.
CAP Services, Inc.’s 2004 unrestricted net assets were $581,273 with no unrestricted cash balance.
Recommended unrestricted net asset balance should be between $660,000 and $1,320,000 with unrestricted cash of $330,000 to $660,000.
Page 13

© 2005 Wipfli LLP
How’s the Agency Doing?
Financial Management
Planning and Evaluation
Programs and Services
Human Resources
Community Relations
Board of Directors
Thriving Highly diverse base Strong reserve Excellent controls Resources accessible
Systematic and regular feedback
Strategic planning
Innovative programs Results oriented Improvement sought Best practices
Staff development plans
Excellent controls Exemplary info
Collaborative projects Provide leadership Strong, respected
advocate
Advocates for poor Set direction Advocates for agency
Safe Some diversity in funds Adequate reserve Adequate controls System is responsive
Regular data review Feedback system Multi-year planning
Programs grow Change oriented Fulfills commitments Effective practices
Staff trained Controls assure compliance Adequate info
Partnerships and networking
Seen as positive Some advocacy
Committed to serving poor
Pursue direction Belief in agency and
its staff
Stable Funds cover activities Little reserve Controls weak/
functioning System response is
timely most of the time
Required feedback Annual planning
Programs stable Delivers service People are served
Staff competent Weak controls
functioning Little info
Attends meetings Neutral image Little advocacy, but
some education
Understand poverty Stay on course Participate; don’t
micromanage
Vulnerable Limited funding base/tight
No reserve funds Controls not functioning
consistently System cannot respond
in timely manner
Little/no feedback No outcomes/results No planning beyond
grant objectives
Programs stagnant Do not consistently
meet grant goals Inconsistent practice People not served
Staff lack skills Controls are
inconsistent No info/study but
reports exist
No regular contact Negative image No advocacy or
community effort for poor
Apathetic Micromanage or fail
to do basics Lack of faith in staff
or aren’t told the truth
In Crisis Cannot cover expenses; deficit spending
Borrowing for operating expenses
No controls No systemic response
capability Corruption
No feedback/ignore feedback
No meeting simple goals/objectives
No planning/total reactive
Programming does not meet/under standards
Ineffective/harmful practices
Misrepresentation of activity
Staff incompetent No controls No reporting/
inaccurate reports
Excluded from community activity
Seen as corrupt or incompetent
Seen as not being of assistance to the poor
Disagree with agency philosophy
Micromanage Don’t attend Corrupt Incompetent “Rubber Stamp”
Source: Mid-Iowa Community Action, Inc. Magi York, Executive Director
4957-201t/trng
© 2005 Wipfli LLP
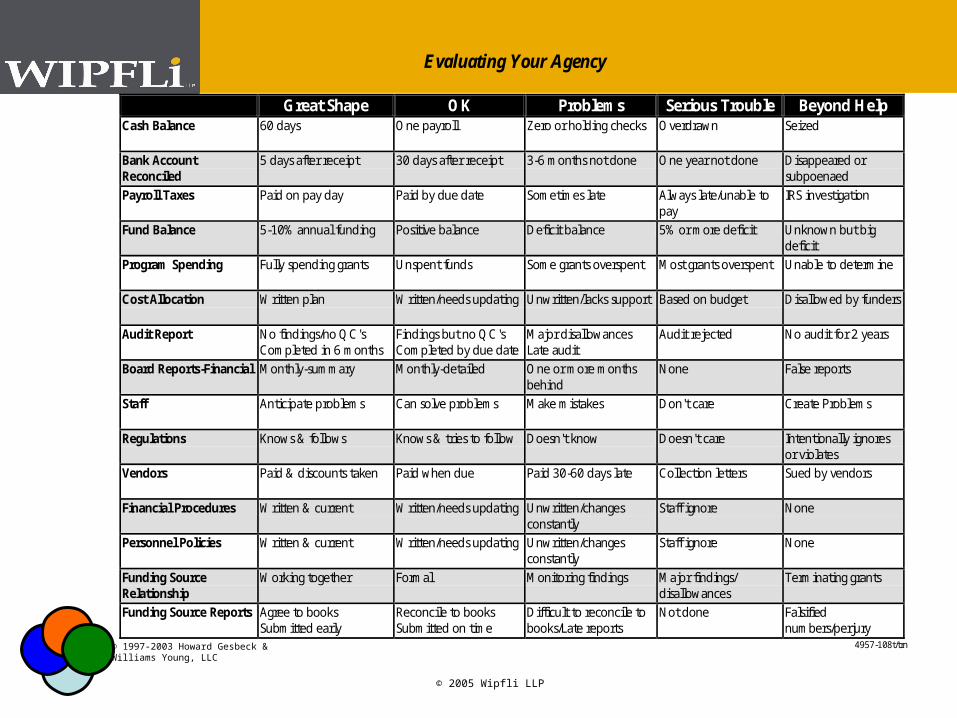
Evaluating Your Agency
Great Shape OK Problems Serious Trouble Beyond Help Cash Balance 60 days One payroll Zero or holding checks Overdrawn Seized
Bank Account Reconciled
5 days after receipt 30 days after receipt 3-6 months not done One year not done Disappeared or subpoenaed
Payroll Taxes Paid on pay day Paid by due date Sometimes late Always late/unable to pay
IRS investigation
Fund Balance 5-10% annual funding Positive balance Deficit balance 5% or more deficit Unknown but big deficit
Program Spending Fully spending grants Unspent funds Some grants overspent Most grants overspent Unable to determine
Cost Allocation Written plan Written/needs updating Unwritten/lacks support Based on budget Disallowed by funders
Audit Report No findings/no QC's Completed in 6 months
Findings but no QC's Completed by due date
Major disallowances Late audit
Audit rejected No audit for 2 years
Board Reports-Financial Monthly-summary Monthly-detailed One or more months behind
None False reports
Staff Anticipate problems Can solve problems Make mistakes Don't care Create Problems
Regulations Knows & follows Knows & tries to follow Doesn't know Doesn't care Intentionally ignores or violates
Vendors Paid & discounts taken Paid when due Paid 30-60 days late Collection letters Sued by vendors
Financial Procedures Written & current Written/needs updating Unwritten/changes constantly
Staff ignore None
Personnel Policies Written & current Written/needs updating Unwritten/changes constantly
Staff ignore None
Funding Source Relationship
Working together Formal Monitoring findings Major findings/ disallowances
Terminating grants
Funding Source Reports Agree to books Submitted early
Reconcile to books Submitted on time
Difficult to reconcile to books/Late reports
Not done Falsified numbers/perjury
4957-108t/trn © 1997-2003 Howard Gesbeck &Williams Young, LLC

© 2005 Wipfli LLP