zr and silicotungstic acid incorporated silicate ... fileapproval of the thesis: zr and...
TRANSCRIPT

Zr AND SILICOTUNGSTIC ACID INCORPORATED SILICATE STRUCTURED MESOPOROUS CATALYSTS FOR DIMETHYL ETHER SYNTHESIS
A THESIS SUBMITTED TO THE GRADUATE SCHOOL OF NATURAL AND APPLIED SCIENCES
OF MIDDLE EAST TECHNICAL UNIVERSITY
BY
SULTAN ORMAN
IN PARTIAL FULFILLMENT OF THE REQUIREMENTS FOR
THE DEGREE OF MASTER OF SCIENCE IN
CHEMICAL ENGINEERING
AUGUST 2011

Approval of the thesis:
Zr AND SILICOTUNGSTIC ACID INCORPORATED SILICATE STRUCTURED MESOPOROUS CATALYSTS FOR DIMETHYL ETHER
SYNTHESIS
submitted by SULTAN ORMAN in partial fullfillment of the requirements for the degree of Master of Science in Chemical Engineering Department, Middle East Technical University by,
Prof. Dr. Canan Özgen ____________________ Dean, Graduate School of Natural and Applied Sciences Prof. Dr. Deniz Üner ____________________ Head of Department, Chemical Engineering Prof. Dr. Timur Doğu ____________________ Supervisor, Chemical Engineering Dept., METU Examining Committee Members: Prof. Dr. Pınar Çalık Chemical Engineering Dept., METU ____________________ Prof. Dr. Timur Doğu Chemical Engineering Dept., METU ____________________ Prof. Dr. İrfan Ar Chemical Engineering Dept., Gazi University ____________________ Assoc. Prof. Dr. Naime A. Sezgi Chemical Engineering Dept., METU ____________________ Assist. Prof. Dr. Dilek Varışlı Advanced Technologies, Gazi University ____________________ Date: 19.08.2011

iii
I hereby declare that all information in this document has been obtained and presented in accordance with academic rules and ethical conduct. I also declare that, as required by these rules and conduct, I have fully cited and referenced all material and results that are not original to this work.
Name, Last name: Sultan ORMAN
Signature :

iv
ABSTRACT
Zr AND SILICOTUNGSTIC ACID INCORPORATED SILICATE STRUCTURED MESOPOROUS CATALYSTS FOR DIMETHYL
ETHER SYNTHESIS
Orman, Sultan
M.Sc., Department of Chemical Engineering
Supervisor: Prof. Dr. Timur Doğu
August, 2011, 142 pages
Due to high consumption rates of petroleum derived fuels and environmental
regulations, significant search has been initiated for the development of
environmental friendly and efficient fuels, which were derived from more abundant
feedstocks. Dimethyl ether (DME), as having a good combustion quality and high
cetane number, is an efficient alternative for diesel fuel. With improved combustion
quality, the emissions from DME used engines are greatly decreased. DME synthesis
can be carried out via two different methods; methanol dehydration on acidic
catalysis and syn-gas conversion on bifunctional catalysis.
In this study, the aim is to synthesize acidic catalysts using direct
hydrothermal synthesis method for DME synthesis as using methanol as feed stock
via dehydration and to characterize these materials.
The support of the synthesized materials comprises of MCM-41 structure and
silicotungstic acid (STA) and metals (Zr / Ni / Cu) were incorporated into the MCM-
41 structure during synthesis. Two different techniques were used to extract the
v
surfactant (CTMABr) from catalyst matrix. First one is the conventional calcination
technique (at 350°C) and the second is supercritical fluid extraction (at various
operating conditions) with methanol modified CO2. The effect of metal loading on
extraction performance is analyzed through characterizations of Ni and Cu
incorporated materials. In addition, The effect of operation parameters on catalyst
properties are also investigated with performing extraction at different pressures for
different durations. By changing the type of metal incorporated into the catalyst, the
extraction performance is also monitored. The characterization results indicated that,
SFE process is also a promising method for surfactant removal.
The activities of zirconium added catalysts are tested in methanol dehydration
reaction towards DME. It is concluded that the conversion of methanol and
selectivity of DME in presence of extracted samples are lower (maximum yield -
0.54- obtained at 450°C with sceSZ1) compared to the calcined materials (maximum
yield -0.80- obtained at 300°C with cSZ6). This result can also be foreseen by
DRIFTS analysis of pyridine adsorbed samples. The acid sites of extracted materials
are not as strong as in the calcined catalysts.
Keywords; Dimethyl ether, methanol dehydration, supercritical fluid extraction,
heteropolyacid, mesoporous catalysts
vi
ÖZ
DİMETİL-ETER SENTEZİNDE Zr VE SİLİKOTUNGSTİK ASİT İÇEREN SİLİKA YAPILI MEZOGÖZNEKLİ KATALİZÖRLER
Orman, Sultan
Yüksek Lisans, Kimya Mühendisliği
Tez Yöneticisi: Prof. Dr. Timur Doğu
Ağustos, 2011, 142 sayfa
Petrol kaynaklı yakıtların tüketiminin artması ve çevresel yönetmeliklerden
dolayı, hammadde kaynağı bol olan çevre dostu ve verimli yakıtlarla ilgili olarak
önemli çalışmalar başlatılmıştır. Dimetil eter (DME), yanma kalitesinin iyi olması ve
yüksek setan sayısıyla beraber dizel yakıtına alternatif olarak görülmektedir. Yanma
kalitesinin iyileştirilmesiyle, DME kullanılan motorlarda emisyonlar oldukça
düşürülmektedir. DME sentezi iki farklı yolla gerçekleştirilebilir; asit katalizörler
üzerinde metanol dehidrasyonu ve bifonksiyonel katalizörler üzerinde sentez gazı
dönüşümü yoluyla.
Bu çalışmada amaç, DME sentezini methanol dehidrasyonu ile
gerçekleştirmektir. Çalışma kapsamında, asidik katalizörler doğrudan hidrotermal
sentez metoduyla sentezlenmiş ve karakterize edilmiştir.
Sentezlenen katalizörlerin destek maddesi MCM-41’dir ve silikotungstik asid
(STA) ve metaller (Zr / Ni / Cu) MCM-41 üzerine sentez süresince eklenmiştir.
Yüzey aktif maddenin (CTMABr) katalizör yapısından uzaklaştırılmasında iki farklı
metot kullanılmıştır. Bunlardan ilki, kalsinasyon (350°C’de) ve ikinci ise metanol ile

vii
modifiye edilmiş CO2 ile süperkritik akışkan ekstraksiyondur (farklı çalışma
koşullarında). Farklı metal türlerinin ekstraksiyon performansı üzerindeki etkisi, Ni
ve Cu kullanılarak hazırlanmış katalizörlerin karakterizasyonları ile incelenmiştir.
Buna ek olarak çalışma koşullarının katalizör özellikleri üzerindeki etkisi
ekstraksiyonu farklı basınç ve periyotlarda gerçekleştirerek araştırılmıştır. Buna ek
olarak, metal tipinin de değiştirilmesiyle ekstraksiyon verimliliği gözlenmiştir.
Karakterizasyon sonuçları, ekstraksiyonun da yüzey aktif madde uzaklaştırmada
umut verici bir yöntem olduğunu göstermektedir.
Zr eklenmiş katalizörlerin aktiviteleri metanol dehidrasyonu reaksiyonunda
test edilmiştir. Sonuç olarak, metanol dönüşümü ve DME seçiciliği kalsine edilmiş
numunelerde (maksimum verim -0.80- 300°C’de cSZ6 ile) ekstraksiyon yapılmış
numunelere (maksimum verim -0.54- 450°C’de sceSZ1 ile) kıyasla daha fazladır. Bu
sonuç, DRIFTS analizi ile de öngörülebilir. Ekstraksiyon yapılmış numunelerin asit
bölgeleri kalsine edilen numuneler kadar güçlü değildir.
Anahtar kelimeler: Dimetil eter, metanol dehidrasyonu, süperkritik akışkan
ekstraksiyon, heteropoliasit, mezogözenekli katalizör

viii
To my little brothers and sister
ix
ACKNOWLEDGEMENTS
First of all, I would like to express my sincere gratitude to my supervisor
Prof. Dr. Timur Doğu for his support and guidance throughout my studies. His
motivation, enthusiasm and immense knowledge inspired me in not only my thesis
work but also my future career as a chemical engineer. I could not have imagined
having a better mentor for my M.Sc. study.
I would like to express my special thanks to Prof. Dr. Gülşen Doğu and her
research group in Gazi University Chemical Engineering Department for their
support in this work. I would like to thank Assoc. Prof. Dr. Naime A. Sezgi and
Assist. Prof. Dr. Dilek Varışlı for their positive attitude and help in this study.
I thank METU Central Laboratory, Metallurgical and Materials Engineering
and Chemical Engineering staff for the characterization analyses and the technical
assistance.
I thank to my fellow labmates in our research group at Kinetic Lab; Dr.
Zeynep Obalı, Canan Martı, Kenan Cem Tokay, Ayça Arınan, Ayşegül Çiftçi, Caner
Hocaoğlu and Seval Gündüz for stimulating discussions and all the nice memories
we had in these two years. My special thanks go to Zeynep Obalı and Ayça Arınan
for helping in technical issues and being so patient in answering all my questions.
Furthermore, I thank my friends Merve Şahin (u) and Merve Şahin (k) for
their invaluable friendship and support through years and of course to my homemate,
Elif Yavuz for her friendship from the age of 12. Ebru Pelvan and Ahad Kargı are
also two of the most important people both in METU and in my personal life. I
would like to thank also to the families of Dinçer, Işık and Şahin’s (both two) –
including all members- for their valuable support to make my life easier in Ankara.
Finally, a special thank goes to my family; my parents; for making me feel a
lucky and privileged person and my brothers, Mehmet Ali and Furkan; and sister,
Kübra for encouraging me and supporting me to do my best.
This support is received by Türkiye Bilimsel ve Teknolojik Araştırma
Kurumu (TÜBİTAK) through BİDEB scholarship that I would like to thank.
x
TABLE OF CONTENTS
ABSTRACT ................................................................................................................ iv
ÖZ ............................................................................................................................... vi
ACKNOWLEDGEMENTS ........................................................................................ ix
TABLE OF CONTENTS ............................................................................................. x
LIST OF FIGURES ................................................................................................. xvii
FIGURES ................................................................................................................. xvii
NOMENCLATURE ................................................................................................... xx
CHAPTERS
INTRODUCTION ....................................................................................................... 1
DME AS A DIESEL ALTERNATIVE ....................................................................... 3
2.1. Properties of DME ............................................................................................. 4
2.2. Application Areas of DME ................................................................................ 6
2.2.1. General Applications .................................................................................. 6
2.2.2. Evaluation of Dimethyl Ether as a Fuel ...................................................... 7
2.3. Production Techniques of DME ........................................................................ 9
2.3.1. Methanol Dehydration .............................................................................. 13
2.3.2. Syngas Conversion ................................................................................... 16
POROUS MATERIALS AND APPLICATIONS ..................................................... 19
3.1. Mesoporous Materials-M41S Family .............................................................. 20
3.2. MCM-41 .......................................................................................................... 21
3.2.1 Synthesis Procedure ................................................................................... 21
3.2.2. Characterization of MCM-41 ................................................................... 25
3.2.2.1. X-Ray Diffraction .............................................................................. 25
3.2.2.2. Nitrogen Physisorption ...................................................................... 25
3.2.3. Methods of Modification of MCM-41 Structure: MCM-41 as a Support 26
xi
3.2.4. Some Application Areas of MCM-41 ....................................................... 27
3.3. Other M41S Family Members ......................................................................... 29
HETEROPOLYACIDS AND APPLICATIONS ...................................................... 31
4.1. Structure of Heteropolyacids ........................................................................... 31
4.2. Acidity of Heteropolyacids.............................................................................. 32
4.3. Thermal Stabilities of Heteropolyacids ........................................................... 34
4.4. Applications of Heteropolyacids ..................................................................... 35
4.4.1. Acid Catalyzed Reactions by HPAs ......................................................... 36
4.4.2. Oxidation Reactions with HPAs and Bifunctional Catalysis of HPAs ..... 37
SUPERCRITICAL FLUID EXTRACTION ............................................................. 38
5.1. CO2 as an SFE agent ....................................................................................... 39
5.2. Applications of SFE ........................................................................................ 41
5.3. SFE in Catalyst Preparation............................................................................. 41
EXPERIMENTAL STUDIES .................................................................................... 45
6.1. Catalyst Preparation......................................................................................... 45
6.1.1. One Pot Hydrothermal Synthesis of STA-Zr/Silica (SZ Group) Catalysts ............................................................................................................................ 45
6.1.1.1. Chemicals Used .................................................................................. 45
6.1.1.2. Synthesis Procedure ........................................................................... 46
6.1.2. One Pot Hydrothermal Synthesis of STA-Ni/Silica and STA-Cu/Silica Catalysis .............................................................................................................. 49
6.1.2.1. Chemicals Used .................................................................................. 49
6.1.2.2. Synthesis Procedure ........................................................................... 49
6.2. Characterization of Catalysts ........................................................................... 51
6.2.1. X-Ray Diffraction (XRD) ......................................................................... 51
6.2.2. Nitrogen Physisorption ............................................................................. 52
6.2.3. Energy Dispersive Spectroscopy (EDS) ................................................... 53
6.2.4. Thermogravimetric Analysis (TGA/DTA) ............................................... 53
6.2.5. Scanning Electron Microscopy (SEM) ..................................................... 54
6.2.6. Fourier Transform Infrared Spectroscopy (FT-IR) and Diffuse Reflectance Fourier Transform Infrared Spectroscopy (DRIFTS) ......................................... 54
6.3. Experimental Set Up........................................................................................ 55

xii
6.3.1 Supercritical Fluid Extraction System ....................................................... 56
6.3.2 Methanol Dehydration System .................................................................. 57
CHAPTER 7 .............................................................................................................. 61
RESULTS .................................................................................................................. 61
7.1. Characterization Results .................................................................................. 61
7.1.1. Characterization Results of STA-Zr/Silica (SZ Group) Catalysts ............ 61
7.1.1.1. Characterization Results of Calcined SZ Group Catalysts ................ 61
7.1.1.1.1. XRD Results ................................................................................ 62
7.1.1.1.2. EDS Results ................................................................................. 63
7.1.1.1.3. Nitrogen Physisorption ................................................................ 64
7.1.1.1.4. FT-IR Results .............................................................................. 68
7.1.1.1.5. DRIFTS Results .......................................................................... 70
7.1.1.1.6. SEM Results ................................................................................ 71
7.1.1.2. Characterization Results of Extracted SZ Group Catalysis ............... 72
7.1.1.2.1. XRD Results ................................................................................ 72
7.1.1.2.2. Nitrogen Physisorption ................................................................ 75
7.1.1.2.3. FT-IR Results .............................................................................. 79
7.1.1.2.4. DRIFTS Results .......................................................................... 80
7.1.1.2.5. SEM Results ................................................................................ 82
7.1.1.3. Comparison of Extraction and Calcination Processes through Characterization Results of SZ1 and SZ2 Catalysts ....................................... 83
7.1.1.3.1. XRD Results ................................................................................ 83
7.1.1.3.2. EDS Results ................................................................................. 84
7.1.1.3.3. Nitrogen Physisorption ................................................................ 85
7.1.1.3.4. FT-IR Results .............................................................................. 86
7.1.1.3.5. SEM Results ................................................................................ 87
7.1.1.3.6. TGA Results ................................................................................ 88
7.1.1.4. Effect of Extraction Parameters on Catalyst Properties ..................... 89
7.1.1.4.1. Extraction Period ......................................................................... 90
7.1.1.4.2. Extraction Pressure ...................................................................... 92
7.1.2. Characterization Results of STA-Ni/Silica (SN) Catalyst ........................ 97
7.1.2.1. XRD Results ...................................................................................... 97

xiii
7.1.2.2. EDS Results ....................................................................................... 98
7.1.2.3. Nitrogen Physisorption ...................................................................... 99
7.1.2.4. FT-IR Results ................................................................................... 100
7.1.2.5. SEM Results ..................................................................................... 101
7.1.3. Characterization Results of STA-Cu/Silica (SC) Catalyst ..................... 102
7.1.3.1. XRD Results .................................................................................... 102
7.1.3.2. EDS Results ..................................................................................... 103
7.1.3.3. Nitrogen Physisorption .................................................................... 104
7.1.3.4. FT-IR Results ................................................................................... 105
7.1.3.5. SEM Results ..................................................................................... 106
7.2. Activity Results ............................................................................................. 107
7.2.1. Activity Results of Calcined SZ Group Catalysts .................................. 107
7.2.2. Activity Results of Extracted SZ Group Catalysts ................................. 110
CONCLUSIONS AND RECOMMENDATIONS .................................................. 114
REFERENCES ......................................................................................................... 118
APPENDICES
EQUILIBRIUM CURVE CALCULATION DETAILS .......................................... 125
A.1. Methanol dehydration reaction ..................................................................... 125
A.2. Syn-Gas conversion reactions ...................................................................... 127
EVALUATION OF GC RESULTS ......................................................................... 130
PORE DIAMETER CALCULATION .................................................................... 132
SEM IMAGES OF CATALYSIS ............................................................................ 134
TGA CURVES OF SELECTED SAMPLES ........................................................... 137
E.1. TGA Curves of Catalyst Used in Comparison of Extraction and Calcination .............................................................................................................................. 137
E.2. TGA Curves of Catalyst Used in Effect of Pressure in Extraction ............... 139
APPENDIX F ........................................................................................................... 141
PRODUCT DISTRIBUTIONS IN METHANOL DEHYDRATION REACTIONS
.................................................................................................................................. 141

xiv
F.1. Product Distribution in methanol dehydration reaction performed with calcined samples ................................................................................................... 141
F.2. Product Distribution in methanol dehydration reaction performed with extracted samples.................................................................................................. 142

xv
LIST OF TABLES
TABLES
Table 1: Physical properties of DME [4, 5] ................................................................ 5
Table 2: Fuel properties of DME and other fuels [2, 11, 12, 13] ................................ 8
Table 3: Reaction formulas concerning DME synthesis [18] ................................... 10
Table 4: First three dissociation constants for acidic materials in acetone at 25°C
[48] ...................................................................................................................... 33
Table 5: Thermal stability limits of selected HPAs [56] ........................................... 35
Table 6: Critical properties of common SFE solvents [31, 66] ................................. 39
Table 7: Synthesis Conditions for STA-Zr/Silica Catalysts ...................................... 48
Table 8: Extractions Conditions for STA-Zr/Silica Catalysts ................................... 48
Table 9: Synthesis Conditions for STA-Ni/Silica and STA-Cu/Silica Catalysts ...... 50
Table 10: Extractions Conditions for STA-Ni/Silica and STA-Cu/Silica Catalysts 50
Table 11: Conditions of GC ...................................................................................... 59
Table 12: Summary of experimental conditions ....................................................... 60
Table 13: Prepared atomic ratios in SZ catalysts compared with EDS results ......... 64
Table 14: Physical Properties of the calcined catalysts ............................................. 65
Table 15: Comparison of calcined materials with untreated STA ............................ 69
Table 16: Physical Properties of the extracted catalysts ........................................... 75
Table 17: Comparison of extracted materials with untreated STA ........................... 81
Table 18: Comparison of EDS results of extracted and calcined samples of SZ2 .... 84
Table 19: Comparison of physical properties of SZ1 catalysts ................................. 86
Table 20: Weight losses (%) of sceSZ2 and cSZ1 in TGA ....................................... 89
Table 21: Effect of extraction period on catalysts’ physical properties .................... 91
Table 22: Prepared atomic ratios in SN catalysts compared with EDS results ......... 99
Table 23: Physical Properties of the SN catalysts ..................................................... 99
Table 24: Prepared atomic ratios in SC catalysts compared with EDS results ....... 104
Table 25: Physical Properties of the SC catalysts ................................................... 104
Table 26: Calculation parameters for effluent species from GC ............................. 130
Table 27: Product distribution in presence of calcined catalysis (τ= 0.27 s.g/cm3 ) 141

xvi
Table 28: Product distribution in presence of extracted catalysis (τ= 0.27 s.g/cm3)
.......................................................................................................................... 142
xvii
LIST OF FIGURES
FIGURES
Figure 1: Structure of DME ........................................................................................ 4
Figure 2: DME synthesis from NG proposed by JFE [12] ....................................... 11
Figure 3: Process flow diagram by Haldor-Topsoe for direct DME production [19]13
Figure 4: Equilibrium conversion of methanol ......................................................... 14
Figure 5: Flow through a slurry reactor [12] ............................................................. 16
Figure 6: Equilibrium conversion of CO in DME synthesis (CO/H2=1) .................. 17
Figure 7: XRD patterns of MCM-41 samples [38] ................................................... 22
Figure 8: Effect of surfactant amount on catalyst structure [40] ............................... 22
Figure 9: MCM-41 formation via LCT mechanism [42] .......................................... 24
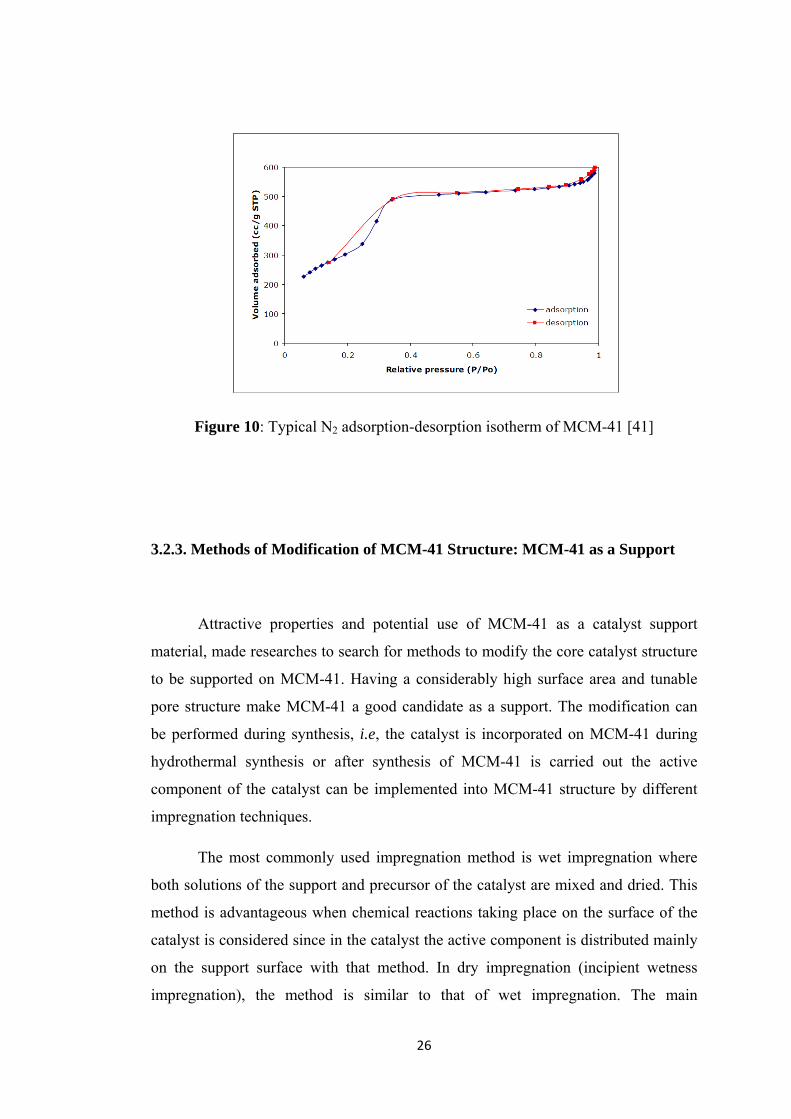
Figure 10: Typical N2 adsorption-desorption isotherm of MCM-41 [41] ................. 26
Figure 11: Phase diagram of CO2 [67] ...................................................................... 40
Figure 12: Supercritical fluid extraction system [modified from 81] ....................... 57
Figure 13: Methanol dehydration system [24] .......................................................... 58
Figure 14: XRD pattern of calcined SZ group catalysts (1 to 3) .............................. 62
Figure 15: XRD pattern of calcined SZ group catalysts (4 to 6) .............................. 62
Figure 16: Nitrogen adsorption-desorption isotherm of calcined SZ catalysts (1-3) 65
Figure 17: Nitrogen adsorption-desorption isotherm of calcined SZ catalysts (4-6) 66
Figure 18: Pore size distributions of cSZ catalysts ................................................... 67
Figure 19: FT-IR results of calcined samples ........................................................... 68
Figure 20: Drifts analysis of calcined SZ catalysts ................................................... 70
Figure 21: SEM images of (a) cSZ1 (b) cSZ2 (magnification 5000 times) .............. 71
Figure 22: SEM images of (a) cSZ4 (b) cSZ5 (magnification 5000 times) .............. 72
Figure 23: XRD pattern of extracted SZ group catalysts (1-3) ................................. 73
Figure 24: Low angle XRD pattern of SZ (1-3) catalysis compared with MCM-41 73
Figure 25: XRD pattern of extracted SZ group catalysts (4-6) ................................. 74
Figure 26: Nitrogen adsorption-desorption isotherm of extracted SZ catalysts (1-2)
............................................................................................................................ 77
xviii
Figure 27: Nitrogen adsorption-desorption isotherm of extracted SZ catalysts (4-5)
............................................................................................................................ 78
Figure 28: Pore size distributions of sceSZ catalysts ................................................ 79
Figure 29: FT-IR results of extracted samples .......................................................... 80
Figure 30: Drifts analysis of extracted SZ group catalys .......................................... 81
Figure 31: SEM images of (a) sceSZ1 (b) sceSZ2 .................................................... 82
Figure 32: SEM images of (a) sceSZ4 (b) sceSZ5 .................................................... 82
Figure 33: XRD pattern of SZ1 catalysts compared with untreated STA ................ 83
Figure 34: Comparison N2 physisorption results of SZ1 catalysts; (a) N2 isotherms
(b) Pore size distribution ..................................................................................... 85
Figure 35: Comparison of FT-IR characteristics of SZ1 catalysis ............................ 87
Figure 36: SEM images of SZ2 catalysts (a) sceSZ2 (magnified 1500 times), (b)
cSZ2 (magnified 6000 times) ............................................................................. 88
Figure 37: TGA curves of selected catalysis ............................................................. 89
Figure 38: Pore size distributions of SZ3 catalysis ................................................... 91
Figure 39: The effect of extraction pressure on catalyst SZ3 physical properties .... 93
Figure 40: The effect of extraction pressure on catalyst SZ3 N2 ads-des isotherms 94
Figure 41: XRD patterns of SZ3 catalysis ................................................................ 94
Figure 42: Low angle XRD pattern of SZ3 catalysis compared with MCM-41 ....... 95
Figure 43: TGA curves of SZ3 catalysis ................................................................... 96
Figure 44: XRD pattern of SN catalysts ................................................................... 98
Figure 45: Nitrogen adsorption-desorption isotherm of SN catalysts ..................... 100
Figure 46: FT-IR results of SN samples.................................................................. 101
Figure 47: SEM images of SN catalysts (a) cSN (b) sceSN ................................... 102
Figure 48: XRD patterns of SC catalysts ................................................................ 103
Figure 49: Nitrogen adsorption-desorption isotherm of SC catalysts ..................... 105
Figure 50: FT-IR curves of SC samples .................................................................. 106
Figure 51: SEM images of SC catalysts (a) cSC (b) sceSC .................................... 107
Figure 52: Conversion of methanol with calcined SZ catalysts.............................. 108
Figure 53: Selectivity of calcined SZ catalysts towards DME ............................... 108
Figure 54: Product distribution in presence of cSZ6 catalyst in methanol dehydration
.......................................................................................................................... 109
xix
Figure 55: Conversion of methanol with extracted SZ catalysts ............................ 111
Figure 56: Selectivity of extracted SZ catalysts towards DME .............................. 111
Figure 57: Product distribution in presence of sceSZ1 catalyst in methanol
dehydration ....................................................................................................... 112
Figure 58: SEM images of (a) cSZ1 and (b) cSZ2 ................................................. 134
Figure 59: SEM images of (a) cSZ3 and (b) cSZ4 ................................................. 134
Figure 60: SEM images of (a) cSZ5 and (b) cSZ6 ................................................. 135
Figure 61: SEM images of (a) cSC and (b) cSN ..................................................... 135
Figure 62: SEM images of (a) sceSZ1 and (b) sceSZ2 ........................................... 135
Figure 63: SEM images of (a) sceSZ3 and (b) sceSZ4 ........................................... 136
Figure 64: SEM images of (a) sceSZ5 and (b) sceSZ6 ........................................... 136
Figure 65: SEM images of (a) sceSC and (b) sceSN .............................................. 136
Figure 66: TGA curve of cSZ1 ............................................................................... 137
Figure 67: TGA curve of sceSZ2 ............................................................................ 138
Figure 68: TGA curve of sceSZ3-300 ..................................................................... 139
Figure 69: TGACurve of sceSZ3 ............................................................................ 139
Figure 70: TGA curve of sceSZ3-600 ..................................................................... 140

xx
NOMENCLATURE
ATR: Autothermal reformer
DME: Dimethyl Ether
EDS: Energy Dispersive Spectroscopy
IUPAC: International Union of Pure and Applied Chemistry
MW: Molecular weight (g/mol)
MCM: Mobil Composition of Matter
MeOH: Methanol
P: Pressure (bar)
Pc : Pressure at Critical Point (bar)
SCF: Supercritical Fluid
SEM: Scanning Electron Microscopy
SFE: Supercritical Fluid Extraction
STA: Silicotungstic Acid
SC: Cu-STA/Silica
SN: Ni-STA/Silica
SZ: Zr-STA/Silica
T: Temperature (°C)
Tc : Absolute Temperature at Critical point (K)
TGA: Thermogravimetric Analysis
XRD: X-Ray Diffraction
1
CHAPTER 1
INTRODUCTION
Higher consumption rates in fuel reserves in the world make the researchers
to look for the newer sources of energy. Dimethyl ether (DME) is considered to be a
clean-burning alternative to liquefied petroleum gas, liquefied natural gas and diesel
fuel due to its promising fuel properties (like high cetane number). Besides, having
higher oxygen content compared to conventional diesel fuels, use of DME decreases
the amount of air needed to activate the engine. High quality fuel behavior,
suppresses the emission of CO, NOx, hydrocarbons and smoke. Due to its clean
burning properties, DME is considered as a green fuel candidate. The details
regarding to the properties and usage areas of DME are described in Chapter 2. The
production routes, both conventional method and the direct synthesis, are explained
in detail at the end of the same chapter.
This work is mainly related to the synthesis and characterization of calcined
and supercritically extracted heteropolyacid (HPA) and metal (Zr, Ni and Cu)
supported on silicate structured mesoporous materials. These materials were
designed to show activity in dimethyl ether (DME) and dimethyl carbonate (DMC)
production from methanol. The activity tests of the catalysts were performed in a
flow reactor for DME synthesis by methanol dehydration.
In Chapter 3, the general properties of mesoporous materials, namely M41S
family members, are summarized. Each member is analyzed in terms of its specific
area of properties and particularly, synthesis procedure of MCM-41 is included. In
addition, the characteristic properties of MCM-41 are explained with some selected

2
characterization methods, e.g. X-Ray diffraction and Transmission Electron
Microscopy.
The details related to the heteropolyacids are explained in four main sections.
Considered to approach to behave like a superacid, the acidities of HPAs are
analyzed in relation to the whole structural properties. Different types of HPA’s
affecting the acidity were discussed in the first and second sections of Chapter 4. One
other important property of HPAs; their thermal stability, is also discussed in the
same chapter, which was concluded with several application areas and reactions
utilizing HPAs.
One part of the work done with that study is related to trying different
surfactant removal techniques during catalyst synthesis. Calcination is the
conventional procedure of surfactant removal, while the second non-conventional
procedure is supercritical fluid extraction (SFE). The main aim of SFE application is
that to extract the unwanted components of a matrix without destroying it. This
matrix can be a foodstuff (coffee, tea etc.) or any material (catalytic, pharmaceutical
etc). Uses of SFE in different applications are included in Chapter 5 with general
properties of CO2 as an extracting agent.
In Chapter 6, the details regarding to the experimental studies; including
catalyst synthesis (silicotungstic acid and Zr/Ni/Cu incorporated MCM-41) and
characterization, surfactant removal steps and activity tests are explained. The
experimental set-up of SFE system and methanol dehydration system are also
contained in the same chapter. The characterization and activity results of the
catalysts are reported in the next chapter; Chapter 7. The synthesized catalysts are
compared in terms of characteristic differences formed via different surfactant
removal steps. SFE process is also analyzed to determine the effects of operating
parameters (extraction period and pressure) on properties of end products. For DME
synthesis, only extracted and calcined samples of STA-Zr/MCM-41 catalysts are
used. The activity results are analyzed at the end of Chapter 7.
The work is concluded with conclusions and recommendations parts in
Chapter 8.
3
CHAPTER 2
DME AS A DIESEL ALTERNATIVE
One of the main problems of today’s world is the global warming and the
increase in the level of CO2, as being the 60% contributor to the situation [1], and
other green house gases in the atmosphere, which trigger this problem. To prevent
the increase of atmospheric CO2 level, new ways to produce energy are searched.
One option is to decrease the usage of CO2 emitting sources and find others or
produce them environmentally. Dimethyl ether (DME) is an alternative that can be
used as a fuel alternate and in petrochemical industry. The usage of DME can
contribute to lowering CO2 both by lowering emissions and by utilization in the
synthesis.
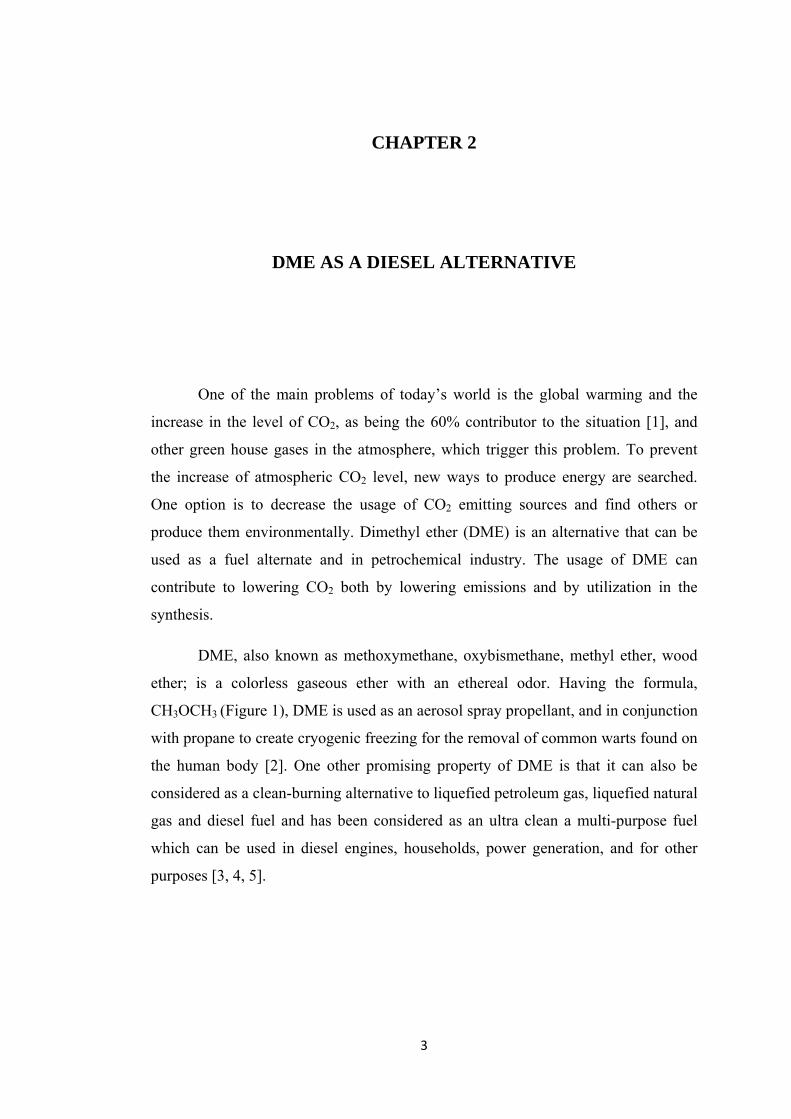
DME, also known as methoxymethane, oxybismethane, methyl ether, wood
ether; is a colorless gaseous ether with an ethereal odor. Having the formula,
CH3OCH3 (Figure 1), DME is used as an aerosol spray propellant, and in conjunction
with propane to create cryogenic freezing for the removal of common warts found on
the human body [2]. One other promising property of DME is that it can also be
considered as a clean-burning alternative to liquefied petroleum gas, liquefied natural
gas and diesel fuel and has been considered as an ultra clean a multi-purpose fuel
which can be used in diesel engines, households, power generation, and for other
purposes [3, 4, 5].

4
Figure 1: Structure of DME
Due to the huge market potential, the research on dimethyl ether synthesis [6,
7] and its utilization [8, 9] have been attracting more and more interests. Being
identified as a potential diesel and cooking fuel, DME has number of excellent
characteristics. It has an oxygen concentration of 34.78% and can be burned without
soot emission, while for traditional diesel fuels, one cannot expect simultaneous NOx
and soot emission controls.
Conventional DME production uses the methanol dehydration method. The
second method is its production directly from synthesis gas, which is composed of
CO, CO2 and hydrogen. This chapter is related to the general properties and
application areas of DME and concludes with the synthesis methods.
2.1. Properties of DME
Under standard temperature and pressure, DME exists in gas phase. However,
the properties of the liquid and solid phases are also worth researching, such that, the
phase may change according to its usage area. Because of that reason, properties of

5
each phase will be explained separately. In Table 1, these properties are shown [4,
5].
Table 1: Physical properties of DME [4, 5]
Property Value
Phase
Solid
Melting Point -141.5 °C
Heat of Fusion (at 1 atm, melting temperature)
111.34 kJ/kg
Liquid
Boiling Point -24.8 °C
Heat of Vaporization (at 1atm, boiling point) 466.9 kJ/kg
Vapor pressure (at 20 °C) 5 atm
Density 734.7 kg/m3
Gas
Specific Density (air=1) (at 1 atm, 15°C) 1.59
Specific volume (at 1atm, 21 °C) 0.507 m3/kg
Density 1.97 kg/m3
Cp (at 1atm, 25 °C) 0.065 kJ/mol.K
Cv (at 1atm, 25 °C) 0.057 kJ/mol.K
Compressibility Factor (at 1atm, 15 °C) 0.9806
Critical temperature 126.9 °C
Critical pressure 53.7 bar
6
2.2. Application Areas of DME
The promising properties of DME, has opened several application areas for it.
Firstly, being a green agent; environmentally benign and non-toxic, DME is
considered as safe in ecological aspects.
The application areas of DME can be investigated in two separate sections
which consists of firstly the common usages and secondly the fuel alternate behavior
of DME.
2.2.1. General Applications
Dimethyl ether (DME) has been increasingly used as a propellant in aerosol
formulations to replace chlorofluorocarbons, which are found to destroy the ozone
layer of the atmosphere. DME is nontoxic and easily degrades in the troposphere.
Although about 90% of the major current U.S. aerosol industry uses hydrocarbon-
based propellants (mostly iso-butane and propane), DME could become a more
widely used propellant in the next five years.
Several aerosol-based household products include colognes, hair sprays and
dyes, personal care mousses, antiperspirants, and room air fresheners. DME is a
useful intermediate for the preparation of many important chemicals, including
methyl sulfate. Dimethyl sulfate is an important commercial commodity as a solvent
and also as an electrolyte in high energy density batteries [10]. Other than these
DME can be used as a refrigerant, a (co-)blowing agent for foam, a propellant for
aerosol products and as an extracting agent.
7
2.2.2. Evaluation of Dimethyl Ether as a Fuel
The need to use DME as a fuel mainly arose from the fact that there exists
lack in conventional carbon sourced fuels. The way that DME is used depends on the
application area; it can be used as an additive to fuel (making a mixture of DME and
LPG or diesel) to decrease emissions or increase engine performance with its
promising fuel characteristics (high cetane number and low auto-ignition
temperature, LPG storage resembling properties), or can be used directly in the diesel
engine. The fuel characteristics of DME are given in Table 2 as comparison with
diesel and other alternatives [2, 11, 12, 13].
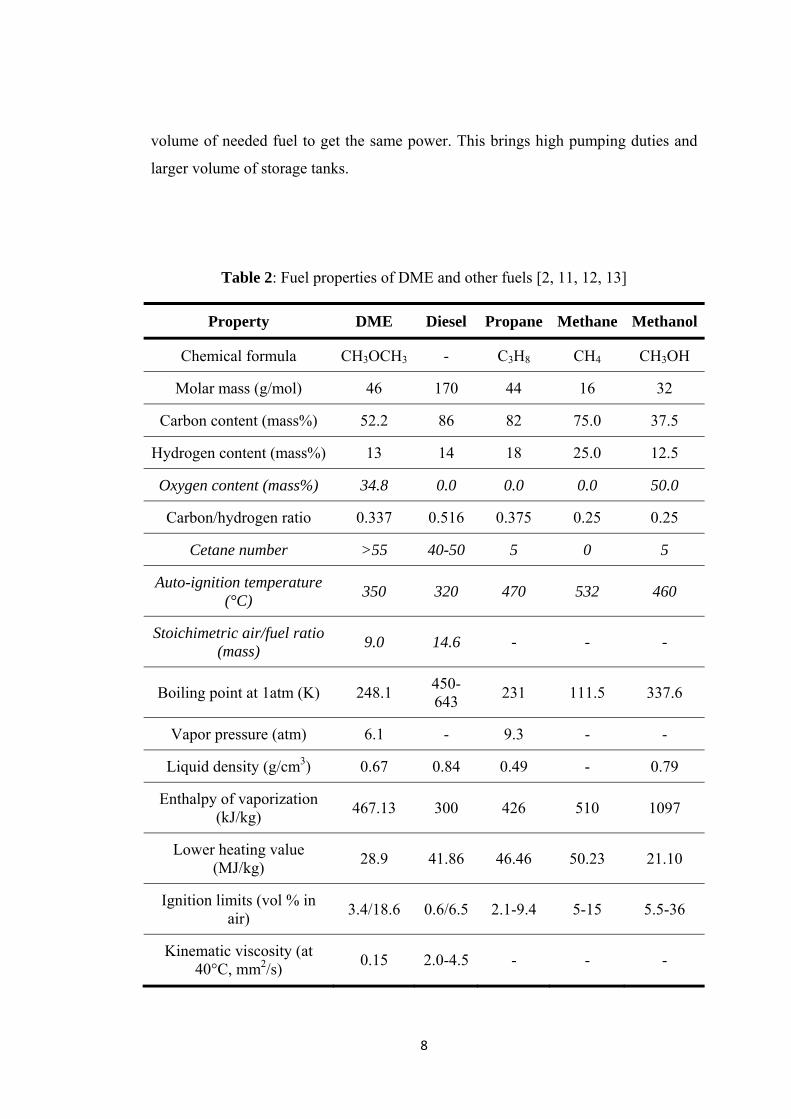
DME has superior qualifications as emphasized in italic form. The strategy in
using fuels with developing technology is to decrease the carbon content and
increase the remaining (hydrogen or oxygen). In DME case, it is observed that
although having the same hydrogen content, DME has high oxygen content. This
property decreases the needed air amount during ignition of the engine
Structure of DME, comprises of C-H and C-O bonds but no C-C. Having no
C-C bonds, DME provides smokeless operation in compression-ignition (CI)
engines. Studies reported in the article of Kowalewicz and Wojtyniak [11], showed
that, use of DME as a fuel in CI engine, improved thermal efficiency compared to
diesel fuel and also resulted with low emissions of NOx.
Low auto-ignition temperature of DME decreases the lag time of ignition and
enhances the cetane number of DME. This decrease in ignition lag time is again due
to the structure of DME. During combustion, fission of C-O bond is easier compared
to C-H bond because of smaller bond energy. Therefore the ignition is activated by
C-O bond breakage at lower temperatures (low auto-ignition temperature and higher
cetane number) which is not the case for diesel fuels [2].
In addition to these superior properties, DME has also some disadvantages as
a transportation fuel. Having a lower heating value and lower density, increases the
8
volume of needed fuel to get the same power. This brings high pumping duties and
larger volume of storage tanks.
Table 2: Fuel properties of DME and other fuels [2, 11, 12, 13]
Property DME Diesel Propane Methane Methanol
Chemical formula CH3OCH3 - C3H8 CH4 CH3OH
Molar mass (g/mol) 46 170 44 16 32
Carbon content (mass%) 52.2 86 82 75.0 37.5
Hydrogen content (mass%) 13 14 18 25.0 12.5
Oxygen content (mass%) 34.8 0.0 0.0 0.0 50.0
Carbon/hydrogen ratio 0.337 0.516 0.375 0.25 0.25
Cetane number >55 40-50 5 0 5
Auto-ignition temperature (°C)
350 320 470 532 460
Stoichimetric air/fuel ratio (mass)
9.0 14.6 - - -
Boiling point at 1atm (K) 248.1 450-643
231 111.5 337.6
Vapor pressure (atm) 6.1 - 9.3 - -
Liquid density (g/cm3) 0.67 0.84 0.49 - 0.79
Enthalpy of vaporization (kJ/kg)
467.13 300 426 510 1097
Lower heating value (MJ/kg)
28.9 41.86 46.46 50.23 21.10
Ignition limits (vol % in air)
3.4/18.6 0.6/6.5 2.1-9.4 5-15 5.5-36
Kinematic viscosity (at 40°C, mm2/s)
0.15 2.0-4.5 - - -
9
Studies conducted by Ying et al [15] showed that,. increasing the DME
content in DME/diesel blends decreases the specific energy consumption up to a
point compared with unblended diesel. The reason is higher oxygen content. Further
increase of DME, increases the consumed energy in the brake due to the reasons
mentioned above (high pumping durations) [2, 14].
Besides, to utilize DME as a fuel, the engine should be modified to overcome
the problems arising from different physical properties than diesel (low viscosity,
higher vapor pressure etc.). Low viscosity, firstly causes easy leakage in the system,
which than brings the need to make extra protection to get rid of this (use of more
protective sealing materials). In addition to prevent wearing problems evolving from
lower lubricity property, lubricant additives should be used.
Injection of DME into the engine, i.e. phase behavior during change from
liquid to gas, is different than in diesel. Several studies are performed to analyze and
model the flow of DME through the engine cylinder during injection and spraying. In
studies conducted by Shu and Lee [16] and Park et al [17], spraying characteristics of
DME and diesel are compared and it is shown that, DME spray, which is formed in a
comparably shorter time, is more evaporative due to its high vapor pressure and has a
wider angle showing better atomization characteristics. On the other hand, having a
higher viscosity, the spray of diesel arrives earlier to the point of measure [2].
2.3. Production Techniques of DME
The research for the production techniques of DME is a result of discovering
the wide usage area of DME which is mentioned in above sections.
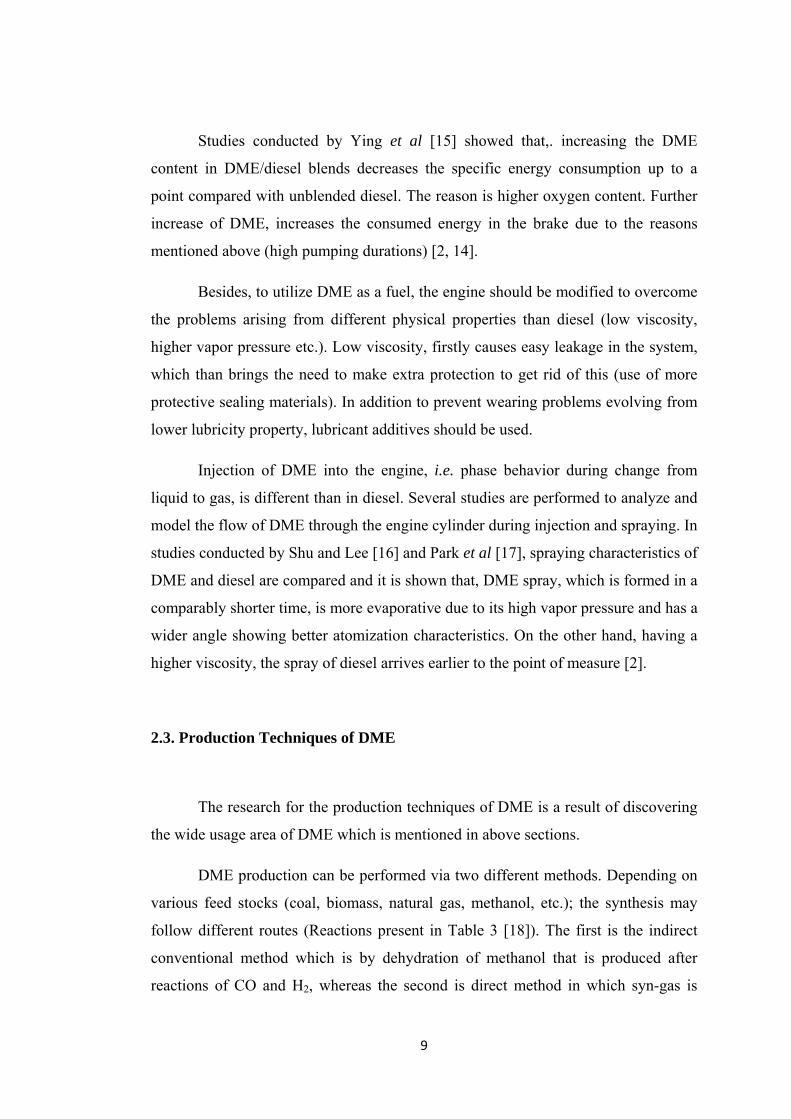
DME production can be performed via two different methods. Depending on
various feed stocks (coal, biomass, natural gas, methanol, etc.); the synthesis may
follow different routes (Reactions present in Table 3 [18]). The first is the indirect
conventional method which is by dehydration of methanol that is produced after
reactions of CO and H2, whereas the second is direct method in which syn-gas is
10
converted directly to DME in a single reactor with simultaneously producing
methanol.
In both of the methods, the upstream and downstream flows should be
investigated in terms of optimization of the process. The former one comprises of
utilization methods of feed stocks.
Table 3: Reaction formulas concerning DME synthesis [18]
Reaction Reaction
Heat (kJ/mol)Note Equation
233233 COOCHCHHCO -246 DME synthesis (1)
OHOCHCHHCO 233242 -205 DME synthesis (2)
OHCHHCO 32 242 -182 Methanol synthesis (3)
OHOCHCHOHCH 23332 -23 Methanol
dehydration (4)
222 HCOOHCO -41 Water gas shift
reaction (5)
-28.7 Methanol synthesis (6)
The way towards DME passes from firstly syn-gas and then methanol.
Therefore being independent from DME synthesis method, the upstream processing
is the same. Here, the variable is the feed-stock. Depending on the nature of the
11
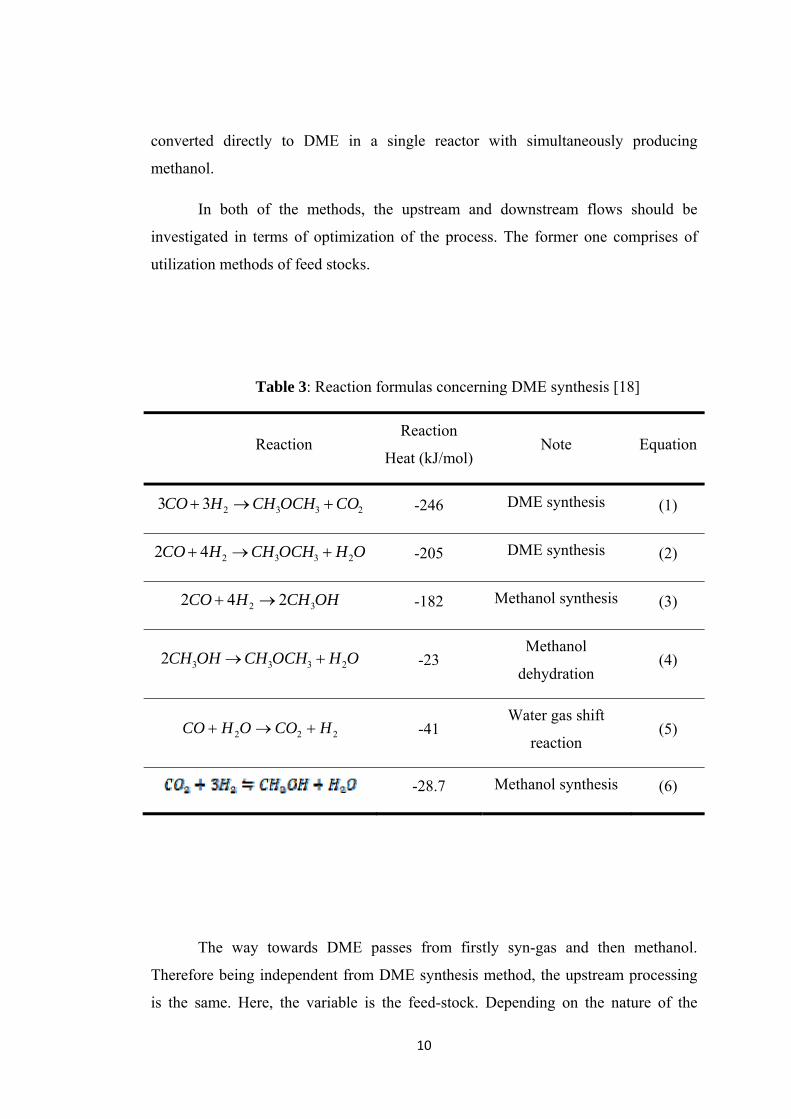
starting feed, the synthesis phenomena varies. Starting from natural gas, also
reforming reaction as given in Equation (7) should be considered for formation of
syn-gas.�
(7)
In Figure 2, the given process flow diagram is referred to a pilot plant
developed by JFE and is used to produce DME with a capacity of 5ton/day [12].
Figure 2: DME synthesis from NG proposed by JFE [12]
In developed technology, after being separated from CO2, the effluents of
auto thermal reformer are sent to a slurry reactor (0.55m in OD and 15m in height)
where syngas conversion is performed at 5MPa and 260°C. The downstream of the
reactor is sent to two step distillation to purify DME and one part of first distillation
column product is recycled back to the reactor to improve yields. With the results
obtained with this pilot plant, a large scale DME production facility is established by
the same company [12]. The use of slurry reactor provides an efficient transfer of

12
heat generated from reaction medium which prevents deactivation of the catalyst due
to high temperature rise during the reaction.
After formation of syn-gas, the process has two alternatives. Methanol
synthesis may be performed in a reactor and DME synthesis can then be carried out
in a separate reactor. Or the second alternative is to carry out these two reactions in a
single reactor.
After the synthesis, the next step is to treat the downstream components.
Again depending on the reaction scheme selected, the resulting product distribution
may differ. In methanol dehydration system the major product is DME and water,
and there might be the unreacted methanol in the stream. Formation of some
formaldehyde is also possible as a side product. The separation can be performed in a
distillation column since DME has a higher volatility compared to the others. Or a
reactive distillation column can be utilized to distillate water simultaneously during
the reaction. This will also enhance the overall reaction performance with shifting the
reaction towards the products and will control possible deactivation due to blocking
of the catalyst with water.
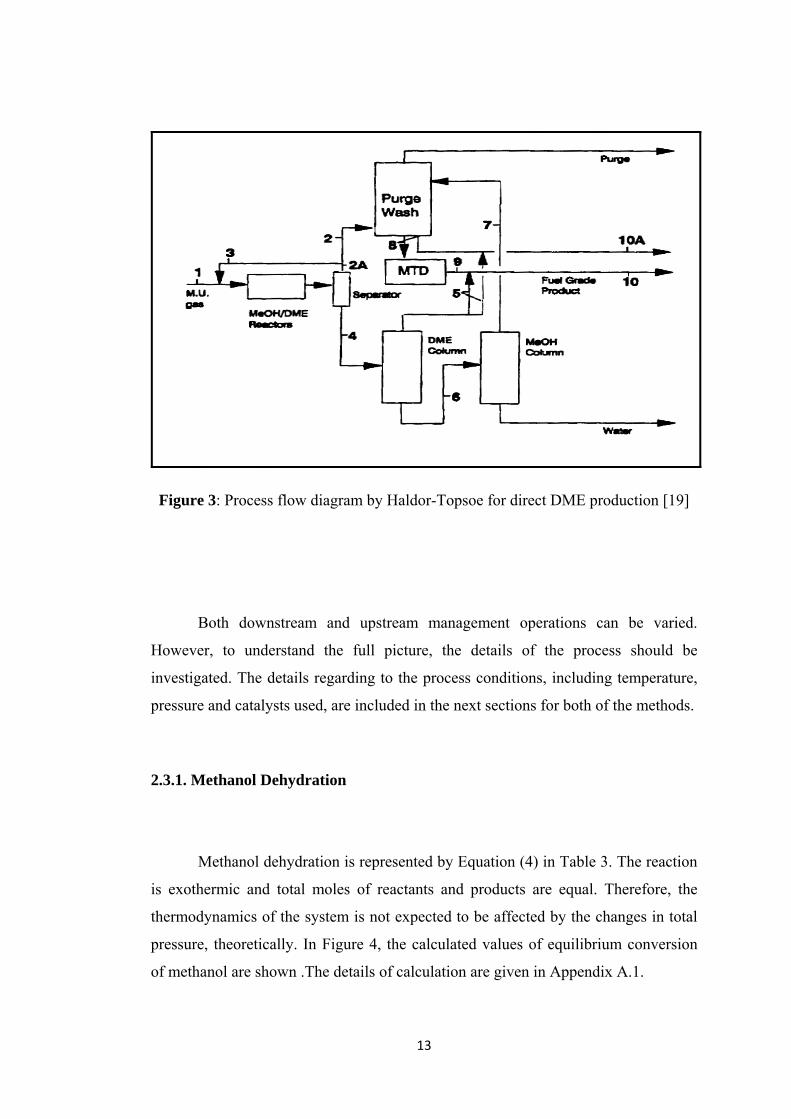
In a patent by Haldor-Topsoe [19], process flow diagram is created for syn-
gas conversion scheme. Although this is the major method, methanol to DME
convertor reactor is also included in the process. Figure 3 shows this process scheme.
The process starts with different compositions of syn-gas (CO/H2/CO2). After
conversion to DME and methanol, the unreacted gas and the products are separated
into liquid and gas phases in a separator where the former one is sent to a distillation
column to recover DME, and the later one is recycled and sent to a purging system
with methanol. The unconverted methanol is dehydrated in another reactor after
being separated from the system. The overall system performance can be measured
with the quality of DME produced. By that way, it is claimed that, 73% (vol/vol),
pure DME is produced (where the remaining is water and methanol) [19].
13
Figure 3: Process flow diagram by Haldor-Topsoe for direct DME production [19]
Both downstream and upstream management operations can be varied.
However, to understand the full picture, the details of the process should be
investigated. The details regarding to the process conditions, including temperature,
pressure and catalysts used, are included in the next sections for both of the methods.
2.3.1. Methanol Dehydration
Methanol dehydration is represented by Equation (4) in Table 3. The reaction
is exothermic and total moles of reactants and products are equal. Therefore, the
thermodynamics of the system is not expected to be affected by the changes in total
pressure, theoretically. In Figure 4, the calculated values of equilibrium conversion
of methanol are shown .The details of calculation are given in Appendix A.1.

14
Figure 4: Equilibrium conversion of methanol
Methanol dehydration to DME is carried out at acidic catalysis (γ-Al2O3, α-
Al2O3, HPAs, ion exchange resins, zeolites etc.). Several studies are published on
this topic. In studies of Lei et al [20], different types of process set-up are utilized.
Fixed bed reactors are combined with (catalytic) distillation columns in different
configurations. In the processes, final purity is 99.55% meaning that separation is
effective. On the other hand, comparing the overall conversion of methanol, that is
total amount of DME produced, shows that combination of fixed bed column with
catalytic distillation column after it is superior. The reason is the combined
conversions in the reactor and the column. Utilization of catalytic distillation column
as the extra reaction media, improves the DME yield. In the case of a catalytic
distillation column with a fixed bed after it, the conversions are much low compared
to the other ones. The main constraint, in this scheme is the pressure drop evolving
from high catalyst loadings. To preserve the pressure in the system, catalyst packing
should be optimum, which then suppresses higher conversions [20]. A similar reactor
and distillation column configuration is used in the studies of Stanislao [21] where
Amberlyst 35 is utilized in the fixed bed and the column is packed with separation
materials. The operation is adjusted so that, in the case of bypassing the prereactor,
the column is operated as a catalytic distillation column where both reaction and
separation takes place.
15
Different SAPO catalysts are examined in methanol dehydration reaction and
it is observed that, although SAPO-34 and ASPO-18 have the highest amount of
acidic sites (compared to SAPO-5 and SAPO-11) as determined in NH3-TPD
analysis, methanol conversion rapidly decreases at the early stages of reaction. This
result is attributed to coke formation with these acid sites and plugging in the smaller
pores of the materials [22].
As stated in the above section, formation of water during the reaction
suppresses the catalytic activity towards DME through blockage of the active sites in
the catalyst. The studies performed by Xu et al [23], showed that the activation
energy of the reaction is increased directly with the increase in water content in the
feed having a constant molar flow rate of methanol and DME yield is lowered in
presence of γ-Al2O3. In the same study, the effects of Bronsted and Lewis acid sites
are investigated by comparing the activities of γ-Al2O3, having only Lewis type acid
sites, with H-ZSM-5 having both types of acidic sites. It is revealed that, by addition
of water to both of the systems, the decrease in catalytic activity is higher in γ-Al2O3
which can be attributed to presence of more Lewis sites which is mainly affected by
water addition. By the slight decrease in the zeolite activity, it is concluded that
Lewis acid sites are active in methanol dehydration and for the Bronsted acidity,
since there exists still DME yield, it is noted that, these sites are active as well.
Heteropolyacids are widely used in alcohol dehydration reactions due to their
superior acidic and redox properties. Due to their low specific surface area, the
synthesis is commonly carried out by supporting the HPAs into a support. Varisli
[24], tested the activities of silicotungstic acid (STA) and tungstophosphoric acid
(TPA) supported on mesoporous silica and compared those with that of
aluminasilicates. The results indicate that, the selectivity obtained with STA towards
DME is more compared to the one obtained in presence of TPA. Conversion of
methanol is also higher when STA is used as the catalyst (on the orders of 30%). On
the other hand, although the aluminasilicate catalysts are inactive at lower
temperatures (200-300°C), with increasing temperature, conversion of methanol
reaches to values of 60%. Ethanol dehydration is also performed as well as methanol
and similar results are reported.
16
2.3.2. Syngas Conversion
DME synthesis via syn-gas (mixture containing CO and/or CO2 and H2)
conversion, is carried out by the reactions given in Table 3. The overall reaction can
be summarized in the forms of Equations (1) and (2), depending on the composition
of the feed stock. As can be seen, both routes are highly exothermic and pressure
dependent (directly). These two are also the major problems associated with that
method. The studies regarding to syngas conversion are mainly related to overcome
these problems.
Great amount of heat evolved during the reaction may cause deactivation in
the catalyst through coke formation or may activate the formation of side products.
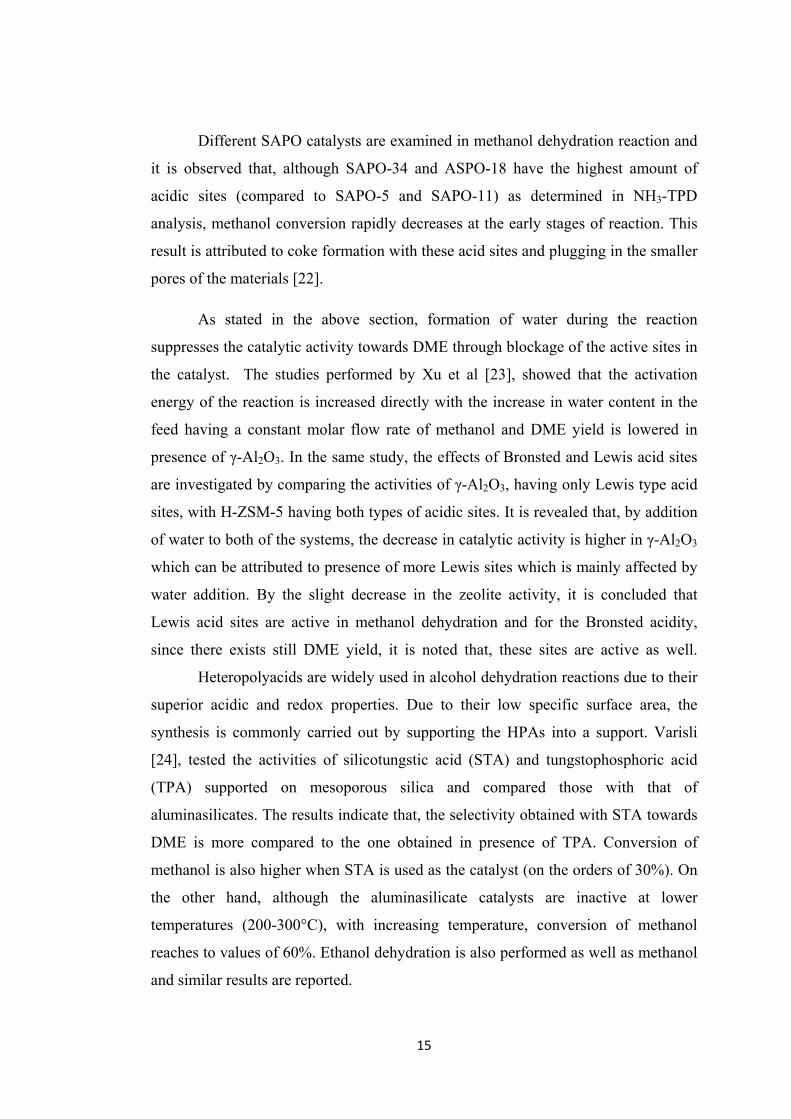
Figure 5 shows a slurry type used to extract heat generated during the reaction [12].
Figure 5: Flow through a slurry reactor [12]
Utilization of slurry bed reactor (Figure 5) where heat of reaction is
transferred to some liquid (usually oil) is an option in removal of heat [12]. Here, the
17
main problem is catalyst loss with the flow of heated liquid. This can be prevented
by a filter placed at the outlet of the reactor system.
Vakili et al [25], used heat exchanger type reactors to get rid of evolved heat.
The reaction is carried out in the tubes of the exchanger (OD=1.5’’) which is filled
with the catalyst (a hybrid catalyst consisting of CuO/ZnO/Al2O3 – methanol
synthesis – and γ-Al2O3 – methanol dehydration –). The generated heat is either
removed by water flowing in the shell side or utilized in an endothermic reaction
(cyclohexane dehydrogenation). The second configuration couples an exothermic
and an endothermic reaction, and no heat is disposed by that way. In addition to
formation of extra valuable products with the endothermic reaction, the coupled
reactor dimensions are smaller compared to the water utilizing exchanger type
reactor and there seems an increase in produced DME.
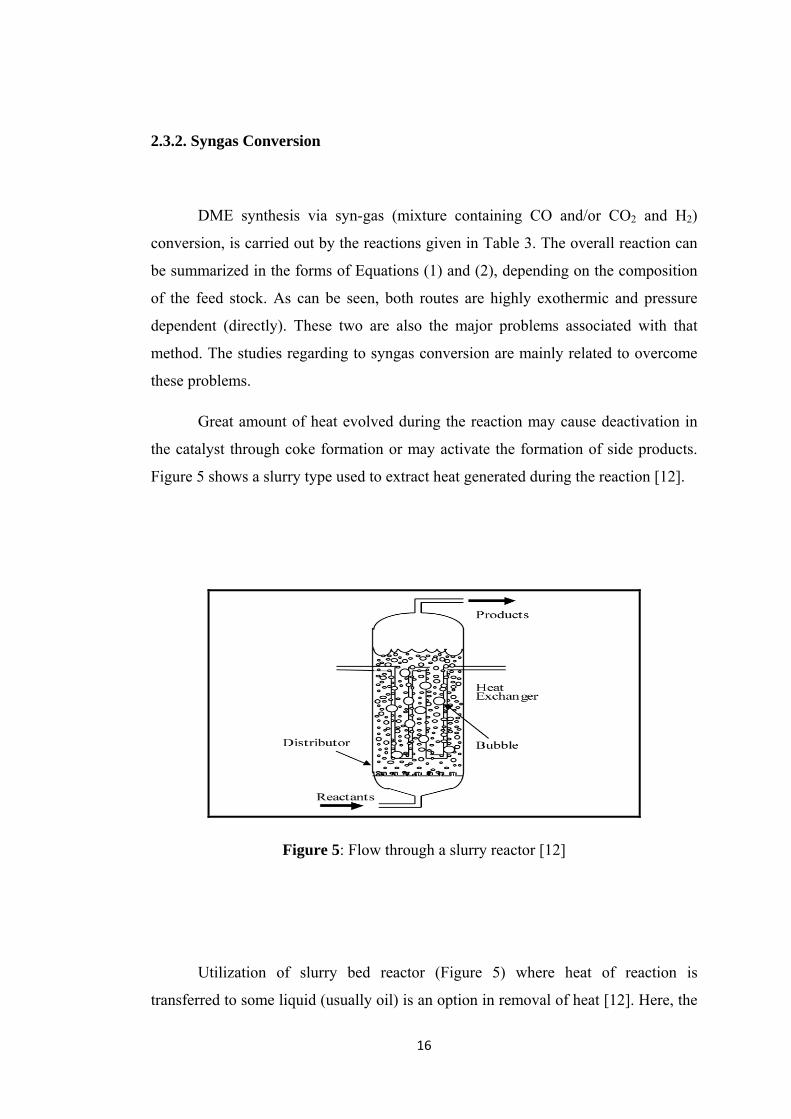
The second problem is associated with thermodynamic limitations. As can be
seen in Figure 6, to reach considerable conversions, the system should be pressurized
to high pressures in the orders of 40-50bar. The figure is generated by making mass
balance at different inlet conditions (temperature and pressure, details are given in
Appendix A.2).
Figure 6: Equilibrium conversion of CO in DME synthesis (CO/H2=1)
18
To overcome these limitations, and use the system with the highest efficiency,
effective catalyst systems should be created for methanol dehydration at lower
temperatures. As both methanol synthesis and methanol dehydration are carried out
in the same reactor, the catalyst should possess the properties of both of the systems.
Naik et al [26], investigated DME formation with CO2 and H2 with the
catalysts CuO-ZnO-Al2O3/γ-Al2O3 and CuO-ZnO-Al2O3/ZSM-5 in fixed bed and
slurry bed reactors (at 260°C, 5MPa). It is concluded that, ZSM-5 catalyst is much
more efficient in terms of both CO2 conversion and DME selectivity. The reason of
lower conversion of the first catalyst is explained in relation to lower thermal
stability and activating reverse water gas shift reaction (Equation 5) through the
formation of CO, and therefore decreasing the amount of DME produced. The same
methanol synthesis catalyst is also coupled with SAPO in reactions of CO and H2 (at
260°C, 4.2MPa) by Yoo et al [22]. The results indicate that, the reaction is mainly
controlled by methanol synthesis step, but not by the dehydration of methanol.
Although the catalysts have drastic differences in methanol dehydration as indicated
in previous section, CO conversions are in the same order of magnitude.
In a study conducted by Qi et al [27], it is shown that addition of Mn to the
catalyst structure of Cu supported on γ-Al2O3, enhances the dispersion of cupper into
the support. Syngas conversion is carried out at 2.0 MPa at temperatures between
220-300°C. Enhancement in cupper dispersion is affective in methanol synthesis step
which is essentially, the slowest step limiting the overall reaction. The results reveal
that, Mn addition to the catalyst matrix improves CuO dispersion and thus increases
the metallic cupper amount in the structure. This, at the end, improves the DME yield
as well up to a specific amount of loading.

19
CHAPTER 3
POROUS MATERIALS AND APPLICATIONS
Porous materials are classified according to their pore size by International
Union of Pure and Applied Chemistry (IUPAC). The definitions are as follows;
Microporous materials with pore size smaller than 2 nm (zeolites)
Mesoporous materials with pore size between 2 nm and 50 nm
(M41S family, SBA-15)
Macroporous materials with pore size larger than 50 nm
The first discovery of zeolites is made in 1756 by a Swedish mineralogist and
the synthesis is developed in 1980s (the name zeo-lithos meaning boiling stone due
to high adsorption capacity of water). In addition of synthetic zeolites, there also
exists natural zeolites. Zeolites are mainly crystalline aluminosilicate structures
(having different Al/Si ratios) in the forms of tetrahedrons with centers of alumina or
silicon and tetrahedral oxygens shared. In addition to these, countercations, like
sodium, magnesium, potassium, rubidium etc. are found to balance the charge within
the structure. In many applications, these cations are replaced by other cations (in ion
exchange membranes) [28, 29, 30, 31]
Zeolites exhibit a very narrow pore size distribution due to their crystalline
structure. The pore openings and pore size is determined by both the ring structure
and nature of cations in zeolite matrix. In characterization of the strucutere X-Ray
diffraction is widely used. Being a microporous material, zeolites allow adsorption of
20
small size molecules that is selective in terms of size as well as shape due to ring
structure. These types of microporous materials are mainly used in many processes.
Ion exchange processes are the common industrial applications in which
zeolites are used. Water purification is mainly done by use of zeolites showing
hydrophilic properties (zeolite 3A, 4A etc). In addition, in hydrocracking process of
petroleum industry, zeolites are used to enhance the catalytic activity [31, 32].
3.1. Mesoporous Materials-M41S Family
The family of M41S, which are considered as the first ordered mesoporous
materials, has a wide range of applications and consists of three main members
which are MCM-41, MCM-48 and MCM-50 (Mobil Composition of Material).
Having different characteristic properties, in terms of structure and synthesis
conditions, each material has various applications enabling diffusion of higher pore
size materials into the pores when compared to microporous ones [33, 34].
The discovery of that family is based in the beginnings of 1990s by the Mobil
researchers. The need to derive these kinds of materials arose from the need to
convert bulky petroleum products to more useful and valuable fuel [35]. The tunable
and uniform pore size distribution within a very narrow range, like that of zeolites, is
the most attractive property of this group as well as their high surface area (being
larger than 700 m2g-1). The synthesis steps are mainly the same for each of the M41S
family, except the ratio of used surfactant to silica source. Generally the synthesis
follows a liquid crystal templating (LCT) mechanism. After the discovery, the
researchers aimed to understand the detailed mechanism with developing the
synthesis procedure and characterization of the materials. The next step followed by
these is to understand the morphology and extend the application areas [36]. In this
section MCM-41 will be examined in detail and the other members will be compared
in terms of the structures and synthesis mechanism in brief.
21
3.2. MCM-41
MCM-41 is the most studied member of M41S family, due to its flexible
synthesis conditions and reproducible properties. In addition, obtaining changeable
pore diameters (ranging from 15°A to larger than 100°A) by applying different
synthesis conditions, in a very uniform hexagonal honeycomb like arrays makes
MCM-41 suitable for different applications [37]. Having higher surface area and
being a thermally stable material (T>1000), MCM-41 is shown as a good candidate
as a supporting material in doping of various components like metals or
heteropolyacids.
3.2.1 Synthesis Procedure
MCM-41 is synthesized through interactions of negatively charged
surfactants and positively charged silicate sources. The most commonly used ones
are alkyltrimethylammonium salts and sodium silicate (Na4O4Si) or TEOS
(tetraethylorthosilicate- C4H20O4Si) solutions accordingly. The surfactant is used as
the template to enable the incorporation of different components into the catalyst
structure. The synthesis steps of MCM-41 are optimized as follows:
Step 1 Addition of surfactant to the solvent (deionized water): The nature and
amount of surfactant added to the synthesis mixture is a critical parameter. The
tunable property in pore diameters is gained with changing the alkyl chains in the
surfactant. It is shown that, increasing the number of alkyl chains, also the pore size
of the catalyst increases. Figure 7, shows the XRD pattern of MCM-41 [38]. The
major peaks in the patterns shifts right with low alkyl lengths indicating a smaller
diameter.
In addition, surfactant amount determines the final structure of the material.
Different M41S family members are obtained by varying the surfactant composition.

22
In Figure 8, these effects can be seen. In the first synthesis performed by Mobil
researches, alkyltrimethyl ammonium halides are used as the surfactant [39].
Figure 7: XRD pattern of MCM-41 sample [38]
Figure 8: Effect of surfactant amount on catalyst structure [40]

23
Step 2 Addition of silica source to the mixture: Different silica sources are used
in MCM-41 synthesis like TEOS, sodium silicate, silica gel etc. The synthesis is
carried out at acidic or basic conditions depending on the silica source. Temperature
during mixing of these agents is also a critical parameter in synthesis when it is
considered that main silica network is formed as the silica source is added. [41].
Step 3 Hydrothermal synthesis: Final gel is placed into a teflon bottle which is
then placed to a stainless steel autoclave. The synthesis is carried out at constant
temperature. Several temperatures (ranging from 100°C-150°C) are tried in MCM-41
including different periods like 24 hours or 144 hours [39].
Step 4 Washing and filtering: Synthesized material is washed with deionized
water until a constant pH is obtained. In that step, the unbinded structures are
removed through washing. Drying is carried out at vacuum and at a constant
temperature.
Step 5Surfactant removal: The surfactant is removed at the end of the synthesis.
For that aim, variety of methods is used. The most common one is calcination with
air. In addition to calcination supercritical fluid extraction (SFE) is shown as an
alternative methods to remove surfactant from catalyst matrix.
Calcination is basically thermal decomposition with air at decomposition
temperature. For MCM-41, calcination is generally carried out at about
550°C under atmospheric pressure to remove the surfactant CTMABr.
Supercritical Fluid Extraction with CO2 is considered to be a new and
promising method for surfactant removal. The supercritical behavior of CO2
under conditions higher than critical properties (Tc=30.4°C, Pc=7.3MPa) is an
advantageous property when inertness and high solvating power is taken into
account. The detailed information is given in Chapter 5 for SFE. In addition
to these methods, also the catalysts are washed (refluxed) with different
solutions (e.g HCl, H3PO4) for the removal of surfactant.

24
During these steps, the formation of MCM-41 is explained by a liquid crystal
templating mechanism (LCT). The literature focuses on mainly two different
pathways to define that mechanism. In Figure 9, these pathways are shown [42].
Figure 9: MCM-41 formation via LCT mechanism [42]
As mentioned before, generally synthesis takes place via electrostatic
interaction between positively charged surfactants and negatively charged silicate
anions. In two different pathways proposed above, the main difference is that the first
initiation of formation. In the first one, it is claimed that, the silicate anions diffuse to
the preformed liquid crystals forming the silica network, that is the mechanism is
initiated with liquid crystals of micelles which are formed before addition of
silicates. On the other hand, in the second pathway, the uniform hexagonal liquid
crystal formation is activated by silica source addition. The silicate cations form a
layer on the surface of micelles which then forms the uniform network by silicate
condensation. Further heating to an optimal value improves condensation [40, 42].
Each pathway ends with calcinations where the surfactant network is removed via
thermal decomposition.
25
3.2.2. Characterization of MCM-41
The main techniques used in MCM41 and mesoporous materials’
characterizations are X-Ray diffraction (XRD) and nitrogen physisorption. In the
first method, the material is analyzed in terms of its structure where in the second
one, the textural properties are obtained by adsorption and desorption properties of
N2 on the catalyst surface. Although this section covers MCM-41 characterization, in
Chapter 6, material characterization is examined in detail.
3.2.2.1. X-Ray Diffraction
The XRD pattern of MCM-41 is given in Figure 7. The material, has one
main peak corresponding to (100) plane (with a d value of 47.3°A) and four
reflection peaks for (110), (200), (210) and (300) planes according to intensities of
the peaks. The mesoporousity of MCM-41 can also be seen in the peaks between 2θ
ranges of 1°-10°. Although there are sharp peaks in its pattern, MCM-41 has
amorphous walls.
3.2.2.2. Nitrogen Physisorption
Nitrogen is adsorbed and desorbed on MCM-41 at 77K and Figure 10 is
obtained as nitrogen adsorption and desorption isotherm of MCM-41 [41]. Exhibiting
a Type IV isotherm, MCM-41 shows the basic property of mesoporous materials.
The capillary condensation and pore filling occur at low pressures indicating a
smaller pore diameter. MCM-41 has a surface area in the ranges of 1000 m2g-1 and
the volume is nearly 75% free. This free volume consists of cylindrical channels
(almost 500 nm long) which are arranged in uniform hexagonal shapes [44].
26
Figure 10: Typical N2 adsorption-desorption isotherm of MCM-41 [41]
3.2.3. Methods of Modification of MCM-41 Structure: MCM-41 as a Support
Attractive properties and potential use of MCM-41 as a catalyst support
material, made researches to search for methods to modify the core catalyst structure
to be supported on MCM-41. Having a considerably high surface area and tunable
pore structure make MCM-41 a good candidate as a support. The modification can
be performed during synthesis, i.e, the catalyst is incorporated on MCM-41 during
hydrothermal synthesis or after synthesis of MCM-41 is carried out the active
component of the catalyst can be implemented into MCM-41 structure by different
impregnation techniques.
The most commonly used impregnation method is wet impregnation where
both solutions of the support and precursor of the catalyst are mixed and dried. This
method is advantageous when chemical reactions taking place on the surface of the
catalyst is considered since in the catalyst the active component is distributed mainly
on the support surface with that method. In dry impregnation (incipient wetness
impregnation), the method is similar to that of wet impregnation. The main
27
difference is that the added precursor solution does not fill up all the pores of the
surfactant resulting dry surfaces. Precipitation (homogeneous deposition
precipitation) is another method to prepare catalytic materials. The support material
suspended through the precursor solution of the catalyst and by adjusting the solution
conditions –pH and temperature- the active component is precipitated on the support
surface. The mentioned parameters play an important role in efficiency of
precipitation process as the solubility of hydroxyl ions and formation of metal
precipitates is directly related to these conditions [45].
Other than these methods, the catalyst can be prepared by using both
impregnation and precipitation techniques at the same synthesis or the active material
can be incorporated to the catalyst structure during synthesis of MCM-41, for which
the method is called co-precipitation. However, with that method, the formation of
ordered hexagonal cylindrical tubes-like structure is disturbed. It is slightly possible
to have that kind of an ordered mechanism [45].
Both impregnated and directly synthesized materials on MCM-41 find
application areas in different reactions. The coming section includes these
applications.
3.2.4. Some Application Areas of MCM-41
MCM-41 can be used in various applications with replacing environmentally
hazardous materials. Having a large surface area in addition with a regular pore size
arrangement makes MCM-41 promising candidate in using support material for
catalytic applications in both acidic and basic regions. Good dispersion of the active
component in the whole surface enhances the yield of the processes by increasing the
accessibility to active sites. Being in mesoporous range with a large pore volume,
MCM-41 allows the researchers to study with large molecules, which is not the case
with zeolites which are microporous.
28
Pure MCM-41 has weak acidity and low catalytic property. Thus to imrove
catalytic activity, as mentioned in previous section, different methods are used to
incorporate the active component to MCM-41 structure. By using different materials,
which include acids, bases, metals (both transition and alkaline metals) and oxides of
these metals, MCM-41 can be used in acid and base catalyzed reactions as well as in
redox reactions. In addition to these, high adsorption capacity towards many
molecules, MCM-41 can be used in separation processes in chromatographic or
waste treatment applications.
In hydrocracking of large petroleum products that is in hydrodenitrogenation
(HDN) mild hydrocracking (MHC) and hydrodesulfurization (HDS) processes,
catalysts having nickel and molybdenum as the active components are used (NiMo).
The conventional support is USY zeolite. However by the contributions of larger
surface area and larger pore size, it is concluded that NiMo incorporated MCM-41
has a higher activity compared to NiMo/USY in terms of removing sulfur and
nitrogen [46]. This is also attributed to well-distributed acid sites in the catalyst
matrix and easy diffusion of large molecules in uniform and larger pores which is not
possible for zeolites.
In addition to HDN, HDS and MHC processes, Friedel-Crafts alkylation and
acylation reactions are also carried out in the presence of mesoporous catalysts. Due
to pore size restrictions, it is observed that these catalysts are more active compared
to HY zeolite which is 7.4°A [46]. Alkylation of 4-tertbutylphenol with isobutene is
performed with tungtophosphoric (H3PW12O40- TPA) acid incorporated MCM-41.
To obtain acidic characters, it is an active method to use heteropolyacids (HPA)
which are in superacid region. It is concluded that, at lower loadings, HPA is finely
dispersed and no crystal is formed, that is what is observed is not the original Keggin
structure, but the modified one. On the other hand, further loadings makes Keggin
structure to dominate in the catalyst [46, 47]
With the large pore diameters accessible for large molecules, MCM-41 allows
incorporation of large transition metals into it (Zr, Mo, W). Oxidation of larger
molecules is performed in presence of titanium introduced MCM-41. Olefin is
oxidized to epoxide with H2O2 or THP (tertbutylhydroperoxide) with Ti/MCM-41.
29
Compared to Ti-β-zeolite, which is the conventionally used one, Ti/MCM-41
dominates in terms of oxidation yield of larger molecules. By using the same
catalyst, oxidation of amines, bulky sulfides can also be performed Here it is
observed that, there exists an optimum value for Ti loading (2 wt %) into the
structure when the yield of oxidation process is considered. To prevent this, it is
proposed to develop alternative methods to introduce Ti into MCM-41 [46].
The sorption capacity of MCM-41 can be adjusted depending on the nature of
the component used and by modification of catalyst morphology. Removal of both
organic and inorganic chemicals in waste treatment, like mercury and other heavy
metals, is also possible by using MCM-41. In HPLC applications, MCM-41 is
considered as capable of separating both acidic, basic and neutral components [46,
47].
3.3. Other M41S Family Members
Other than MCM-41, there exist two main members of M41S materials which
are studied by researchers; namely MCM-48 and MCM-50.
MCM-48 has a cubic structure exhibiting a three dimensional pore system
whereas MCM-50 is in (unstable) lamellar form. As the reproducibility in the
synthesis of these materials is low, these materials are not studied as much as MCM-
41. The main difference in preparing between M41S family members is the
surfactant added during synthesis. As can be seen in Figure 8, further addition of
surfactant to the mixture causes the formation of MCM-48 and MCM-50
accordingly.
The XRD pattern of MCM-48 shows the reflections of all planes. MCM-48;
has similar properties as MCM-41 like thermal stability and porosity. The main
difference between the two is that the structures. One dimensional long cylindrical
channel system in MCM-41 enables the materials to pass through it and improves the

30
adsorption on the surface. Although, the cubic structure in MCM-48, provides a three
way diffusion, this also may cause easy choking in shorter channels.
MCM-50 has an unstable structure exhibiting a lamellar phase. After
calcination, the material becomes microporous and a second treatment with a silica
source can be used to stabilize and decrease the pore size to mesoporous region. In
addition to increased surfactant amount, heating MCM-48 solutions for longer times
also leads the formation of MCM-50 [40].
31
CHAPTER 4
HETEROPOLYACIDS AND APPLICATIONS
Heteropolyacids (HPAs) get attention in various reactions due to their strong
and uniform Brönsted acidities (superacid behavior) and extensive redox properties.
The discovery depends on nearly 1970s. HPAs are considered to be green and
economical agents when compared with other liquid acids like H2SO4. In this
chapter, HPAs are examined in terms of their structure and the factors affecting the
applications (both pure HPAs and supported ones) are discussed with advantageous
and disadvantageous sites.
4.1. Structure of Heteropolyacids
The structure of HPAs mainly consists of a central atom (P, Si, As, Ge, B,
etc.) surrounded by polyoxometalate (POM) anions in metal-oxygen octahedra
forms. HPA structure can be formed in two different configurations of anions; [48,
49]
Keggin structure: XM12O40(8-x)-
Wells-Dawson structure: X2M18O62(16-2x)-
Anderson structure: XM6O24(12-x)-
Waugh structure: XM9O32(10-x)-
Silverton structure: XM12O42(12-x)-
32
In these structures, X is the central atom (heteroatom with an oxidation state
of x) and M is the metal (Mo6+, W6+, V5+, Co2+, Zn6+ etc.) (addenda atoms). Each
oxygen forming the tetrahedron is bonded to M3O13 units. The structure is in the
form of MO6 octahedra around tetrahedral XO4 where the corner and edge oxygens,
the ones in octahedral sites of addenda atom, are shared. The atoms in Keggin
structure form a spherical shape whereas for the Dawson type, an ellipsoidal
structure consisting of two XM9O31 units connected by six oxygen atoms are formed
[48, 50]. In addition to these structures, there are also, Linquist, Silverton and
Anderson type HPAs [51].
This structure defined above is called as the primary one which is in the form
of polyanions. In addition, the three dimensional forms (combination of anions with
various cations) are called as secondary structures and tertiary structure is used for
different textural properties (like pore size distribution, surface area etc.) of HPAs
and defines how the structure is incorporated into other ones [52]. Among the two
structures, Keggin is the best known and first characterized owing to its higher
thermal stability compared to Dawson structure and its easy availability [48]
4.2. Acidity of Heteropolyacids
HPAs exhibit a higher Brönsted acidity, approaching a superacid behavior. In
addition, being soluble in polar solvents, the protons gain a higher mobile property
which brings the pseudo-liquid phase in solutions. This mobility property is the
distinctive property of HPAs from zeolites. When compared with other liquid and
solid acidic materials, it is shown that, HPAs are superior to HX or HY zeolites and
SiO2-Al2O3. In Table 4, the dissociation constants are shown for various HPAs and
some strong acids in acetone [48].
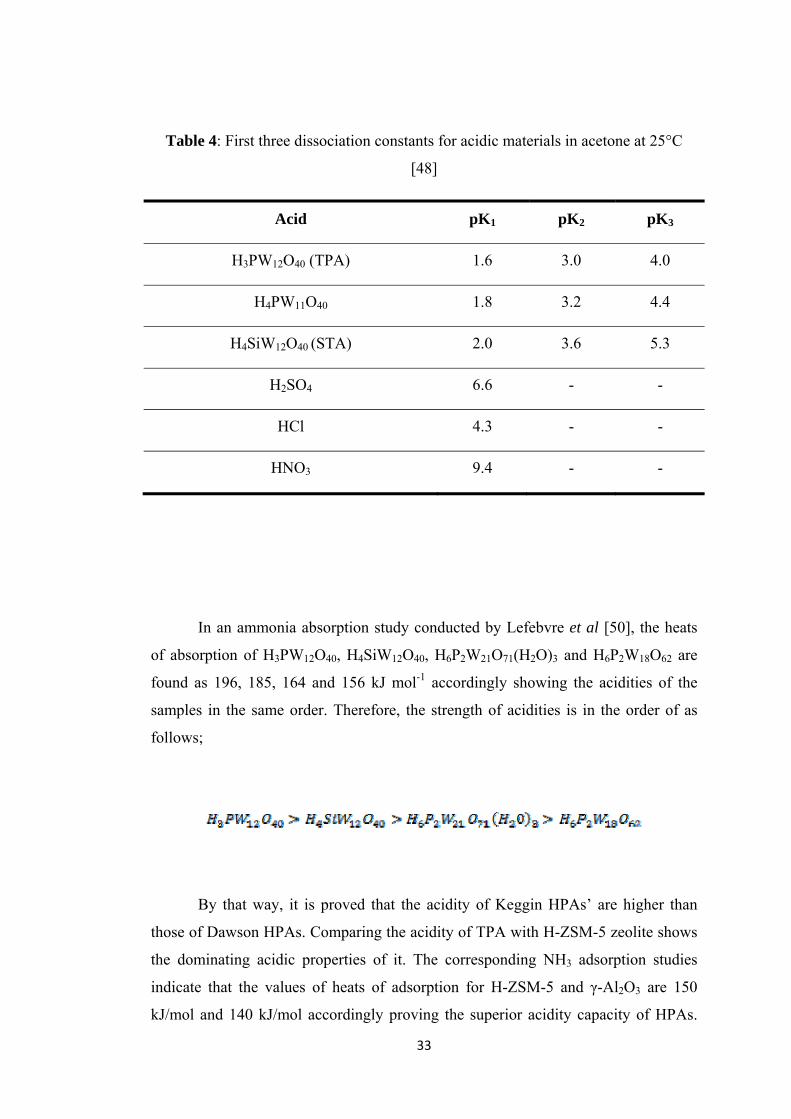
33
Table 4: First three dissociation constants for acidic materials in acetone at 25°C
[48]
Acid pK1 pK2 pK3
H3PW12O40 (TPA) 1.6 3.0 4.0
H4PW11O40 1.8 3.2 4.4
H4SiW12O40 (STA) 2.0 3.6 5.3
H2SO4 6.6 - -
HCl 4.3 - -
HNO3 9.4 - -
In an ammonia absorption study conducted by Lefebvre et al [50], the heats
of absorption of H3PW12O40, H4SiW12O40, H6P2W21O71(H2O)3 and H6P2W18O62 are
found as 196, 185, 164 and 156 kJ mol-1 accordingly showing the acidities of the
samples in the same order. Therefore, the strength of acidities is in the order of as
follows;
By that way, it is proved that the acidity of Keggin HPAs’ are higher than
those of Dawson HPAs. Comparing the acidity of TPA with H-ZSM-5 zeolite shows
the dominating acidic properties of it. The corresponding NH3 adsorption studies
indicate that the values of heats of adsorption for H-ZSM-5 and γ-Al2O3 are 150
kJ/mol and 140 kJ/mol accordingly proving the superior acidity capacity of HPAs.

34
On the other hand, it is stated that SO42-/ZrO2 is more acidic compared to the HPA.
Similarly, the acidity of salts of HPAs are also comparable to those of the intact
HPA. The NH3 adsorption studies show that the heat of adsorption for
Cs2.5H0.5PW21O40 is 165 kJ/mol [53].
For the supported HPAs, the acidity is mainly dependent on two factors
which are namely the amount of loading and nature of support. Silica supported
HPAs govern the properties of pure HPA (the crystalline Keggin structure) at low
loadings where fine dispersion is observed. On the other hand, the Keggin structure
becomes dominant at higher loadings [54].
Tunable behavior of acidity, thus the redox properties, is a critical advantage
for HPAs. This enables to design different HPAs for various kinds of reactions
bringing a selective reaction field for the material. Control of the structure of various
HPAs (at molecular level) enables to select the appropriate catalyst for each type of
reaction [55].
4.3. Thermal Stabilities of Heteropolyacids
HPAs are used in several industrial processes which are investigated in
Section 4.4. in detail. However, despite their acidic behavior, thermal instability
brings a limitation to the operating conditions of these processes due to coke
formation beginning at lower temperatures (catalyst deactivation) and thus resulting
difficulties in regeneration of the catalysis. To remove the coke formed on the
surface of the material, that is to decoke it, a combustion process at high
temperatures is used (calcinations). However, this is not appropriate for HPAs which
are not thermally stable up to these higher levels. The upper level of temperature can
be put as the limit where all the acidic properties are lost and in Table 5, these
temperatures can be seen for various HPAs [56].

35
Table 5: Thermal stability limits of selected HPAs [56]
Material Temperature (°C)
H3PW12O40 465
H4SiW12O40 445
H3PMo12O40 375
H3SiMo12O40 350
Following the TGA curve of hydrated TPA (H3PW12O40.nH2O),
Kozhevnikov [57] proposed a mechanism related to losses during heating. The
process consists of three steps of which the first is vaporization of water at 100°C. At
200°C and 450-470°C, water molecules bonded to the acidic protons and the
remaining protons are removed respectively. At temperatures higher than 600°C, the
component is totally converted to P2O5 and WO3 which shows no acidic property.
Several solutions are proposed to overcome that thermal instability problem.
It is shown that, doping HPA with Nb (V), Zr (IV), Ti (IV), Pd or Pt and calcining at
temperatures of 500-700°C, improves thermal stability of the catalysis suppressing
coke formation. Regeneration of the catalyst can also be performed by supercritical
fluids [57].
4.4. Applications of Heteropolyacids
HPAs are used in industrial applications both in pure structure and supported
ones. In addition to the advantages as a catalyst (as acidic and redox properties,
structure control at atomic and molecular level), using HPAs in industry also meets
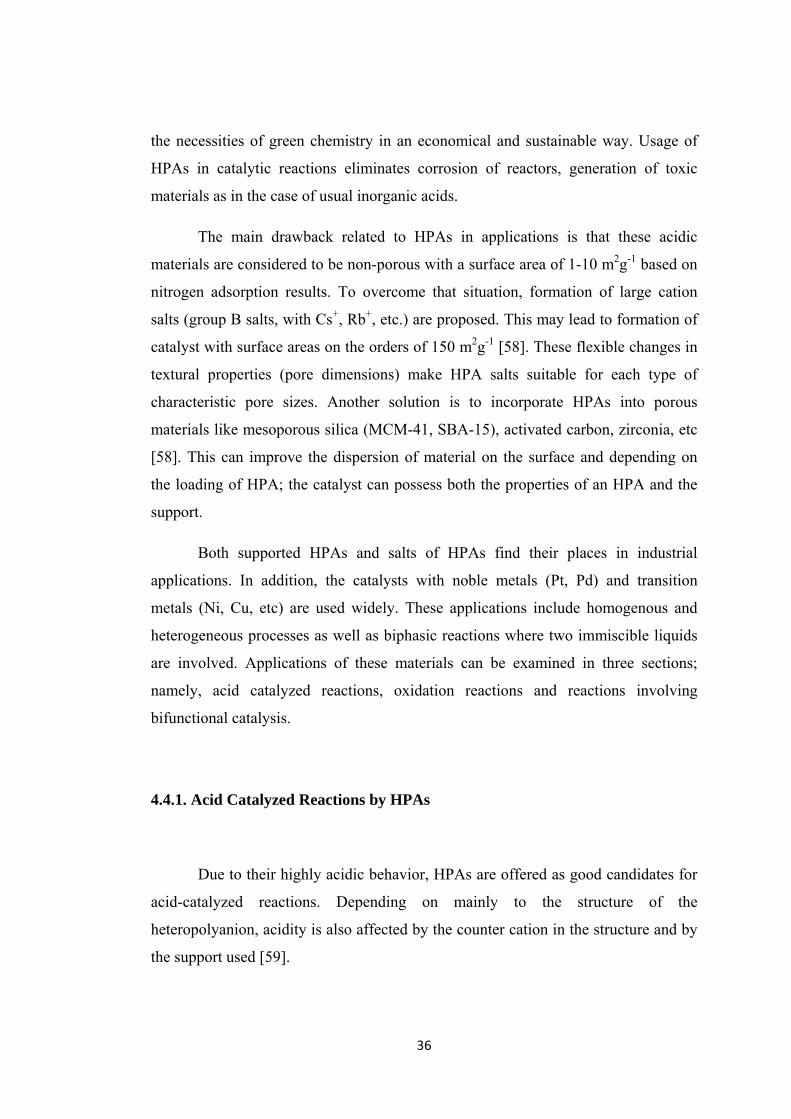
36
the necessities of green chemistry in an economical and sustainable way. Usage of
HPAs in catalytic reactions eliminates corrosion of reactors, generation of toxic
materials as in the case of usual inorganic acids.
The main drawback related to HPAs in applications is that these acidic
materials are considered to be non-porous with a surface area of 1-10 m2g-1 based on
nitrogen adsorption results. To overcome that situation, formation of large cation
salts (group B salts, with Cs+, Rb+, etc.) are proposed. This may lead to formation of
catalyst with surface areas on the orders of 150 m2g-1 [58]. These flexible changes in
textural properties (pore dimensions) make HPA salts suitable for each type of
characteristic pore sizes. Another solution is to incorporate HPAs into porous
materials like mesoporous silica (MCM-41, SBA-15), activated carbon, zirconia, etc
[58]. This can improve the dispersion of material on the surface and depending on
the loading of HPA; the catalyst can possess both the properties of an HPA and the
support.
Both supported HPAs and salts of HPAs find their places in industrial
applications. In addition, the catalysts with noble metals (Pt, Pd) and transition
metals (Ni, Cu, etc) are used widely. These applications include homogenous and
heterogeneous processes as well as biphasic reactions where two immiscible liquids
are involved. Applications of these materials can be examined in three sections;
namely, acid catalyzed reactions, oxidation reactions and reactions involving
bifunctional catalysis.
4.4.1. Acid Catalyzed Reactions by HPAs
Due to their highly acidic behavior, HPAs are offered as good candidates for
acid-catalyzed reactions. Depending on mainly to the structure of the
heteropolyanion, acidity is also affected by the counter cation in the structure and by
the support used [59].

37
Supporting HPAs on materials, by providing a distribution of the active
material on a more porous surface, enhances the interaction of the catalyst and the
reactants. Ethanol dehydration reaction is performed with H3[PMo12O40].xH2O and
H3[PMo11VO40].xH2O supported on Al/Fe-MCM41 at different temperatures by
Popa et al [60]. Compared with the bulk catalyst, the supported ones have lower
activation energies for acetaldehyde formation than those for the former ones
showing the efficiency of supporting process.
Xia et al [61], conducted MTBE (methyl-tert-butyl-ether) formation from gas
phase methanol and butyl alcohol on TPA supported at MCM-41. The activity results
in MTBE formation show slightly higher conversions (~98.6%) with the
commercially used ion-exchange resin Amberlyst-15 (.~98.0%) at optimum
temperatures (which is 80°C-100°C and 100°C for HPA/MCM41 and Amb-15
respectively).
4.4.2. Oxidation Reactions with HPAs and Bifunctional Catalysis of HPAs
Oxidation properties of HPAs are mainly related to redox characteristics
dependent to the addenda atom present in the structure. Formation of mixed addenda
HPA salts (V and Mo addenda atoms on Cs salts) to improve thermal stability and
redox properties of the catalysts [59, 62].
Commercial synthesis of acetone from propylene and acetaldehyde from
ethylene (so called Wacker process), are performed with O2 as oxidant in presence of
Pd impregnated heteropolyanions which disabled formation of chlorine in the system
as compared to the conventional system, where PdCl2 and CuCl2 are used [48].
Having both acidic and oxidizing character, HPAs can be used in two step
reactions involving mentioned characteristics. Production of acetic acid from
ethylene is industrialized by use of Pd impregnated Keggin type HPAs where
oxidation step is carried out in HPA site and next step is in Pd sites [50].

38
CHAPTER 5
SUPERCRITICAL FLUID EXTRACTION
In this chapter, the details regarding to the application of supercritical fluid
extraction (SFE) are given. These details include the extraction phenomena and the
applications in different industries. The extraction processes of mesoporous materials
are analyzed in the latter section.
SFE is considered as a green process in different processes such as separation,
organic reactions or material synthesis since environmentally friendly agents are
used rather than toxic organic solvents in the operations. The main application areas
of SFE are in pharmaceutical and food industry as well as in environmental fields
and particle engineering.
The reason of wide use of SFE technique in processes has arised from the
need to decrease to use of organic solvents in extraction due to environmental
restrictions. In 1879, Hannay and Hoganth examined the properties of SCFs and
showed presence of new type solvents in science. However, the commercial use of
SCFs are started in nearly 1960s [63].
Supercritical phase of a compound is defined as the phase above its critical
temperature and pressure which are characteristic for it. In that state, increasing the
pressure does not liquefy the substance, but the density approaches to that of the
liquid state. Thus, it has properties between a gas and liquid.
The attractive properties of SCFs in uses of several applications are lowered
viscosity and improved mass and heat transfer rates. Thus the energy required with
those improved properties is reduced. In addition, adjustment of process conditions
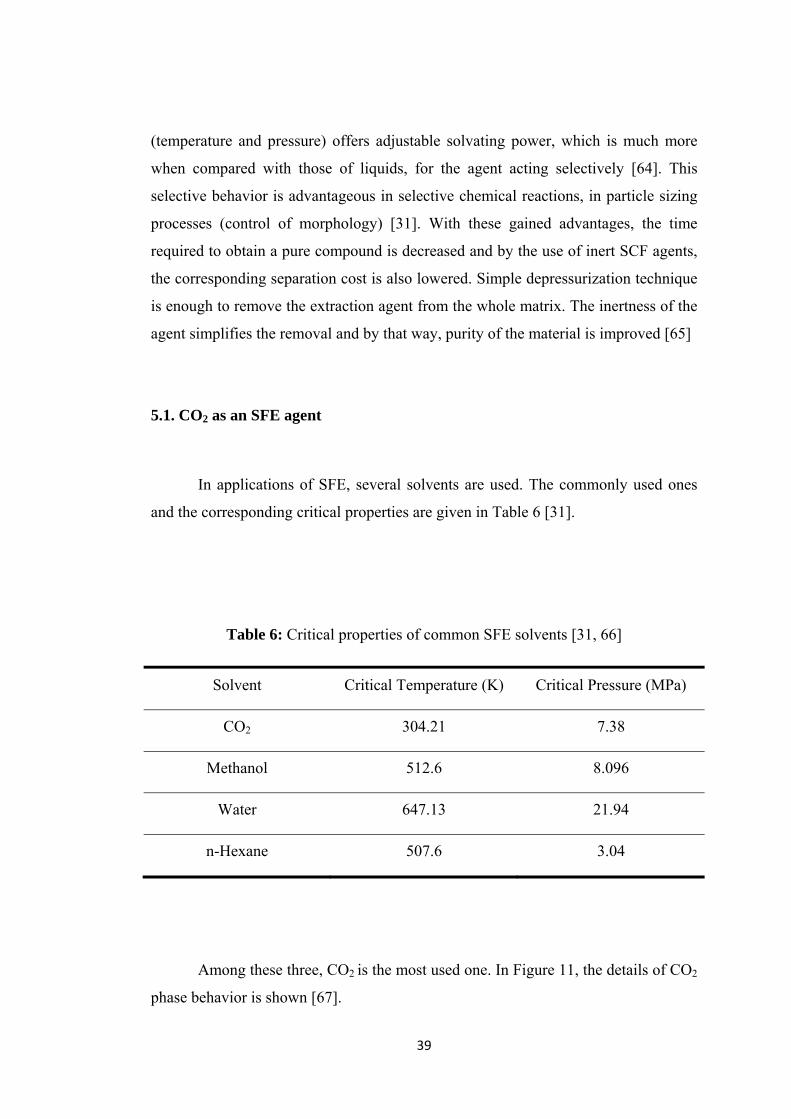
39
(temperature and pressure) offers adjustable solvating power, which is much more
when compared with those of liquids, for the agent acting selectively [64]. This
selective behavior is advantageous in selective chemical reactions, in particle sizing
processes (control of morphology) [31]. With these gained advantages, the time
required to obtain a pure compound is decreased and by the use of inert SCF agents,
the corresponding separation cost is also lowered. Simple depressurization technique
is enough to remove the extraction agent from the whole matrix. The inertness of the
agent simplifies the removal and by that way, purity of the material is improved [65]
5.1. CO2 as an SFE agent
In applications of SFE, several solvents are used. The commonly used ones
and the corresponding critical properties are given in Table 6 [31].
Table 6: Critical properties of common SFE solvents [31, 66]
Solvent Critical Temperature (K) Critical Pressure (MPa)
CO2 304.21 7.38
Methanol 512.6 8.096
Water 647.13 21.94
n-Hexane 507.6 3.04
Among these three, CO2 is the most used one. In Figure 11, the details of CO2
phase behavior is shown [67].
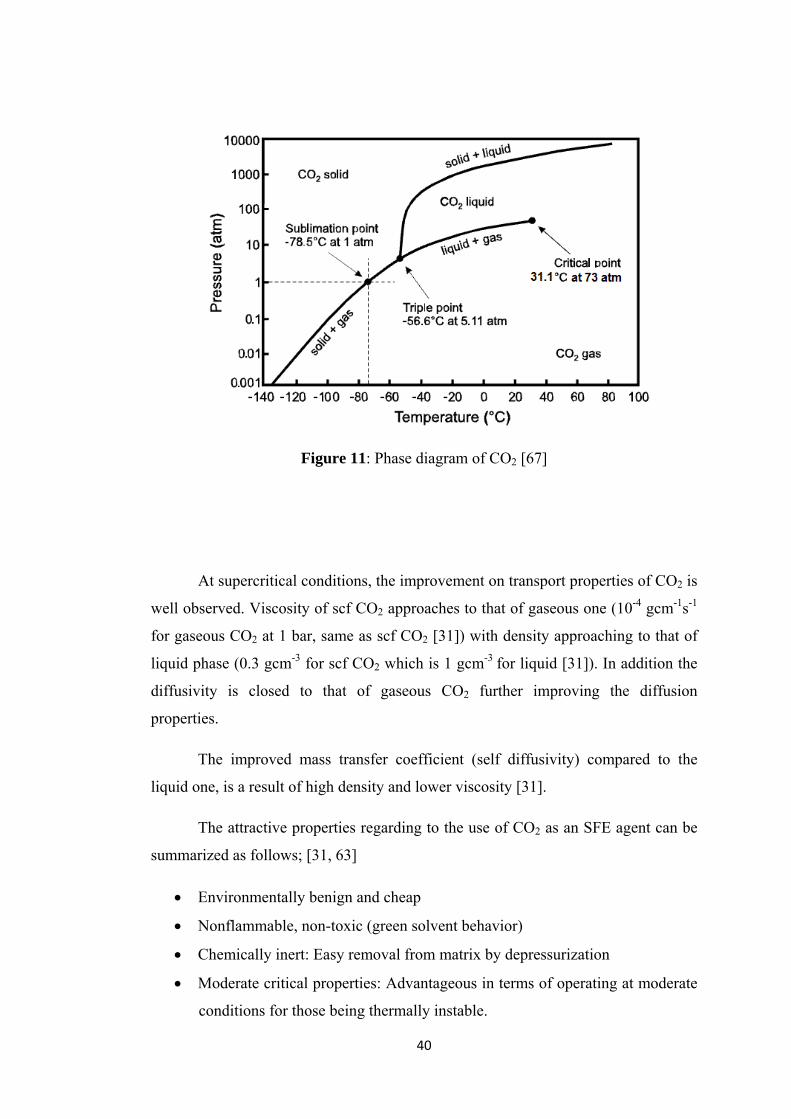
40
Figure 11: Phase diagram of CO2 [67]
At supercritical conditions, the improvement on transport properties of CO2 is
well observed. Viscosity of scf CO2 approaches to that of gaseous one (10-4 gcm-1s-1
for gaseous CO2 at 1 bar, same as scf CO2 [31]) with density approaching to that of
liquid phase (0.3 gcm-3 for scf CO2 which is 1 gcm-3 for liquid [31]). In addition the
diffusivity is closed to that of gaseous CO2 further improving the diffusion
properties.
The improved mass transfer coefficient (self diffusivity) compared to the
liquid one, is a result of high density and lower viscosity [31].
The attractive properties regarding to the use of CO2 as an SFE agent can be
summarized as follows; [31, 63]
Environmentally benign and cheap
Nonflammable, non-toxic (green solvent behavior)
Chemically inert: Easy removal from matrix by depressurization
Moderate critical properties: Advantageous in terms of operating at moderate
conditions for those being thermally instable.
41
On the other hand, low polarity of CO2 limits the use in extractions of
specific polar compounds. To get rid of this problem, several polar modifiers are
used to enhance the efficiency of the process by increasing the solvating power of
CO2 towards the component in consideration. Most commonly used ones are
methanol and ethanol.
5.2. Applications of SFE
Most common industries using extractions as a method for removal of
components are the food and pharmaceutical industries. In addition, in material
preparation, SFE is seen as a promising technology in adjustment of material
properties to the desired conditions.
High operational cost faced with SFE is mainly due to higher pressures in the
process. Although, at the end, the efficiency of recovery (of extracts) and obtained
product is higher compared to the conventional extraction processes, SFE conditions
need an optimization to minimize the operational costs. This optimization, where the
main parameters are temperature and pressure of solvent, duration of process, nature
of solvent/modifier, composition of extracting medium, can be achieved by clear
understanding of phase equilibrium between the solvent and extract as well as the
modifier used [63].
The commercialized SFE processes are decaffeination of coffee and tea, hops
extraction, extraction of spices, flavours and aromas and denicotinization of tobacco.
Within the scope of this study, SFE is examined in catalyst preparation.
5.3. SFE in Catalyst Preparation
Use of SFE in catalyst preparation is similar to the one in pharmaceutical
industry and is mentioned in several points; in design of catalysts (particle sizing,
42
particle coating, supercritical fluid deposition) or in template removal. Common
application of the method is in batch mode. In other words, the process starts with
charging the SCF and/or modifier to the vessel containing sample in it. Second step
is to pressurize the system and after maintaining for the desired period at the desired
conditions, SCF is discharged with depressurizing the system. The process can be
performed in continuous mode where, make up SCF and/or modifier are supplied to
the system continuously.
The critical advantage of this technique over the conventional ones such as
impregnation is that, control of end-product properties and improved mass transfer
rates. In addition to tuning in physical properties of the material, catalyst nature
(namely coating distribution, concentration, morphology etc.) can also be controlled
by SCF application with adjustment of operating parameters.
Formation of different type of structure is mainly affected by solvent nature.
CO2, known as the most common extracting agent, is inert and does not have
chemical interaction with the materials. On the other hand, use of water or ammonia,
facilitate the formation of oxides and nitrides accordingly. In addition, the crystal
structure of the catalysis can be tuned by using different types of solvents. The
alumina particles show various characteristic XRD patterns in presence of CO2/water
and ethanol mixtures [68].
Material coating, which then be used for various applications like catalytic or
microelectronic, is performed by supercritical fluid deposition (SCFD). Incorporation
of metals to polymer matrices and design of nanostructured materials are two
examples of SCFD applications. Other than, incorporation, SCF applications are also
used in formation of nanorods/wires such as carbon nanotubes (CNTs). Use of
supercritical CO2 rather than gaseous one improves the yield of process without
utilizing a catalyst [68, 69].
The three steps mentioned above are all affect the SCFD process by having
different mechanisms. Dissolution of the metal precursor in the SCF solution is
explained by solubility. As the first step, solubility phenomena and the regarding
rates are investigated to develop a model defining the mass transfer rates. To enhance
43
the solubility rates, co-solvents are utilized. The second adsorption step is generally
defined as mass transfer of supercritical solution (containing active component in it)
to the external surface and into the pores of the support. Depending on the natures of
support and metal, and the operating conditions the model describing the adsorption
mechanism can have several expressions. The reduction step is also similar to the
previous one. Investigation of the mechanism indicates that, the nature of the
reducing agent and the type of support used, critically affect the incorporation [69].
Other than formation of finely and uniformly dispersed materials for
incorporation to the support materials on the surface and/or into the pores,
supercritical applications are used in template removal in catalyst synthesis as well.
As in other processes, nature of extracting agent and the material to be extracted are
the main factors affecting the supercritical application as well as the operating
conditions and whether a co-solvent is present or not. The studies regarding to
develop a newer technique for template removal is primarily due to operating
conditions of calcination. Being performed at higher temperatures to get considerable
efficiencies, calcination brings the risk in distortion of original catalyst matrix.
Several studies are published in this area. Chatterjee et. al. [70], reported the
importance of using a co-solvent in surfactant removal from titanosilicates
synthesized with different Ti/Si ratio. In addition, the results of carrying out the
extraction at different temperatures (at a fixed pressure, 35 MPa) reveal that, there
exists an optimum temperature (353 K) to remove the template with the highest
efficiency (defined with the results associated with TGA analysis).
Huang et al [71], reported extraction efficiencies for different catalytic
materials; MFI and beta zeolites and MCM-48. The results indicate that template
removal in mesoporous MCM-48 is much more compared to that of zeolites due to
differing pore sizes. Average pore diameter of zeolites, being smaller to MCM-48,
does not allow CO2 and the modifier solvent to get into the pores and extract the
template from the matrix. The extraction is on the orders of 1-10% for zeolites
whereas for MCM-48, this value reaches up to 95% depending on the extraction
pressure, temperature and duration.

44
One other advantage of extraction over calcination is that recovery of organic
template, thus reduction in synthesis cost (which is nearly 77% of total MCM-41
synthesis cost), becomes possible with extraction. The burning process in calcination
causes the surfactant to go off [71, 72].
Investigating the effects of operating parameters; Huang et al [72], with the
experiments conducted with MCM-48, concluded that the extraction efficiency is
dependent to both temperature and pressure with an optimum value. Increasing the
pressure (between 80-140 bar), while keeping the other parameters fixed, improves
template removal up to a pressure and after that optimum value, due to approaching
critical point where CO2 and methanol reach an homogenous phase, extraction
efficiency starts to decrease. During extraction of organic templates, the modifier
liquid is used to take off the material while CO2 is mainly the transporting media.
Higher pressures, thus presence of homogenous phase, therefore decrease the amount
of liquid methanol phase in the mixture resulting a decrease in final removal
efficiency. After the supercritical phase is achieved for methanol and CO2 (at 141
bar, 85°C), extraction is controlled mainly by solvating power of the whole mixture.
Further pressurizing the system enhanced the extraction process with increased
solvating capabilities in the studies conducted by Huang et al [72]. The temperature
dependency is similar to this issue such that at higher temperatures composition of
liquid methanol may decrease leading to the same result as stated. In addition, the
density of final solution decreases as well which then lowers the solvating power of
the extracting agent. The reduction in residence time with increased temperature and
thus the volumetric flow rate, may also limit the amount of extracted template from
the system.
45
CHAPTER 6
EXPERIMENTAL STUDIES
This chapter comprises of three subsections which mainly includes the
detailed steps in catalyst preparation and the methods used in catalyst
characterization, in addition with the experimental set up used in DME synthesis.
6.1. Catalyst Preparation
In this section, the preparation steps of the catalysts used are explained in
detail. These include direct hydrothermal synthesis, namely incorporation of HPA
and metal (Zr, Ni, Cu) into the MCM-41 structure with different synthesis
conditions.
6.1.1. One Pot Hydrothermal Synthesis of STA-Zr/Silica (SZ Group) Catalysts
6.1.1.1. Chemicals Used
In synthesis of SZ group catalysts, the following reagents are used.
o Silica source: Tetraethylorthosilicate (TEOS), C4H20O4Si (Merck)
o Surfactant source: N-Cetyl-N,N,N trimethylammonium bromide (CTMABr)
C16H33(CH3)3NBr, (Molecular weight: 364.46 g/mol, powder, 99% pure,
Merck)
46
o Silicotungstic Acid (STA) (Sigma Aldrich)
o Zirconium source: Zr(NO3)2.H2O, zirconly nitrate monohydrate (Sigma
Aldrich)
o Solvent source: Deionized water (Millipore Ulta-Pure Water System, Milli-
QPlus)
o Base source: Sodium hydroxide (NaOH, 1M) (Merck)
6.1.1.2. Synthesis Procedure
o 13.2 g of surfactant CTMABr added to 87ml deionized water and the mixture
is mixed with 500rpm rate at 30°C until a clear solution is obtained.
o 15.64 ml TEOS is added to the clear solution dropwise and mixed to reach
adsorption equilibrium (pH of the solution: 4.6). The synthesis is perfomed at
acidic conditions to prevent formation of any aggregates after addition of
STA.
o STA and Zr source, for which the amounts are adjusted according to the
tungsten to silica and zirconium to silica ratios as given in Table 7, are mixed
with 5ml and 10 ml of deionized water accordingly. Addition of STA and Zr
source is performed with two different procedures
Procedure 1 (P1): The prepared solutions are mixed and added to the
solution prepared in the first step together dropwise and mixed with the same
rate for 1 hour.
Procedure 2 (P2): STA solution is added first and then Zr source is added
to the whole mixture. After addition of each solution, the mixture is mixed
continuously for 30 minutes.
o The pH of the solution is adjusted by adding NaOH (final pH of the solution;
6-6.5)

47
o After addition of raw materials, the resulting gel solution is transferred to a
Teflon bottle which is then placed into a stainless steel autoclave for
hydrothermal synthesis at 120°C for 96 hours.
o The obtained solid is then washed with 300 ml of deionized water and filtered
until a constant pH (5-6) is obtained and dried at 40°C for 24 hours at
vacuum.
o Finally the dried material is treated with two different techniques for
surfactant removal.
Calcination: The dried sample is placed in a quartz tube and treated with
1dm3/min air flow at atmospheric pressure and 350°C for 8 hours with a
heating rate of 1°C/min. The calcined samples are named with a “c”
before the catalyst name as cSZ1, which refers to the calcined sample of
catalyst SZ1 (Table 7).
Supercritical fluid extraction: The dried samples are treated with
methanol modified supercritical CO2 at 85°C and at different pressures
(Table 8) as described in Kawi et al [73]. CO2 flow rate is measured as
2.5 L/min whereas the methanol is fed with an HPLC pump with 0.45
ml/min rate at STP resulting a molar ratio of 10:1 for CO2:Methanol.
Detailed conditions related to the extractions are given in Table 8. In
addition to regular extraction of the samples, SZ3 and SZ4 are extracted
at different pressures and for different time intervals to test the effect of
these parameters on the catalyst properties. Supercritically extracted
samples are named with a “sce” before the catalyst name such as sceSZ1,
which refers to the extracted sample of catalyst SZ1.

48
Table 7: Synthesis Conditions for STA-Zr/Silica Catalysts
Catalyst
name
Synthesis
Procedure
pH of the
solution
Amount
of STA
used (g)
Amount of
Zr source
used (g)
Atomic ratios
W/Si Zr/Si
SZ1 P2 0-0.5 6.77 4 0.4 0.24
SZ2 P2 6-6.5 6.77 3 0.4 0.18
SZ3 P1 6-6.5 6.77 2 0.4 0.12
SZ4 P2 6-6.5 6.77 1 0.4 0.06
SZ5 P2 6-6.5 5.08 1 0.3 0.06
SZ6 P2 6-6.5 8.46 1 0.5 0.06
Table 8: Extractions Conditions for STA-Zr/Silica Catalysts
Catalyst name Pressure
(bar)
Temperature
(°C)
Period
(hour)
Resulting
Catalyst
SZ1 450 85 3 sceSZ1
SZ2 450 85 3 sceSZ2
SZ3 450 85 3 sceSZ3
SZ3 300 85 3 sceSZ3-300
SZ3 600 85 3 sceSZ3-600
SZ4 350 85 6 sceSZ4
SZ4 350 85 3 3SZ4
SZ5 350 85 6 sceSZ5
SZ6 350 85 6 sceSZ6
49
6.1.2. One Pot Hydrothermal Synthesis of STA-Ni/Silica and STA-Cu/Silica
Catalysis
6.1.2.1. Chemicals Used
Similar to SZ Group catalysts, STA-Ni/Silica and STA-Cu/Silica Catalysis
are synthesized via direct hydrothermal synthesis route and the following chemicals
are the components of the synthesized catalysts.
o Silica source: Tetraethylorthosilicate (TEOS), C4H20O4Si (Merck)
o Surfactant source: N-Cetyl-N,N,N trimethylammonium bromide (CTMABr)
C16H33(CH3)3NBr, (Molecular weight: 364.46 g/mol, powder, 99% pure,
Merck)
o Silicotungstic Acid (STA) (Sigma Aldrich)
o Nickel source: Ni(NO3)2.6H2O, nickel (III) nitrate hexahydrate (Merck,
molecular weight 290.8 g/mol)
o Copper source: Cu(NO3)2.3H2O, Copper nitrate trihydrate (Merck)
o Solvent source: Deionized water (Millipore Ulta-Pure Water System, Milli-
QPlus)
o Base source: Sodium hydroxide (NaOH, 1M) (Merck)
6.1.2.2. Synthesis Procedure
o 13.2 g of surfactant CTMABr added to 87 ml deionized water and the mixture
is mixed with 500rpm rate at 30°C until a clear solution is obtained.
o 15.64 ml TEOS is added to the clear solution dropwise and mixed to reach
adsorption equilibrium (pH of the solution: 4.6).
o 6.77 g of STA mixed with 5 ml of deionized water is added to the solution to
achieve a W/Si ratio of 0.4 and stirred for 30 minutes (pH of the solution 0-
0.5).
o Metal source is added to get a metal/Si ratio of 0.06 as given in Table 9 after
mixed with 10 ml of solvent. The resulted solution is mixed for 30 minutes.
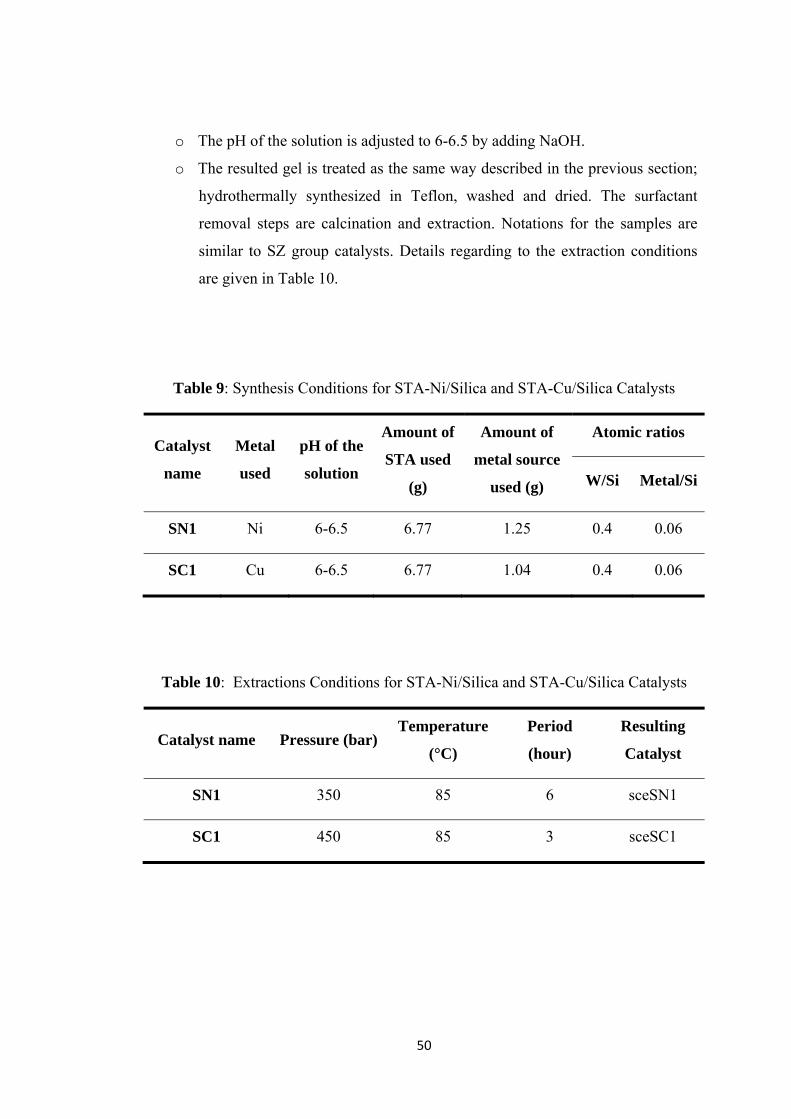
50
o The pH of the solution is adjusted to 6-6.5 by adding NaOH.
o The resulted gel is treated as the same way described in the previous section;
hydrothermally synthesized in Teflon, washed and dried. The surfactant
removal steps are calcination and extraction. Notations for the samples are
similar to SZ group catalysts. Details regarding to the extraction conditions
are given in Table 10.
Table 9: Synthesis Conditions for STA-Ni/Silica and STA-Cu/Silica Catalysts
Catalyst
name
Metal
used
pH of the
solution
Amount of
STA used
(g)
Amount of
metal source
used (g)
Atomic ratios
W/Si Metal/Si
SN1 Ni 6-6.5 6.77 1.25 0.4 0.06
SC1 Cu 6-6.5 6.77 1.04 0.4 0.06
Table 10: Extractions Conditions for STA-Ni/Silica and STA-Cu/Silica Catalysts
Catalyst name Pressure (bar) Temperature
(°C)
Period
(hour)
Resulting
Catalyst
SN1 350 85 6 sceSN1
SC1 450 85 3 sceSC1
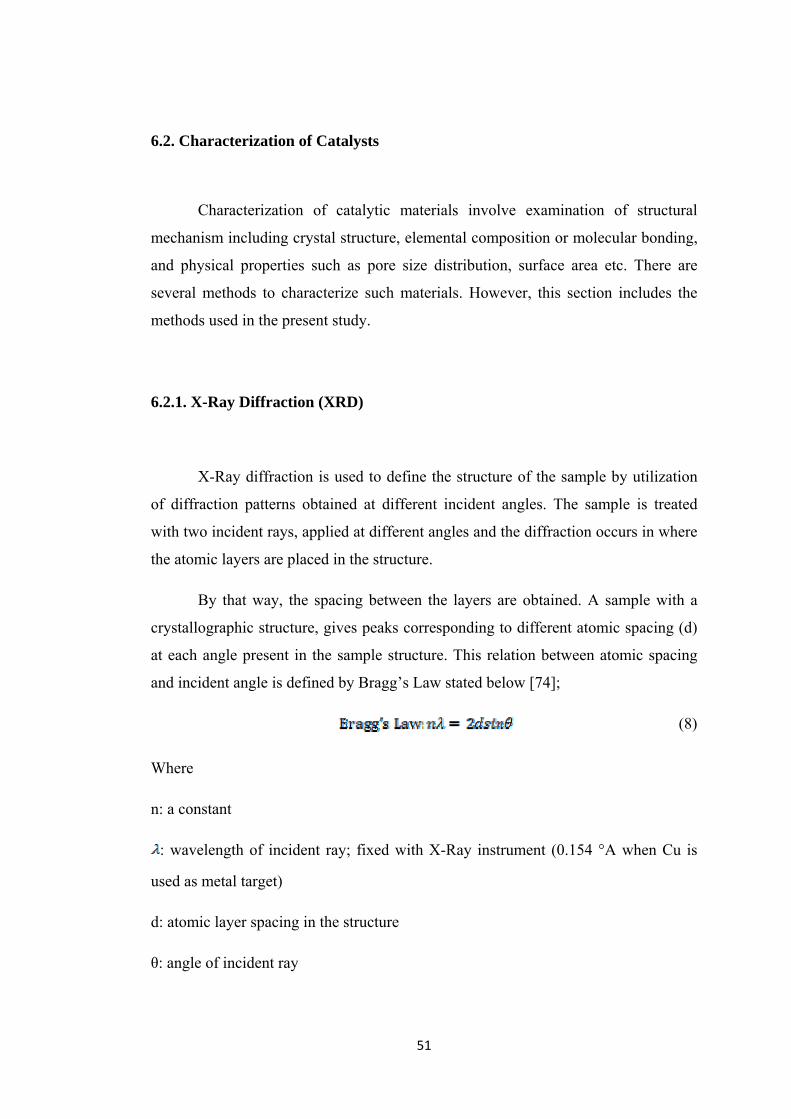
51
6.2. Characterization of Catalysts
Characterization of catalytic materials involve examination of structural
mechanism including crystal structure, elemental composition or molecular bonding,
and physical properties such as pore size distribution, surface area etc. There are
several methods to characterize such materials. However, this section includes the
methods used in the present study.
6.2.1. X-Ray Diffraction (XRD)
X-Ray diffraction is used to define the structure of the sample by utilization
of diffraction patterns obtained at different incident angles. The sample is treated
with two incident rays, applied at different angles and the diffraction occurs in where
the atomic layers are placed in the structure.
By that way, the spacing between the layers are obtained. A sample with a
crystallographic structure, gives peaks corresponding to different atomic spacing (d)
at each angle present in the sample structure. This relation between atomic spacing
and incident angle is defined by Bragg’s Law stated below [74];
(8)
Where
n: a constant
: wavelength of incident ray; fixed with X-Ray instrument (0.154 °A when Cu is
used as metal target)
d: atomic layer spacing in the structure
θ: angle of incident ray
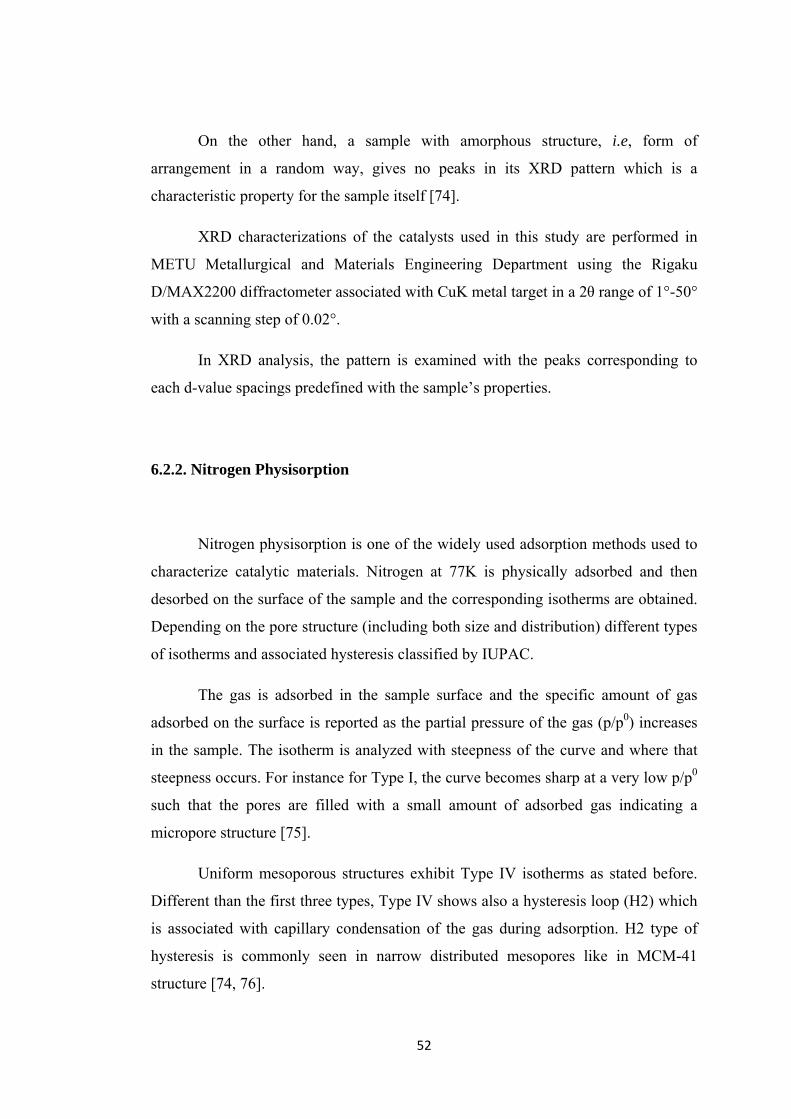
52
On the other hand, a sample with amorphous structure, i.e, form of
arrangement in a random way, gives no peaks in its XRD pattern which is a
characteristic property for the sample itself [74].
XRD characterizations of the catalysts used in this study are performed in
METU Metallurgical and Materials Engineering Department using the Rigaku
D/MAX2200 diffractometer associated with CuK metal target in a 2θ range of 1°-50°
with a scanning step of 0.02°.
In XRD analysis, the pattern is examined with the peaks corresponding to
each d-value spacings predefined with the sample’s properties.
6.2.2. Nitrogen Physisorption
Nitrogen physisorption is one of the widely used adsorption methods used to
characterize catalytic materials. Nitrogen at 77K is physically adsorbed and then
desorbed on the surface of the sample and the corresponding isotherms are obtained.
Depending on the pore structure (including both size and distribution) different types
of isotherms and associated hysteresis classified by IUPAC.
The gas is adsorbed in the sample surface and the specific amount of gas
adsorbed on the surface is reported as the partial pressure of the gas (p/p0) increases
in the sample. The isotherm is analyzed with steepness of the curve and where that
steepness occurs. For instance for Type I, the curve becomes sharp at a very low p/p0
such that the pores are filled with a small amount of adsorbed gas indicating a
micropore structure [75].
Uniform mesoporous structures exhibit Type IV isotherms as stated before.
Different than the first three types, Type IV shows also a hysteresis loop (H2) which
is associated with capillary condensation of the gas during adsorption. H2 type of
hysteresis is commonly seen in narrow distributed mesopores like in MCM-41
structure [74, 76].

53
The physisorption analysis is carried out in METU Central Laboratory with
nitrogen. The degassing is done at 100°C for 16 hours. With that method, pore size
distribution and pore volume of the sample are obtained as well as the surface area.
6.2.3. Energy Dispersive Spectroscopy (EDS)
EDS characterization provides the user to identify the sample in terms of its
constituents both quantitatively and qualitatively. When electron beams are subjected
to the sample, electrons are extracted from the molecule and another molecule in an
outer shell replaces the extracted one emitting an X-ray. That emitted X-ray at
different intensities of electron beam corresponds to a different atom. With the
obtained spectra, the elemental composition of the sample is well-defined. However
since the beam hits the sample in the bulk, what is found with the analysis is that the
bulk composition [77].
The EDS characterizations of the samples are performed in METU
Metallurgical and Materials Engineering Department by a JSM-6400 (JEOL)
instrument equipped with NORAN System Six. Depending on the sample and the
used materials during synthesis, the sample is coated with either gold or carbon.
6.2.4. Thermogravimetric Analysis (TGA/DTA)
TGA provides the analyzer to obtain data on weight change (rate) during a
uniform temperature rise in a defined range. The causes of that change (both loss and
gain depending on the purge gas used) may be due to decomposition, oxidation or
else. By that way, thermal stability, oxidative capability or moisture content of the
sample can be determined. The weight of the sample is recorded simultaneously
during temperature change. The most commonly used purge gas is with its inert
behavior N2; then helium and also air.
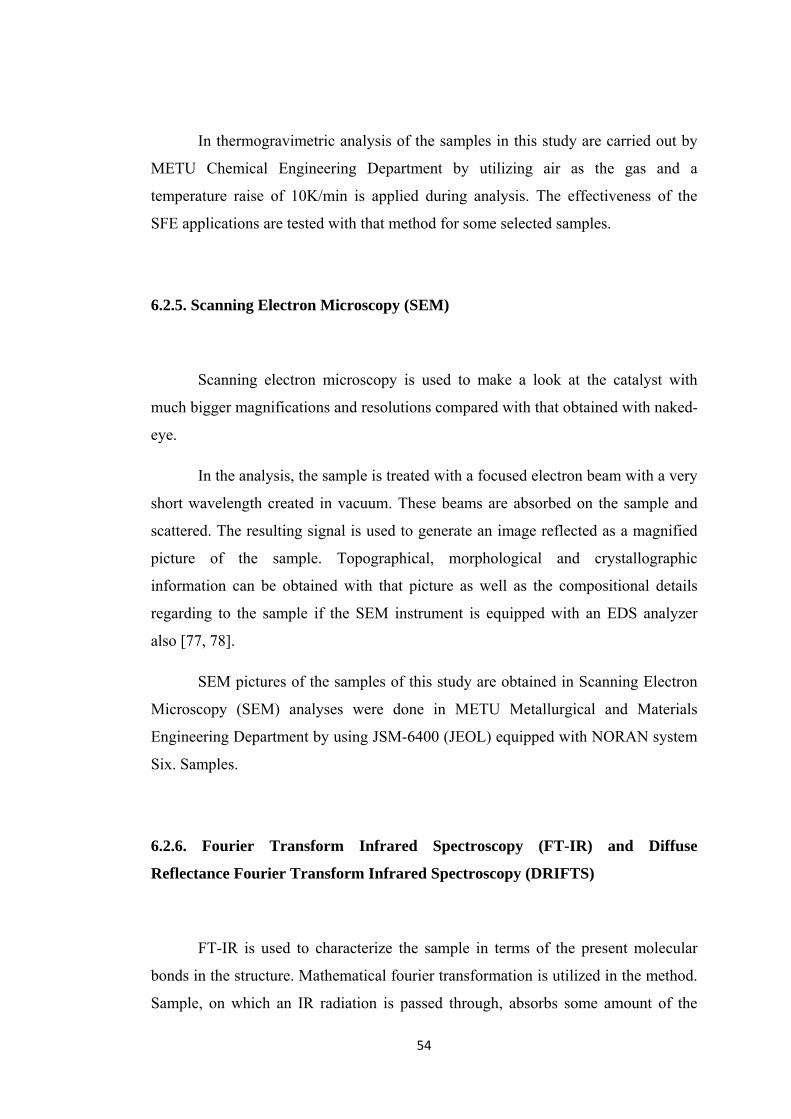
54
In thermogravimetric analysis of the samples in this study are carried out by
METU Chemical Engineering Department by utilizing air as the gas and a
temperature raise of 10K/min is applied during analysis. The effectiveness of the
SFE applications are tested with that method for some selected samples.
6.2.5. Scanning Electron Microscopy (SEM)
Scanning electron microscopy is used to make a look at the catalyst with
much bigger magnifications and resolutions compared with that obtained with naked-
eye.
In the analysis, the sample is treated with a focused electron beam with a very
short wavelength created in vacuum. These beams are absorbed on the sample and
scattered. The resulting signal is used to generate an image reflected as a magnified
picture of the sample. Topographical, morphological and crystallographic
information can be obtained with that picture as well as the compositional details
regarding to the sample if the SEM instrument is equipped with an EDS analyzer
also [77, 78].
SEM pictures of the samples of this study are obtained in Scanning Electron
Microscopy (SEM) analyses were done in METU Metallurgical and Materials
Engineering Department by using JSM-6400 (JEOL) equipped with NORAN system
Six. Samples.
6.2.6. Fourier Transform Infrared Spectroscopy (FT-IR) and Diffuse
Reflectance Fourier Transform Infrared Spectroscopy (DRIFTS)
FT-IR is used to characterize the sample in terms of the present molecular
bonds in the structure. Mathematical fourier transformation is utilized in the method.
Sample, on which an IR radiation is passed through, absorbs some amount of the

55
radiation whereas the rest is transmitted. That transmitted and absorbed radiation due
to vibrations between molecular bonds, are processed with fourier transformation and
the results are monitored as a spectrum. This spectrum can be used as a fingerprint
for the material such that no other sample can have the same spectrum. The
advantages of FT-IR over conventional dispersive IR techniques are primarily
increased sensitivity and simultaneous recording, i.e increased speed [79, 80].
Fourier Transform Infrared Spectroscopy analyses of the samples are
performed in METU Central Laboratory by a Bruker FTIR-IFS66/S instrument with
dilution with KBr.
Diffuse Reflectance FT-IR (DRIFTS) spectroscopy with adsorbed pyridine is
used to characterize the acidic sites (including both Brönsted and Lewis) present in
the catalytic structure. The method used is similar to that used in FT-IR. As a dilution
material KBr is used with a concentration of 5% (wt/wt). A baseline is obtained with
KBr itself. After mixed with KBr (two sets of samples are prepared), the samples are
dried to remove volatile components in the structure and pyridine is adsorbed on one
set of samples. DRIFTS analysis is done both by pyridine adsorbed and non-
adsorbed samples of the same catalyst and the difference between these two forms
the final spectra.
DRIFTS analyses are performed in METU Chemical Engineering Department
in the Kinetic Laboratory by using a Perkin Elmer Spectrum One instrument.
In both DRIFTS and FT-IR, the spectrum is analyzed with peaks
corresponding to each molecular vibration (like C-H strechings etc).
6.3. Experimental Set Up
The experiments conducted in the scope of this study, is performed in two
sections. Firstly, the catalyst synthesis, where different types of metals are
incorporated to MCM-41 structure together with the STA, is performed. Other than
synthesis of catalysis with different metals, two different surfactant removal

56
mechanisms are investigated to create the final structure of the catalyst. In the first
part of this section, the experimental set-up for supercritical fluid extraction system is
given. In addition to catalyst synthesis, the synthesized catalysts are tested in
methanol dehydration system. The details related to the experimental conditions and
the set-up is given in the second section.
6.3.1 Supercritical Fluid Extraction System
Surfactant removal with supercritical fluid extraction method is carried out in
and SFE system consisting of a stainless steel vessel with an inner volume of 24 ml
and outer diameter of 1”. The vessel is connected to a supercritical fluid extraction
system (Applied Separations, Spe-ed SFE model 7070) that can be pressurized up to
690 bar (10000 psi) with an oven temperature of maximum 240°C. In addition to
CO2 inlet, the system is connected to a liquid inlet for modifiers that can be used in
extraction.
As shown in Figure 12 [79], CO2 is fed to the system and pressurized to
predefined values by an air compressor (Atlas Copco) whereas methanol feeding is
achieved by an HPLC pump after an input of flow rate value. On the other hand, CO2
flow rate is measured by a rotameter (having two ranges measurement property with
dual ball system -carbon and steel-) which is placed at the exit of the system and
calibrated for CO2 flow. The temperatures of oven, the extraction vessel and the
outlet valve of species are controlled by SFE itself. While the former two are set
according to the operating conditions of extraction, the valve temperature is set to
40°C to avoid evaporation of methanol at the outlet.

57
Figure 12: Supercritical fluid extraction system [modified from 81]
The exiting species from the system are mainly CO2, methanol and the
extracted surfactant. At 40°C valve temperature, CO2 is directly sent to the flow
meter where surfactant dissolved in methanol is collected in the bottle connected to
the valve. The extraction conditions applied to each catalyst are given in Table 8 and
Table 10. All catalysts are treated with SFE. The effects of operating conditions,
pressure and period, are tested with SZ group catalysts and with the SC and SN
catalysts, effect of metal type is investigated.
6.3.2 Methanol Dehydration System
The synthesized catalysts are tested in methanol dehydration reaction which
is carried out in a tubular reactor that is placed into a tubular furnace to keep the
temperature constant during the reaction. 0.2 g of each catalyst is fixed in the middle
of the reactor (1/4” OD) by the use of glass wool, which does not have any
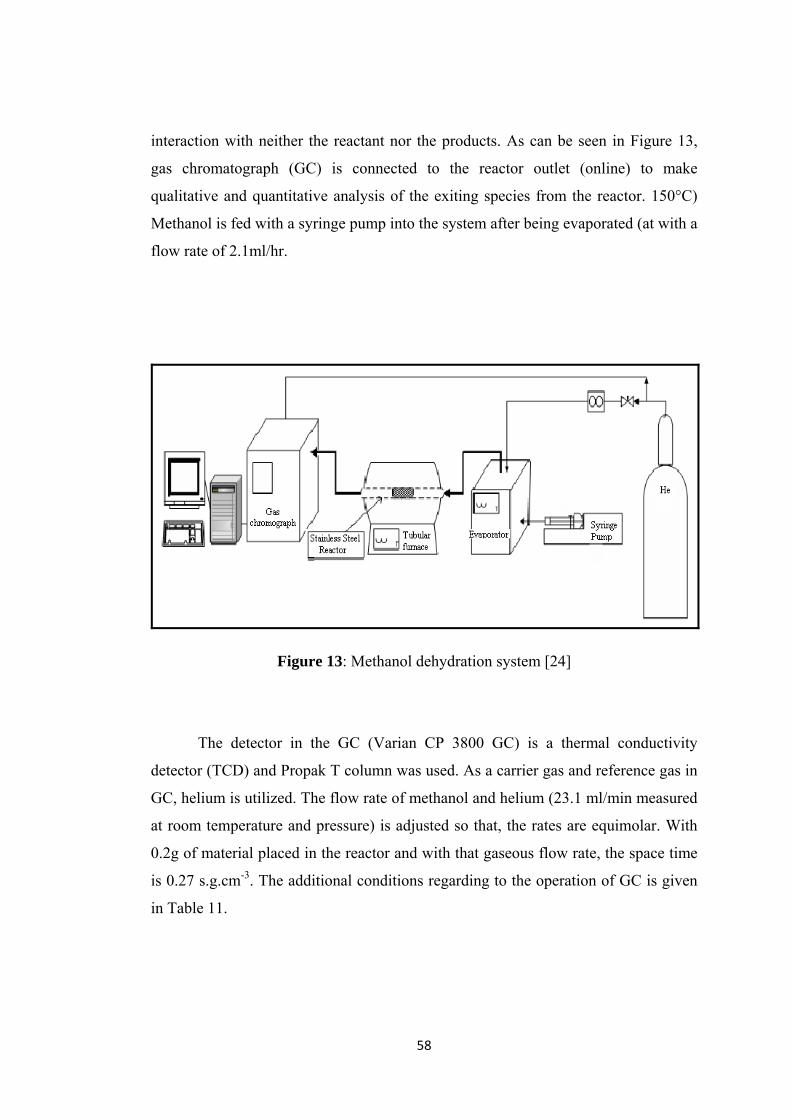
58
interaction with neither the reactant nor the products. As can be seen in Figure 13,
gas chromatograph (GC) is connected to the reactor outlet (online) to make
qualitative and quantitative analysis of the exiting species from the reactor. 150°C)
Methanol is fed with a syringe pump into the system after being evaporated (at with a
flow rate of 2.1ml/hr.
Figure 13: Methanol dehydration system [24]
The detector in the GC (Varian CP 3800 GC) is a thermal conductivity
detector (TCD) and Propak T column was used. As a carrier gas and reference gas in
GC, helium is utilized. The flow rate of methanol and helium (23.1 ml/min measured
at room temperature and pressure) is adjusted so that, the rates are equimolar. With
0.2g of material placed in the reactor and with that gaseous flow rate, the space time
is 0.27 s.g.cm-3. The additional conditions regarding to the operation of GC is given
in Table 11.
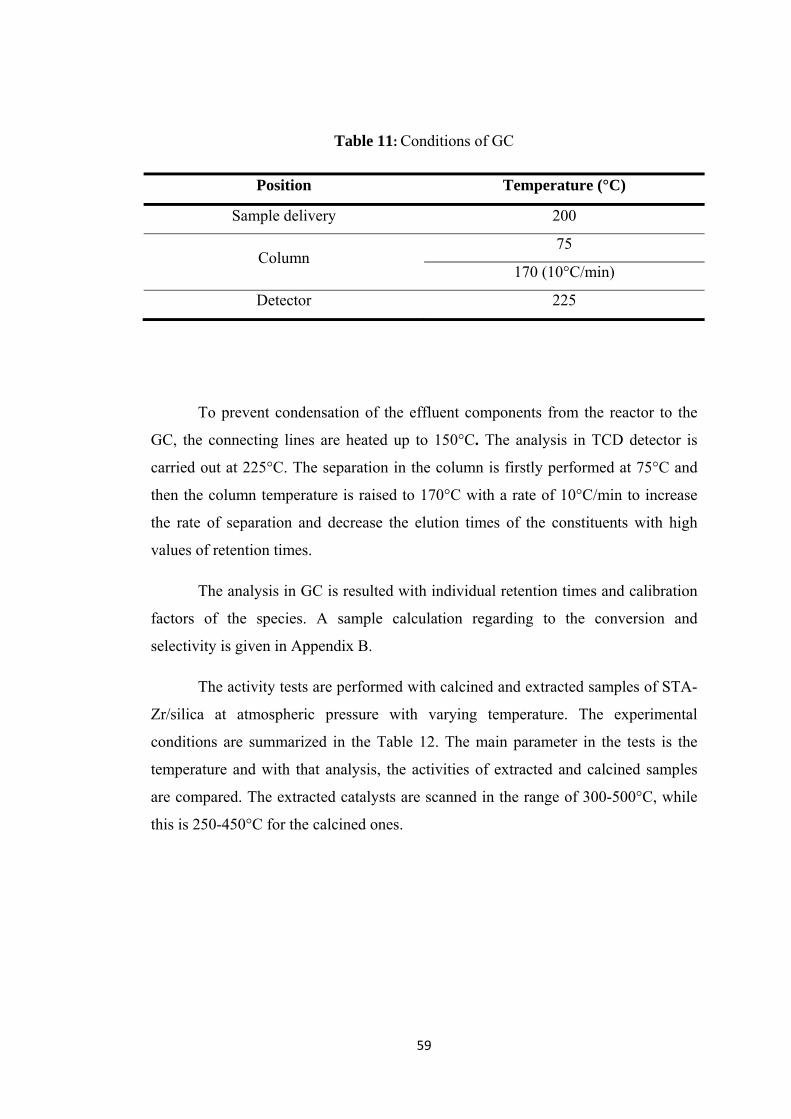
59
Table 11: Conditions of GC
Position Temperature (°C)
Sample delivery 200
Column 75
170 (10°C/min)
Detector 225
To prevent condensation of the effluent components from the reactor to the
GC, the connecting lines are heated up to 150°C. The analysis in TCD detector is
carried out at 225°C. The separation in the column is firstly performed at 75°C and
then the column temperature is raised to 170°C with a rate of 10°C/min to increase
the rate of separation and decrease the elution times of the constituents with high
values of retention times.
The analysis in GC is resulted with individual retention times and calibration
factors of the species. A sample calculation regarding to the conversion and
selectivity is given in Appendix B.
The activity tests are performed with calcined and extracted samples of STA-
Zr/silica at atmospheric pressure with varying temperature. The experimental
conditions are summarized in the Table 12. The main parameter in the tests is the
temperature and with that analysis, the activities of extracted and calcined samples
are compared. The extracted catalysts are scanned in the range of 300-500°C, while
this is 250-450°C for the calcined ones.

60
Table 12: Summary of experimental conditions
Catalyst Temperature (°C) Amount used
Calcined STA-Zr/Silica
samples
250
0.2 g catalyst,
0.27 s.g/cm3 space time
300
350
400
450
Extracted STA-Zr/Silica
samples
350
400
450
500
61
CHAPTER 7
RESULTS
7.1. Characterization Results
In this section, the results regarding to the characterization of the catalysts are
given. These characterizations include XRD, EDS, N2 physisorption, FTIR and SEM
results. The section comprises of two subsections which are classified according to
the type of metal incorporated to the catalyst structure.
7.1.1. Characterization Results of STA-Zr/Silica (SZ Group) Catalysts
Characterization results of Zr and STA incorporated on MCM-41 support are
presented and discussed in this section. These results are in two sections; the first
part consists of the results of calcined group, where the second includes the results of
exracted SZ catalysts.
7.1.1.1. Characterization Results of Calcined SZ Group Catalysts
The calcination process is one of the two methods used to extract the
surfactant from catalyst matrix. This section comprises of the results of calcined SZ
catalysts.

62
7.1.1.1.1. XRD Results
X-Ray diffraction analyses are used to see the crystal structure of the
materials. In Figure 14 and Figure 15, the XRD patterns of calcined SZ catalysts are
shown.
Figure 14: XRD pattern of calcined SZ group catalysts (1 to 3)
Figure 15: XRD pattern of calcined SZ group catalysts (4 to 6)
63
The patterns shown in Figure 14 and Figure 15, indicate well dispersed highly
amorphous structures. The catalysts from SZ1 to SZ3 show no reflection peaks when
compared with the ones SZ4 to SZ6. The main difference between these two groups
is the Zr/Si ratio. Increasing Zr content of the catalyst matrix enables the materials to
be well-dispersed in the structure. Having the least Zr/Si ratio, cSZ6 catalyst shows
peaks corresponding to the STA structure (W20O58) at 2θ degrees 23.2° and 32° [82].
The broad peak between 1° and 10° indicates the presence of amorphous silica
structure of the synthesized mesoporous material.
Compared with the original MCM-41 structure, as shown in Figure 7, there
exists distortions in the core pattern during incorporation. The (100) peak of MCM-
41 (first reflection peak) is rather dispersed at a wider range. The other reflection
peaks at 2θ of 3.2°, 3.8° and 5.0° cannot be observed in these patterns.
7.1.1.1.2. EDS Results
EDS analysis, gives the bulk composition (both atomic and weight) of the
sample. EDS results of the catalysts are given in Table 13. It is clear from the results
that metals are successfully incorporated to the catalyst structure.
In all of the catalysts, the prepared Zr/Si ratio is less than the result indicated
by EDS analysis. The integration of Zr is much better compared with the other
constituents, silica and tungsten. Excluding cSZ4 and cSZ5, W/Si ratios in EDS
results are also higher than the prepared ratios. During synthesis, silica is not very
well incorporated into the structure and thus, lost during washing step. In addition to
the incorporation issues of the materials, the difference between the experimentally
prepared ratios and EDS results can be attributed to the fact that EDS
characterization analyses the bulk of the catalyst to a limited deep and thus, the real
metal contents may not be observed during analysis. Furthermore, there might be
unhomogeneities during sampling part of characterization.
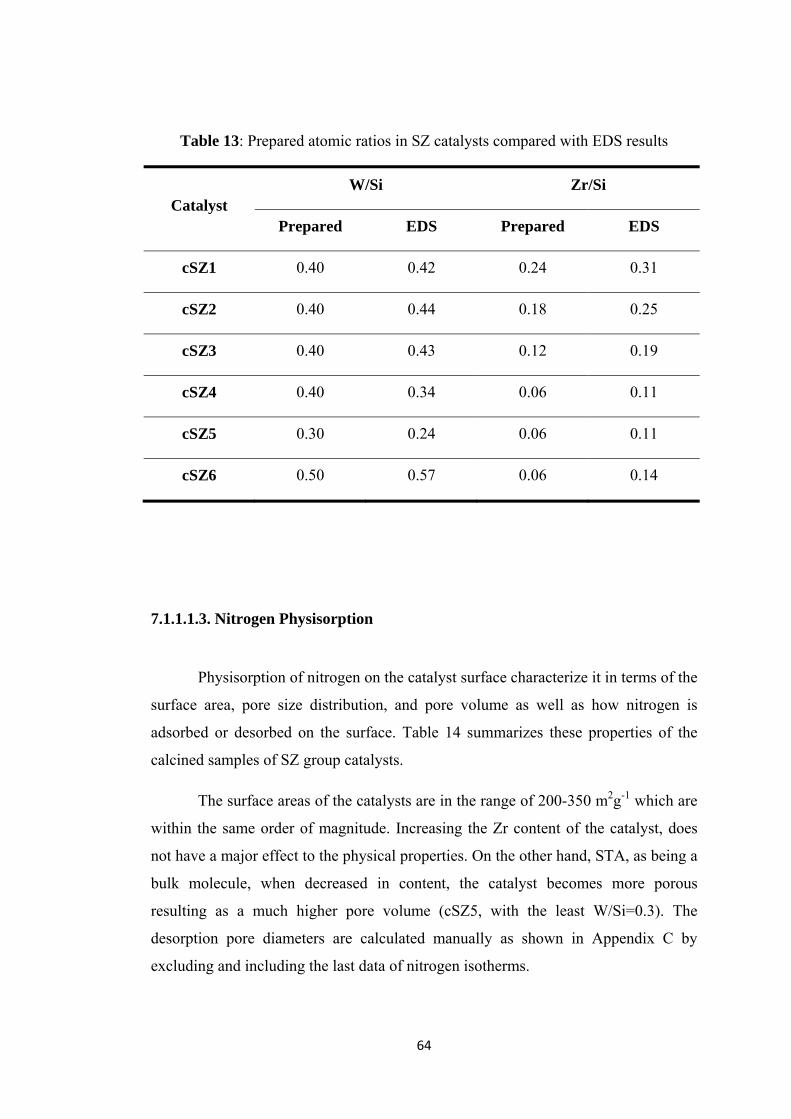
64
Table 13: Prepared atomic ratios in SZ catalysts compared with EDS results
Catalyst W/Si Zr/Si
Prepared EDS Prepared EDS
cSZ1 0.40 0.42 0.24 0.31
cSZ2 0.40 0.44 0.18 0.25
cSZ3 0.40 0.43 0.12 0.19
cSZ4 0.40 0.34 0.06 0.11
cSZ5 0.30 0.24 0.06 0.11
cSZ6 0.50 0.57 0.06 0.14
7.1.1.1.3. Nitrogen Physisorption
Physisorption of nitrogen on the catalyst surface characterize it in terms of the
surface area, pore size distribution, and pore volume as well as how nitrogen is
adsorbed or desorbed on the surface. Table 14 summarizes these properties of the
calcined samples of SZ group catalysts.
The surface areas of the catalysts are in the range of 200-350 m2g-1 which are
within the same order of magnitude. Increasing the Zr content of the catalyst, does
not have a major effect to the physical properties. On the other hand, STA, as being a
bulk molecule, when decreased in content, the catalyst becomes more porous
resulting as a much higher pore volume (cSZ5, with the least W/Si=0.3). The
desorption pore diameters are calculated manually as shown in Appendix C by
excluding and including the last data of nitrogen isotherms.
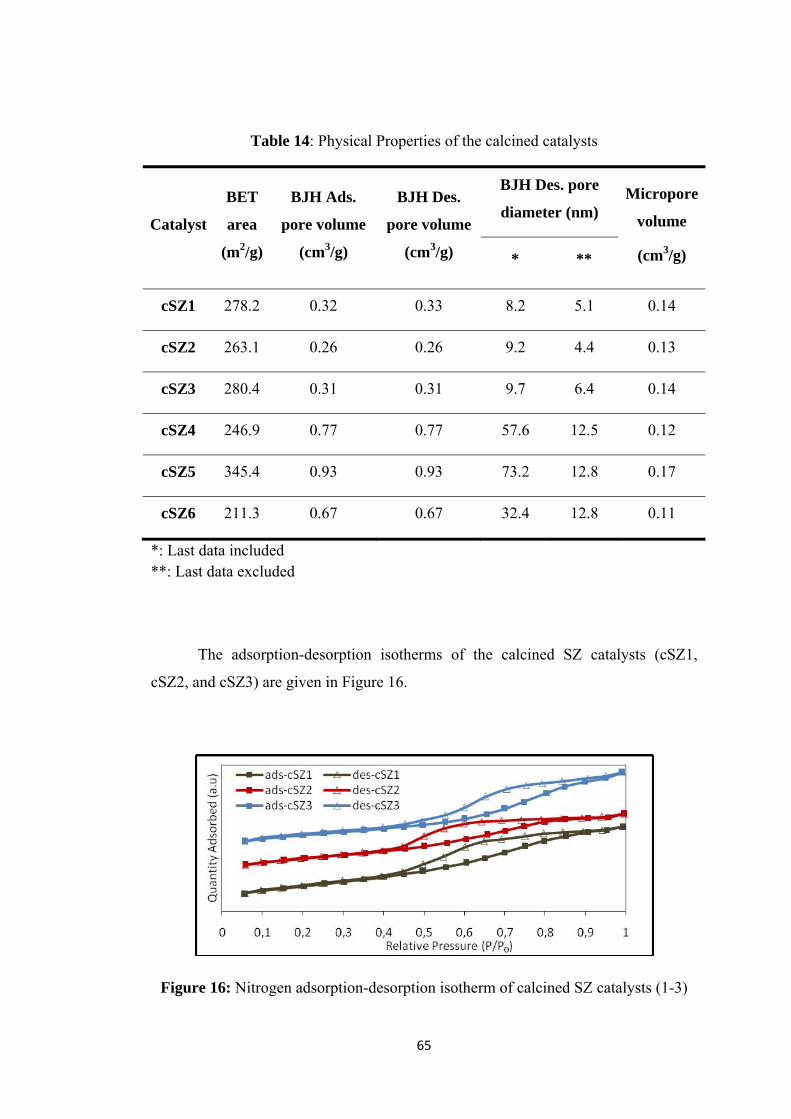
65
Table 14: Physical Properties of the calcined catalysts
Catalyst
BET
area
(m2/g)
BJH Ads.
pore volume
(cm3/g)
BJH Des.
pore volume
(cm3/g)
BJH Des. pore
diameter (nm) Micropore
volume
(cm3/g) * **
cSZ1 278.2 0.32 0.33 8.2 5.1 0.14
cSZ2 263.1 0.26 0.26 9.2 4.4 0.13
cSZ3 280.4 0.31 0.31 9.7 6.4 0.14
cSZ4 246.9 0.77 0.77 57.6 12.5 0.12
cSZ5 345.4 0.93 0.93 73.2 12.8 0.17
cSZ6 211.3 0.67 0.67 32.4 12.8 0.11
*: Last data included **: Last data excluded
The adsorption-desorption isotherms of the calcined SZ catalysts (cSZ1,
cSZ2, and cSZ3) are given in Figure 16.
Figure 16: Nitrogen adsorption-desorption isotherm of calcined SZ catalysts (1-3)
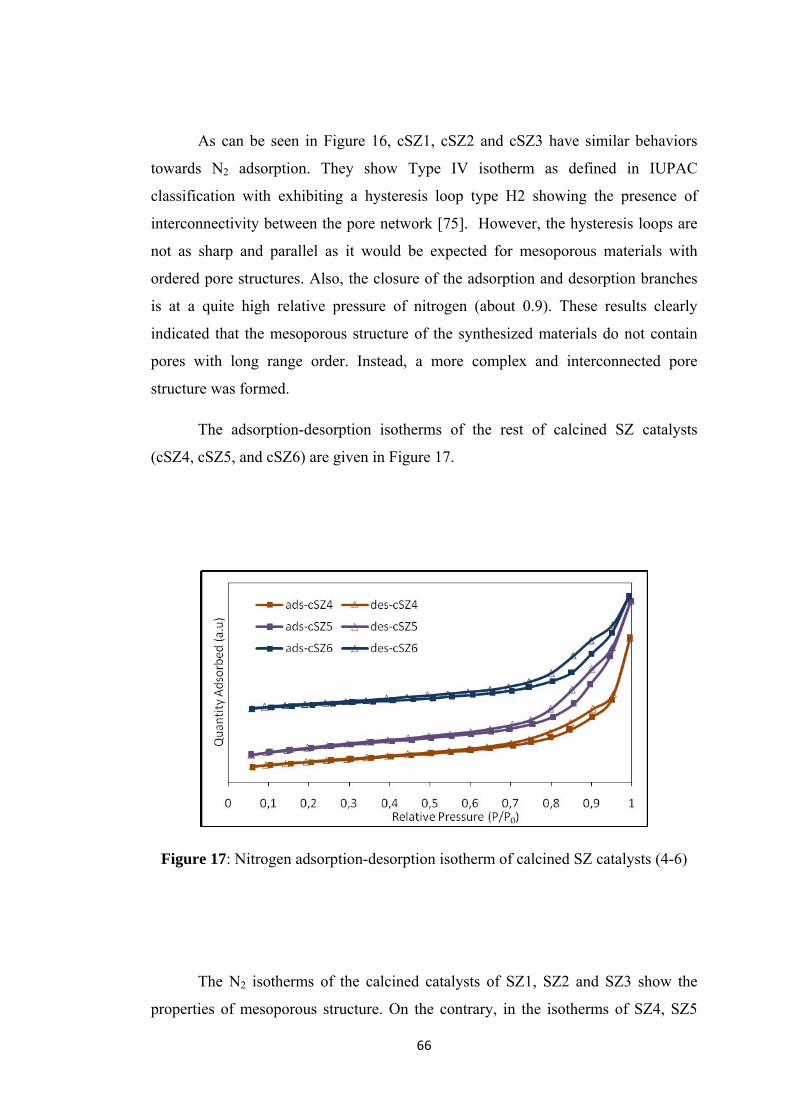
66
As can be seen in Figure 16, cSZ1, cSZ2 and cSZ3 have similar behaviors
towards N2 adsorption. They show Type IV isotherm as defined in IUPAC
classification with exhibiting a hysteresis loop type H2 showing the presence of
interconnectivity between the pore network [75]. However, the hysteresis loops are
not as sharp and parallel as it would be expected for mesoporous materials with
ordered pore structures. Also, the closure of the adsorption and desorption branches
is at a quite high relative pressure of nitrogen (about 0.9). These results clearly
indicated that the mesoporous structure of the synthesized materials do not contain
pores with long range order. Instead, a more complex and interconnected pore
structure was formed.
The adsorption-desorption isotherms of the rest of calcined SZ catalysts
(cSZ4, cSZ5, and cSZ6) are given in Figure 17.
Figure 17: Nitrogen adsorption-desorption isotherm of calcined SZ catalysts (4-6)
The N2 isotherms of the calcined catalysts of SZ1, SZ2 and SZ3 show the
properties of mesoporous structure. On the contrary, in the isotherms of SZ4, SZ5
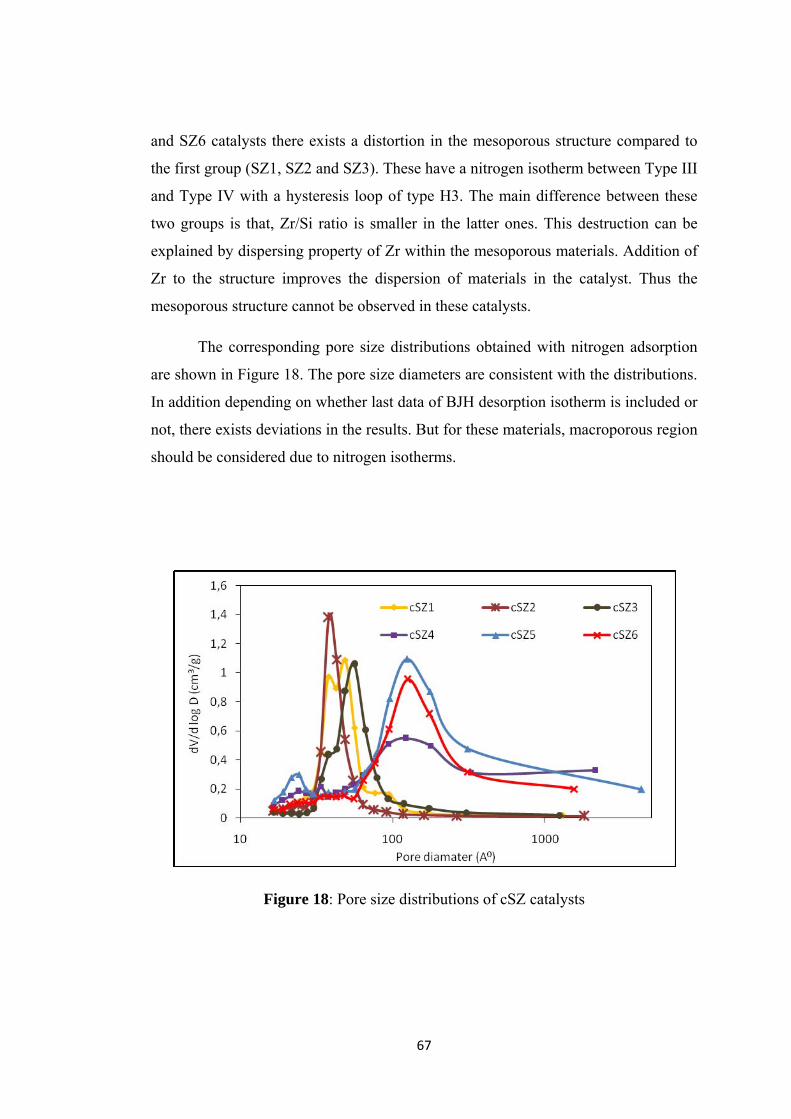
67
and SZ6 catalysts there exists a distortion in the mesoporous structure compared to
the first group (SZ1, SZ2 and SZ3). These have a nitrogen isotherm between Type III
and Type IV with a hysteresis loop of type H3. The main difference between these
two groups is that, Zr/Si ratio is smaller in the latter ones. This destruction can be
explained by dispersing property of Zr within the mesoporous materials. Addition of
Zr to the structure improves the dispersion of materials in the catalyst. Thus the
mesoporous structure cannot be observed in these catalysts.
The corresponding pore size distributions obtained with nitrogen adsorption
are shown in Figure 18. The pore size diameters are consistent with the distributions.
In addition depending on whether last data of BJH desorption isotherm is included or
not, there exists deviations in the results. But for these materials, macroporous region
should be considered due to nitrogen isotherms.
Figure 18: Pore size distributions of cSZ catalysts
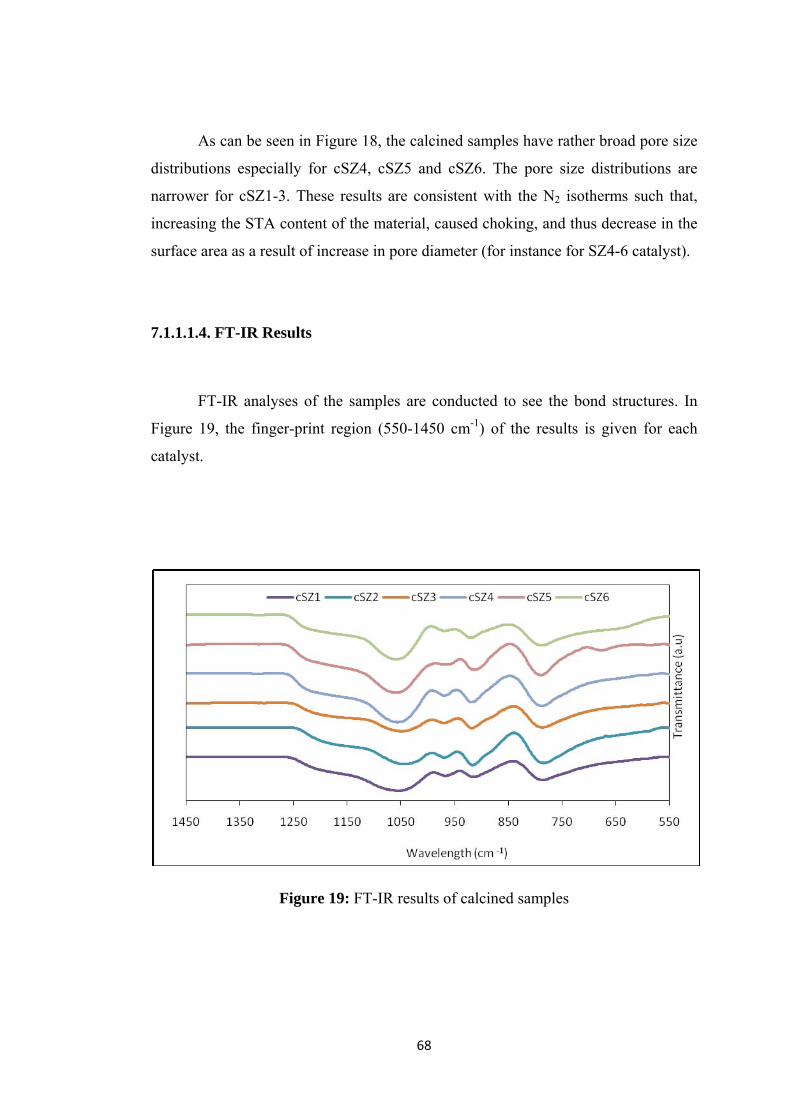
68
As can be seen in Figure 18, the calcined samples have rather broad pore size
distributions especially for cSZ4, cSZ5 and cSZ6. The pore size distributions are
narrower for cSZ1-3. These results are consistent with the N2 isotherms such that,
increasing the STA content of the material, caused choking, and thus decrease in the
surface area as a result of increase in pore diameter (for instance for SZ4-6 catalyst).
7.1.1.1.4. FT-IR Results
FT-IR analyses of the samples are conducted to see the bond structures. In
Figure 19, the finger-print region (550-1450 cm-1) of the results is given for each
catalyst.
Figure 19: FT-IR results of calcined samples

69
As the bond characteristics are given in Table 15, when the FT-IR spectra of
the synthesized materials are compared with that of untreated pure STA, there exists
distortions in STA structure as well as similarities with it.
Table 15: Comparison of calcined materials with untreated STA
Bond Character (cm-1) W
-O-W
W=
O
W-O
corn
er-W
Si-
O-S
i
Si-
O
Catalyst
Untreated STA [82] 796 970 876 1090 920
cSZ1 786 967 - 1055 915
cSZ2 784 969 - 1043 917
cSZ3 786 970 - 1048 918
cSZ4 788 970 - 1056 918
cSZ5 789 966 - 1059 913
cSZ6 787 969 - 1059 920
As shown in Table 15, the catalysts show, W-O-W, W=O, Si-O-Si and Si-O
stretching as in pure silicatungstic acid. On the other hand, W-Ocorner
-W bond cannot
be observed in the structure. The synthesized calcined materials have most
characteristic bonds of pure STA, as well show some indications of distortions.

70
7.1.1.1.5. DRIFTS Results
Drifts analysis of the pyridine adsorbed calcined samples are shown in Figure
20. The pyridine adsorbed samples show peaks corresponding to both Brönsted and
Lewis acid sites. Relatively broad peak between 1460-1480 cm-1 shows the presence
of Lewis acid sites whereas the peak at 1540 cm-1 is a sign of Brönsted acid sites.
The sharper peak at 1490 cm-1 is the combined sign of both types of acid sites [82].
Figure 20: Drifts analysis of calcined SZ catalysts
Among the synthesized calcined catalysis, cSZ5 has the least acidity
compared to the others and do not show considerable peaks of Brönsted and Lewis
acid sites. The main reason is the lowest W/Si ratio of 0.3. Analyzing the effect of
W/Si ratio in the synthesized materials show that, increasing the W/Si ratio (addition
of higher amounts of STA), enhances the acidity of catalyst. cSZ6 has the highest
STA content and the pyridine adsorbed analysis shows the highest acidity.
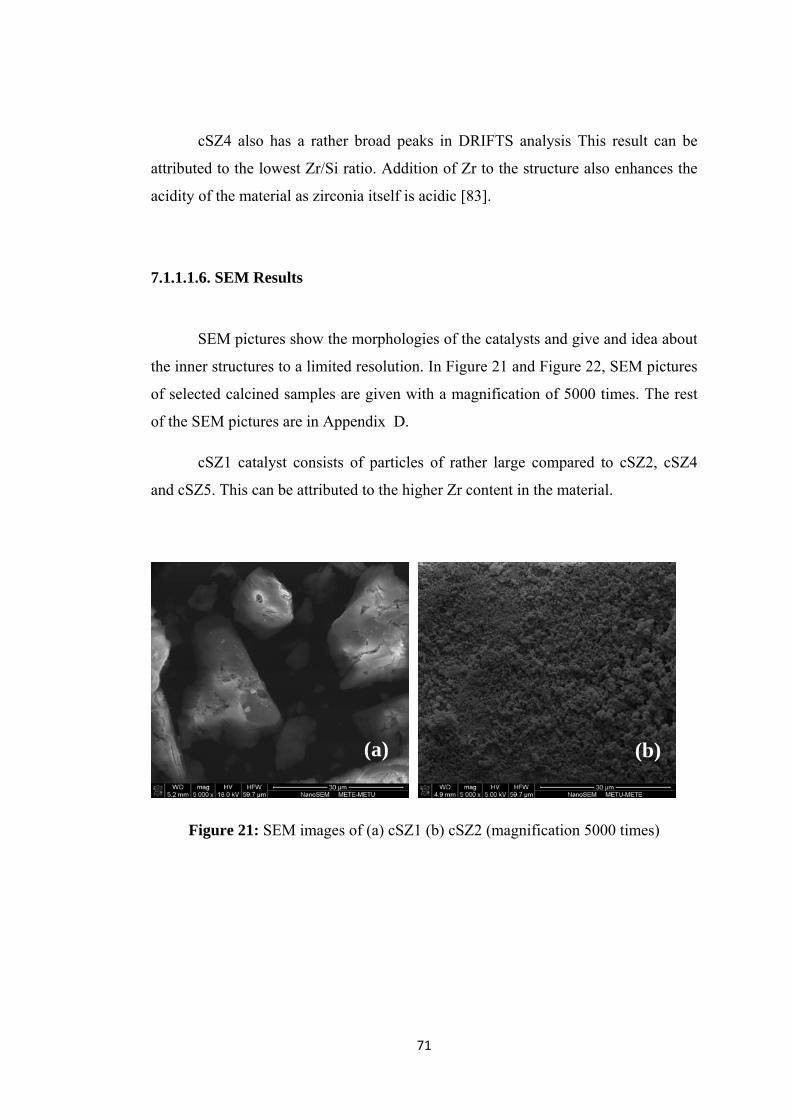
71
cSZ4 also has a rather broad peaks in DRIFTS analysis This result can be
attributed to the lowest Zr/Si ratio. Addition of Zr to the structure also enhances the
acidity of the material as zirconia itself is acidic [83].
7.1.1.1.6. SEM Results
SEM pictures show the morphologies of the catalysts and give and idea about
the inner structures to a limited resolution. In Figure 21 and Figure 22, SEM pictures
of selected calcined samples are given with a magnification of 5000 times. The rest
of the SEM pictures are in Appendix D.
cSZ1 catalyst consists of particles of rather large compared to cSZ2, cSZ4
and cSZ5. This can be attributed to the higher Zr content in the material.
Figure 21: SEM images of (a) cSZ1 (b) cSZ2 (magnification 5000 times)
(a) (b)
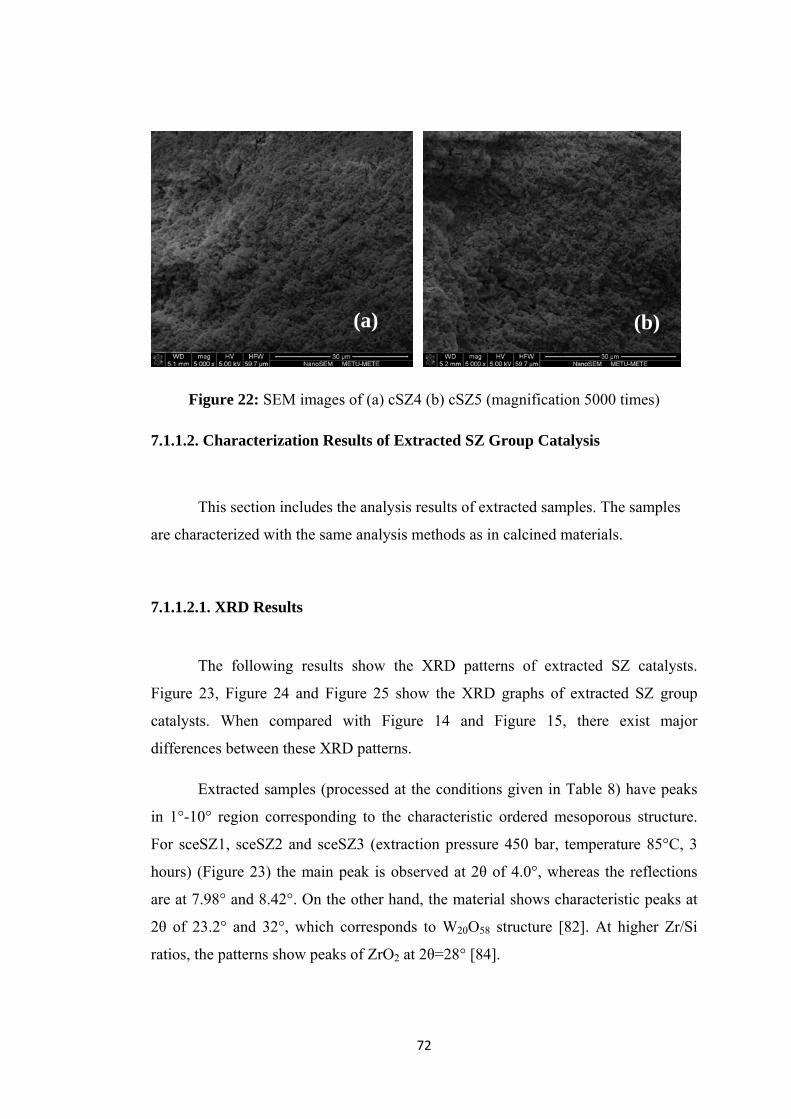
72
Figure 22: SEM images of (a) cSZ4 (b) cSZ5 (magnification 5000 times)
7.1.1.2. Characterization Results of Extracted SZ Group Catalysis
This section includes the analysis results of extracted samples. The samples
are characterized with the same analysis methods as in calcined materials.
7.1.1.2.1. XRD Results
The following results show the XRD patterns of extracted SZ catalysts.
Figure 23, Figure 24 and Figure 25 show the XRD graphs of extracted SZ group
catalysts. When compared with Figure 14 and Figure 15, there exist major
differences between these XRD patterns.
Extracted samples (processed at the conditions given in Table 8) have peaks
in 1°-10° region corresponding to the characteristic ordered mesoporous structure.
For sceSZ1, sceSZ2 and sceSZ3 (extraction pressure 450 bar, temperature 85°C, 3
hours) (Figure 23) the main peak is observed at 2θ of 4.0°, whereas the reflections
are at 7.98° and 8.42°. On the other hand, the material shows characteristic peaks at
2θ of 23.2° and 32°, which corresponds to W20O58 structure [82]. At higher Zr/Si
ratios, the patterns show peaks of ZrO2 at 2θ=28° [84].
(a) (b)
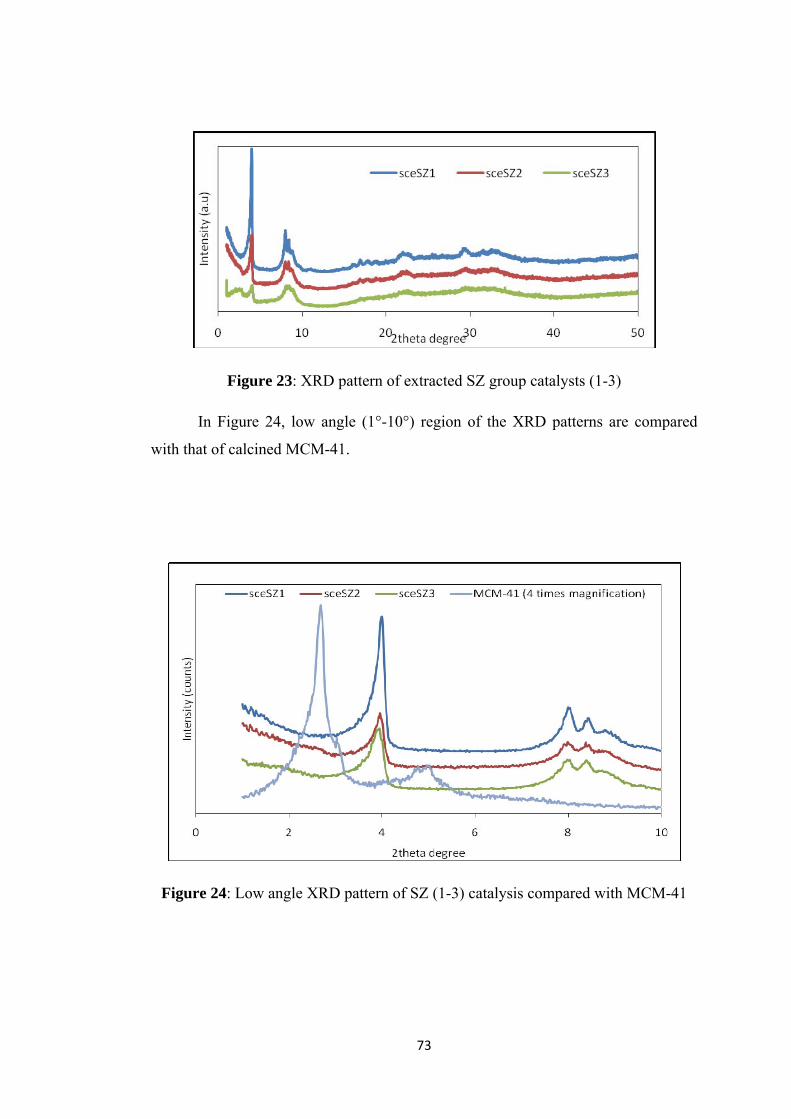
73
Figure 23: XRD pattern of extracted SZ group catalysts (1-3)
In Figure 24, low angle (1°-10°) region of the XRD patterns are compared
with that of calcined MCM-41.
Figure 24: Low angle XRD pattern of SZ (1-3) catalysis compared with MCM-41
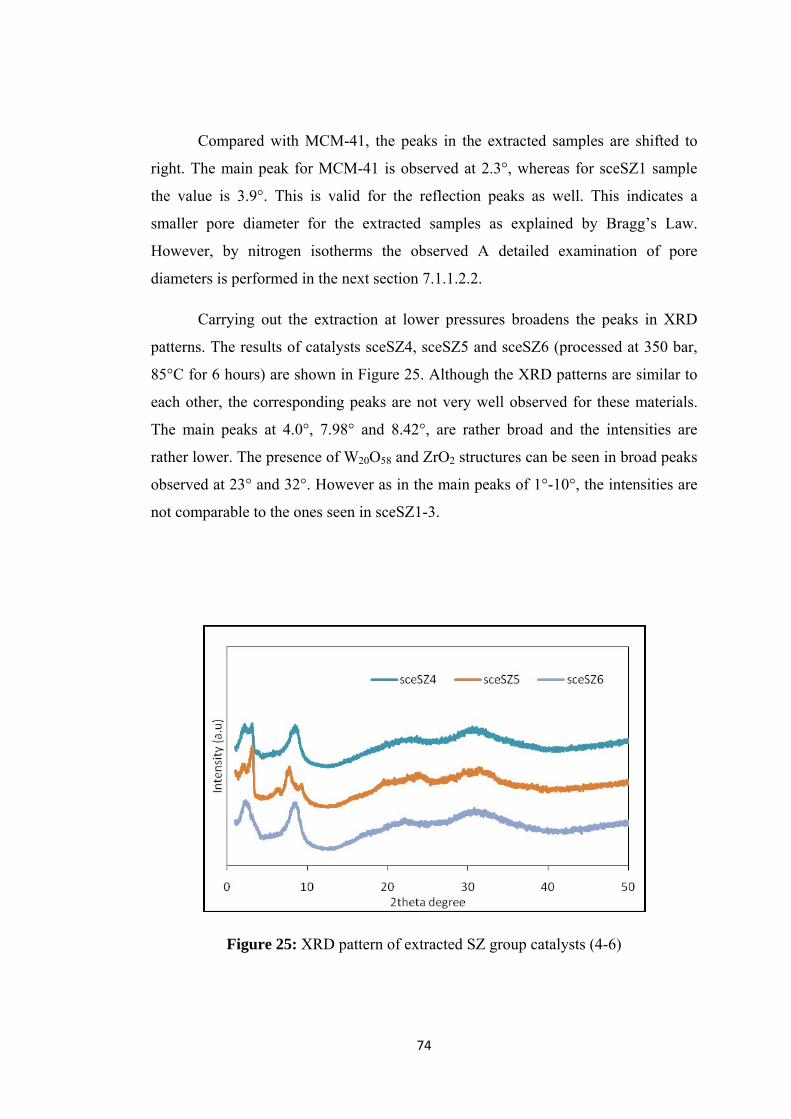
74
Compared with MCM-41, the peaks in the extracted samples are shifted to
right. The main peak for MCM-41 is observed at 2.3°, whereas for sceSZ1 sample
the value is 3.9°. This is valid for the reflection peaks as well. This indicates a
smaller pore diameter for the extracted samples as explained by Bragg’s Law.
However, by nitrogen isotherms the observed A detailed examination of pore
diameters is performed in the next section 7.1.1.2.2.
Carrying out the extraction at lower pressures broadens the peaks in XRD
patterns. The results of catalysts sceSZ4, sceSZ5 and sceSZ6 (processed at 350 bar,
85°C for 6 hours) are shown in Figure 25. Although the XRD patterns are similar to
each other, the corresponding peaks are not very well observed for these materials.
The main peaks at 4.0°, 7.98° and 8.42°, are rather broad and the intensities are
rather lower. The presence of W20O58 and ZrO2 structures can be seen in broad peaks
observed at 23° and 32°. However as in the main peaks of 1°-10°, the intensities are
not comparable to the ones seen in sceSZ1-3.
Figure 25: XRD pattern of extracted SZ group catalysts (4-6)
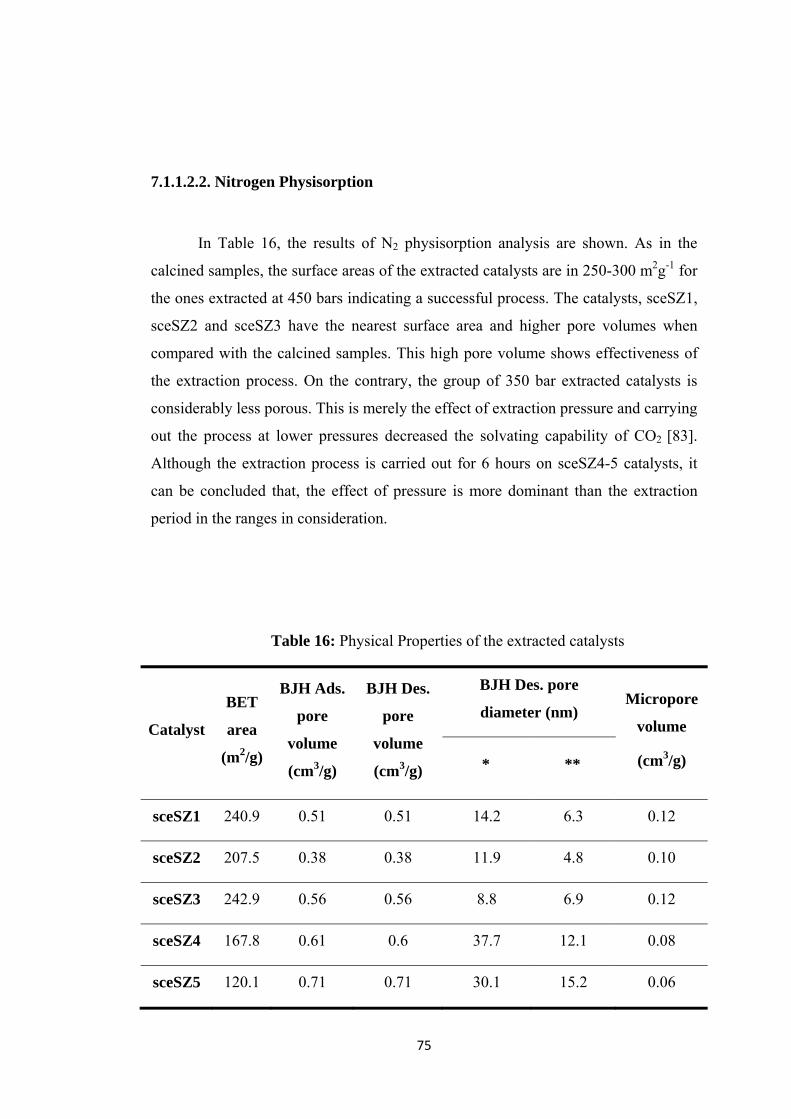
75
7.1.1.2.2. Nitrogen Physisorption
In Table 16, the results of N2 physisorption analysis are shown. As in the
calcined samples, the surface areas of the extracted catalysts are in 250-300 m2g-1 for
the ones extracted at 450 bars indicating a successful process. The catalysts, sceSZ1,
sceSZ2 and sceSZ3 have the nearest surface area and higher pore volumes when
compared with the calcined samples. This high pore volume shows effectiveness of
the extraction process. On the contrary, the group of 350 bar extracted catalysts is
considerably less porous. This is merely the effect of extraction pressure and carrying
out the process at lower pressures decreased the solvating capability of CO2 [83].
Although the extraction process is carried out for 6 hours on sceSZ4-5 catalysts, it
can be concluded that, the effect of pressure is more dominant than the extraction
period in the ranges in consideration.
Table 16: Physical Properties of the extracted catalysts
Catalyst
BET
area
(m2/g)
BJH Ads.
pore
volume
(cm3/g)
BJH Des.
pore
volume
(cm3/g)
BJH Des. pore
diameter (nm) Micropore
volume
(cm3/g) * **
sceSZ1 240.9 0.51 0.51 14.2 6.3 0.12
sceSZ2 207.5 0.38 0.38 11.9 4.8 0.10
sceSZ3 242.9 0.56 0.56 8.8 6.9 0.12
sceSZ4 167.8 0.61 0.6 37.7 12.1 0.08
sceSZ5 120.1 0.71 0.71 30.1 15.2 0.06

76
sceSZ6 123.8 1.39 1.38 802 11.4 0.06
MCM41 1250 1.28 1.29 5.2 3.0 0.6
*: Last data included **: Last data excluded
Comparing the textural properties of extracted samples with those of calcined
MCM-41 and coupling these results with the XRD patterns shown in Figure 24,
indicate that the supercritically extracted samples have a larger pore diameter.
Although the XRD patterns of extracted samples are shifted to right, indicating a
smaller diameter, the results reveal that, there exists larger pore materials with
thinner wall thickness.
The nitrogen adsorption and desorption curves of the extracted samples are
given in Figure 26 and Figure 27.
The extracted catalysts also show similar behaviors as with the calcined ones.
Type IV and Type IV and Type III isotherms are prevailing properties for SZ1-3 and
SZ4-6 catalysts, respectively.
As shown in Figure 26, for sceSZ1 catalyst, pore filling occurs at relatively
high P/Po ratios (at nearly 0.62) when compared with sceSZ2 (of which the
corresponding value is nearly 0.46). This result is consistent with higher pore
diameter of sceSZ1.
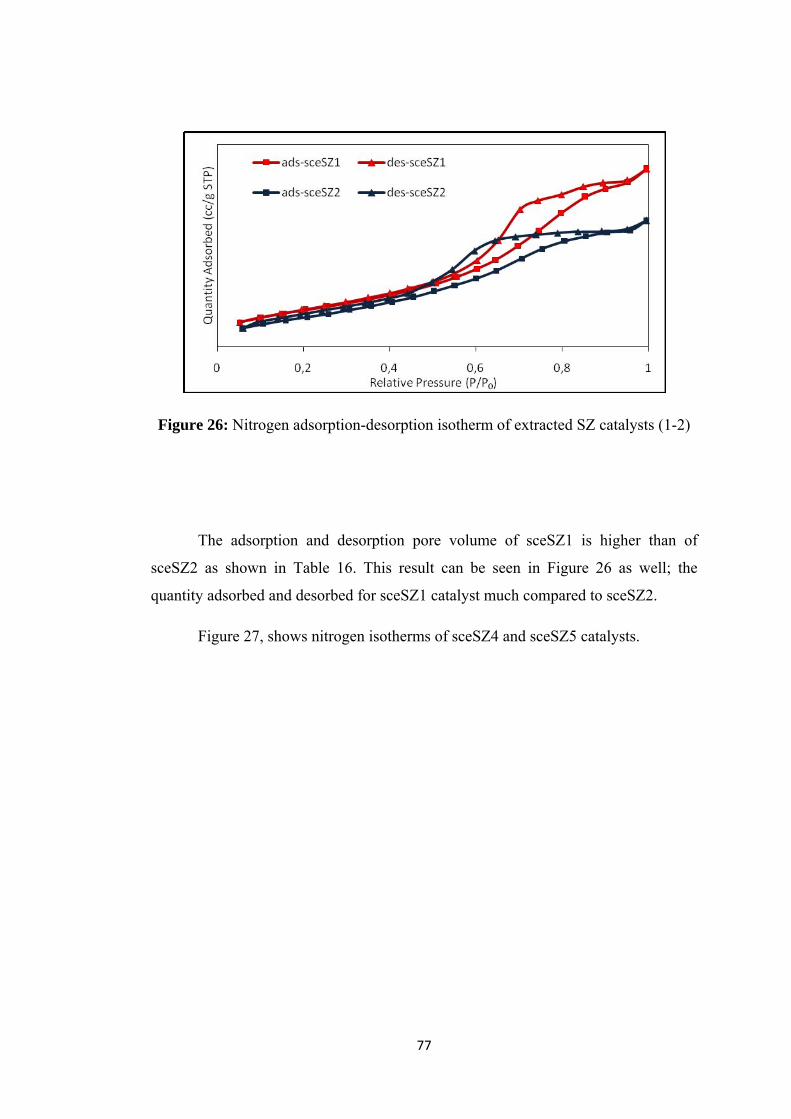
77
Figure 26: Nitrogen adsorption-desorption isotherm of extracted SZ catalysts (1-2)
The adsorption and desorption pore volume of sceSZ1 is higher than of
sceSZ2 as shown in Table 16. This result can be seen in Figure 26 as well; the
quantity adsorbed and desorbed for sceSZ1 catalyst much compared to sceSZ2.
Figure 27, shows nitrogen isotherms of sceSZ4 and sceSZ5 catalysts.

78
Figure 27: Nitrogen adsorption-desorption isotherm of extracted SZ catalysts (4-5)
The resulting isotherms are different from the ones obtained in sceSZ1-3
catalysts. These ones have isotherms between Type III and Type IV. The effect of
carrying out the pressure at lower pressures (350 bar) can also be seen in these
isotherms. The distortion in mesoporous structure is obvious from the isotherms. In
addition, pore size distributions of the extracted samples are shown in Figure 28.
The distortions in the mesoporous structure are present in low Zr/Si ratios.
The extracted samples have a pore size distribution as shown in Figure 28. The ones
extracted at lower pressure (SZ4-6 at 350bar), has a larger pore diameter indicating a
lower surface area. This result is also a consequence of increased STA content for
those catalysts.
79
Figure 28: Pore size distributions of sceSZ catalysts
sceSZ4-6 samples have pore size distributions in a wider and larger pore
diameters. These results are consistent with the ones tabulated in Table 16.
Furthermore, the microporous behavior indicated in nitrogen isotherms of these
samples (Figure 27) are also reflected to the calculated pore size distributions in
Appendix C.
7.1.1.2.3. FT-IR Results
The FT-IR results of the extracted samples are given for the finger-print
region in Figure 29.
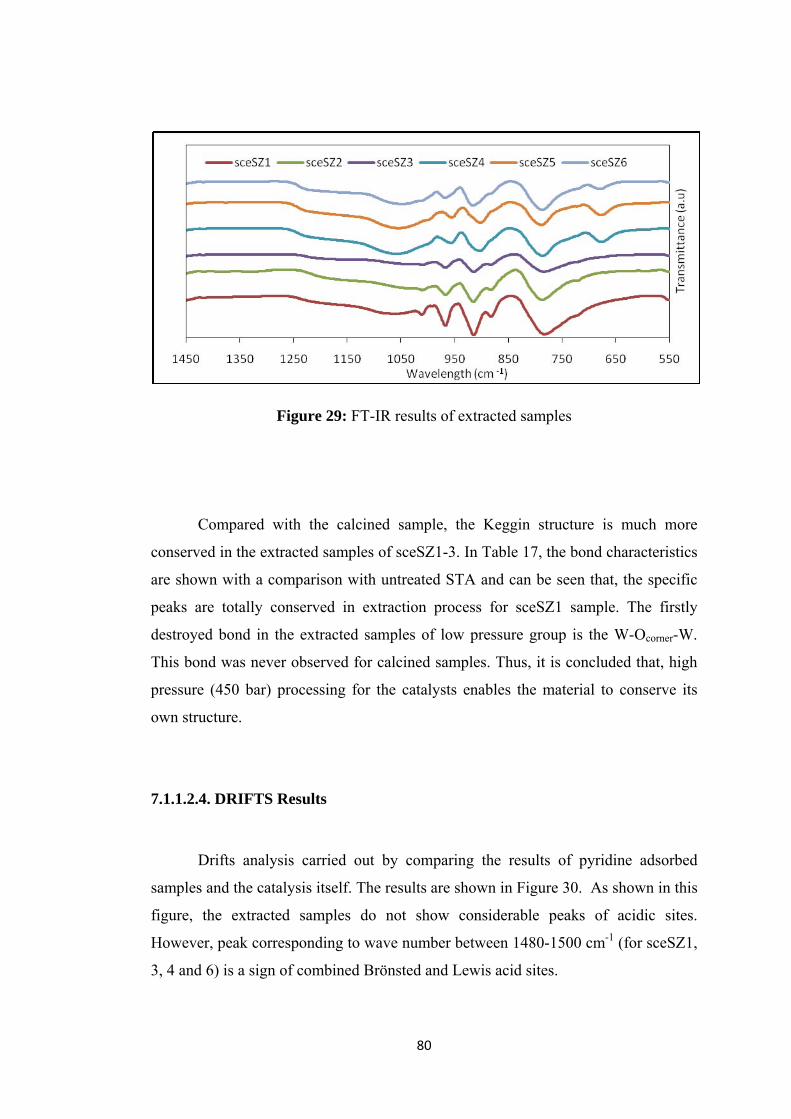
80
Figure 29: FT-IR results of extracted samples
Compared with the calcined sample, the Keggin structure is much more
conserved in the extracted samples of sceSZ1-3. In Table 17, the bond characteristics
are shown with a comparison with untreated STA and can be seen that, the specific
peaks are totally conserved in extraction process for sceSZ1 sample. The firstly
destroyed bond in the extracted samples of low pressure group is the W-Ocorner-W.
This bond was never observed for calcined samples. Thus, it is concluded that, high
pressure (450 bar) processing for the catalysts enables the material to conserve its
own structure.
7.1.1.2.4. DRIFTS Results
Drifts analysis carried out by comparing the results of pyridine adsorbed
samples and the catalysis itself. The results are shown in Figure 30. As shown in this
figure, the extracted samples do not show considerable peaks of acidic sites.
However, peak corresponding to wave number between 1480-1500 cm-1 (for sceSZ1,
3, 4 and 6) is a sign of combined Brönsted and Lewis acid sites.
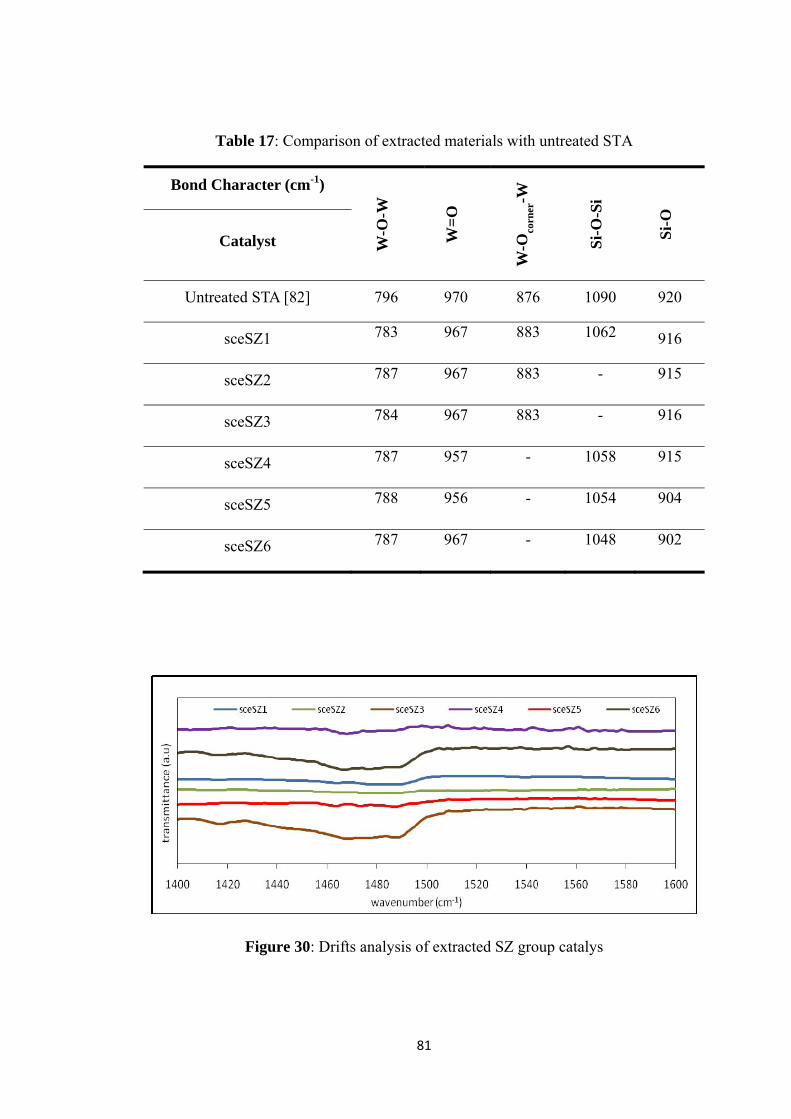
81
Table 17: Comparison of extracted materials with untreated STA
Bond Character (cm-1)
W-O
-W
W=
O
W-O
corn
er-W
Si-
O-S
i
Si-
O
Catalyst
Untreated STA [82] 796 970 876 1090 920
sceSZ1 783 967 883 1062 916
sceSZ2 787 967 883 - 915
sceSZ3 784 967 883 - 916
sceSZ4 787 957 - 1058 915
sceSZ5 788 956 - 1054 904
sceSZ6 787 967 - 1048 902
Figure 30: Drifts analysis of extracted SZ group catalys
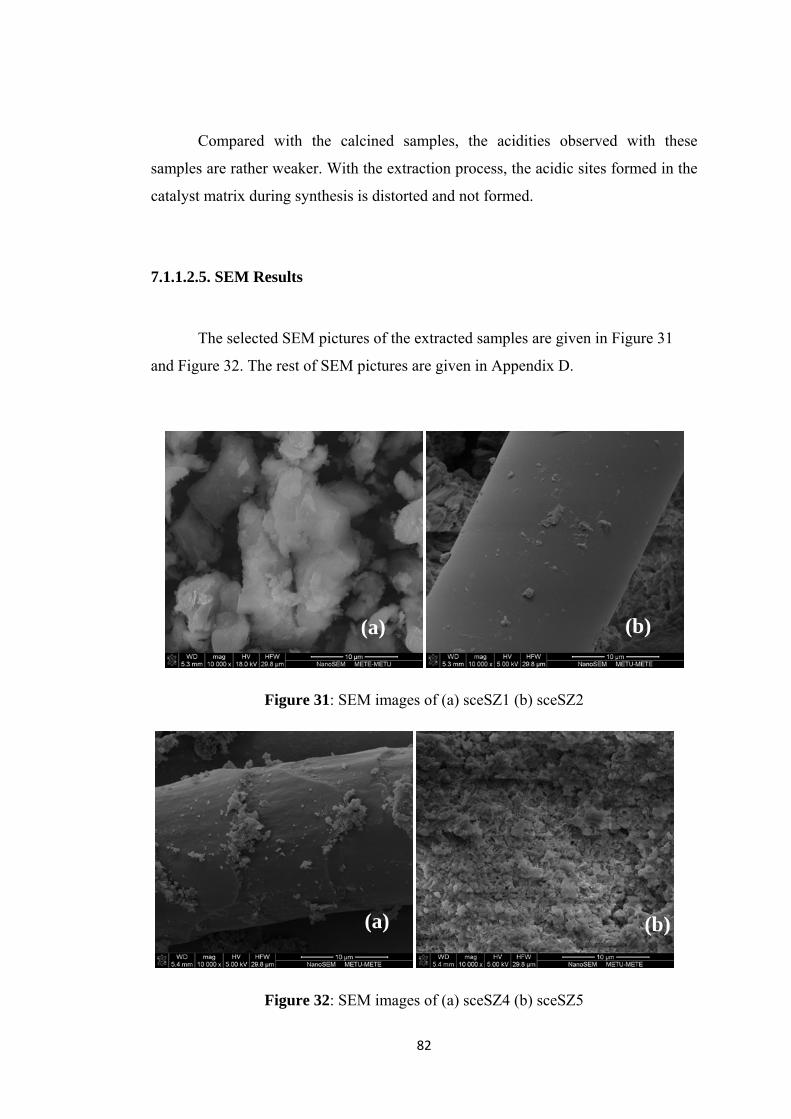
82
Compared with the calcined samples, the acidities observed with these
samples are rather weaker. With the extraction process, the acidic sites formed in the
catalyst matrix during synthesis is distorted and not formed.
7.1.1.2.5. SEM Results
The selected SEM pictures of the extracted samples are given in Figure 31
and Figure 32. The rest of SEM pictures are given in Appendix D.
Figure 31: SEM images of (a) sceSZ1 (b) sceSZ2
Figure 32: SEM images of (a) sceSZ4 (b) sceSZ5
(a) (b)
(a) (b)

83
All the pictures are in magnification of 10000 times. Depending on the
extraction conditions applied and W/Si and Zr/Si ratios, the morphologies differ.
There exist cylindrical structures in SEM pictures of sceSZ2 and sceSZ4, whereas
sceSZ1 and sceSZ5 are well-dispersed.
7.1.1.3. Comparison of Extraction and Calcination Processes through
Characterization Results of SZ1 and SZ2 Catalysts
In this section, the effect of extraction process is investigated by comparing
the properties of selected catalysts; namely SZ1 and SZ2; with W/Si=0.4 and
Zr/Si=0.24 and 0.18 accordingly. In comparison the results of characterizations of X-
Ray Diffraction, N2 Physisorption, EDS, FT-IR and SEM tests are used. The selected
ones are compared with characterizations of untreated STA.
7.1.1.3.1. XRD Results
The comparison of XRD results are made for SZ catalysts as well as for
untreated STA [24] sample in Figure 33.
Figure 33: XRD pattern of SZ1 catalysts compared with untreated STA
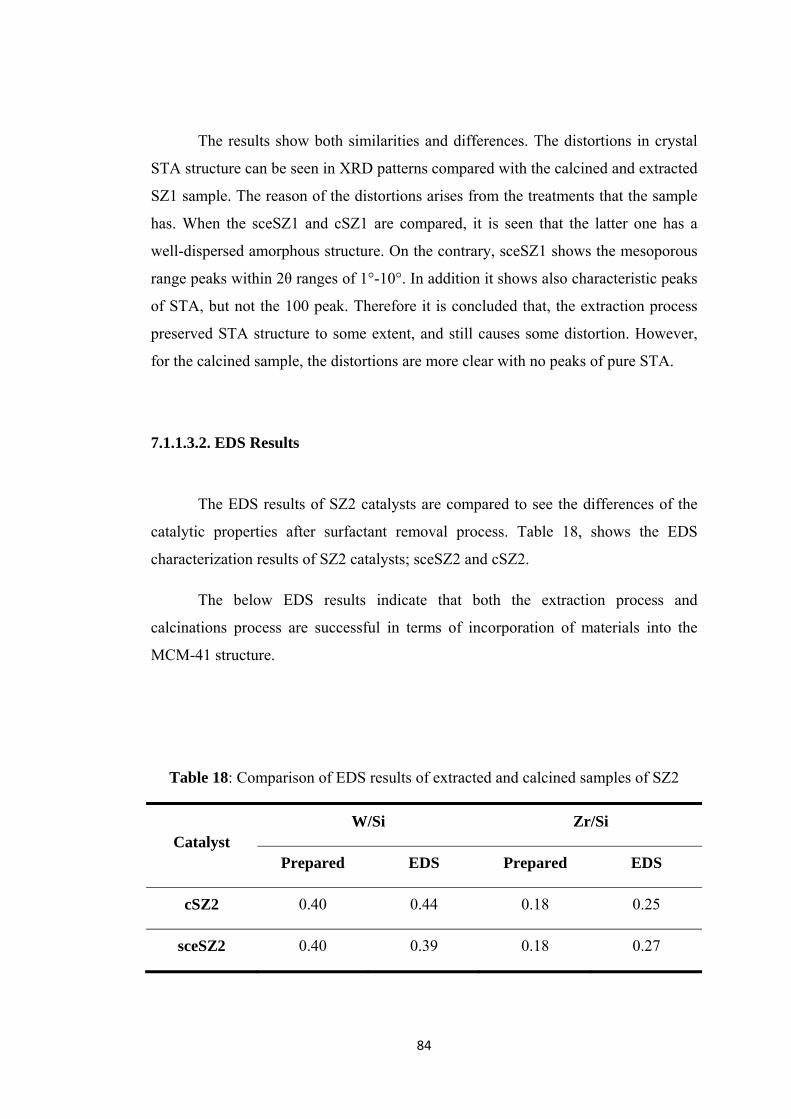
84
The results show both similarities and differences. The distortions in crystal
STA structure can be seen in XRD patterns compared with the calcined and extracted
SZ1 sample. The reason of the distortions arises from the treatments that the sample
has. When the sceSZ1 and cSZ1 are compared, it is seen that the latter one has a
well-dispersed amorphous structure. On the contrary, sceSZ1 shows the mesoporous
range peaks within 2θ ranges of 1°-10°. In addition it shows also characteristic peaks
of STA, but not the 100 peak. Therefore it is concluded that, the extraction process
preserved STA structure to some extent, and still causes some distortion. However,
for the calcined sample, the distortions are more clear with no peaks of pure STA.
7.1.1.3.2. EDS Results
The EDS results of SZ2 catalysts are compared to see the differences of the
catalytic properties after surfactant removal process. Table 18, shows the EDS
characterization results of SZ2 catalysts; sceSZ2 and cSZ2.
The below EDS results indicate that both the extraction process and
calcinations process are successful in terms of incorporation of materials into the
MCM-41 structure.
Table 18: Comparison of EDS results of extracted and calcined samples of SZ2
Catalyst W/Si Zr/Si
Prepared EDS Prepared EDS
cSZ2 0.40 0.44 0.18 0.25
sceSZ2 0.40 0.39 0.18 0.27
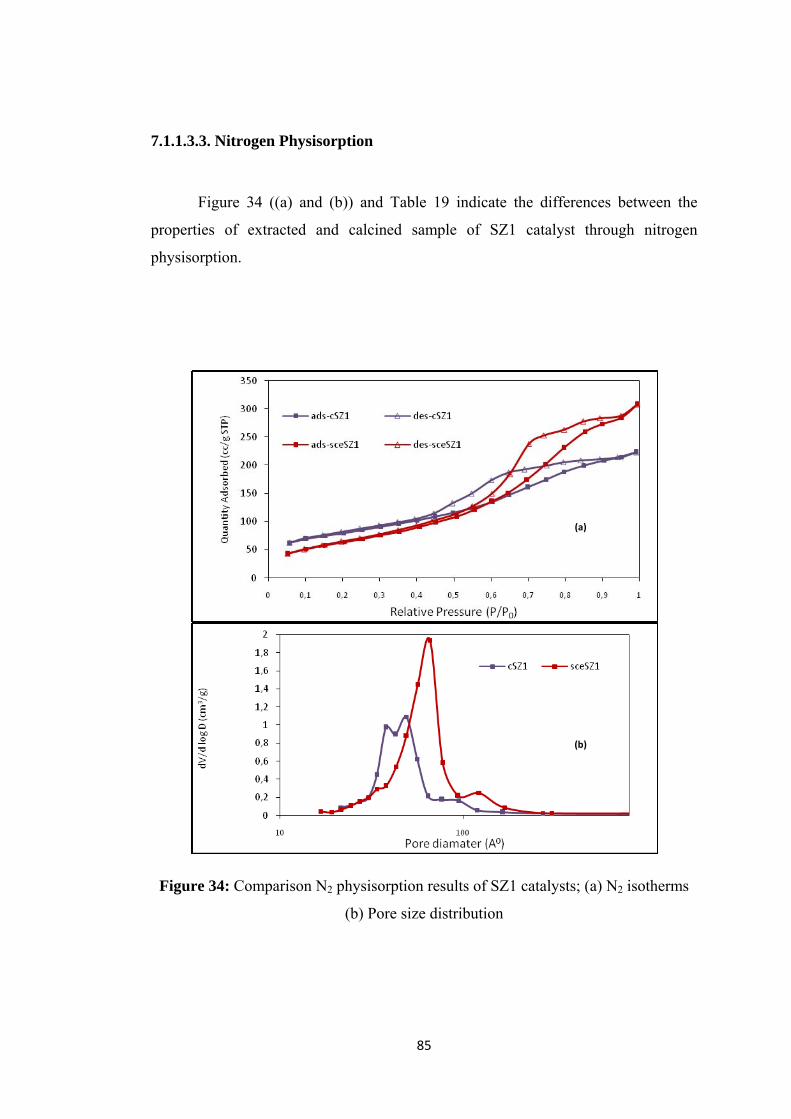
85
7.1.1.3.3. Nitrogen Physisorption
Figure 34 ((a) and (b)) and Table 19 indicate the differences between the
properties of extracted and calcined sample of SZ1 catalyst through nitrogen
physisorption.
Figure 34: Comparison N2 physisorption results of SZ1 catalysts; (a) N2 isotherms
(b) Pore size distribution
(b)
(a)
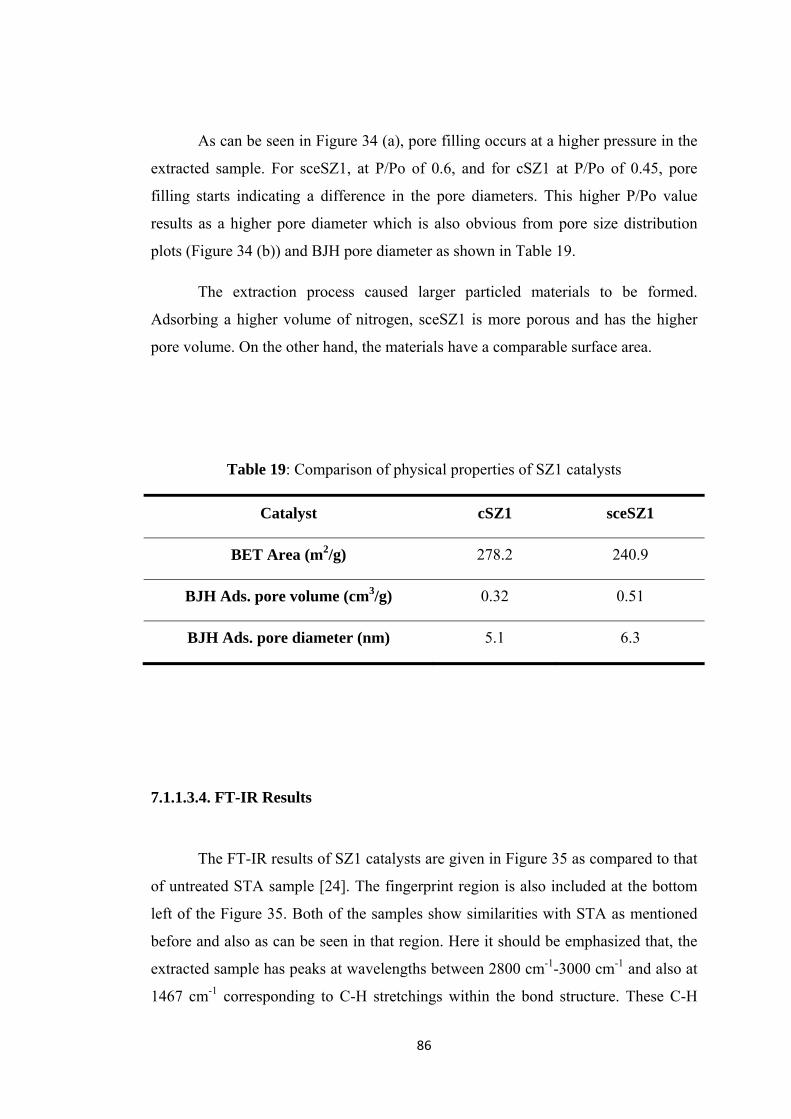
86
As can be seen in Figure 34 (a), pore filling occurs at a higher pressure in the
extracted sample. For sceSZ1, at P/Po of 0.6, and for cSZ1 at P/Po of 0.45, pore
filling starts indicating a difference in the pore diameters. This higher P/Po value
results as a higher pore diameter which is also obvious from pore size distribution
plots (Figure 34 (b)) and BJH pore diameter as shown in Table 19.
The extraction process caused larger particled materials to be formed.
Adsorbing a higher volume of nitrogen, sceSZ1 is more porous and has the higher
pore volume. On the other hand, the materials have a comparable surface area.
Table 19: Comparison of physical properties of SZ1 catalysts
Catalyst cSZ1 sceSZ1
BET Area (m2/g) 278.2 240.9
BJH Ads. pore volume (cm3/g) 0.32 0.51
BJH Ads. pore diameter (nm) 5.1 6.3
7.1.1.3.4. FT-IR Results
The FT-IR results of SZ1 catalysts are given in Figure 35 as compared to that
of untreated STA sample [24]. The fingerprint region is also included at the bottom
left of the Figure 35. Both of the samples show similarities with STA as mentioned
before and also as can be seen in that region. Here it should be emphasized that, the
extracted sample has peaks at wavelengths between 2800 cm-1-3000 cm-1 and also at
1467 cm-1 corresponding to C-H stretchings within the bond structure. These C-H

87
bonds come from the surfactant CTMABr which has the similar bond characteristics.
Showing properties of the surfactant, it is concluded that, the extracted sample has
still some surfactant in the structure. Therefore, it is important to enhance the
extraction process in terms of removing all of the surfactant from it. These can be
done by determination of optimum extraction conditions for the corresponding
samples; namely by changing pressure, temperature or extraction period.
Figure 35: Comparison of FT-IR characteristics of SZ1 catalysis
7.1.1.3.5. SEM Results
SEM pictures of SZ2 catalysts are given in Figure 36. The morphological
differences are obvious in the images. There are cylindrical structures within sceSZ2,
on the other hand even at higher magnifications; the calcined sample is well-
distributed through catalyst matrix.
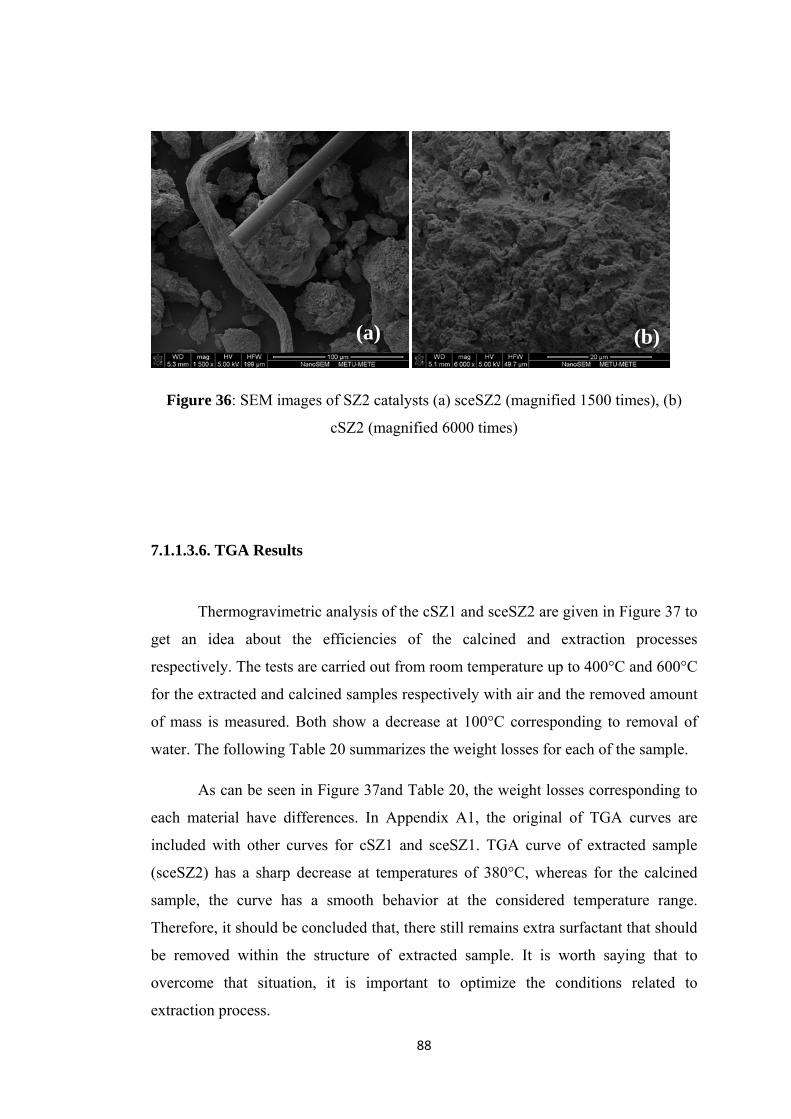
88
Figure 36: SEM images of SZ2 catalysts (a) sceSZ2 (magnified 1500 times), (b)
cSZ2 (magnified 6000 times)
7.1.1.3.6. TGA Results
Thermogravimetric analysis of the cSZ1 and sceSZ2 are given in Figure 37 to
get an idea about the efficiencies of the calcined and extraction processes
respectively. The tests are carried out from room temperature up to 400°C and 600°C
for the extracted and calcined samples respectively with air and the removed amount
of mass is measured. Both show a decrease at 100°C corresponding to removal of
water. The following Table 20 summarizes the weight losses for each of the sample.
As can be seen in Figure 37and Table 20, the weight losses corresponding to
each material have differences. In Appendix A1, the original of TGA curves are
included with other curves for cSZ1 and sceSZ1. TGA curve of extracted sample
(sceSZ2) has a sharp decrease at temperatures of 380°C, whereas for the calcined
sample, the curve has a smooth behavior at the considered temperature range.
Therefore, it should be concluded that, there still remains extra surfactant that should
be removed within the structure of extracted sample. It is worth saying that to
overcome that situation, it is important to optimize the conditions related to
extraction process.
(a) (b)
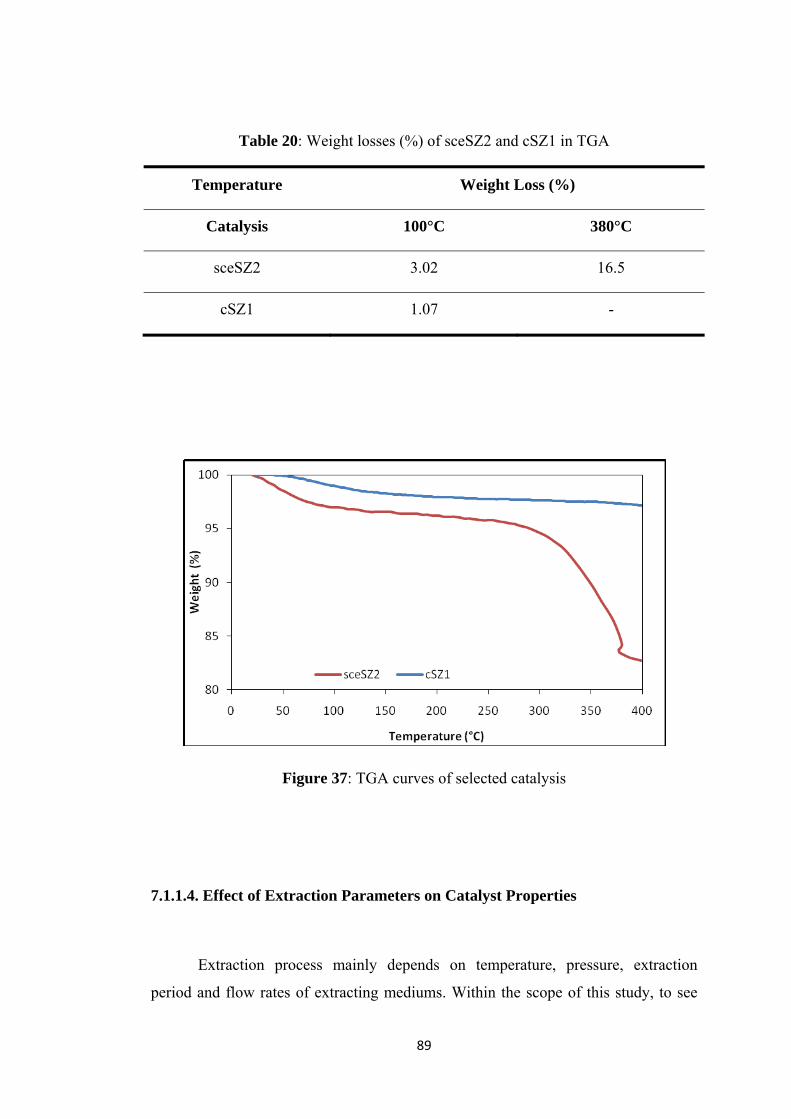
89
Table 20: Weight losses (%) of sceSZ2 and cSZ1 in TGA
Temperature Weight Loss (%)
Catalysis 100°C 380°C
sceSZ2 3.02 16.5
cSZ1 1.07 -
Figure 37: TGA curves of selected catalysis
7.1.1.4. Effect of Extraction Parameters on Catalyst Properties
Extraction process mainly depends on temperature, pressure, extraction
period and flow rates of extracting mediums. Within the scope of this study, to see
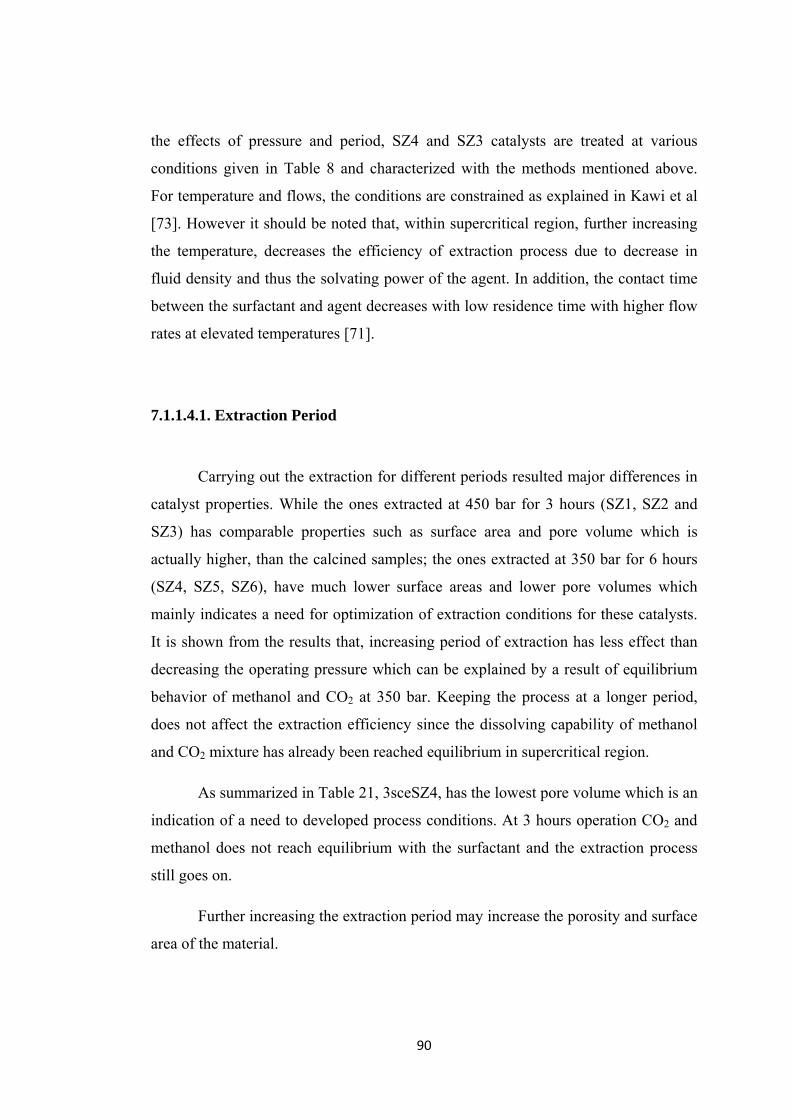
90
the effects of pressure and period, SZ4 and SZ3 catalysts are treated at various
conditions given in Table 8 and characterized with the methods mentioned above.
For temperature and flows, the conditions are constrained as explained in Kawi et al
[73]. However it should be noted that, within supercritical region, further increasing
the temperature, decreases the efficiency of extraction process due to decrease in
fluid density and thus the solvating power of the agent. In addition, the contact time
between the surfactant and agent decreases with low residence time with higher flow
rates at elevated temperatures [71].
7.1.1.4.1. Extraction Period
Carrying out the extraction for different periods resulted major differences in
catalyst properties. While the ones extracted at 450 bar for 3 hours (SZ1, SZ2 and
SZ3) has comparable properties such as surface area and pore volume which is
actually higher, than the calcined samples; the ones extracted at 350 bar for 6 hours
(SZ4, SZ5, SZ6), have much lower surface areas and lower pore volumes which
mainly indicates a need for optimization of extraction conditions for these catalysts.
It is shown from the results that, increasing period of extraction has less effect than
decreasing the operating pressure which can be explained by a result of equilibrium
behavior of methanol and CO2 at 350 bar. Keeping the process at a longer period,
does not affect the extraction efficiency since the dissolving capability of methanol
and CO2 mixture has already been reached equilibrium in supercritical region.
As summarized in Table 21, 3sceSZ4, has the lowest pore volume which is an
indication of a need to developed process conditions. At 3 hours operation CO2 and
methanol does not reach equilibrium with the surfactant and the extraction process
still goes on.
Further increasing the extraction period may increase the porosity and surface
area of the material.

91
Table 21: Effect of extraction period on catalysts’ physical properties
Cat.
BET
area
(m2/g)
BJH Ads.
pore volume
(cm3/g)
BJH Des.
pore
volume
(cm3/g)
BJH Des. pore
diameter (nm)
Micropore
volume
(cm3/g)
sceSZ4* 167.8 0.61 0.6 12.1 0.08
3sceSZ4* 117.8 0.11 0.11 11.5 -
cSZ4 246.9 0.77 0.77 12.5 0.12
*Extraction pressure: 350 bar
Figure 38, shows pore size distributions of these catalysis. Three hours
extracted sample has considerable amount of pores in micropore region which is an
indication of low surface area and pore volume. The pore size distribution is
consistent with the calculated pore diameters in Appendix C.
Figure 38: Pore size distributions of SZ3 catalysis

92
7.1.1.4.2. Extraction Pressure
Pressure is a critical process variable for supercritical extractions. At high
pressures, density of CO2 and liquid methanol ratio increase which also improve
dissolution of surfactant in the extraction mixture and solvating ability of CO2. In
extraction processes of organic surfactant material, liquid methanol has an important
role in dissolving the surfactant and removing it from the catalyst matrix. This
condition results as an increase in extraction efficiency. On the other hand, high
pressure causes packing of the catalyst which also blocks contact between materials
[86]. These effects are seen at pressures of 300 bar, 450 bar and 600 bar which are
also supported by characterization results. Increasing the extraction pressure has a
positive effect on the physical properties of the catalysts with an optimum value of
pressure. When compared with the calcined sample; at 85°C, SZ3 catalyst has the
highest pore volume and nearest surface area at 450 bars. Carrying out the extraction
at 600 bar, does not have a major role which is a result of occurrence of blocking due
to packing of the material at high pressures. This prevents contact of both methanol
and CO2 with the catalyst matrix [86]. Figure 39 shows that extraction process has
optimum operating conditions by which the surfactant removal can be achieved with
the most effectiveness.
Therefore to remove the surfactant with the highest effiency, it is important to
decide on the operating conditions while considering the nature of the material also.
The results given in Figure 39 can also be explained by N2 isotherms of the catalysts.
Within the conditions scanned, carrying out the process at 450 bar, yielded the
highest surface area and pore volume of the catalyst sceSZ3 with the highest
extraction efficiency.
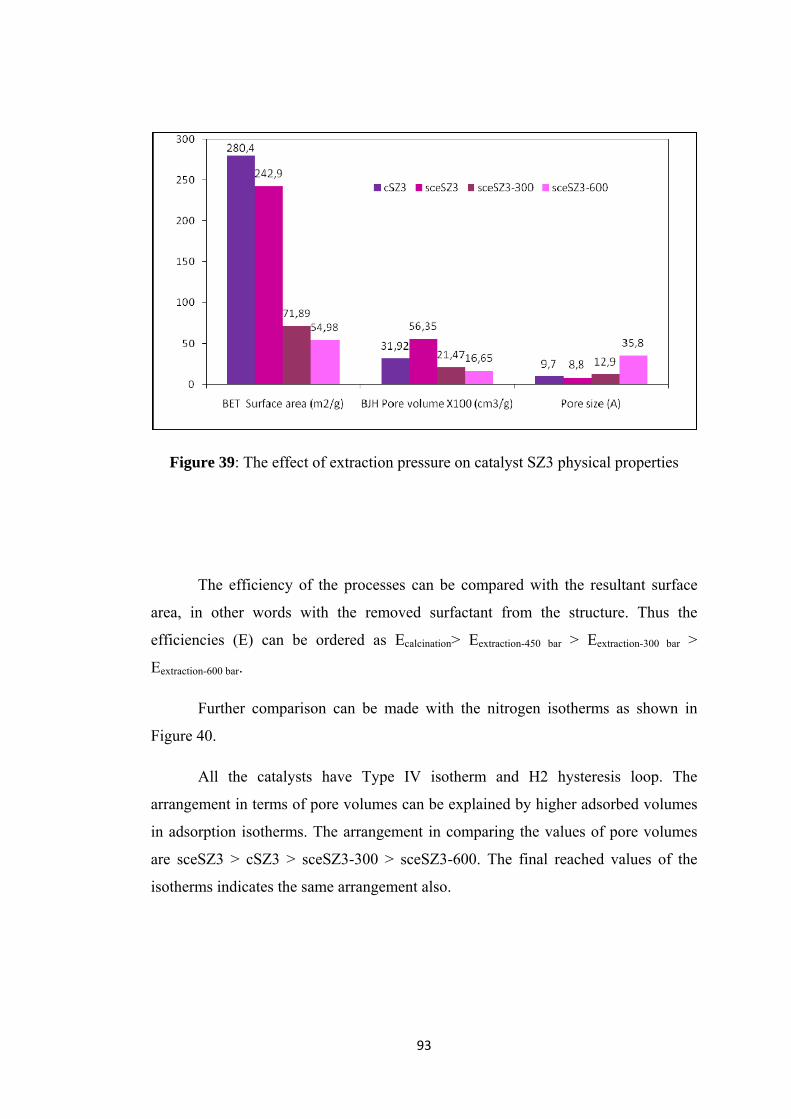
93
Figure 39: The effect of extraction pressure on catalyst SZ3 physical properties
The efficiency of the processes can be compared with the resultant surface
area, in other words with the removed surfactant from the structure. Thus the
efficiencies (E) can be ordered as Ecalcination> Eextraction-450 bar > Eextraction-300 bar >
Eextraction-600 bar.
Further comparison can be made with the nitrogen isotherms as shown in
Figure 40.
All the catalysts have Type IV isotherm and H2 hysteresis loop. The
arrangement in terms of pore volumes can be explained by higher adsorbed volumes
in adsorption isotherms. The arrangement in comparing the values of pore volumes
are sceSZ3 > cSZ3 > sceSZ3-300 > sceSZ3-600. The final reached values of the
isotherms indicates the same arrangement also.
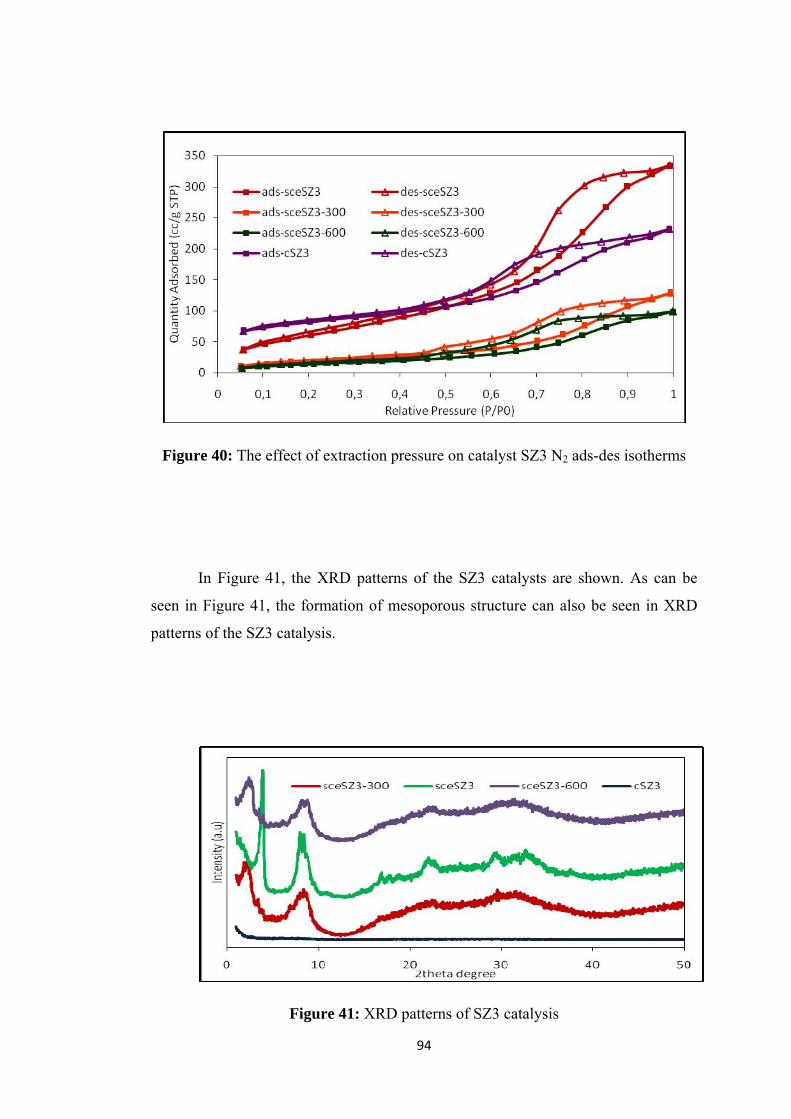
94
Figure 40: The effect of extraction pressure on catalyst SZ3 N2 ads-des isotherms
In Figure 41, the XRD patterns of the SZ3 catalysts are shown. As can be
seen in Figure 41, the formation of mesoporous structure can also be seen in XRD
patterns of the SZ3 catalysis.
Figure 41: XRD patterns of SZ3 catalysis

95
The differences between the extracted and calcined samples are mentioned
before. These XRD patterns also show the characteristic changes during extraction
process at various pressures. The extracted sample has a well-distributed structure
and does not show peaks of any structure as crystal. As explained in Section 7.1.1.2,
extracted sceSZ3 catalyst, have characteristic peaks of W20O58 (at 2θ of 23° and 32°)
[82] and ZrO2 (28°) [83] as well as with the peaks corresponding to the mesoporous
structure (at 2θ between 1-10°). However the sharpness of the peaks change with the
operating conditions of extraction. For the catalyst extracted at 300 and 600 bar, the
peaks corresponding to the W20O58 and ZrO2 structures are rather broad and cannot
be distinguished from each other.
To further analyze the, XRD patterns of the samples are drawn in low angle
in Figure 42 and compared with calcined MCM-41. As in previous comparison made
in Figure 24 for extracted samples of SZ1-3, the effect of carrying out the extraction
at different pressures, is mainly shifting the peaks of virtual MCM-41 towards right.
However, although it is expected the pore diameters to be smaller with XRD results,
the pores of these samples are larger than that of MCM-41 (Figure 39 and Table 16).
This can be attributed to differences in pore structures of the materials.
Figure 42: Low angle XRD pattern of SZ3 catalysis compared with MCM-41
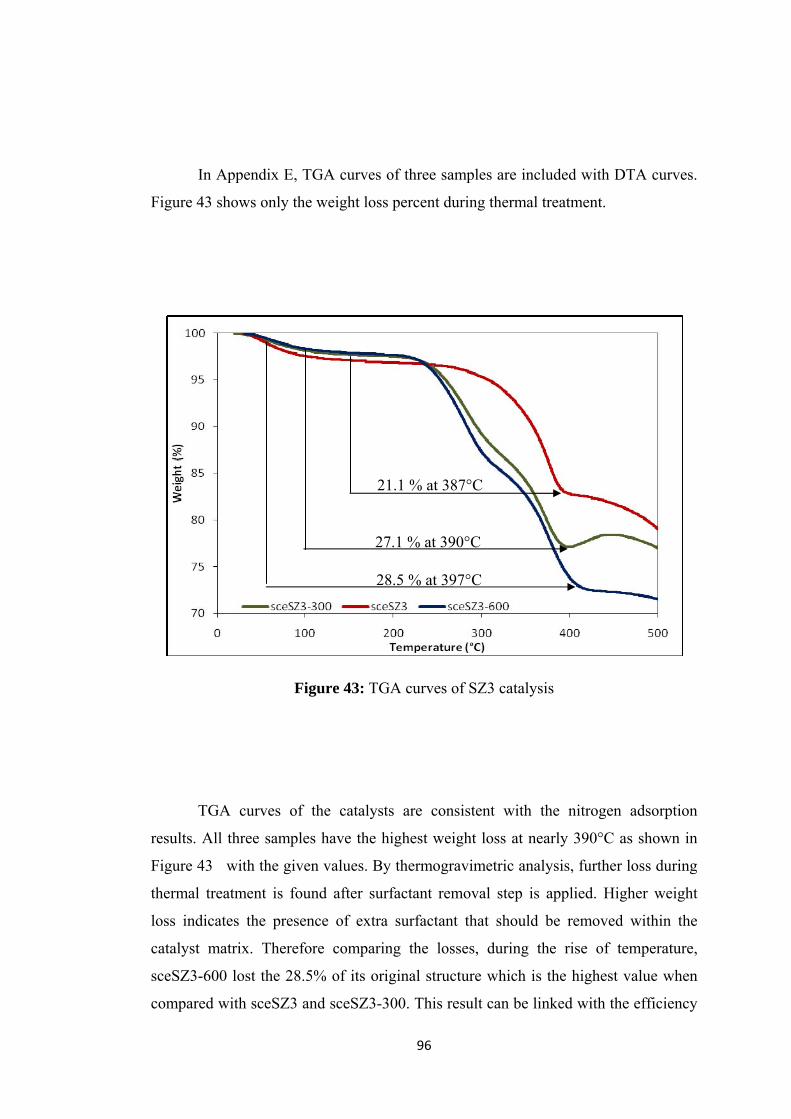
96
In Appendix E, TGA curves of three samples are included with DTA curves.
Figure 43 shows only the weight loss percent during thermal treatment.
Figure 43: TGA curves of SZ3 catalysis
TGA curves of the catalysts are consistent with the nitrogen adsorption
results. All three samples have the highest weight loss at nearly 390°C as shown in
Figure 43 with the given values. By thermogravimetric analysis, further loss during
thermal treatment is found after surfactant removal step is applied. Higher weight
loss indicates the presence of extra surfactant that should be removed within the
catalyst matrix. Therefore comparing the losses, during the rise of temperature,
sceSZ3-600 lost the 28.5% of its original structure which is the highest value when
compared with sceSZ3 and sceSZ3-300. This result can be linked with the efficiency
27.1 % at 390°C
21.1 % at 387°C
28.5 % at 397°C
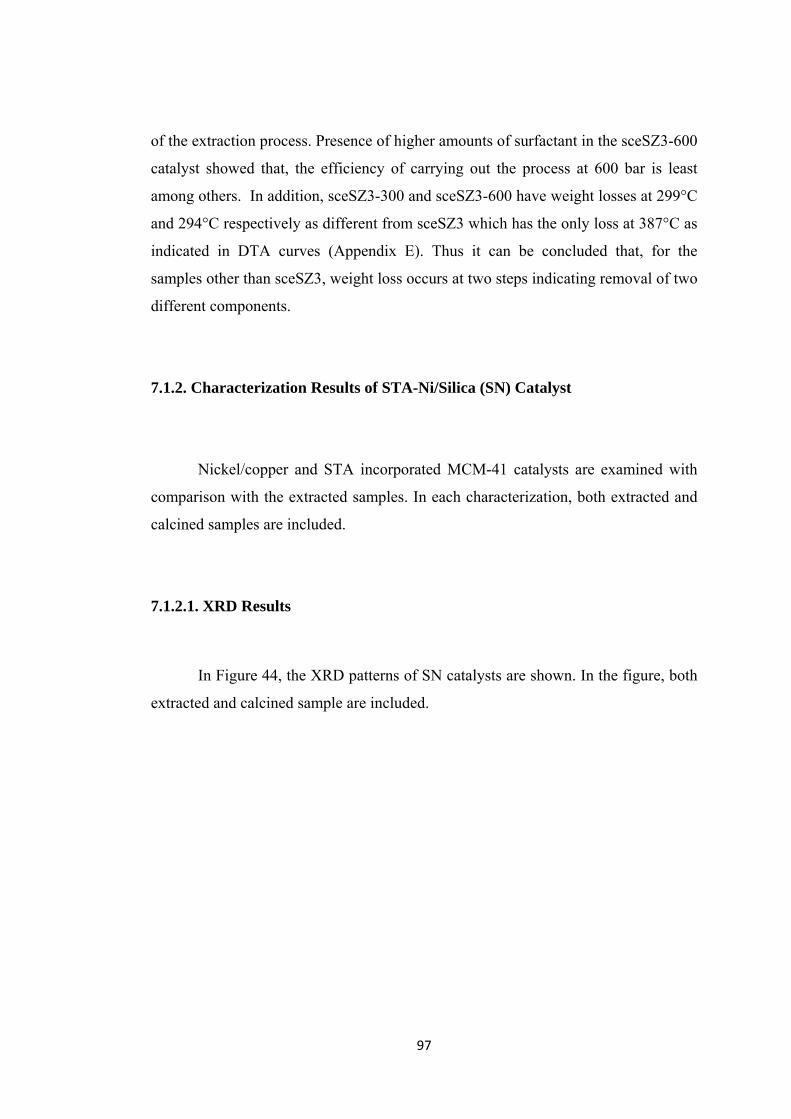
97
of the extraction process. Presence of higher amounts of surfactant in the sceSZ3-600
catalyst showed that, the efficiency of carrying out the process at 600 bar is least
among others. In addition, sceSZ3-300 and sceSZ3-600 have weight losses at 299°C
and 294°C respectively as different from sceSZ3 which has the only loss at 387°C as
indicated in DTA curves (Appendix E). Thus it can be concluded that, for the
samples other than sceSZ3, weight loss occurs at two steps indicating removal of two
different components.
7.1.2. Characterization Results of STA-Ni/Silica (SN) Catalyst
Nickel/copper and STA incorporated MCM-41 catalysts are examined with
comparison with the extracted samples. In each characterization, both extracted and
calcined samples are included.
7.1.2.1. XRD Results
In Figure 44, the XRD patterns of SN catalysts are shown. In the figure, both
extracted and calcined sample are included.
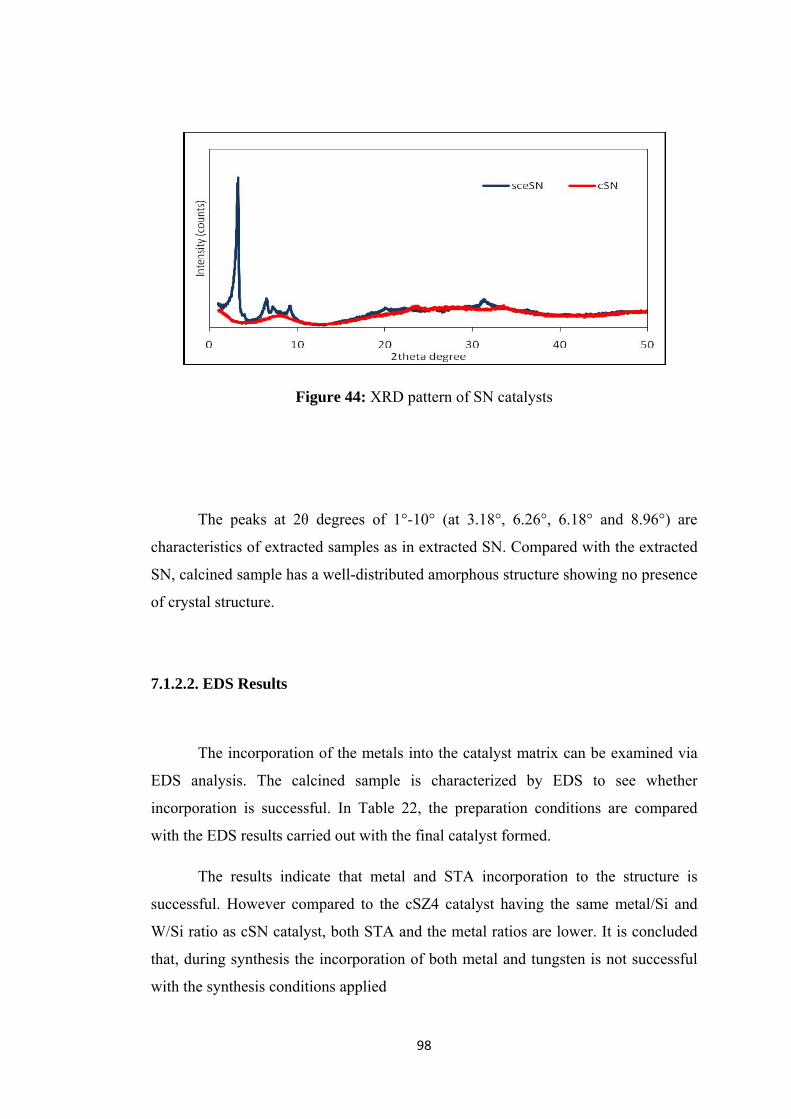
98
Figure 44: XRD pattern of SN catalysts
The peaks at 2θ degrees of 1°-10° (at 3.18°, 6.26°, 6.18° and 8.96°) are
characteristics of extracted samples as in extracted SN. Compared with the extracted
SN, calcined sample has a well-distributed amorphous structure showing no presence
of crystal structure.
7.1.2.2. EDS Results
The incorporation of the metals into the catalyst matrix can be examined via
EDS analysis. The calcined sample is characterized by EDS to see whether
incorporation is successful. In Table 22, the preparation conditions are compared
with the EDS results carried out with the final catalyst formed.
The results indicate that metal and STA incorporation to the structure is
successful. However compared to the cSZ4 catalyst having the same metal/Si and
W/Si ratio as cSN catalyst, both STA and the metal ratios are lower. It is concluded
that, during synthesis the incorporation of both metal and tungsten is not successful
with the synthesis conditions applied
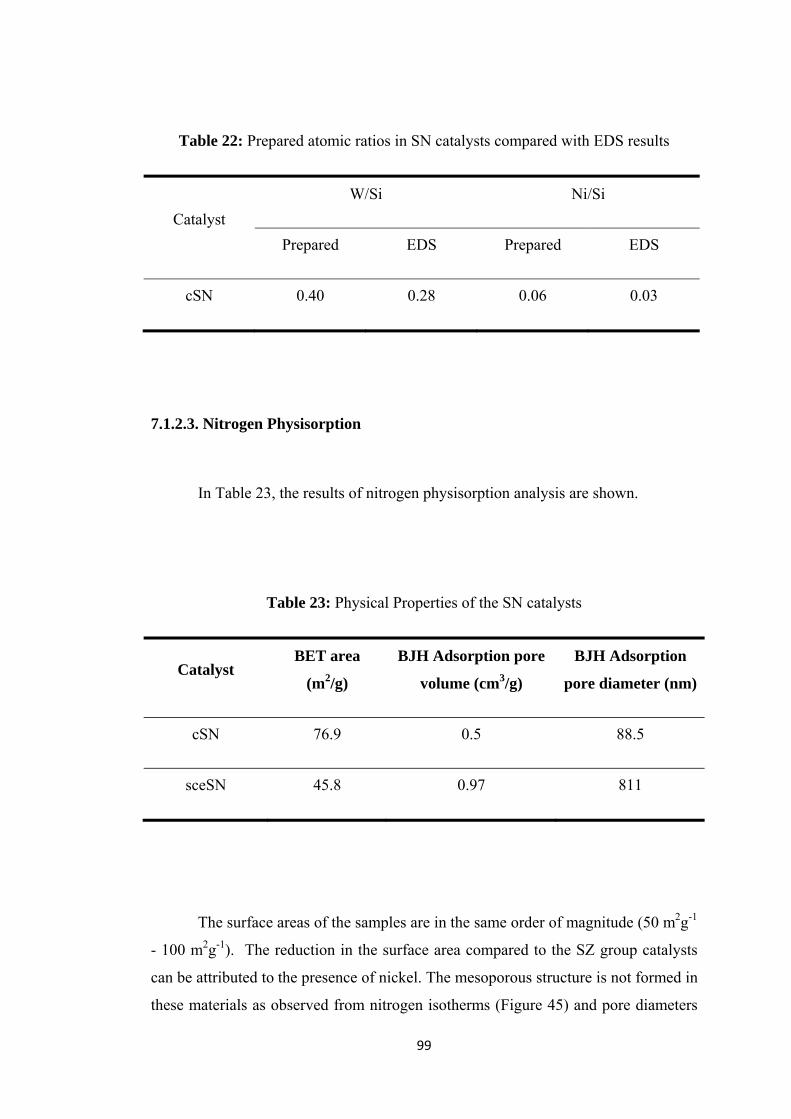
99
Table 22: Prepared atomic ratios in SN catalysts compared with EDS results
Catalyst
W/Si Ni/Si
Prepared EDS Prepared EDS
cSN 0.40 0.28 0.06 0.03
7.1.2.3. Nitrogen Physisorption
In Table 23, the results of nitrogen physisorption analysis are shown.
Table 23: Physical Properties of the SN catalysts
Catalyst BET area
(m2/g)
BJH Adsorption pore
volume (cm3/g)
BJH Adsorption
pore diameter (nm)
cSN 76.9 0.5 88.5
sceSN 45.8 0.97 811
The surface areas of the samples are in the same order of magnitude (50 m2g-1
- 100 m2g-1). The reduction in the surface area compared to the SZ group catalysts
can be attributed to the presence of nickel. The mesoporous structure is not formed in
these materials as observed from nitrogen isotherms (Figure 45) and pore diameters
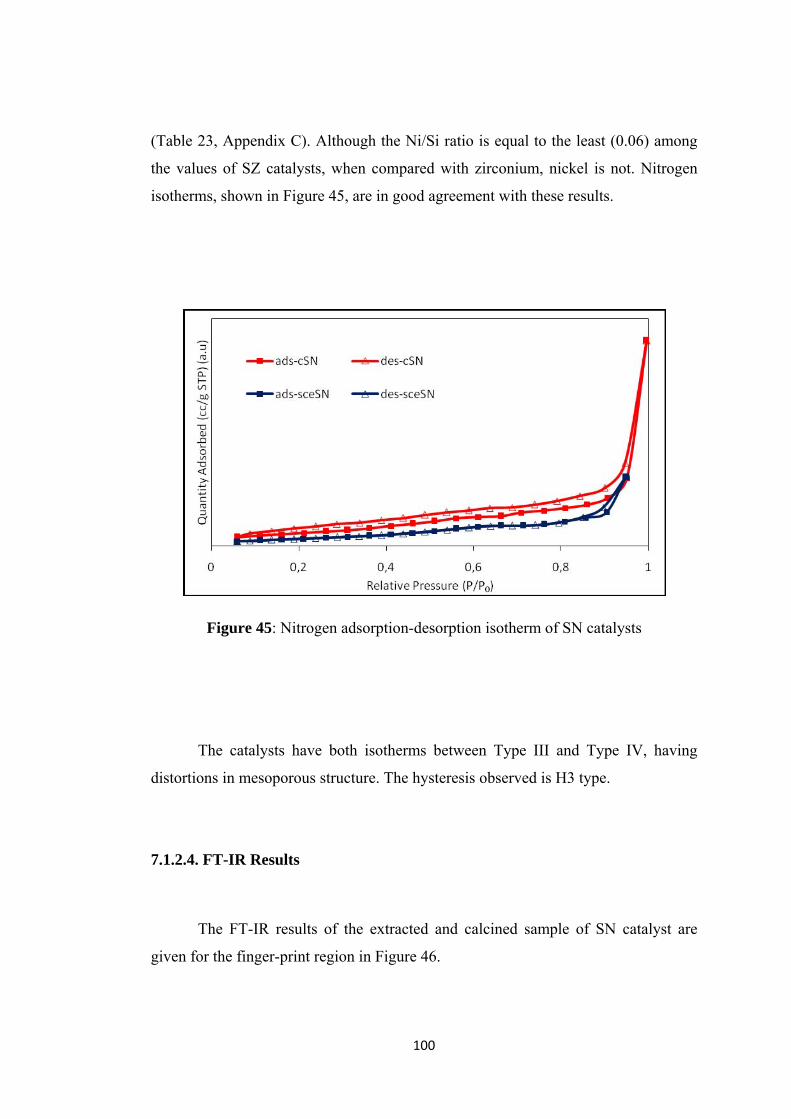
100
(Table 23, Appendix C). Although the Ni/Si ratio is equal to the least (0.06) among
the values of SZ catalysts, when compared with zirconium, nickel is not. Nitrogen
isotherms, shown in Figure 45, are in good agreement with these results.
Figure 45: Nitrogen adsorption-desorption isotherm of SN catalysts
The catalysts have both isotherms between Type III and Type IV, having
distortions in mesoporous structure. The hysteresis observed is H3 type.
7.1.2.4. FT-IR Results
The FT-IR results of the extracted and calcined sample of SN catalyst are
given for the finger-print region in Figure 46.

101
Figure 46: FT-IR results of SN samples
The SN catalysts also show characteristic peaks of STA structure. Compared
to the SZ group catalysts, sceSN catalysts have one distinct peak other than other
catalysts at wavelength of 716 cm-1 which corresponds to symmetric stretchings in
the structure of NiO2 (defined as 745 ±30 cm-1) [87]. In addition to this, the peaks
corresponding to asymmetrical stretchings coincide with Si-O bonds at 951 cm-1.
7.1.2.5. SEM Results
The selected SEM pictures of SN samples are given in Figure 47. The
differences in the resulting morphologies are clear in the pictures (with magnification
of 20000 times). Both samples have spherical structures in the presented pictures.
However the diameter of spheres is larger for the extracted sample indicating a larger
pores which is consistent with the nitrogen physisorption results given in Table 23.

102
Figure 47: SEM images of SN catalysts (a) cSN (b) sceSN
7.1.3. Characterization Results of STA-Cu/Silica (SC) Catalyst
The characterizations of extracted and calcined SC samples are given in
following section. XRD, Nitrogen physisorption, SEM, FT-IR and EDS methods are
used to characterize the materials.
7.1.3.1. XRD Results
The XRD patterns of calcined and extracted SN samples are given in Figure
48.
(a) (b)
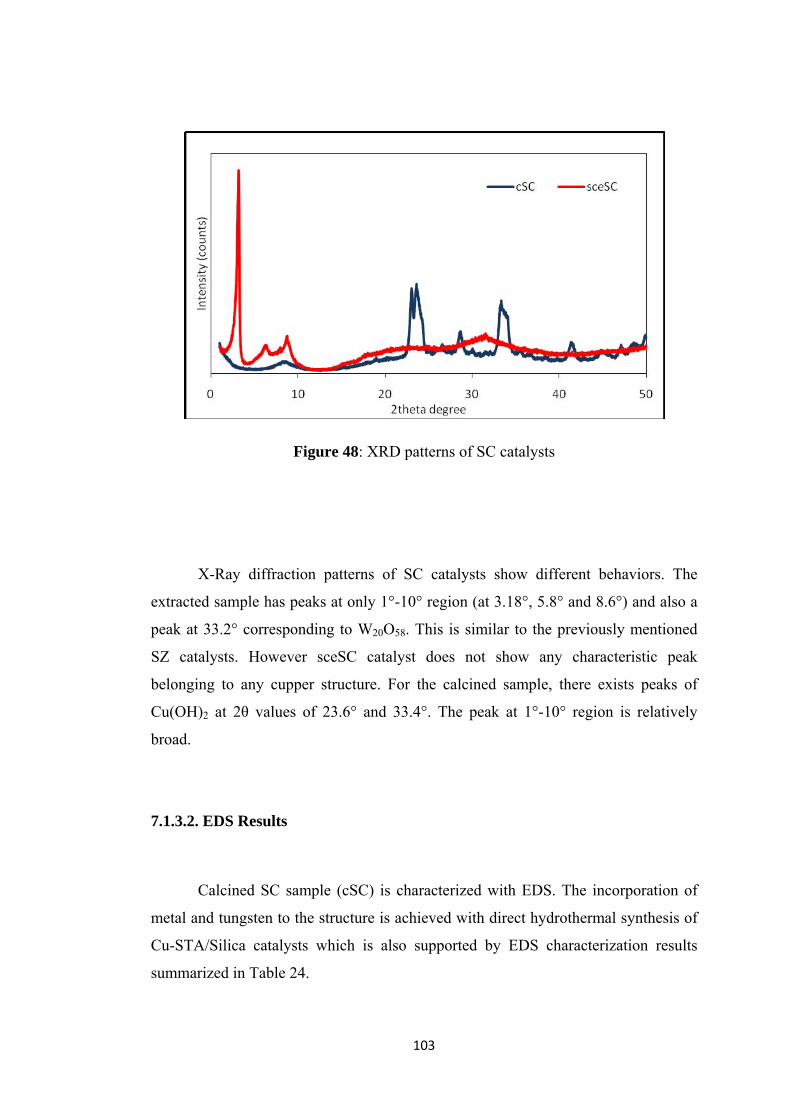
103
Figure 48: XRD patterns of SC catalysts
X-Ray diffraction patterns of SC catalysts show different behaviors. The
extracted sample has peaks at only 1°-10° region (at 3.18°, 5.8° and 8.6°) and also a
peak at 33.2° corresponding to W20O58. This is similar to the previously mentioned
SZ catalysts. However sceSC catalyst does not show any characteristic peak
belonging to any cupper structure. For the calcined sample, there exists peaks of
Cu(OH)2 at 2θ values of 23.6° and 33.4°. The peak at 1°-10° region is relatively
broad.
7.1.3.2. EDS Results
Calcined SC sample (cSC) is characterized with EDS. The incorporation of
metal and tungsten to the structure is achieved with direct hydrothermal synthesis of
Cu-STA/Silica catalysts which is also supported by EDS characterization results
summarized in Table 24.
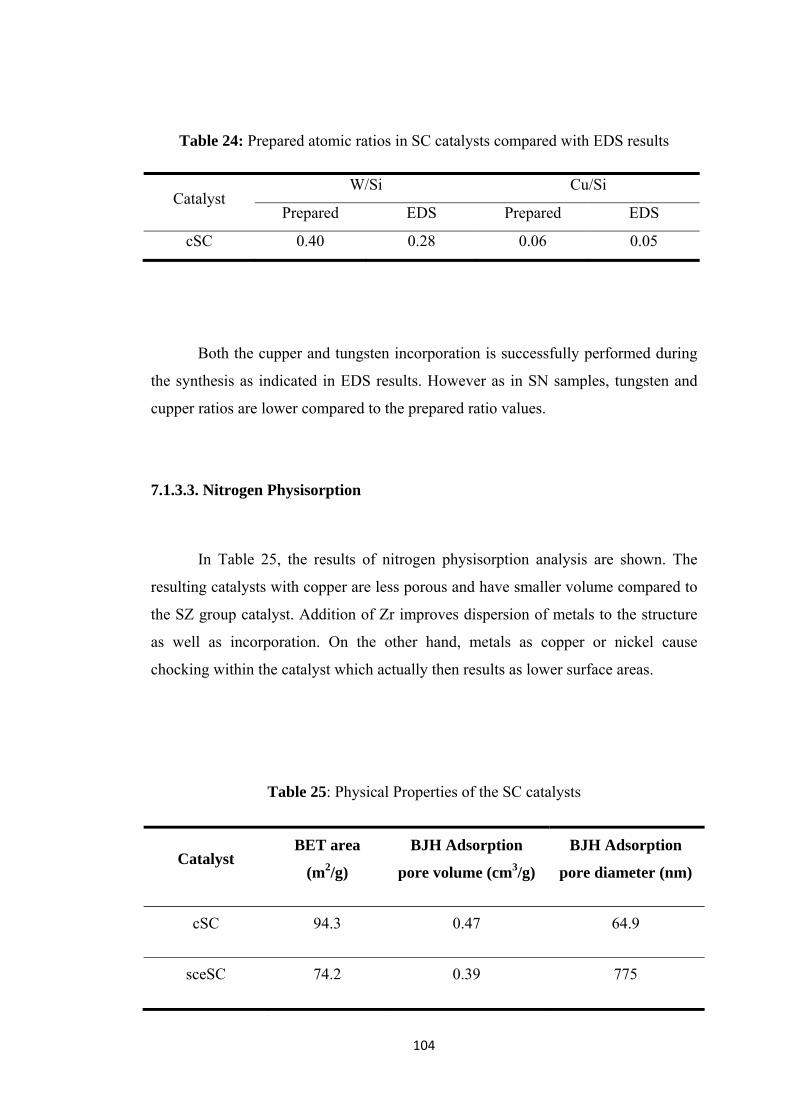
104
Table 24: Prepared atomic ratios in SC catalysts compared with EDS results
Catalyst W/Si Cu/Si
Prepared EDS Prepared EDS
cSC 0.40 0.28 0.06 0.05
Both the cupper and tungsten incorporation is successfully performed during
the synthesis as indicated in EDS results. However as in SN samples, tungsten and
cupper ratios are lower compared to the prepared ratio values.
7.1.3.3. Nitrogen Physisorption
In Table 25, the results of nitrogen physisorption analysis are shown. The
resulting catalysts with copper are less porous and have smaller volume compared to
the SZ group catalyst. Addition of Zr improves dispersion of metals to the structure
as well as incorporation. On the other hand, metals as copper or nickel cause
chocking within the catalyst which actually then results as lower surface areas.
Table 25: Physical Properties of the SC catalysts
Catalyst BET area
(m2/g)
BJH Adsorption
pore volume (cm3/g)
BJH Adsorption
pore diameter (nm)
cSC 94.3 0.47 64.9
sceSC 74.2 0.39 775
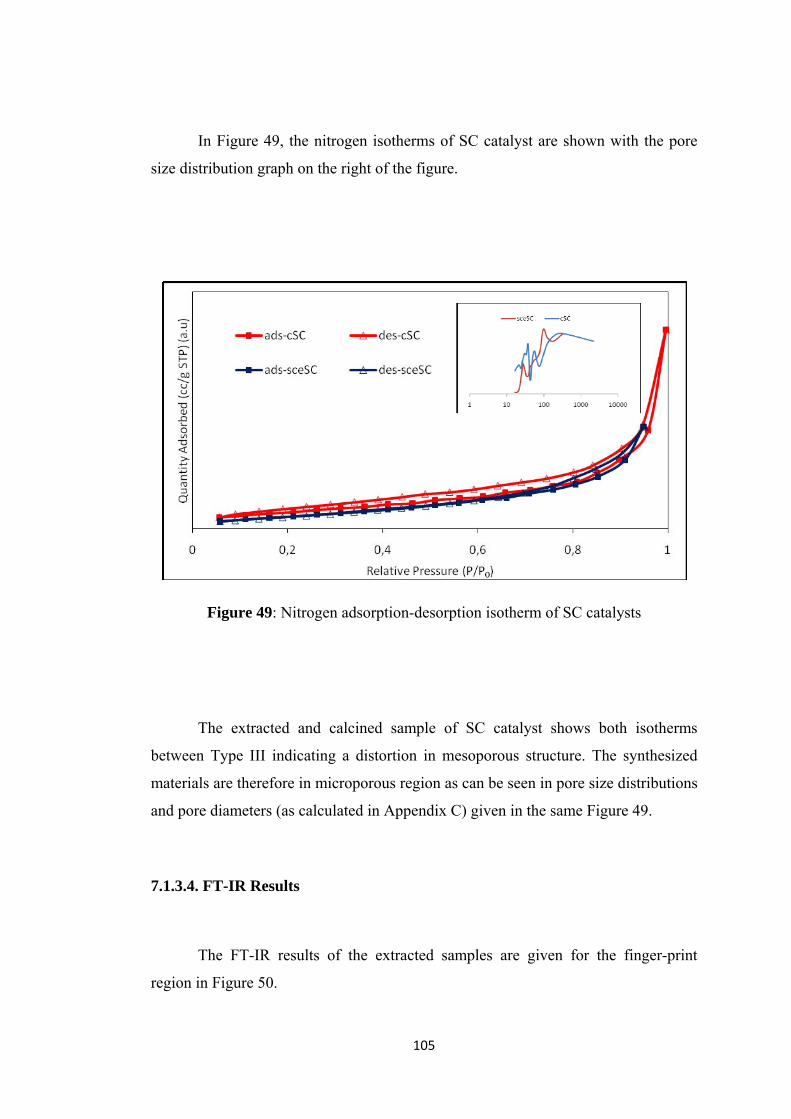
105
In Figure 49, the nitrogen isotherms of SC catalyst are shown with the pore
size distribution graph on the right of the figure.
Figure 49: Nitrogen adsorption-desorption isotherm of SC catalysts
The extracted and calcined sample of SC catalyst shows both isotherms
between Type III indicating a distortion in mesoporous structure. The synthesized
materials are therefore in microporous region as can be seen in pore size distributions
and pore diameters (as calculated in Appendix C) given in the same Figure 49.
7.1.3.4. FT-IR Results
The FT-IR results of the extracted samples are given for the finger-print
region in Figure 50.
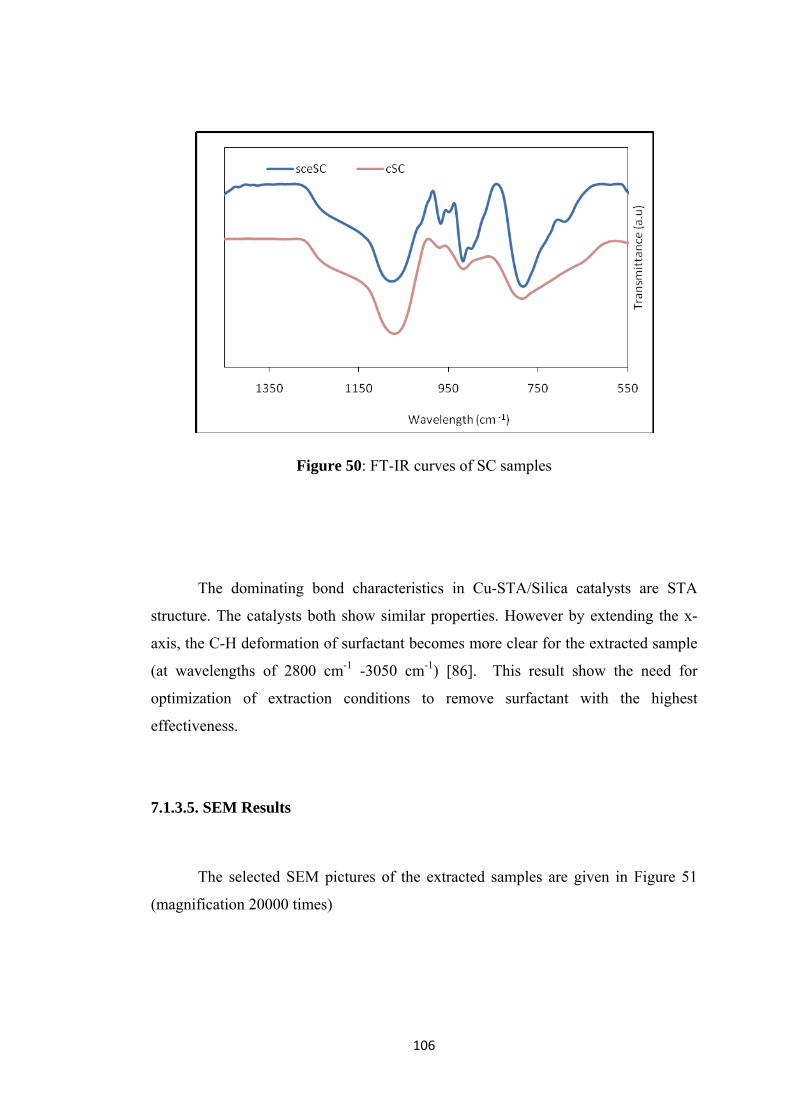
106
Figure 50: FT-IR curves of SC samples
The dominating bond characteristics in Cu-STA/Silica catalysts are STA
structure. The catalysts both show similar properties. However by extending the x-
axis, the C-H deformation of surfactant becomes more clear for the extracted sample
(at wavelengths of 2800 cm-1 -3050 cm-1) [86]. This result show the need for
optimization of extraction conditions to remove surfactant with the highest
effectiveness.
7.1.3.5. SEM Results
The selected SEM pictures of the extracted samples are given in Figure 51
(magnification 20000 times)
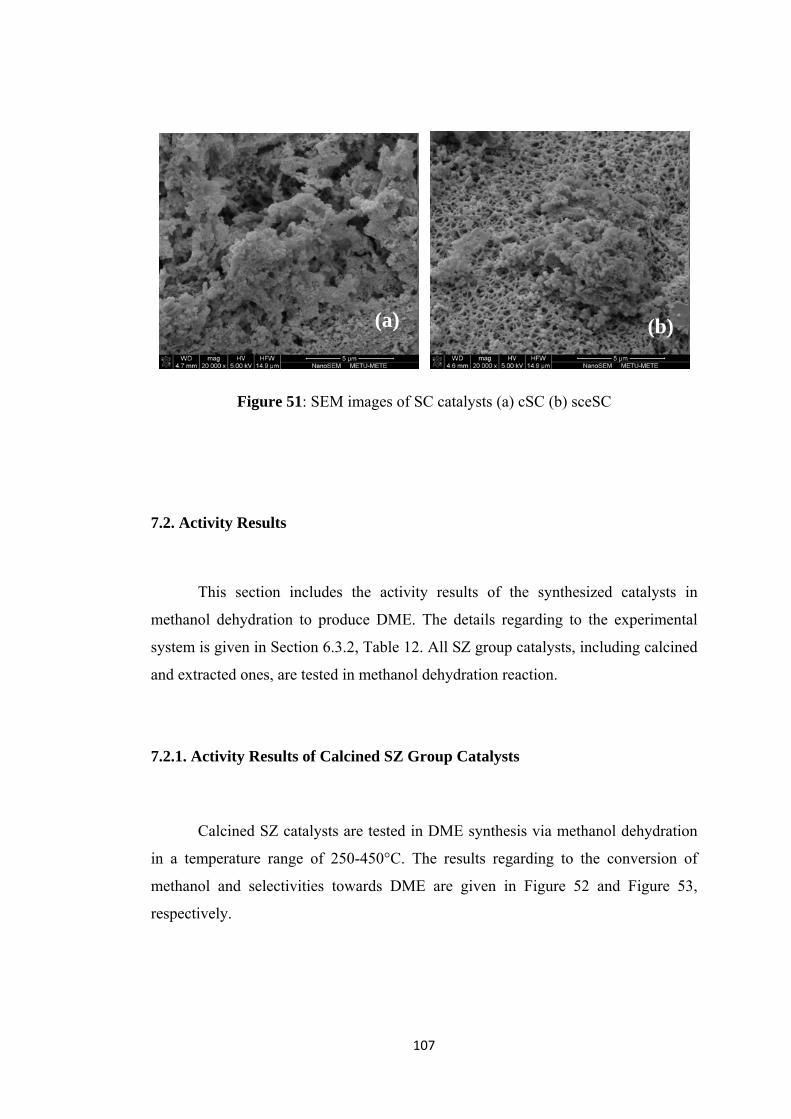
107
Figure 51: SEM images of SC catalysts (a) cSC (b) sceSC
7.2. Activity Results
This section includes the activity results of the synthesized catalysts in
methanol dehydration to produce DME. The details regarding to the experimental
system is given in Section 6.3.2, Table 12. All SZ group catalysts, including calcined
and extracted ones, are tested in methanol dehydration reaction.
7.2.1. Activity Results of Calcined SZ Group Catalysts
Calcined SZ catalysts are tested in DME synthesis via methanol dehydration
in a temperature range of 250-450°C. The results regarding to the conversion of
methanol and selectivities towards DME are given in Figure 52 and Figure 53,
respectively.
(a) (b)
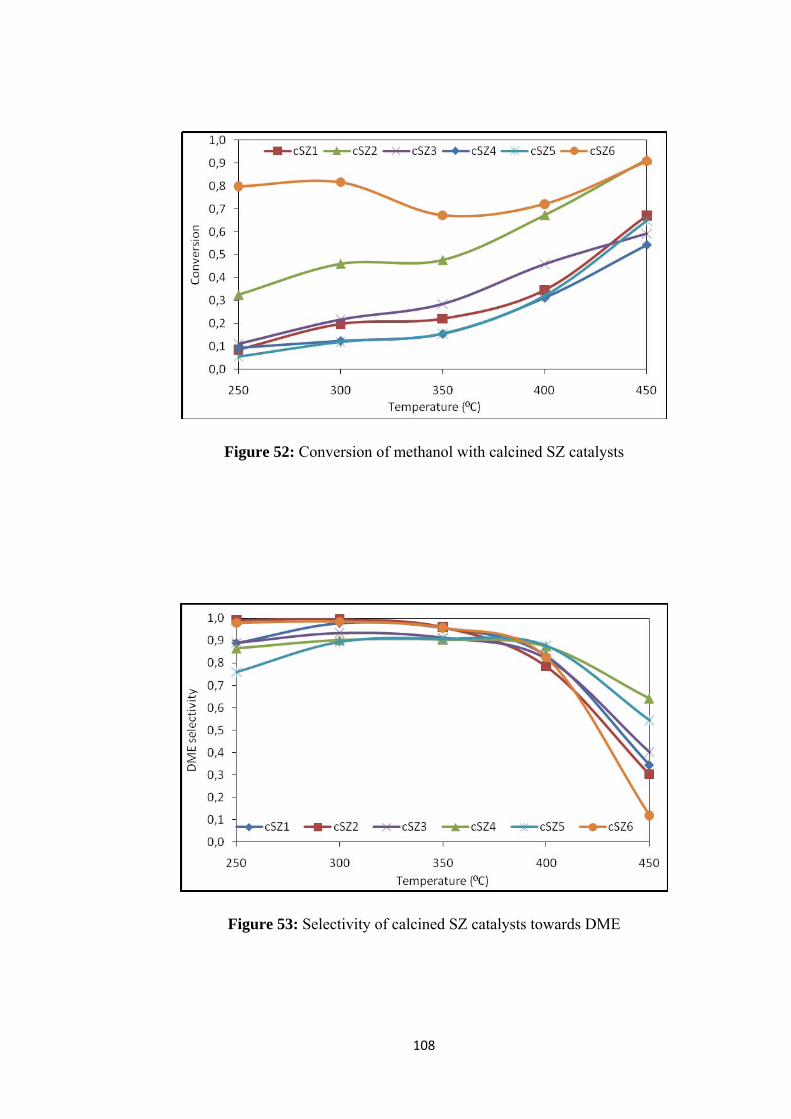
108
Figure 52: Conversion of methanol with calcined SZ catalysts
Figure 53: Selectivity of calcined SZ catalysts towards DME

109
Analyzing the results to investigate the effect of temperature, shows that
methanol conversion is directly affected with increase in temperature. However, it is
clear in Figure 53 that, DME production is not possible at higher temperatures due to
coke formation since the catalysts are calcined at 350°C, and the main product at
these ranges, is CH4 and CO, through coke formed on the surface of the catalysts. In
Figure 54, product distribution for cSZ6 catalyst is given.
Figure 54: Product distribution in presence of cSZ6 catalyst in methanol dehydration
Comparing the activities with those of non-Zr-added STA incorporated
MCM-41, reveals that, with the same W/Si ratio of 0.4, the activities observed with
SZ catalysis are lower. This is mainly due to weaker acidities. Although Zr addition
also improves the acidity of the material, the additional basic sites coming from ZrO2
blocks the active sites for methanol dehydration [89].
For other catalysis, product distribution and yields of DME are presented in
tabular form in Appendix F.1. At lower temperatures, DME formation is dominant
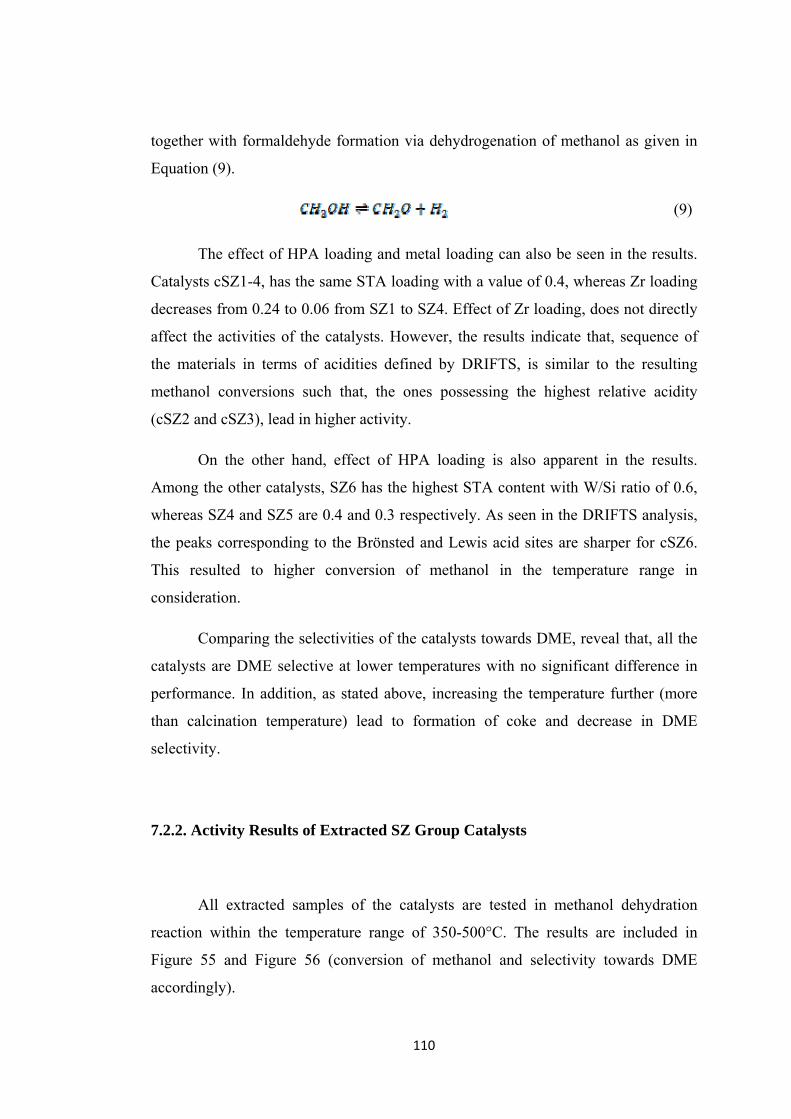
110
together with formaldehyde formation via dehydrogenation of methanol as given in
Equation (9).
(9)
The effect of HPA loading and metal loading can also be seen in the results.
Catalysts cSZ1-4, has the same STA loading with a value of 0.4, whereas Zr loading
decreases from 0.24 to 0.06 from SZ1 to SZ4. Effect of Zr loading, does not directly
affect the activities of the catalysts. However, the results indicate that, sequence of
the materials in terms of acidities defined by DRIFTS, is similar to the resulting
methanol conversions such that, the ones possessing the highest relative acidity
(cSZ2 and cSZ3), lead in higher activity.
On the other hand, effect of HPA loading is also apparent in the results.
Among the other catalysts, SZ6 has the highest STA content with W/Si ratio of 0.6,
whereas SZ4 and SZ5 are 0.4 and 0.3 respectively. As seen in the DRIFTS analysis,
the peaks corresponding to the Brönsted and Lewis acid sites are sharper for cSZ6.
This resulted to higher conversion of methanol in the temperature range in
consideration.
Comparing the selectivities of the catalysts towards DME, reveal that, all the
catalysts are DME selective at lower temperatures with no significant difference in
performance. In addition, as stated above, increasing the temperature further (more
than calcination temperature) lead to formation of coke and decrease in DME
selectivity.
7.2.2. Activity Results of Extracted SZ Group Catalysts
All extracted samples of the catalysts are tested in methanol dehydration
reaction within the temperature range of 350-500°C. The results are included in
Figure 55 and Figure 56 (conversion of methanol and selectivity towards DME
accordingly).
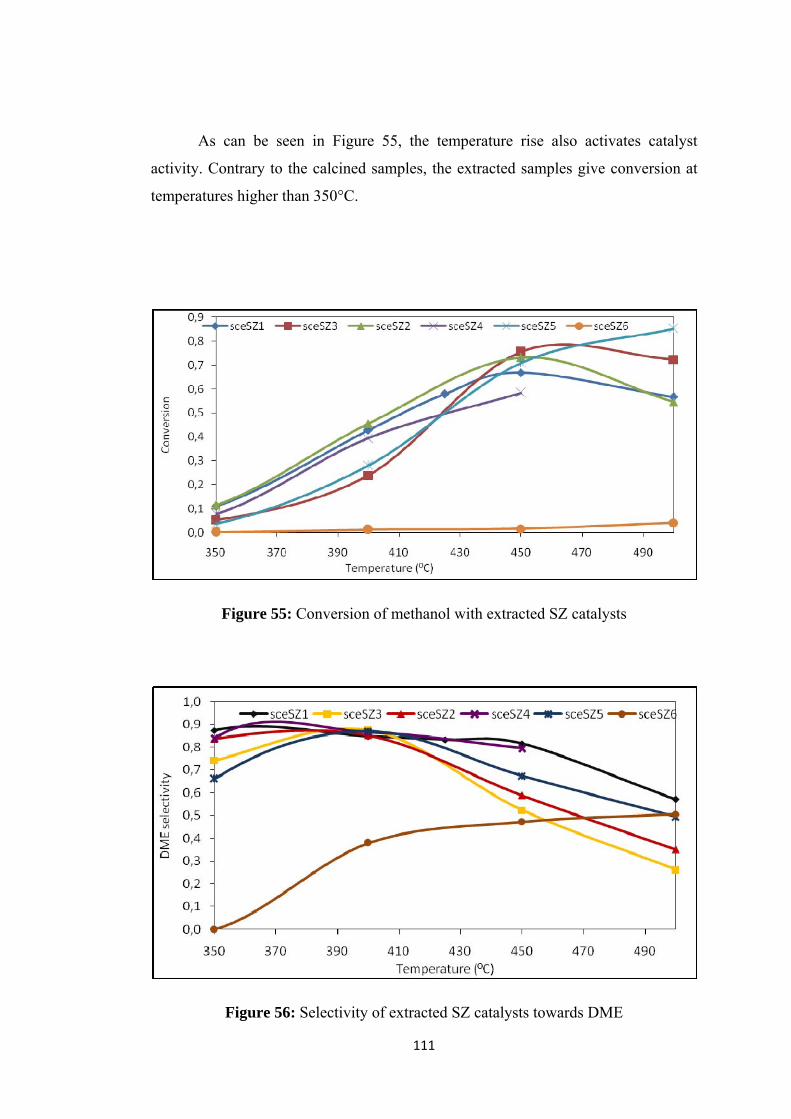
111
As can be seen in Figure 55, the temperature rise also activates catalyst
activity. Contrary to the calcined samples, the extracted samples give conversion at
temperatures higher than 350°C.
Figure 55: Conversion of methanol with extracted SZ catalysts
Figure 56: Selectivity of extracted SZ catalysts towards DME

112
Despite the fact that the normal calcination temperature is 350°C for these
catalysts, methanol conversion is still present at higher temperature resulting with a
yield of DME. This can be attributed to increased temperature resistivity with
extraction process. If these catalysts were treated with calcination, higher
temperature should have resulted lower selectivities towards DME.
The catalysts are still selective to DME at even higher temperatures.
Enhancing temperature resistivity resulted as less coke formation. In addition, at
temperatures between 350-400°C, the side product is formaldehyde, and for the rest
is methane and carbonmonoxide. The product distribution for sceSZ1 catalyst is
given in Figure 57, and the details related to the product distribution of other
catalysis are given in Appendix F.2.
Figure 57: Product distribution in presence of sceSZ1 catalyst in methanol
dehydration
The lower activity of the catalysts at lower temperatures can be based on to
the DRIFTS results. The extracted samples do not show considerable peaks of acidic

113
sites in pyridine adsorption. Among the extracted samples, sceSZ3 has the highest
acidity as given in Figure 30. However, comparing the yields of DME, of each
material show that, sceSZ1 catalyst is the leading one with a value of 0.54 at 450°C.
Increasing the temperature also increases the activities of the extracted samples
towards both DME and side products as given in Appendix F.2.

114
CHAPTER 8
CONCLUSIONS AND RECOMMENDATIONS
In this study, DME is synthesized through methanol dehydration in a fixed
bed integral reactor at atmospheric pressure at various temperatures at a constant
space time of 0.27 s.g.cm-3. DME synthesis is performed with newly prepared
materials comprising of silicotungstic acid and zirconium as the metal supported on
MCM-41 core structure by direct hydrothermal synthesis method. The surfactant
used during the synthesis is removed by calcination and supercritical fluid extraction.
The methanol and CO2 flow rate are kept constant.
SZ1-3 catalysts are treated with CO2 of 450 bar pressure for 3 hours and SZ4-
6 group is extracted at 350 bar for 6 hours. XRD patterns of the calcined group
catalysts show a well-distributed structure and the peaks belonging to W20O58 and
ZrO2 structures are observed in the catalysts in cSZ4-6. This dispersion behavior is
attributed to high content of Zr in first three catalysts. cSZ6 is synthesized with the
highest W/Si ratio with increasing the STA content against TEOS. The XRD pattern
of that material shows relatively sharp peaks corresponding to core STA structure.
On the other hand, XRD patterns of extracted samples at 450 bar (sceSZ1, sceSZ2
and sceSZ3) indicate the mesoporous structure within the catalyst. Compared with
the 350 bar extracted samples, these patterns have relatively sharp peaks of
mesoporous structure at 2θ between 1-10°. Contrary to the calcined group, the peaks
of W20O58 and ZrO2 are rather broad in this group. Therefore, it is concluded that, the
formation of both mesoporous structure and the catalytic structures are rather
disturbed at lower pressures of SFE.

115
Nitrogen physisorption analysis revealed that, the extracted materials have
comparable properties to calcined one. Especially, the ones extracted at 450 bar, has
reached surface areas of 200-240 m2.g-1 whereas the equivalent ones in calcined
group has values of 260-280 m2.g-1. The extraction performance can be discussed
with the pore volumes as well. The extracted samples have a pore volume between
0.38-0.56 cm3.g-1. On the other hand, the corresponding values are 0.26-0.32 cm3.g-1
for the calcined ones. For the extracted samples at 350 bar, 6 hours, the efficiency of
extraction process is rather low when the surface areas and pore volumes are
considered. This shows the importance of operating parameters on catalytic
properties. The nitrogen isotherms of the materials show similar behaviors in
extracted and calcined group. The main factor affecting the isotherms is the W/Si and
Metal /Si ratios within the catalyst.
The extracted and calcined samples are characterized with FT-IR. Compared
with untreated STA, it is shown that by calcination process there exists some
distortions in the structure, since not all the characteristic peaks are obtained. In the
calcined samples the W-Ocorner-W bond is not observed. On the other hand depending
on the extraction conditions, there exist similar distortions in STA structure.
It is shown by FT-IR that, although it is obvious that, surfactant removal is
carried out successfully with extraction, there still remains additional amount of
surfactant that should be removed due to presence of C-H stretching in FT-IR results.
Both extracted and calcined catalysts show similar characteristics in finger-print
region (500-1500 cm-1), at values of 2800-3000 cm-1, the peaks of C-H bonds are
present. These C-H stretching belongs to CTMABR still existing in the catalyst. In
addition, when thermogravimetric analysis is conducted with calcined SZ1 (cSZ1)
and extracted SZ2 (sceSZ2) catalysts, it is revealed that, although there exists a
weight loss in the extracted sample, sceSZ2 (with a value of 16.5% wt/wt), the
calcined sample is stable during thermal treatment between 30-400°C. This shows
that, although extraction is a promising candidate in surfactant removal, the
technique should be developed in terms of application of optimum conditions.
To test the effect of operating parameters of SFE on catalyst properties, SZ3
catalyst (with W/Si=0.4, Zr/Si=0.12) is treated at three pressures, 300-450-600 bar
116
for 3 hours. Compared with the calcined sample, which is totally amorphous, all
three extracted samples show peaks corresponding to mesoporous range and to
W20O58 and ZrO2 structures. However the one extracted at 450 bar (called sceSZ3),
has rather sharp peaks. By nitrogen physisorption, the surface areas of the materials
are ordered as cSZ3 > sceSZ3 > sceSZ3-300 bar > sceSZ3- 600 bar. The reverse
ordering is present in weight losses during thermal treatment. During thermal
treatment, the weight is lost as follows; sceSZ3 (21.1 %) < sceSZ3-300 bar (27.1 %)
< sceSZ3- 600 bar (28.5 %). Therefore it can easily be concluded that there exists an
optimum value to carry out the extraction with the highest efficiency. It is revealed
that maximum surfactant removal is reached at 450 bar with minimum weight loss
during thermal treatment. In present study, the surfactant is dissolved in methanol
and CO2 is used to carry the mixture consisting of methanol and surfactant.
In addition samples of SZ4 catalyst (with W/Si=0.4, Zr/Sİ=0.06) are extracted
at 350 bar for 3 hours and 6 hours. Keeping the process for a longer time, improved
the catalytic properties; surface area, pore size.
These SZ catalysts are tested in methanol dehydration reaction and
selectivities are monitored towards DME. The calcined samples are tested in a range
of 250-450°C whereas the extracted ones are in 350-500°C. The effect of HPA
loading and metal loading can be seen in the results of calcined samples. The
activities in methanol dehydration reaction are parallel with the DRIFTS results of
pyridine adsorbed samples. As can be seen in DRIFTS results, cSZ2 and cSZ3 are
leading in terms of acidic properties and the highest yield is obtained with cSZ2
catalyst among the others having the same W/Si ratio. On the other hand, increasing
the HPA content, also improved the catalytic activity. As the DRIFTS results
revealed, cSZ6 has the highest acid sites yielding the maximum DME with a value of
0.80. The activities of catalysts increased with rise in temperature. However in this
case, selectivity of DME is suppressed (therefore the yield is) due to formation of
side products at higher temperatures. At lower temperatures of 250°C, the selectivity
of cSZ6 and cSZ2 reached to values of 1.0. The temperatures higher than calcination
temperature of the material, lead to formation of coke.

117
The activity results of extracted samples are rather low compared with the
calcined samples which can also be concluded from DRIFTS analysis of pyridine
adsorbed samples. The main difference with the calcined materials is that, these
extracted materials have still activity at higher temperatures also with considerable
yields of DME at higher temperatures. Application of SFE, improved the temperature
resistivity of the materials. At lower temperatures, the main side product is
formaldehyde and at higher temperatures methane and carbon monoxide are formed.
The acidity of sceSZ3 is the dominant one compared to other extracted samples and
sceSZ3 is also successful in DME synthesis. The extracted sample of SZ6 (sceSZ6),
having the highest HPA content, is not as active as expected. The result can be
attributed to unsuccessful extraction process. The catalytic properties of sceSZ6 are
not also promising with low surface area (123.8 m2.g-1).
In addition to zirconium; nickel and copper are also incorporated to MCM-41
structure (with a metal/Si ratio: 0.06) with STA (W/Si= 0.04) and characterized after
calcined and extracted. Although the metal incorporations are successful, the final
properties of materials are not comparable to Zr added ones. The surface areas are
rather low (in the order of 60-90 m2g-1 for both calcined and extracted samples).
Nitrogen physisorption analysis showed that, the synthesized materials are no
mesoporous but microporous and show Type III isotherms.
To sum up, the synthesis of metal and STA incorporated MCM-41 structures
are successfully performed with calcination and by SFE. The resultant materials have
comparable physical properties. The synthesized catalysts are active in methanol
dehydration and to further improve the activity and selectivity towards DME, the
surfactant removal step, extraction, should be developed in terms of operating
conditions.
118
REFERENCES
[1] Marion J., Nsakala N., Griffin T., Bill A., ‘Controlling Power Plant CO2 Emissions: a long Range View’, ALSTOM Power Technology Center
[2] Arcoumanis, C., Bae, C., Crookes, R., Kinoshita, E., ‘The potential of di-methyl ether (DME) as an alternative fuel for compression ignition engines: A review’, 2008, Fuel, 87, 1014-1030
[3] Wikipedia the Free Encylopedia, http://en.wikipedia.org/mainpage http://en.wikipedia.org/wiki/Dimethyl_ether, Last Access Date: 01.04.2011
[4] Galvita, V. V., Semin, G. L., Belyaev, V. D., Yurieva, T. M., Sobyanin, V. A., ‘Production of hydrogen from dimethyl ether’, 2001, Applied Catalysis A, 216, 85-90.
[5] Tartamella, T., L., Lee, S., ‘Development of specialty chemicals from dimethyl ether’, 1997, Fuel Processing Technology 38, 4, 228.
[6] Jia, G. X., Ma, H. B., Tan, Y. S., Han, Y. Z., ‘Effect of particle size on the hybrid catalyst activity for slurry phase dimethyl ether synthesis’, 2005, Industrial and Engineering Chemistry Research, 44, 2011-2015.
[7] DOE topical report, ‘Liquid-phase dimethyl ether demonstration in the LaPorte Alternative Fuels Development Unit’, Cooperative Agreement No. DE-FC22-92PC90543; January, 2001.
[8] Cai, G. Y., Liu, Z. M., Shi, R. M., He, C. Q., Yang, L. X., Sun, C. L., Chang, Y. J., ‘Light alkenes from syngas via dimethyl ether’, 1995, Applied Catalysis A, 125, 29-38.
[9] Jiang, T., Liu, C. J., Rao, M. F., Yao, C. D., Fan, G. L., ‘A novel synthesis of diesel fuel additives from dimethyl ether using dielectric barrier discharges’, 2001, Fuel Processing Technology, 73, 143-152.
[10] Gas Encylopedia, http://encyclopedia.airliquide.com/encyclopedia.asp http://encyclopedia.airliquide.com/Encyclopedia.asp?GasID=80, Last Access Date, 01.09.2010
[11] Kowalewicz, A., Wojtymiak, M., ‘New alternative fuels for I.C. engines – A review’, 2004, Journal of Kones Internal Combustion Engines, 11, 358-368
[12] Ogawa, T., Inoue, N., Shikada, T., Ohno, Y., ‘Direct dimethyl ether synthesis’, 2003, Journal of Natural Gas Chemistry, 12, 219-227
[13] Dogu, T., Varisli, D., ‘Alcohols as alternatives to petroleum for environmentally clean fuels and petrochemicals’, 2007, Turkish Journal of Chemistry, 31, 551-567
119
[14] Yineg, W., Genbao, L., Wei, Z., Zhou, L., ‘Study on the application of DME/diesel blends in a diesel engine’, 2007, Fuel Processing Technology, 89, 1272-1280
[15] Semelsberger, T. A., Borup, R. L., Greene, H. L., ‘Dimethly ether (DME) as an alternative fuel, 2006, Journal of Power Source, 497-511
[16] Shu, H. K., Lee, C. S., ‘Experimental and analytical study on the spray characteristics of dimethyl ether (DME) and diesel fuels within a common-rail injection system in a diesel engine’, 2008, Fuel, 87, 925-932
[17] Park, s. H., Kim, H. J., Lee, C. S., ‘Effects of dimethyl-ether (DME) spray behavior in the cylinder on the combustion and exhaust emissions characteristics of a high speed diesel engine’, 2010, Fuel Processing Technology, 91, 504-513
[18]http://pse.che.ntu.edu.tw/ccyu/Process_Des_Project/Problem_2007/direct%20dimethyl%20ether%20synthesis.pdf, Last Access Date, 01.02.2011
[19] Preparation of Fuel Grade Dimethyl Ether, International Application Published Under the Patent Cooperation Treaty, Haldor Topsoe, 1996
[20] Lei, Z., Zou, Z., Dai, C., Li, Q., Chen, B., “Synthesis of dimethyl ether (DME) by catalytic distillation”, 2011, Chemical Engineering Science, 66, 3195-3203
[21] Stanislao, M. D., Malandrino, A., Patrini, R., Pirovana, C., Viva, A., Brunazzi, E., ‘DME synthesis via catalytic distillation: experiments and simulation’, 17th European Symposium on Computer Aided Process Engineering, 1077-1082
[22] Yoo, K. S., Kim, J. H., Park, M. J., Kim, S. J., Joo, O. S., Jung, K. D., ‘Influence of solid acid catalyst on DME production directly from synthesis gas over the admixed catalyst of Cu/ZnO/Al2O3 and various SAPO catalysts’, 2007, Applied Catalysis A: General, 330, 57-62
[23] Xu, M., Lunsford, J. H., Goodman, D. W., Bhattacharyya, D. W., ‘Synthesis of dimethyl ther (DME) from methanol over solid-acid catalysts’, 1997, Applied Catalysis A: General, 149, 289-301
[24] Varisli, D., “Kinetic Studies for Dimethyl ether and Diethyl ether Production”, Ph.D. Thesis, Middle East Technical University, Ankara, Turkey, September 2007.
[25] Vakili, R., Pourazadi, E., Setoodeh, P., Eslamloueyan, R., Rahimpour, M. R., ‘Direct dimethyl ether (DME) synthesis through a thermally coupled heat exhanger’, 2011, Applied Energy, 88, 1211-1223
[26] Naik, S. P., Ryu, T., Bui, V., Miller, J. D., Drinnan N. B., Zmierczak, W., ‘Synthesis of DME from CO2/H2 gas mixture’, 2011, Chemical Engineering Journal, 167, 362-368
[27] Qi, G. X., Zheng, X. M., Fei, J. H., Hou, Z. Y., ‘A novel catalyst for DME synthesis from CO hydrogenation 1. Activity, structure and surface properties’, 2001, Journal of Molecular Catalysis A: Chemical, 176, 195-203
120
[28] Wikipedia the Free Encylopedia, http://en.wikipedia.org/mainpage http://en.wikipedia.org/wiki/Zeolite, Last Access Date, 01.10.2010
[29] Davis, M. E., Lobo, R. F., “Zeolite and molecular sieve synthesis”, 1992, Chemistry of Materials, 4, 756-768
[30] Dogan, A. U., “Zeolite mineralogy and Cappadocian erionite”, 2003, Indoor and Built Environment, 12, 337-342
[31] Perry, R., H., “Perry’s Chemical Engineers’ Handbook”, Mc-Graw Hill, 1997
[32] Bekkum, H., Flanigen, E. M, Jansen, J. C., “Introduction to zeolite and science and practice”, Elsevier, 1991, Amsterdam
[33] Vartuli, Kresge, C. T., Roth, W. J., McCullen, S. B., J. C., Beck, J. S., Schmitt, K. D., Leonowicz, M. E, Lutner, J. D., Sheppard, E. W., “Advanced Catalysts and Nanostructured Materials”, Academic Press, 1996, New Jersey
[34] Clark, J. H., Macquarrie, D. J., Tavener, S. J., “The application of modified mesoporous silicas in liquid phase catalysis”, 2006, Dalton Transactions, 36, 4297-4309
[35] Kresge, C. T., Vartuli, J. C., Roth, W. J., Leonowicz, M. E., “The discovery of ExxonMobil’s M41S family of mesoporous molecular sieves”, 2004, Studies in Surface Science and Catalysis, 148, 53-72
[36] Ciesla, U., Schüth, F., “Ordered mesoporous materials”, 1999, Microporous and Mesoporous Materials, 27, 131-149
[37] Beck, J. S., Vartuli, J. C., Roth, W. J., Leonowicz, M. E, Kresge, C. T., Schmitt, K. D., Chu, C. T-W., Olson, D. H., Sheppard, E. W., McCullen, S. B., Higgins, J. B., Schlenker, J. L., “A new family of mesoporous molecular sieves prepared with liquid crystal templates”, 1992, Journal of American Chemical Society, 27, 10834-10843
[38] Sener, C., Dogu, T., Dogu, G., “Direct hydrothermal synthesis of palladium-incorporated silicate-structured mesoporous catalysts”, 2007, Turkish Journal of Chemistry, 31, 473-478
[39] Oye, G., Sjöblom, J., Stöcker, M., “Synthesis, characterization and potential applications of new materials in the mesoporous range”, 2001, Advances in Colloid and Interface Science, 89-90, 436-466
[40] Roth, W. J., Vartuli, J. C., “Synthesis of mesoporous molecular sieves”, 2005, Studies in Surface Science and Catalysis, 157, 91-110
[41] Sener, C., “Synthesis and characterizatıon of Pd-MCM-type mesoporous nanocomposıte materials”, M.S. Thesis, Middle East Technical University, Ankara, Turkey, January 2006. [42] Zhao, X. S., Lu, G. Q. M., Millar, G. J., “Advances in mesoporous molecular sieves”, 1996, Industrial and Engineering Chemistry Research, 35, 2075-2090
121
[43] Huo, Q., Margolese, D. I., Stucky, G. D., “Surfactant control of phases in the synthesis of mesoporous silica based materials”, 1996, Chemistry of Materials, 8, 1147-1160
[44] Romanow, S. G., Sotomayor-Torres, C. M., “Three dimensional lattices of nanostructures: The template approach”, 2000, Handbook of Nanostructured Materials and Nanotechnology, 4, 231-323, Academic Press, San Diego
[45] MCM41 and catalyst preparation
[46] Vartuli, J. C., Shih, S. S., Kresge, C. T., Beck, J. S., “Potential applications of M41S type mesoporous molecular sieves”, 1998, Mesoporous Molecular Sieves, 117, 13-21
[47] Corma, A., “From microporous to mesoporous molecular sieve materials and their use in catalysis”, 1997, Chemical Reviews, 97, 2373-2419
[48] Kozhevnikov, I. V., “Catalysis by heteropolyacids and multicomponent polyoxometalates in liquid phase reactions”, 1998, Chemical Reviews, 98, 171-198
[49] Neel, I., “Polyoxometalates, why are they unique?”, PhD Seminar,
[50] Lefebvre, F., Liu-Cai, F. X., ,Auroux, A., “Microcalorimetric study of the acidity of tungstic heteropolyanions”, 1994, Journal of Materials Chemistry, 4, 125-131
[51] Anderson Ma, H., Wu, L., Pang, H., Meng, X., Peng, J., “Hydrothermal synthesis of two Anderson POM-supported transition metal organic-inorganic compounds”, 2010, Journal of Molecular Structure, 967, 15-19
[52] Misono, M., “Recent progress in practical applications of heteropolyacid and perovskite catalysts: Catalytic technology for the sustainable society”, 2009, Catalysis Today, 144, 285-291
[53] Okuhara, T., Mizuno, N., Misono, M., “Catalysis by heteropoly compounds- recent developments”, 2001, Applied Catalysis A: General, 222, 63-77
[54] Ahmad, M. I., Zaidi, S. M. J., Ahmed, S., “Proton containing composites of heteropolyacids loaded onto MCM-41”, 2006, Journal of Power Sources, 157, 35-44
[55] Li, G., Ding, Y., Wang, J., Wang, X., Suo, J., “New progress of Keggin and Wells-Dawson type polyoxometalates catalyze acid and oxidative reactions”, 2007, Journal of Molecular Catalysis A: Chemical, 262, 67-76
[56] Kozhevnikov, I. V., “Sustainable heterogeneous catalysis by heteropoly acids”, 2007, Journal of Molecular Catalysis A: Chemical, 262, 86-92
[57] Kozhevnikov, I. V., “Heterogeneous acid catalysis by heteropoly acids: Approaches to catalyst deactivation”, 2009, Journal of Molecular Catalysis A: Chemical, 305, 104-111

122
[58] Liu, Q., Wu, W., Wang, J., Ren, X., Wang, Y., “Characterization of 12-tungstophosphoric acid impregnated on mesoporous silica SBA-15 and its catalytic performance in isopropylation of naphthalene with isopropanol”, 2004, Microporous and Mesoporous Materials, 76, 51-60
[59] Mizuno, N., Misono, M., “Heterogeneous catalysis”, 1998, Chemical Reviews, 98, 199-217
[60] Popa, A., Sasca, V., Halasz, J., “Catalytic properties of molecular sieves MCM41 type doped with heteropolyacids for ethanol oxidation”, 2008, Applied Surface Science, 225, 1830-1835
[61] Xia, Q. H., Wee, C. H., Hidajat, K., Kawi, S., “H3PW12O40-Supported MCM-41 acid catalyst for the gas phase synthesis of MTBE”, 2004, Studies in Surface Science and Catalysis, 154, 2915-2922
[62] Mizuno, N., Misono, M., “Heteropolyacids catalysts”, 1997, Current Opinion in Solid State and Materials Science, 2, 84-89
[63] Herrero, M., Mendiola, J. A., Cifuentes, A., Ibanez, E., “Supercritical fluid extraction: Recent advances and applications”, 2010, Journal of Chromatography A, 1217, 2495-2511
[64] Edward, R., Quibai, S., Zhiqiang, Z., Chongmin, Z., Wei, G., “Mini-review: Green sustainable processes using supercritical fluid carbondioxide”, 2009, Journal of Environmental Sciences, 21, 720-726
[65] Sahena, F., Zaidul, I. S. M., Jinap, S., Karim, A. A, Abbas, K. A., Norulaini, N. A. N., Omar, A. K. M., “Application of supercritical CO2 in lipid extraction – A review”, 2009, Journal of Food Engineering, 95, 240-253
[66] Pinero, R., Garcia, J., Sokolova, M., Cocero, M. J., “Modelling of the phase behavior for the direct synthesis of dimethyl carbonate from CO2 and methanol at supercritical or near supercritical conditions”, 2007, Journal of Chemical Thermodynamics, 39, 536-549
[67] http://stevengoddard.wordpress.com/2010/09/05/the-freezing-point-and-the-dew%C2%A0point-part-2/, Last Access Date, 01.07.2010
[68] Cansell, F., Aymonier, C., “Design of functional nanostructrues materials using supercritical fluids”, 2009, Journal of Supercritical Fluids, 47, 508-516
[69] Erkey, C., “Preparation of metallic supported nanoparticles and films using supercritical fluid deposition”, 2009, Journal of Supercritical Fluids, 47,517-522
[70] Chatterjee, M., Hayashi, H., Saito, N., “Role and effect of supercritical fluid extraction of template on the Ti(IV) active sites of Ti-MCM-41”, 2003, Microporous and Mesoporous Materials, 57, 143-155

123
[71] Huang, Z., Luan, D. Y., Shen, S. C., Hidajat, K., Kawi, S., “Supercritical fluid extraction of the organic template from synthesized porous materials: effect of pore size”, 2005, Journal of Supercritical Fluids, 35, 40-48
[72] Huang, L., Kawi, S., Poh, C., Hidajat, K., Ng, S. C., “Extraction of cationic surfactant templates from mesoporous materials by CH3OH-modified CO2 supercritical fluid”, 2005, Talanta, 66, 943-951
[73] Kawi, S., Lai, M. W., “Supercritical fluid extraction and surfactant template from MCM-41”, 1998, Chemical Communications, 1407-1408
[74] Scintag, Inc., Basics of X-Ray Diffraction, Chapter 7, 1999
[75] Rouquérol, F. , Rouquérol, J., Sing, K. S. W. “Adsorption by powders & porous solids: principles, methodology and applications”, Academic Press, 1999
[76] Wikipedia the Free Encyclopedia, http://en.wikipedia.org/mainpage http://en.wikipedia.org/wiki/Capillary_condensation, Last Access Date, 01.12.2010
[77] Herguth, W. R., “Applications of Scanning Electron Microscopy and Energy Dispersive Spectroscopy (SEM/EDS) to Practical Tribology Problems”, Herguth Laboratories, Inc.
[78] Hafner, B., “Scanning Electron Microscopy Primer”, 2007, Characterization Facility, University of Minnesota
[79] Thermonicolet, Introduction to Fourier Transform Infrared Spectrometry, 2001
[80] Hsu, C. P. S., “Infrared Spectroscopy”, Handbook of Instrumental Techniques for Analytical Chemistry, Separation Sciences Research and Product Development, Mallinckrodt, Inc.
[81] Applied Separations Spe-ed SFE Operations Manual, version 4.1
[82] Varisli, D., Dogu, T., Dogu, G. “Novel mesoporous nanocomposite WOx-Silicate acidic catalysts: Ethylene and Diethylether from ethanol”, 2009, Industrial and Engineering Chemistry Research ,48 (21), 9394–9401
[83] Xu, B., Yamaguchi, T., Tanabe, K., “Acid-base functional behavior of ZrO2 in dual absorption of CO2 and NH3”, 1988, Chemistry Letters, 1663-1666
[84] Tomishige, K., Sakaihori, T., Ikeda, Y., Fujimoto, K., “A novel method of direct synthesis of dimethyl carbonate from methanol and carbon dioxide catalyzed by zirconia”, 1999, Catalysis Letters, 58, 225-229
[85] Langenfeld, J. J., Hawthorne, S. B., Miller, D. J., Pawliszyn, J., “Effects of temperature and pressure on supercritical fluid extraction efficiencies of polycyclic aromatic hydrocarbons and polychlorinated biphenyls”, 1993, Analytic Chemistry, 65, 338-344

124
[86] Machmudah, S., Kondo, M., Sasaki, M., Goto, M., Munemasa, J., Yamagata, M., “Pressure effect in supercritical CO2 extraction of plant seeds”, 2008, Journal of Supercritical Fluids, 44, 301-307
[87] NIST Chemistry WebBook, http://webbook.nist.gov/ http://webbook.nist.gov/cgi/cbook.cgi?ID=C12035368&Units=SI&Mask=800, Last Acces Date, June, 2010
[88] Lu, W. Z., Teng, L. H., Theoretical Analysis of Fluidized-Bed Reactor for Dimethyl Ether Synthesis from Syngas, International Journal of Chemical Reactor Engineering, 2003, 1, 123-136.
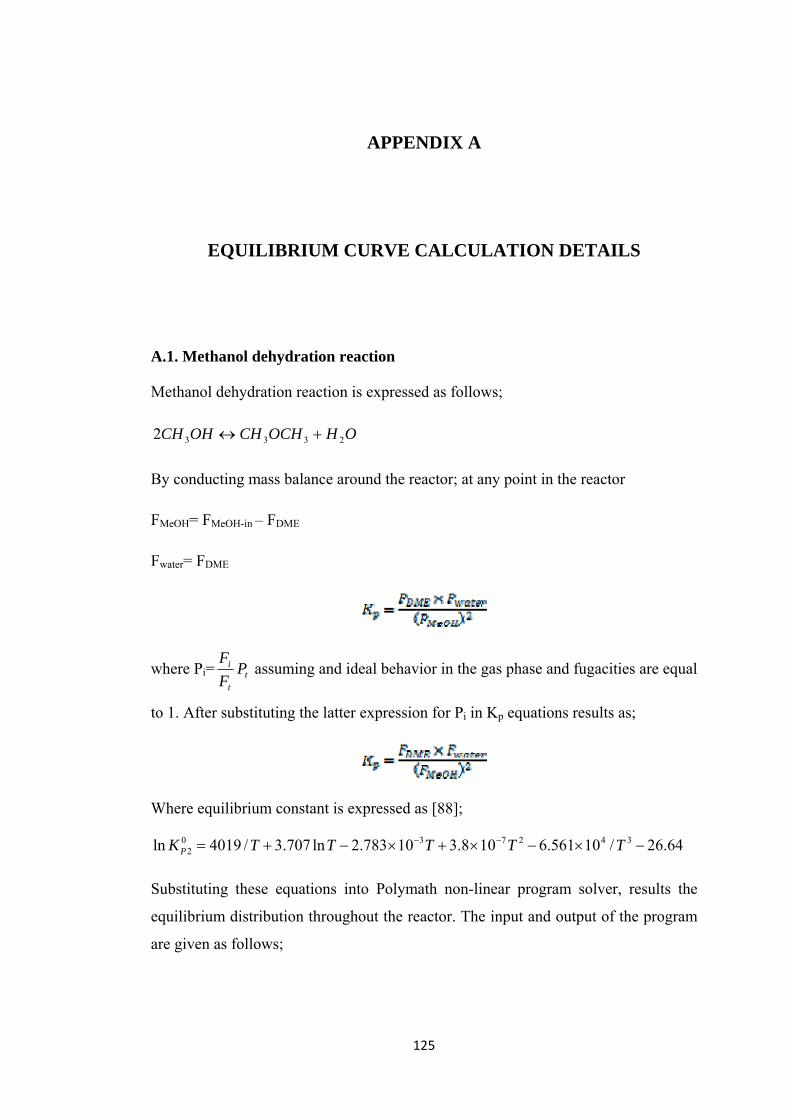
125
APPENDIX A
EQUILIBRIUM CURVE CALCULATION DETAILS
A.1. Methanol dehydration reaction
Methanol dehydration reaction is expressed as follows;
OHOCHCHOHCH 23332
By conducting mass balance around the reactor; at any point in the reactor
FMeOH= FMeOH-in – FDME
Fwater= FDME
where Pi= tt
i PF
F assuming and ideal behavior in the gas phase and fugacities are equal
to 1. After substituting the latter expression for Pi in Kp equations results as;
Where equilibrium constant is expressed as [88];
64.26/10561.6108.310783.2ln707.3/4019ln 3427302 TTTTTKP
Substituting these equations into Polymath non-linear program solver, results the
equilibrium distribution throughout the reactor. The input and output of the program
are given as follows;

126
Polymath Program used in Equilibrium Analyses of methanol dehydration reaction
f(f_DME) = Kp - f_water * f_DME / f_meoh ^ 2 Kp = exp(4019 / T + 3707 / 1000 * ln(T) - 2783 * 10 ^ (-6) * T + 38 * 10 ^ (-8) * T ^ 2 - 65610 / T ^ 3 - 2664 / 100) P = 1 T = 400 f_water = f_DME f_meoh = f_meoh_in - 2 * f_DME f_meoh_in = 100 conv_meoh = (f_meoh_in - f_meoh) / f_meoh_in * 100 f_DME(0) = 20 f_DME(max) = 100 f_DME(min) = 0
As can be seen in the results, the change in the pressure does not affect the overall
conversion of methanol;
Calculated values of NLE variables Variable Value f(x) Initial Guess
P=1 f_DME 47.57309 -0.0544634 50. ( 0 < f_DME < 100. )
P=50 f_DME 47.57309 -0.0544634 50. ( 0 < f_DME < 100. )
Variable Value Variable Value
1 T 400. T 400.
2 P 50. P 1.
3 Kp 96.00823 Kp 96.00823
4 f_water 47.57309 f_water 47.57309
5 f_meoh_in 100. f_meoh_in 100.
6 f_meoh 4.853823 f_meoh 4.853823
7 conv_meoh 95.14618 conv_meoh 95.14618
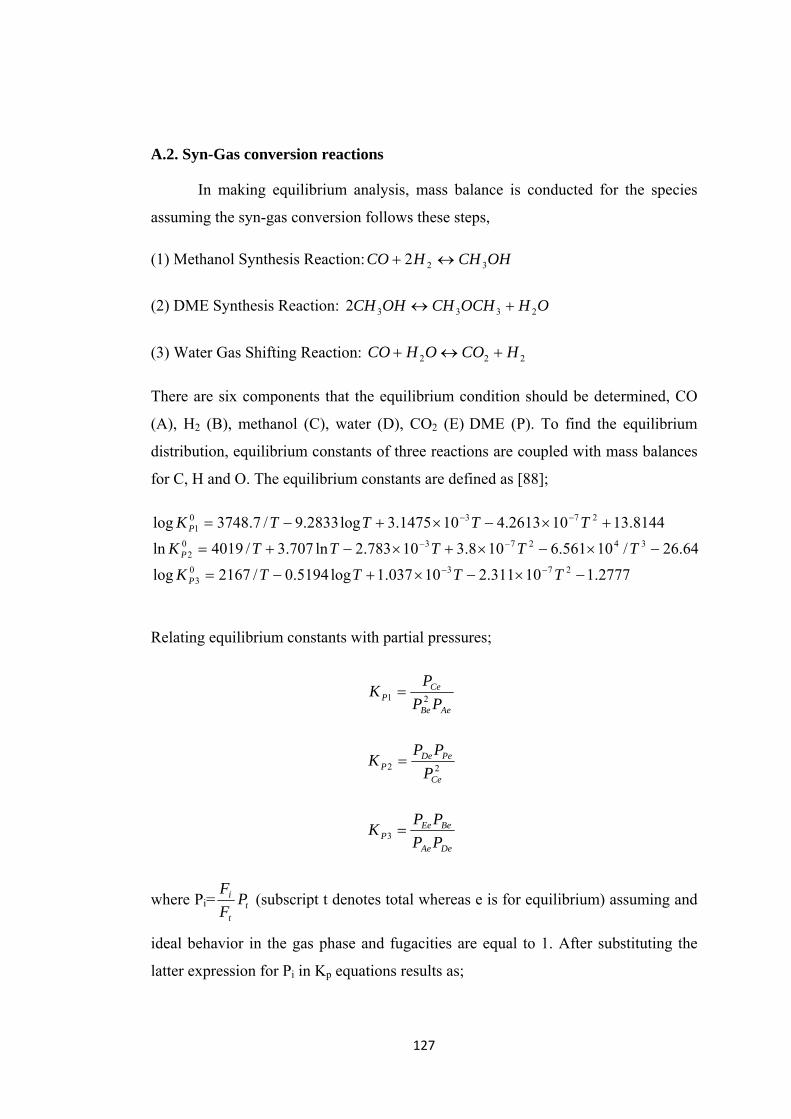
127
A.2. Syn-Gas conversion reactions
In making equilibrium analysis, mass balance is conducted for the species
assuming the syn-gas conversion follows these steps,
(1) Methanol Synthesis Reaction: OHCHHCO 322
(2) DME Synthesis Reaction: OHOCHCHOHCH 23332
(3) Water Gas Shifting Reaction: 222 HCOOHCO
There are six components that the equilibrium condition should be determined, CO
(A), H2 (B), methanol (C), water (D), CO2 (E) DME (P). To find the equilibrium
distribution, equilibrium constants of three reactions are coupled with mass balances
for C, H and O. The equilibrium constants are defined as [88];
2777.110311.210037.1log5194.0/2167log
64.26/10561.6108.310783.2ln707.3/4019ln
8144.13102613.4101475.3log2833.9/7.3748log
27303
3427302
27301
TTTTK
TTTTTK
TTTTK
P
P
P
Relating equilibrium constants with partial pressures;
AeBe
CeP PP
PK
21
22
Ce
PeDeP P
PPK
DeAe
BeEeP PP
PPK 3
where Pi= tt
i PF
F (subscript t denotes total whereas e is for equilibrium) assuming and
ideal behavior in the gas phase and fugacities are equal to 1. After substituting the
latter expression for Pi in Kp equations results as;
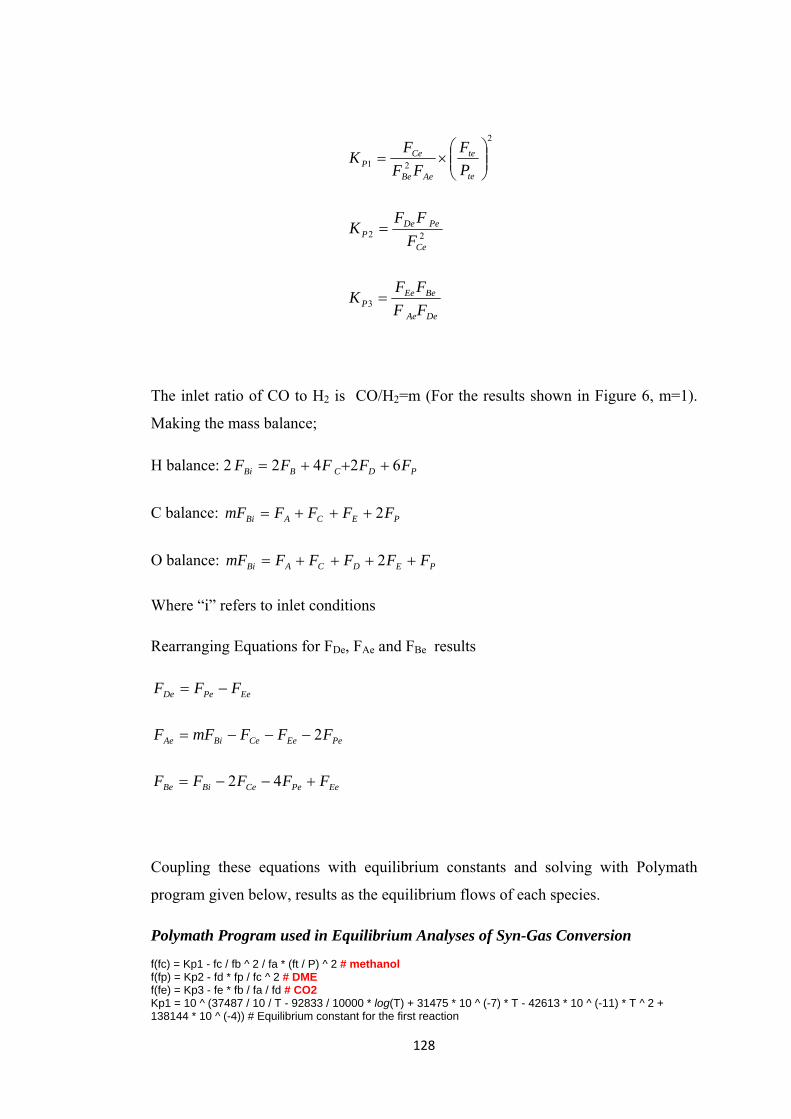
128
2
21
te
te
AeBe
CeP P
F
FF
FK
22
Ce
PeDeP F
FFK
DeAe
BeEeP FF
FFK 3
The inlet ratio of CO to H2 is CO/H2=m (For the results shown in Figure 6, m=1).
Making the mass balance;
H balance: 2 PDCBBi FFFFF 6242
C balance: PECABi FFFFmF 2
O balance: PEDCABi FFFFFmF 2
Where “i” refers to inlet conditions
Rearranging Equations for FDe, FAe and FBe results
EePeDe FFF
PeEeCeBiAe FFFmFF 2
EePeCeBiBe FFFFF 42
Coupling these equations with equilibrium constants and solving with Polymath
program given below, results as the equilibrium flows of each species.
Polymath Program used in Equilibrium Analyses of Syn-Gas Conversion
f(fc) = Kp1 - fc / fb ^ 2 / fa * (ft / P) ^ 2 # methanol f(fp) = Kp2 - fd * fp / fc ^ 2 # DME f(fe) = Kp3 - fe * fb / fa / fd # CO2 Kp1 = 10 ^ (37487 / 10 / T - 92833 / 10000 * log(T) + 31475 * 10 ^ (-7) * T - 42613 * 10 ^ (-11) * T ^ 2 + 138144 * 10 ^ (-4)) # Equilibrium constant for the first reaction
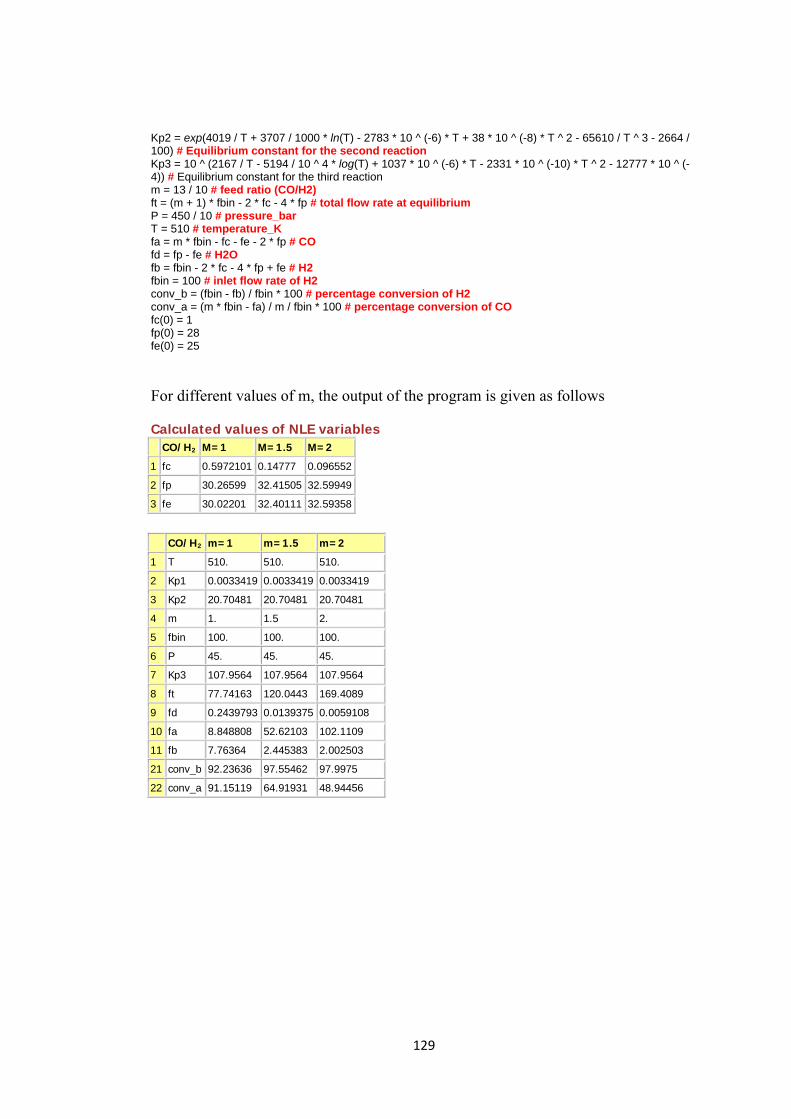
129
Kp2 = exp(4019 / T + 3707 / 1000 * ln(T) - 2783 * 10 ^ (-6) * T + 38 * 10 ^ (-8) * T ^ 2 - 65610 / T ^ 3 - 2664 / 100) # Equilibrium constant for the second reaction Kp3 = 10 ^ (2167 / T - 5194 / 10 ^ 4 * log(T) + 1037 * 10 ^ (-6) * T - 2331 * 10 ^ (-10) * T ^ 2 - 12777 * 10 ^ (-4)) # Equilibrium constant for the third reaction m = 13 / 10 # feed ratio (CO/H2) ft = (m + 1) * fbin - 2 * fc - 4 * fp # total flow rate at equilibrium P = 450 / 10 # pressure_bar T = 510 # temperature_K fa = m * fbin - fc - fe - 2 * fp # CO fd = fp - fe # H2O fb = fbin - 2 * fc - 4 * fp + fe # H2 fbin = 100 # inlet flow rate of H2 conv_b = (fbin - fb) / fbin * 100 # percentage conversion of H2 conv_a = (m * fbin - fa) / m / fbin * 100 # percentage conversion of CO fc(0) = 1 fp(0) = 28 fe(0) = 25
For different values of m, the output of the program is given as follows
Calculated values of NLE variables CO/H2 M=1 M=1.5 M=2
1 fc 0.5972101 0.14777 0.096552
2 fp 30.26599 32.41505 32.59949
3 fe 30.02201 32.40111 32.59358
CO/H2 m=1 m=1.5 m=2
1 T 510. 510. 510.
2 Kp1 0.0033419 0.0033419 0.0033419
3 Kp2 20.70481 20.70481 20.70481
4 m 1. 1.5 2.
5 fbin 100. 100. 100.
6 P 45. 45. 45.
7 Kp3 107.9564 107.9564 107.9564
8 ft 77.74163 120.0443 169.4089
9 fd 0.2439793 0.0139375 0.0059108
10 fa 8.848808 52.62103 102.1109
11 fb 7.76364 2.445383 2.002503
21 conv_b 92.23636 97.55462 97.9975
22 conv_a 91.15119 64.91931 48.94456

130
APPENDIX B
EVALUATION OF GC RESULTS
The results from GC are analyzed with the specific retention times and
calibration factors of each species. These are given in Table 26.
Table 26: Calculation parameters for effluent species from GC
Component Retention time Calibration Factor
CO 0.21 2.76
CH4 0.28 2.76
DME 5.1 0.76
Formaldehyde 7.4 1.33
Methanol 7.7 1
Total conversion of methanol is calculated as follows;
t
rEtOh n
nx
enteringMeOh moles ofnumber total
reacted moles ofnumber
where MeOHFACHCODMEt nnnnnn 42 and MeOHtr nnn
Selectivity and yield towards DME is calculated as follows;
r
DMEDME n
nS
2 and DMEMeOHDME SxY
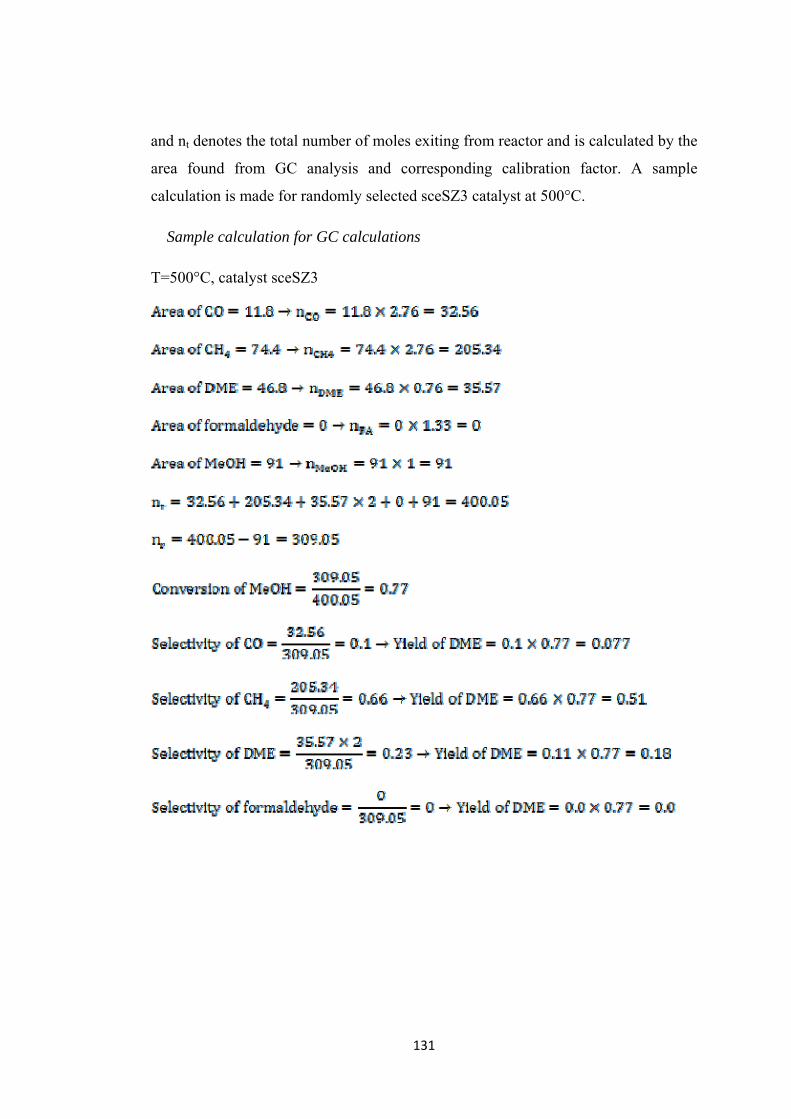
131
and nt denotes the total number of moles exiting from reactor and is calculated by the
area found from GC analysis and corresponding calibration factor. A sample
calculation is made for randomly selected sceSZ3 catalyst at 500°C.
Sample calculation for GC calculations
T=500°C, catalyst sceSZ3

132
APPENDIX C
PORE DIAMETER CALCULATION
In calculation of pore diameters of the materials indicated in this study, BJH
desorption raw data are used. A sample calculation is given below for the sample
cSZ1.
Diameter (Å) Pore Vol (cc/g) d average dV d dV
Average pore
diameter
16.7 2.27E-03 17.945 0.003936 0.070632 19.19 6.20E-03 20.45 0.004556 0.09317 21.71 1.08E-02 23.05 0.00569 0.131155 24.39 1.65E-02 25.835 0.00706 0.182395 27.28 2.35E-02 28.79 0.00837 0.240972 30.3 3.19E-02 32.045 0.02288 0.73319 33.79 5.48E-02 35.88 0.04954 1.777495 37.97 1.04E-01 40.39 0.0476 1.922564 42.81 1.52E-01 45.86 0.0673 3.086378 48.91 2.19E-01 52.53 0.0363 1.906839 56.15 2.56E-01 60.205 0.0124 0.746542 64.26 2.68E-01 70.615 0.0165 1.165148 76.97 2.84E-01 85.755 0.014 1.20057 94.54 2.98E-01 106.88 0.0068 0.726784
119.22 3.05E-01 142.06 0.0055 0.78133 164.9 3.11E-01 218.225 0.0053 1.156593
271.55 3.16E-01 786.135 0.014 11.00589 1300.72 3.30E-01 -- -- --
total last data included 0.327732 26.92765 82.16361 last data excluded 0.309796 15.85112 51.16633
The calculation methadology for the first data is as follows
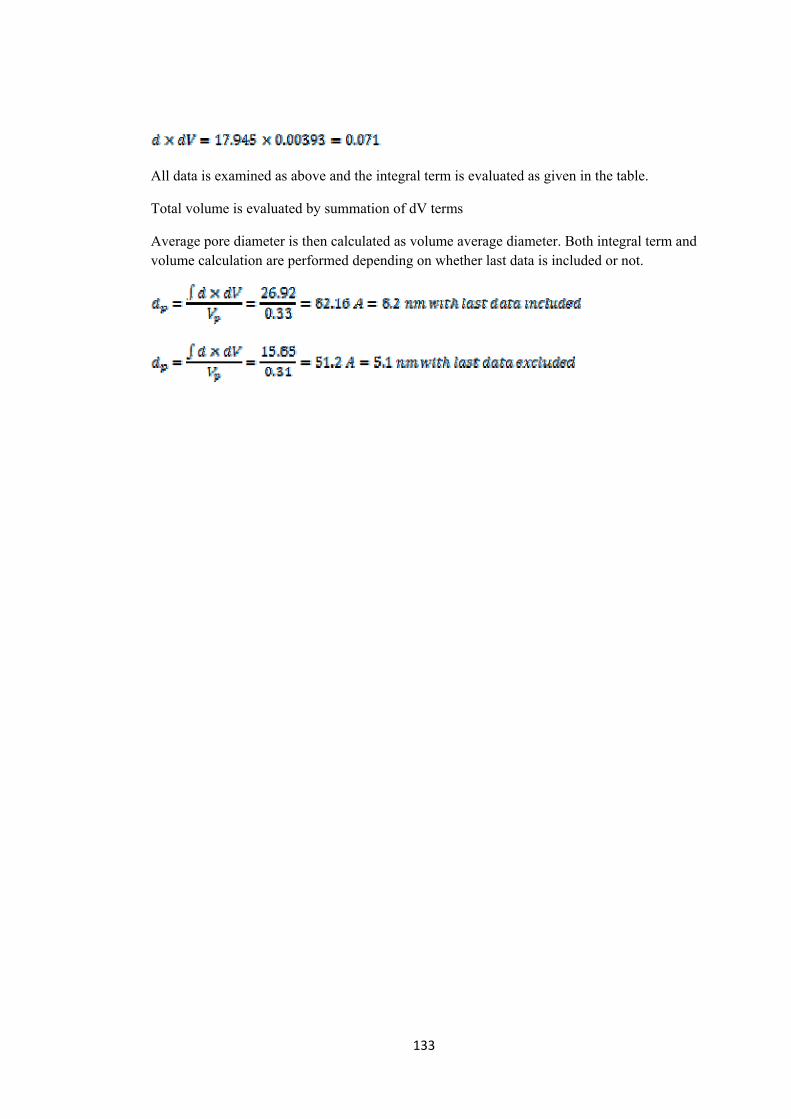
133
All data is examined as above and the integral term is evaluated as given in the table.
Total volume is evaluated by summation of dV terms
Average pore diameter is then calculated as volume average diameter. Both integral term and volume calculation are performed depending on whether last data is included or not.
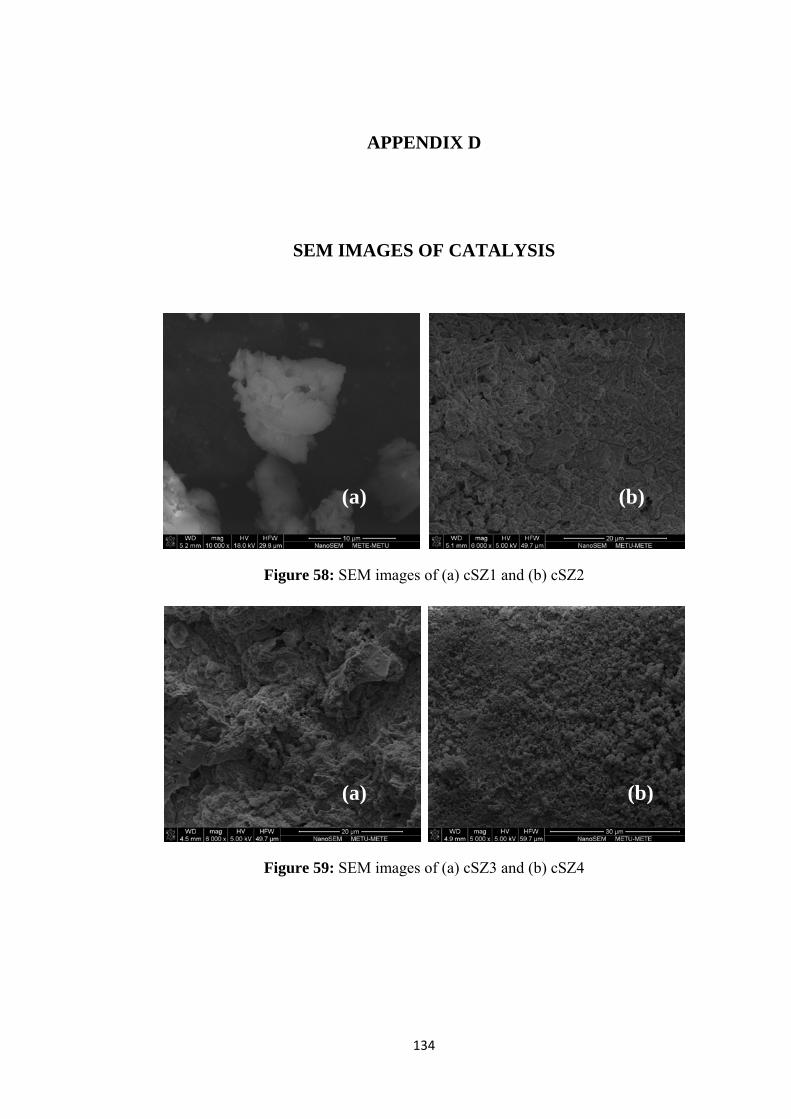
134
APPENDIX D
SEM IMAGES OF CATALYSIS
Figure 58: SEM images of (a) cSZ1 and (b) cSZ2
Figure 59: SEM images of (a) cSZ3 and (b) cSZ4
(a) (b)
(a) (b)

135
Figure 60: SEM images of (a) cSZ5 and (b) cSZ6
Figure 61: SEM images of (a) cSC and (b) cSN
Figure 62: SEM images of (a) sceSZ1 and (b) sceSZ2
(b) (a)
(a) (b)
(a) (b)
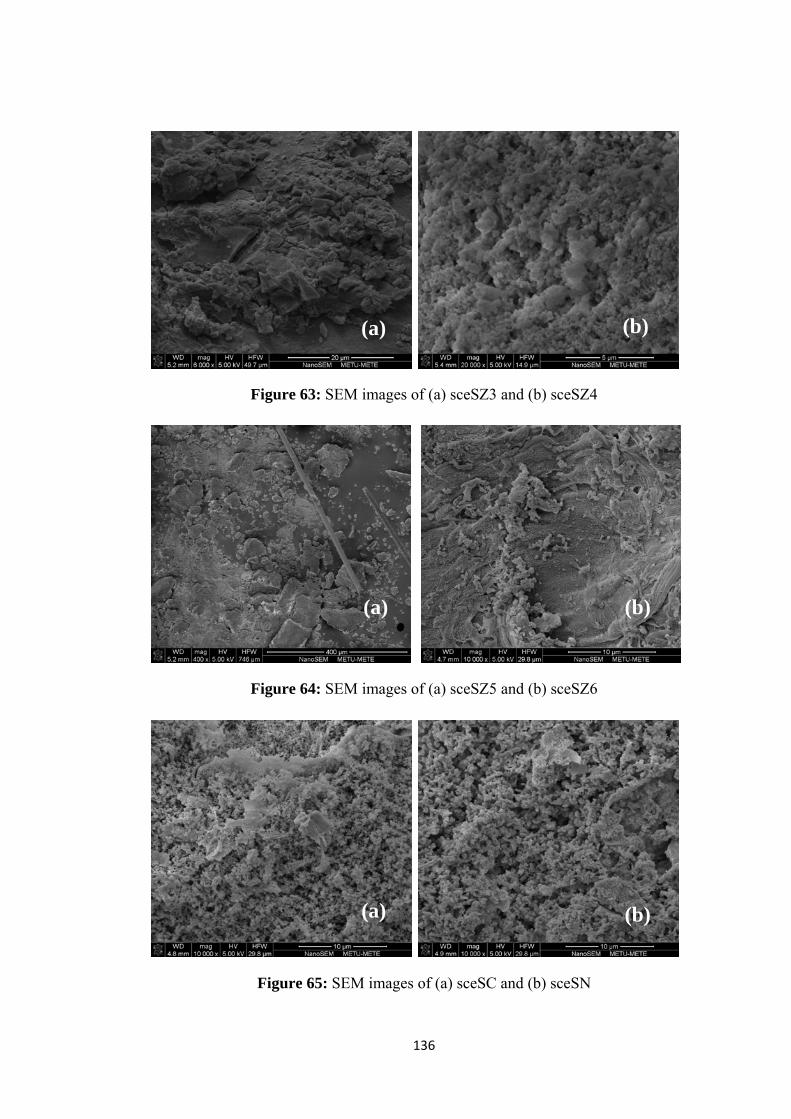
136
Figure 63: SEM images of (a) sceSZ3 and (b) sceSZ4
Figure 64: SEM images of (a) sceSZ5 and (b) sceSZ6
Figure 65: SEM images of (a) sceSC and (b) sceSN
(b) (a)
(a) (b)
(a) (b)

137
APPENDIX E
TGA CURVES OF SELECTED SAMPLES
E.1. TGA Curves of Catalyst Used in Comparison of Extraction and Calcination
0 100 200 300 400 500 600Temp [C]
80.0
85.0
90.0
95.0
100.0
%TGA
-0.50
0.00
0.50
mg/minDrTGA
-40.00
-20.00
0.00
20.00
40.00
uVDTA
488.39 C
-2.813 mg
-13.112 %
Weight Loss
490.56 C
STA-ZR-D
Figure 66: TGA curve of cSZ1

138
0 100 200 300 400Temp [C]
50.0
60.0
70.0
80.0
90.0
100.0
%TGA
-100.00
0.00
100.00
uV/minDrDTA
-100.00
0.00
100.00
200.00
uVDTA
380.30 C
-2.019mg
-17.449 %
Weight Loss
SCeSz2
Figure 67: TGA curve of sceSZ2
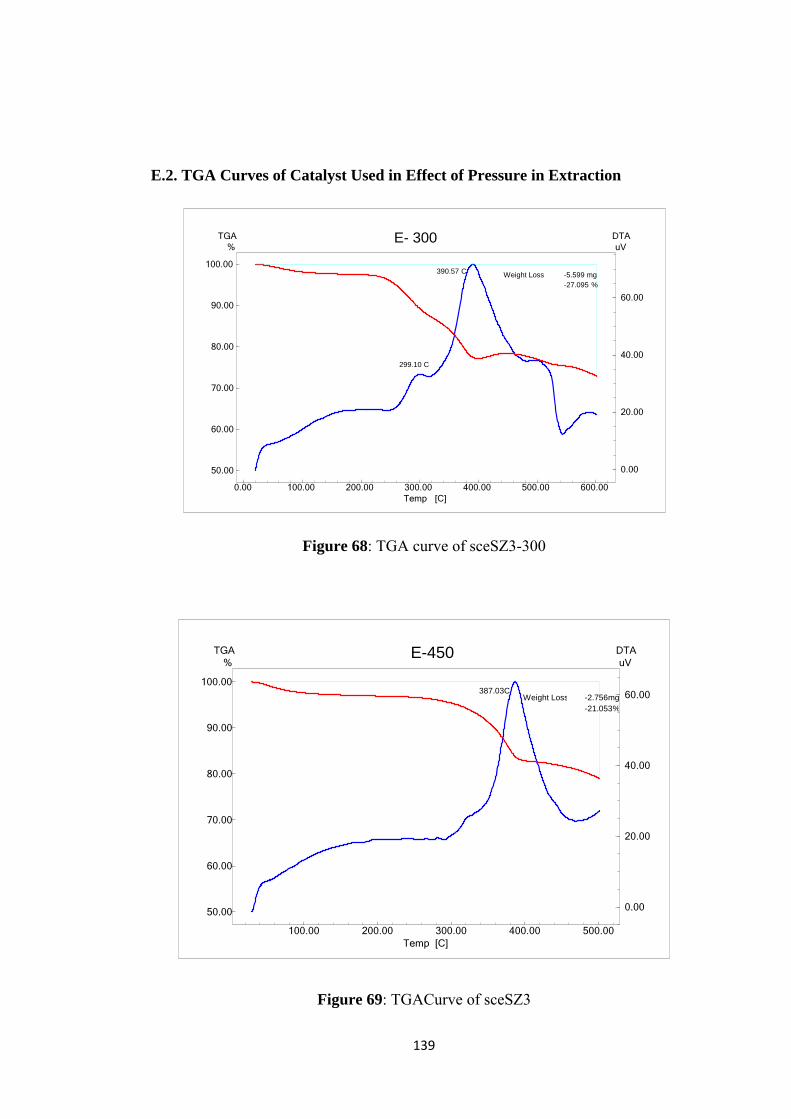
139
E.2. TGA Curves of Catalyst Used in Effect of Pressure in Extraction
0.00 100.00 200.00 300.00 400.00 500.00 600.00Temp [C]
50.00
60.00
70.00
80.00
90.00
100.00
%TGA
0.00
20.00
40.00
60.00
uVDTA
390.57 C
299.10 C
-5.599 mg-27.095 %
Weight Loss
E- 300
Figure 68: TGA curve of sceSZ3-300
100.00 200.00 300.00 400.00 500.00Temp [C]
50.00
60.00
70.00
80.00
90.00
100.00
%TGA
0.00
20.00
40.00
60.00
uVDTA
387.03C-2.756mg-21.053%
Weight Loss
E-450
Figure 69: TGACurve of sceSZ3
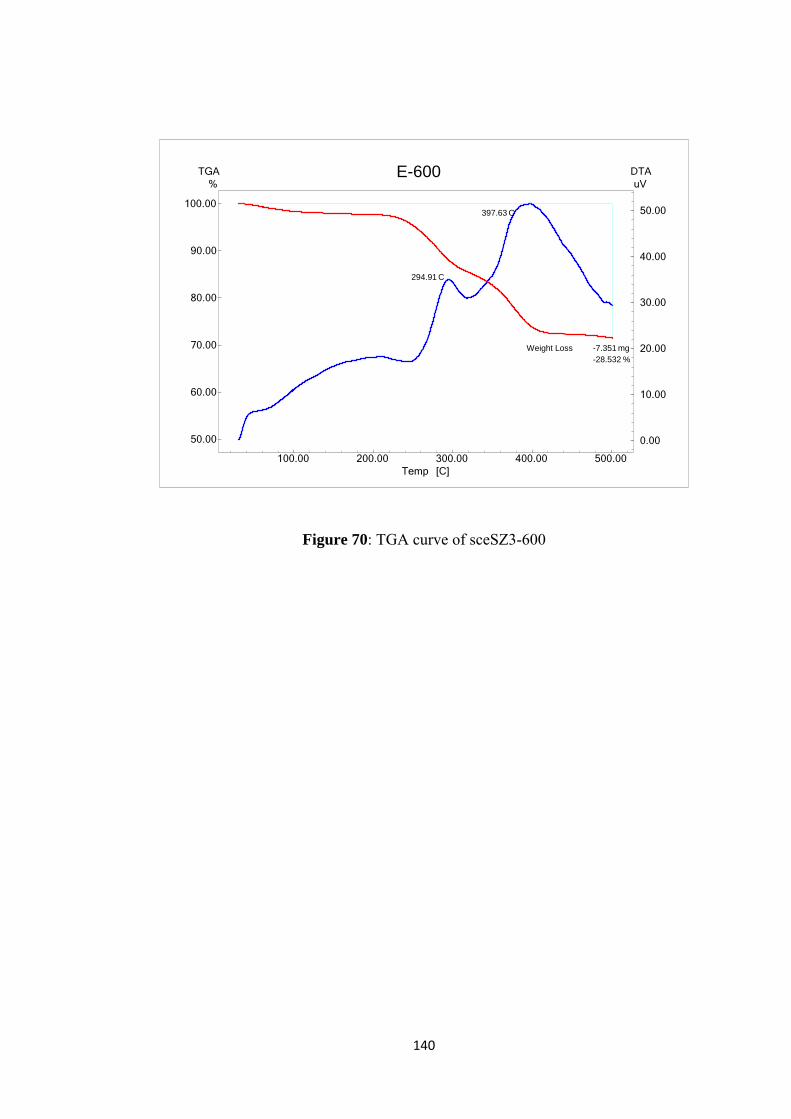
140
100.00 200.00 300.00 400.00 500.00Temp [C]
50.00
60.00
70.00
80.00
90.00
100.00
%TGA
0.00
10.00
20.00
30.00
40.00
50.00
uVDTA
294.91 C
397.63 C
-7.351 mg-28.532 %
Weight Loss
E-600
Figure 70: TGA curve of sceSZ3-600

141
APPENDIX F
PRODUCT DISTRIBUTIONS IN METHANOL DEHYDRATION
REACTIONS
F.1. Product Distribution in methanol dehydration reaction performed with
calcined samples
Table 27: Product distribution in presence of calcined catalysis (τ= 0.27 s.g/cm3 )
Catalyts Temperature XMeOH SDME YDME SFA SCO SCH4
cSZ1
250 0.085 0.889 0.076 0.111 0 0 300 0.198 0.978 0.193 0.022 0 0 350 0.221 0.956 0.211 0.011 0 0.033 400 0.346 0.832 0.288 0.006 0.008 0.154 450 0.670 0.345 0.231 0.000 0.055 0.600
cSZ2
250 0.325 0.992 0.322 0.008 0 0 300 0.460 0.995 0.458 0.005 0 0 350 0.477 0.960 0.458 0.003 0 0.036 400 0.673 0.785 0.528 0 0.020 0.195 450 0.916 0.303 0.278 0 0.080 0.617
cSZ3
250 0.111 0.891 0.099 0.109 0 0 300 0.217 0.934 0.203 0.066 0 0 350 0.285 0.914 0.260 0.044 0 0.042 400 0.458 0.820 0.376 0.005 0.006 0.169 450 0.592 0.401 0.238 0.001 0.068 0.530
cSZ4
250 0.094 0.865 0.082 0.135 0 0 300 0.124 0.902 0.112 0.098 0 0 350 0.155 0.904 0.140 0.076 0 0.020 400 0.312 0.873 0.272 0.007 0 0.119 450 0.542 0.642 0.348 0.002 0.030 0.327
cSZ5
250 0.055 0.760 0.042 0.240 0 0 300 0.119 0.895 0.107 0.105 0 0 350 0.156 0.909 0.141 0.072 0 0.019 400 0.321 0.877 0.281 0.007 0 0.115 450 0.648 0.544 0.353 0 0.035 0.420
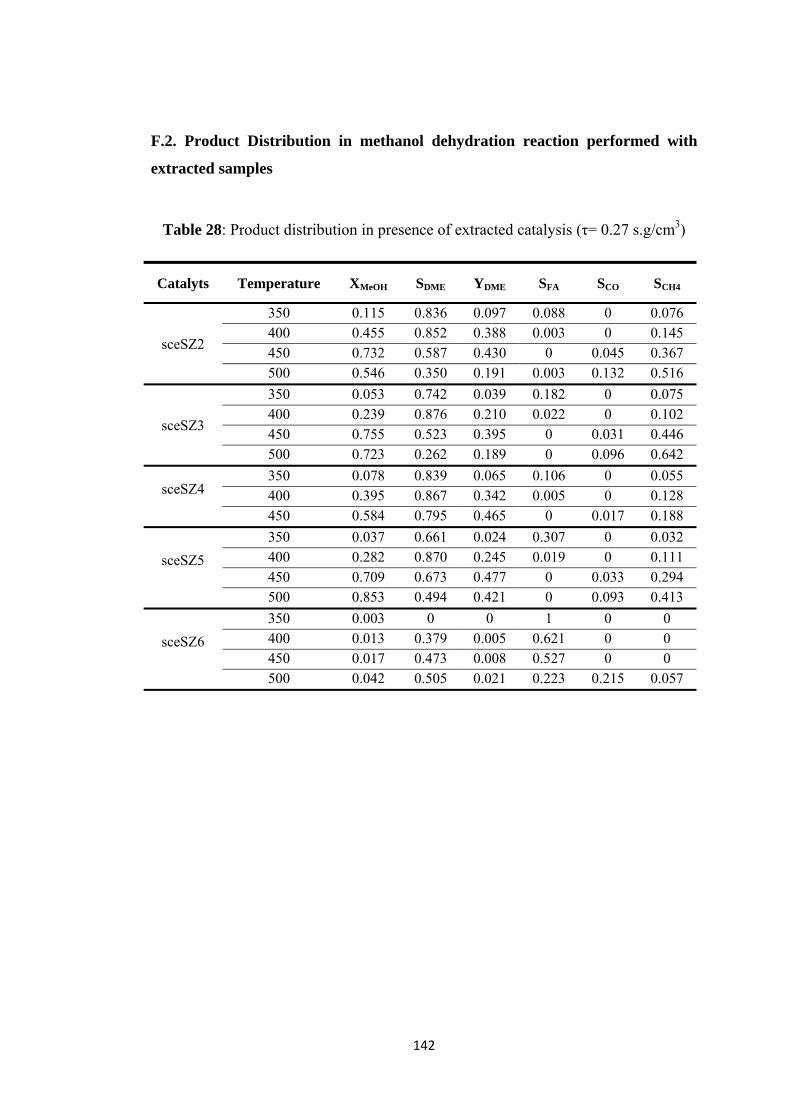
142
F.2. Product Distribution in methanol dehydration reaction performed with
extracted samples
Table 28: Product distribution in presence of extracted catalysis (τ= 0.27 s.g/cm3)
Catalyts Temperature XMeOH SDME YDME SFA SCO SCH4
sceSZ2
350 0.115 0.836 0.097 0.088 0 0.076 400 0.455 0.852 0.388 0.003 0 0.145 450 0.732 0.587 0.430 0 0.045 0.367 500 0.546 0.350 0.191 0.003 0.132 0.516
sceSZ3
350 0.053 0.742 0.039 0.182 0 0.075 400 0.239 0.876 0.210 0.022 0 0.102 450 0.755 0.523 0.395 0 0.031 0.446 500 0.723 0.262 0.189 0 0.096 0.642
sceSZ4 350 0.078 0.839 0.065 0.106 0 0.055 400 0.395 0.867 0.342 0.005 0 0.128 450 0.584 0.795 0.465 0 0.017 0.188
sceSZ5
350 0.037 0.661 0.024 0.307 0 0.032 400 0.282 0.870 0.245 0.019 0 0.111 450 0.709 0.673 0.477 0 0.033 0.294 500 0.853 0.494 0.421 0 0.093 0.413
sceSZ6
350 0.003 0 0 1 0 0 400 0.013 0.379 0.005 0.621 0 0 450 0.017 0.473 0.008 0.527 0 0 500 0.042 0.505 0.021 0.223 0.215 0.057