z/os performance case studies on zhpf & coupling facility · • logical cf usage service...
TRANSCRIPT

z/OS Performance Case Studies
on zHPF & Coupling Facility
Paulus Usong, IntelliMagic Performance Consultant

Agenda
1. Brief Overview of IntelliMagic Technology – “Who is IntelliMagic and what was used to create the case
studies?”
2. Case Study: zHPF Projections – “What are the ramifications of zHPF to my channel configuration?”
3. Case Study: zHPF Before/After Analysis – “What performance difference has zHPF made for my
workloads?”
4. Case Study: Coupling Facility Efficiency Analysis – “Is the CF configuration optimal and are there CPU
ramifications?”

• IntelliMagic is a leader in advanced predictive analytics, especially for large data storage infrastructures
• Over 20 years developing storage performance solutions
• Privately held, financially independent
• Customer centric and highly responsive
• IntelliMagic Products are used daily at some of the largest mainframe sites in the country
3
About IntelliMagic
Predictive Performance Modeling Services: Optimize Investments
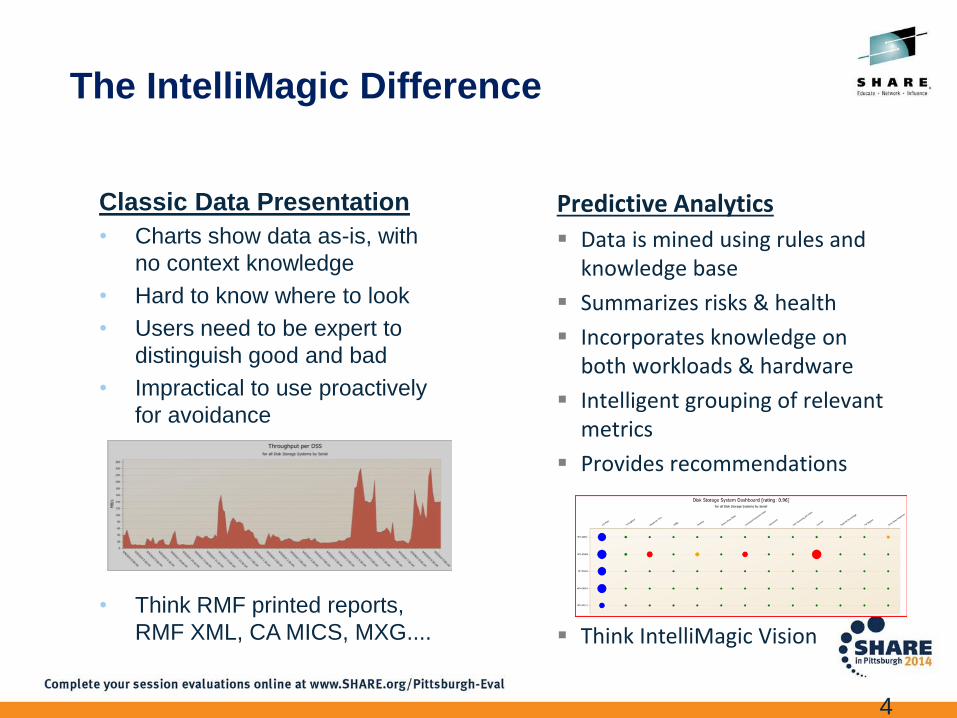
Classic Data Presentation
• Charts show data as-is, with
no context knowledge
• Hard to know where to look
• Users need to be expert to
distinguish good and bad
• Impractical to use proactively
for avoidance
• Think RMF printed reports,
RMF XML, CA MICS, MXG....
The IntelliMagic Difference
4
Predictive Analytics
Data is mined using rules and knowledge base
Summarizes risks & health
Incorporates knowledge on both workloads & hardware
Intelligent grouping of relevant metrics
Provides recommendations
Think IntelliMagic Vision

Risk Assessment Dashboards
5
GBs of RMF data on: Processors, Storage, WLM, Channels, FICON Directors,
GDPS replication, SRDF, Coupling Facility, XCF, …
“IntelliMagic”
Dashboards with Key Risk Indicators
Warning
Exception
Healthy
Quick drill downs to show
underlying issues

Mainframe Data Sources:
• RMF
• SMF
• DCOLLECT
• EMC SQ MIRROR
• HDS TGZ
• IBM BVIR (TS77xx)
• CA1, TLMS, RMM
6
IntelliMagic
Vision DB:
MS SQL or
DB/2 on z
IntelliMagic Vision
data collection process for
z/OS:
• Disk
• Tape
• Systems
• Replication Rules
Data
Enrichment &
Consolidation
Predictive
Analytics
Engine
Automated
Reports
&
Notifications
Custom-
izations
IntelliMagic Vision Architecture
Windows
& Web
GUI
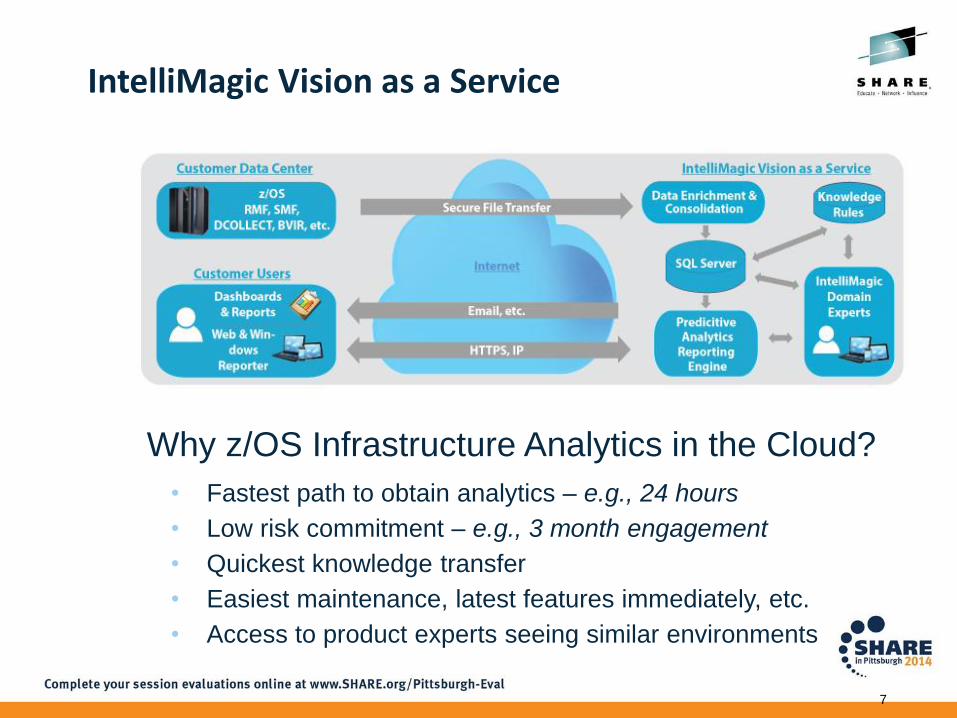
Why z/OS Infrastructure Analytics in the Cloud?
• Fastest path to obtain analytics – e.g., 24 hours
• Low risk commitment – e.g., 3 month engagement
• Quickest knowledge transfer
• Easiest maintenance, latest features immediately, etc.
• Access to product experts seeing similar environments
IntelliMagic Vision as a Service
7

Case Studies

zHPF
Examples of what IntelliMagic can do to help you in your zHPF decisions and evaluation.
zHPF Case Study 1: Analyze current workloads and:
Estimate percentage of zHPF candidate I/Os by DSS (using IntelliMagic Vision)
Recommend channel consolidation to use fewer channels due to zHPF (using zCP3000)
Applicable when doing CEC consolidation and/or when upgrading or consolidating DSS
zHPF Case Study 2: Analyze current workloads and:
Measure before/after impact on your workloads when zHPF is turned on (using IntelliMagic Vision)

zHPF Projections

Data Analyzed
• SMF data type 42 and RMF type 70-78
• One day of SMF data was analyzed

Current CEC to DSS Connection
12 © IntelliMagic 2014
3 CEC CEC1, CEC2 & CEC3 3 DSS ABC11, ABC16 & ABC17
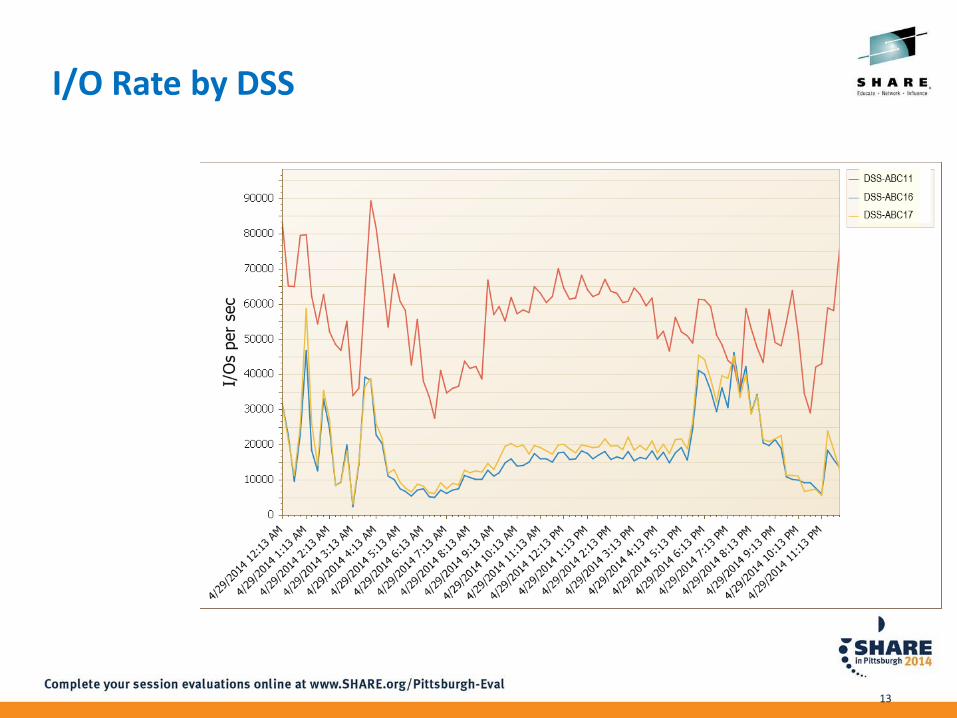
I/O Rate by DSS
13

zHPF Candidate I/O Rate by Day
14
DSS-ABC11 DSS-ABC16 DSS-ABC17
The zHPF Candidate I/O Rate is calculated based on zHPF Phase 1 capabilities.

% zHPF Eligible I/O
15
The % zHPF eligible I/O depends upon the type of I/O

Desired Channel Consolidation Is it safe?
16
The 3 CEC will be consolidated to 1 CEC. 3-to-1 channel consolidation

CHPID Configuration
• CEC1, CEC2 & CEC3 accesses DSS-ABC16 & DSS-ABC17 through the following CHPIDs • 18 through 1F
• Consolidation suggestion • Combine each CHPID (18 – 1F) from each CEC onto 1 CHPID on the new CEC
• This will be a 3-to-1 channel consolidation
• The new CEC will access the 2 DSS through one 8-channel-path
• Activate zHPF
17

Channel Consolidation Projection based on 50% zHPF Eligible I/O
18
Peak CHPID utilization: Without zHPF=37% With zHPF=23%
3 channels combined Into 1 channel
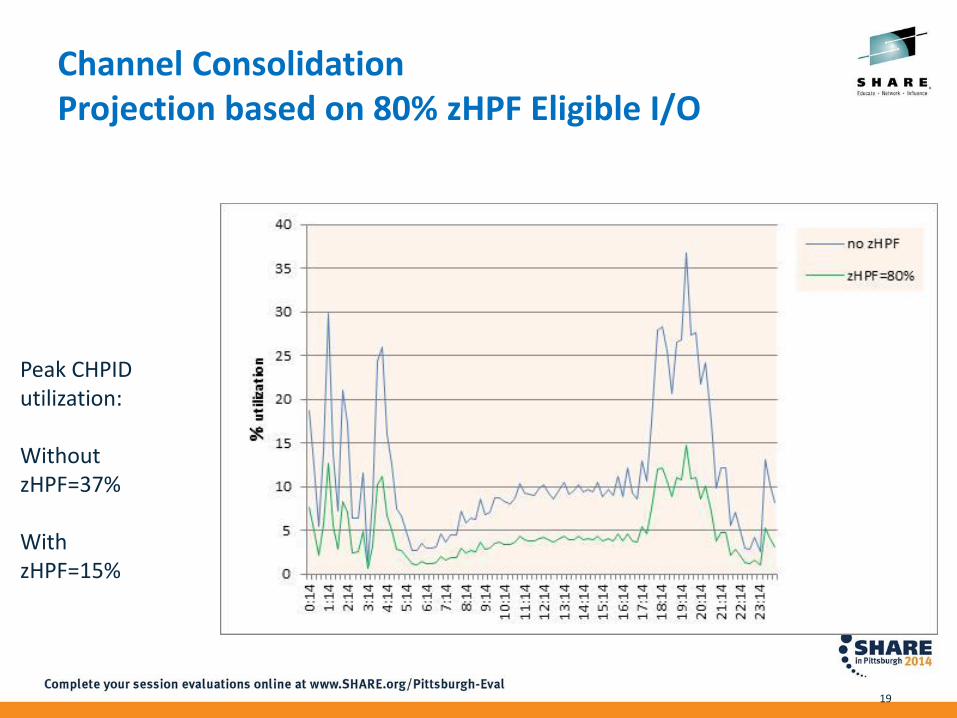
Channel Consolidation Projection based on 80% zHPF Eligible I/O
19
Peak CHPID utilization: Without zHPF=37% With zHPF=15%

zHPF Projection Study Results Summary
• With zHPF active at 50% zHPF eligible I/Os, the 3-to-1 channel consolidation shows the following: • Peak channel utilization improves from 37% without zHPF
to 23% with zHPF active
• If the workload on ABC16 & ABC17 have the same characteristics as the workload running on ABC11, with an 80% zHPF eligible I/Os the consolidation shows the following: • Peak channel utilization decreases by more than half, from 37% to 15%
• zHPF will allow the configuration to safely use fewer of channels.
20

zHPF Performance Analysis

zHPF Usage (%) for all Channels by Processor Complex serial
22
48 hour zHPF Usage: Avg = 78.4% Min = 41% Max= 96%
One LPAR enabled zHPF prior to zHPF cutover

zHPF candidate and non-candidate I/O requests by data set type (I/Os per sec) 24 hour summary for all datasets by DSN type
23
97% IOs captured in data set records (T42). zHPF Pct: 87.5% T42 87.4% T74.5 86.4% T73 (zVM IOs excluded)

Channel Comparison
24

Microprocessor Utilization for busiest channel connected to DSS For Processor Complex serial 'IBM000006' by DSS List Rating based on Channel data using System Thresholds
25
Using just the CEC with little zHPF prior to the cutover channel u-p util 53% lower on 48 hour avg.
Peak is still close as high as ever but it’s an afternoon spike. Absolute maximums still modest (20%).
DSS01
DSS02
DSS03 DSS04
DSS05
DSS01
DSS02
DSS03
DSS04
DSS05

Disk Storage System Comparison
26

Throughput per DSS (MB/s) for all Disk Storage Systems by Serial Rating based on DSS data using DSS Thresholds
27
Max thruput for 15min interval increased by 15.8% on 48 hour avg.
DSS01
DSS02
DSS03
DSS04
DSS01
DSS02
DSS03
DSS04
DSS05

Response Time (ms) for all Disk Storage Systems by Serial Rating based on DSS data using DSS Thresholds
28
Average IO response time dropped 7.1% on 48 hour avg.
DSS01
DSS02
DSS03
DSS04
DSS01
DSS02
DSS03
DSS04
DSS05

Connect Time (ms) for all Disk Storage Systems by Serial Rating based on DSS data using DSS Thresholds
29
Average IO connect time dropped 24.9% on 48 hour avg.
DSS01
DSS02
DSS03
DSS04
DSS01
DSS02
DSS03
DSS04
DSS05

zHPF Before & After Study Results Summary
• zHPF penetration 78% of disk IOs
One year later - 24 hour avg was 86%
Good correlation between zHPF candidate and actual pct zHPF
• Channel u-processor utilizations reduction 53%
• IO Response Time Reduction 7%
• IO Connect time reduction 25%
30

Coupling Facility
Problem Analysis

Coupling Facility
• CF has dedicated engine
• CF has shared processor – DYNDISP=YES|NO
– DYNDISP=THININTERRUPT
32

Coupling Facility Path Contention for all
Coupling Facility Locals by CF Name Rating based on Coupling Facility Local data using Coupling Facilities
33
Logical CFs in use, Application performance meeting service levels yet Vision CF reports show excessive sync request service times

Coupling Facility System Mini-charts
34 © IntelliMagic 2014
The drill down from one logical coupling facility shows CF sync response times above 1000us.

Service time for synchronous requests (microseconds)
35
For CF Name by System
Added detail, drilling down from the multi-variable chart.
Note: slide includes times after dyndisp=thin.

Service time for asynchronous requests
(microseconds) [rating: 0.23]
36
For CF Name by System
CF Async response times were also high.
Note: slide includes times after dyndisp=thin.

Coupling Facility System Minicharts “dyndisp=thin” on one Sysplex
37
For CF Name by System
Partial implementation Showed great improvement in both sync and async service times for the 2 sysplexes yet to be converted.

Service time for synchronous requests (microseconds) [rating: 0.92]
38
For CF Name by System
Added detail, drilling down from the multi-variable chart.

Service time for asynchronous requests (microseconds) [rating: 0.50]
39
For CF Name by System
Added detail, drilling down from the multi-variable chart.

Coupling Facility Path Contention [rating: 2.94 / 0.00] for all Coupling Facility Locals by CF Name
40
Comparisons after full implementation of “dyndisp=thin”. CF async service time also improved.

Service time for synchronous requests (microseconds)
41
For CF Name by System
Side-by-side detailed before/after comparison.

Service time for synchronous requests (microseconds)
42
For CF Name
After dyndisp=thin logical CF sync service times are below 20us.

Average CP Usage for Sync CF Requests (ms/s) for all Coupling Facility Activity by System
43
Excessive CF sync service times used ~0.5 CPs. This CP savings can translate to delayed upgrades and/or lower software licensing fees.

Coupling Facility Problem Analysis Results Summary
• Logical CF usage
Service levels were being met
But IntelliMagic Vision predictive analytics highlighted excessive
CF response times
• Recommended solution for these workloads was
implementing “dyndisp=thin”
Both sync and async service times improved dramatically
• Significant CP usage dropped
Estimated at half of a CP
44

zHPF and Coupling Facility can both have significant impact on mainframe cost and performance.
IntelliMagic has unique abilities to proactively monitor and assess these environments, and other z/OS resources such as disk and tape.
To learn more call 214-432-7920 or email [email protected]
Thank You! Web www.intellimagic.net
Conclusion