zipf's law in income distribution of companies
TRANSCRIPT

Physica A 269 (1999) 125–131www.elsevier.com/locate/physa
Zipf’s law in income distribution of companiesK. Okuyamaa , M. Takayasub , H. Takayasuc;∗
aGraduate School of Information Sciences, Tohoku University, Sendai 980-8579, JapanbFaculty of Science and Technology, Keio University, Kawasaki 211-0985, JapancSony CSL, 3-14-13 Higashigotanda, Shinagawa-ku, Tokyo 141-0022, Japan
Received 28 October 1998; received in revised form 20 January 1999
Abstract
Distribution functions of annual income of companies are analyzed based on two companydatabases. A clear power law distribution consistent with the Zipf’s law can be con�rmed forJapanese companies over more than three decades in income scale. Similar distributions canbe con�rmed in some other countries. It is con�rmed that such power laws hold in most ofjob categories with slightly modi�ed exponents. An annual income of a company is about twoorders of magnitude smaller than its total assets, and the growth rate distribution of income isnearly independent of the income size in contrast to the case of growth rate of assets. c© 1999Published by Elsevier Science B.V. All rights reserved.
PACS: 05.90.+m; 89.90.+n; 05.45.DF
Keywords: Zipf’s law; Income distribution; Growth rate of assets
1. Introduction
Interactions of companies and complicated money ows may be viewed as the mosttypical real-world examples of complex systems. It is an important basic step of scienceto check whether there are any universal laws underlying such economical activities.Here we focus our attention on the distribution of company’s income and show evi-dences that the statistics of income is following a universal law.The history of study on income distribution is very long. More than one hundred
years ago Pareto reported that personal income distribution follows a power law with apossibly universal exponent about 1.5 [1]. Gini studied income distributions of severalcountries in 1922 and found that the distributions can actually be approximated by
∗ Corresponding author.E-mail address: [email protected] (H. Takayasu)
0378-4371/99/$ - see front matter c© 1999 Published by Elsevier Science B.V. All rights reserved.PII: S 0378 -4371(99)00086 -2

126 K. Okuyama et al. / Physica A 269 (1999) 125–131
power laws but the exponents are not universal [2]. In 1931 Gibrat proposed log-normaldistributions of income based on a theoretical assumptions of multiplicative randomprocesses [3]. Mandelbrot rediscovered the power law distributions of income in 1960[5], and until now there are many open problems related to income distribution ineconomics [6].With the increasing interest on power law behaviors in connection with critical be-
haviors in physical sciences two physicists, Montroll and Shlesinger [4], pointed out intheir physics paper that income of rich people follow a power law statistics while thatof not rich people follows a log-normal distribution. The power law tails in incomedistribution have been introduced as an example of fractal behaviors in economics[7,8].A relating topic is attracting physicists’ interest recently, that is, the company size
distributions. Stanley et al. analyzed an American company’s database and found thatthe size distribution is closer to the lognormal law [9,10]. They also found a plausiblescaling relation that the standard deviation of growth rate of company size is inverselyproportional to a fractional power of its size, which is consistent with the intuitiveempirical impression that uctuation of a large company is smaller than that of asmall company. Okuyama and Takayasu analyzed an international company databaseand reported that the scaling law holds also in other countries but the company sizedistributions depend on country [11].Company size can be measured by several quantities such as assets, number of em-
ployee, or net sales. It is known that these quantities give consistent results in analysisof company size statistics [9,10]. On the other hand roughly speaking company’s in-come is de�ned by the di�erence of the net sales minus net expenses, so it can takea negative value if the net expenses exceed the net sales. Obviously, the statistics ofincome should be di�erent from assets or other quantities proportional to the companysize.In the following section we describe our databases. Main results are listed in the
Section 3 and we discuss the meaning of such income distributions in the �nal section.
2. The databases
In this study we analyze two databases. The �rst one is a data CD, “Japanesecompanies the best 85375” which is published in 1998 by a publisher Diamond Inc.in Tokyo, Japan. This CD covers all companies having annual income (to be moreprecise, the income before taxes reported to the tax o�ce) more than 40,000,000 yenare listed. Although the number of companies is very large the information for eachcompany is limited, only company’s name, its job category, and incomes for 4 years.We name this database as Data 1 in the following analysis.The other database is “Company data” distributed by Moody’s Investors Service
Inc. A pair of CDs cover more than 10,000 companies in the USA and also morethan 11,000 companies for other countries. The information for each company is rich
K. Okuyama et al. / Physica A 269 (1999) 125–131 127
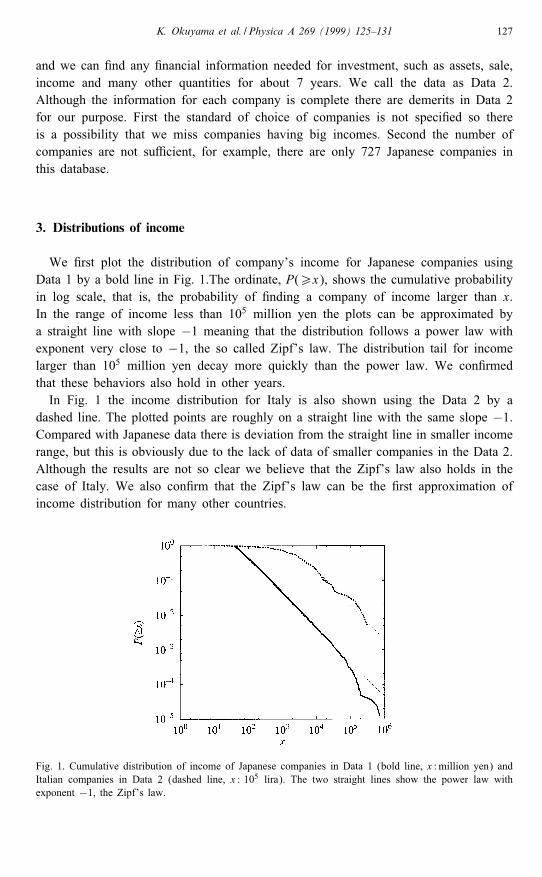
and we can �nd any �nancial information needed for investment, such as assets, sale,income and many other quantities for about 7 years. We call the data as Data 2.Although the information for each company is complete there are demerits in Data 2for our purpose. First the standard of choice of companies is not speci�ed so thereis a possibility that we miss companies having big incomes. Second the number ofcompanies are not su�cient, for example, there are only 727 Japanese companies inthis database.
3. Distributions of income
We �rst plot the distribution of company’s income for Japanese companies usingData 1 by a bold line in Fig. 1.The ordinate, P(¿x), shows the cumulative probabilityin log scale, that is, the probability of �nding a company of income larger than x.In the range of income less than 105 million yen the plots can be approximated bya straight line with slope −1 meaning that the distribution follows a power law withexponent very close to −1, the so called Zipf’s law. The distribution tail for incomelarger than 105 million yen decay more quickly than the power law. We con�rmedthat these behaviors also hold in other years.In Fig. 1 the income distribution for Italy is also shown using the Data 2 by a
dashed line. The plotted points are roughly on a straight line with the same slope −1.Compared with Japanese data there is deviation from the straight line in smaller incomerange, but this is obviously due to the lack of data of smaller companies in the Data 2.Although the results are not so clear we believe that the Zipf’s law also holds in thecase of Italy. We also con�rm that the Zipf’s law can be the �rst approximation ofincome distribution for many other countries.
Fig. 1. Cumulative distribution of income of Japanese companies in Data 1 (bold line, x : million yen) andItalian companies in Data 2 (dashed line, x : 105 lira). The two straight lines show the power law withexponent −1, the Zipf’s law.

128 K. Okuyama et al. / Physica A 269 (1999) 125–131
Fig. 2. Income distribution of USA in Data 2 (x : thousand dollars). The dotted line shows the power lawwith exponent −1:4.
Fig. 3. Income distribution of three categories in Japan; construction (bold line), electrical products (dashedline) and power companies (dotted line). The number of data points is 11805, 2374 and 175, respectively.The least-squares �t gives a power law with exponent −1:13 for construction companies (dotted straightline) and −0:72 for Electrical products companies (dash-dot line).
There are exceptions, for example, in the case of USA it is impossible to approximatethe plots by the Zipf’s law as shown in Fig. 2. If we dare to approximate the tail part ofthis distribution by a power law the estimated slope is about −1:4, which coincides withthat of Montroll and Shlesinger [4]. This result may mean that the income distributionof USA is signi�cantly di�erent from that of Japan, or there may be many companieshaving rather large incomes but they are missed in Data 2 by some reason. With thedata now available for us we cannot conclude which is correct.Next, we observe the income distribution in each job category based on Data 1.
Fig. 3 shows the income distributions of typical three job categories; construction,electrical products, and power companies, respectively. As typically represented bythe curves for construction and electrical products we have power laws in many job

K. Okuyama et al. / Physica A 269 (1999) 125–131 129
Fig. 4. (a) Probability density of income growth rates. The points are distinguished according to their incomesize x into �ve categories to clarify the size dependence. The dotted lines are �tting by exponential functions.(b) The standard deviation of income growth rate distribution as a function of income in log–log scale. Thedotted line shows the best-�t line by the least-squares method. The estimated slope 0.024 can be regardedas 0.
categories. The exponents of the power law scatter around −1 but typically in therange of (−1:2;−0:7). The job categories showing clear power laws other than thesetwo are wholesale, land transport, machine, real estate, service, foods, steel, etc.There are exceptions, for example, the dotted curve for power companies in Fig. 3
clearly deviates from a power law. Such deviations from the power law can be con-�rmed in the job categories of banks, insurance companies, and medicine companies.For other countries income distributions divided into job categories look similar to
that of entire jobs, but the number of data points are not so large and we can notelucidate any clear result from Data 2.In the case of assets Stanley et al. discovered an interesting scaling relation on the
statistics of assets growth rate that the distribution of growth rates is approximatedby a tent-shaped probability density of which standard deviation is proportional to aninverse fractional power of assets [9,10]. We check whether such relation can alsobe found in the statistics of income. Let x(t) be a company’s income at year t. Weobserve the ratio of incomes of successive years in log-scale
r = logx(t + 1)x(t)
: (1)
Here, we neglect the data with negative incomes. In Fig. 4(a) the distribution of ris plotted in semi-log scale. As seen from this �gure the probability densities areapproximated nicely by a tent-shaped function like the case of assets. However, incontrast to the case of assets there is no obvious size dependence in the plot. The sizedependence of probability density is characterized by the plot of the standard deviationas a function of income size. From Fig. 4(b) we cannot �nd any coherent relationand we conclude that the standard deviation is approximately independent of income.Namely, the statistics of growth rate of assets and that of income is signi�cantlydi�erent.

130 K. Okuyama et al. / Physica A 269 (1999) 125–131
Fig. 5. (a) Net sales vs. assets of Japanese companies in log–log scale (million yen). The dotted line showsthe best-�t line by the least-squares method. The estimated relation is given by Eq. (2). (b) Income vs.assets of Japanese companies in log–log scale (million yen). The dotted line shows the best-�t line by theleast-squares method. The estimated relation is given by Eq. (4).
In order to clarify the di�erence of income and assets we next clarify the relationof these quantities using Japanese company data in Data 2. Fig. 5(a) represents therelation of net sales vs. assets in log–log scale. The plotted points indicate that net salesis roughly equal to assets, but the least-squares �tting suggests a non-trivial averagedbehavior
S = 2:9A0:90 ; (2)
where S is the averaged net sales and A is the corresponding assets (both measuredin million yen). As for net expenses we have roughly a similar relation with slightlydi�erent parameters
E = 1:5A0:92 ; (3)
where E is the averaged net expense (measured in million yen). In Fig. 5(b) we showthe relation of income vs. assets. As an income of a company is roughly given by thenet sales minus net expenses, the plots of income are much more scattered than thecase of Fig. 5(a). By a very rough estimation the income is about two orders smallerthan the quantities representing company sizes such as assets, net sales or net expenses.The least-squares method gives the following relation as an average:
I = 0:78A0:85 ; (4)
where I is the averaged income (measured in million yen). Similar relations can becon�rmed also for other countries such as USA and Italy. As incomes are generallyabout two orders of magnitude smaller than assets we believe that our result is notcontradicting with Stanley et al.’s empirical relation that growth rates of assets dependon the magnitude of assets [9,10].
K. Okuyama et al. / Physica A 269 (1999) 125–131 131
4. Discussion
The main result of this paper is symbolized by Fig. 1, the clear evidence that theZipf’s law holds for the distribution of income of all companies. Although there hasbeen no theoretical explanation for this empirical law, it is very likely that competitiveinteractions among companies may be playing an important role. This estimation isderived by considering the job categories in which the power laws do not hold. InJapan, banks, insurance companies and power companies are considered to have specialsocial position. For example, assume that two electric power companies compete in acity and as a result one company collapsed, then it is likely that many people in thecity will not have electric power for a while. To avoid such tragedy there have beenmany restrictions by laws not to make much competition among companies havingspecial social positions. On the other hand, in job categories in which competitionamong companies of various sizes are allowed such as wholesales or constructioncompanies we have rather clear power law behaviors. Thus we believe that the powerlaw distribution is very closely related with underlying competition mechanisms. Inorder to understand the meaning of this power law we need to develop a numericalmodel which is consistent with all empirical laws.
References
[1] V. Pareto, Le Cours d’ �Economie Politique, Macmillan, London, pp. 1896–1897.[2] C. Gini, Indici di concentrazione e di dipendenza, Biblioteca delli’economista 20 (1922) 77.[3] R. Gibrat, Les In�egalit�es �Economiques, Sirey, Paris, 1931.[4] E.W. Montroll, M.F. Shlesinger, J. Stat. Phys. 32 (1983) 209.[5] B.B. Mandelbrot, Int. Econom. Rev. 1 (1960) 79.[6] A.H.Q.M. Merkies, I.J. Steyn, Econom. Lett. 43 (1993) 177.[7] B.B. Mandelbrot, The Fractal Geometry of Nature, W.H. Freeman, San Francisco, 1982.[8] H. Takayasu, Fractals in the Physical Sciences, Wiley, Sussex, 1992.[9] M.H.R. Stanley, L.A.N. Amaral, S.V. Buldyrev, S.V. Havlin, H. Leschhron, P. Maass, M.A. Salinger,
H.E. Stanley, Nature 397 (1996) 804.[10] L.A.N. Amral, S.V. Buldyrev, S. Havlin, H. Leschhorn, P. Maass, M.A. Salinger, H.E. Stanley,
M.H.R. Stanley, J. Phys. I France 7 (1997) 621.[11] H. Takayasu, K. Okuyama, Fractals 6 (1998) 67.