zambia 2008 district profile for kasama
TRANSCRIPT
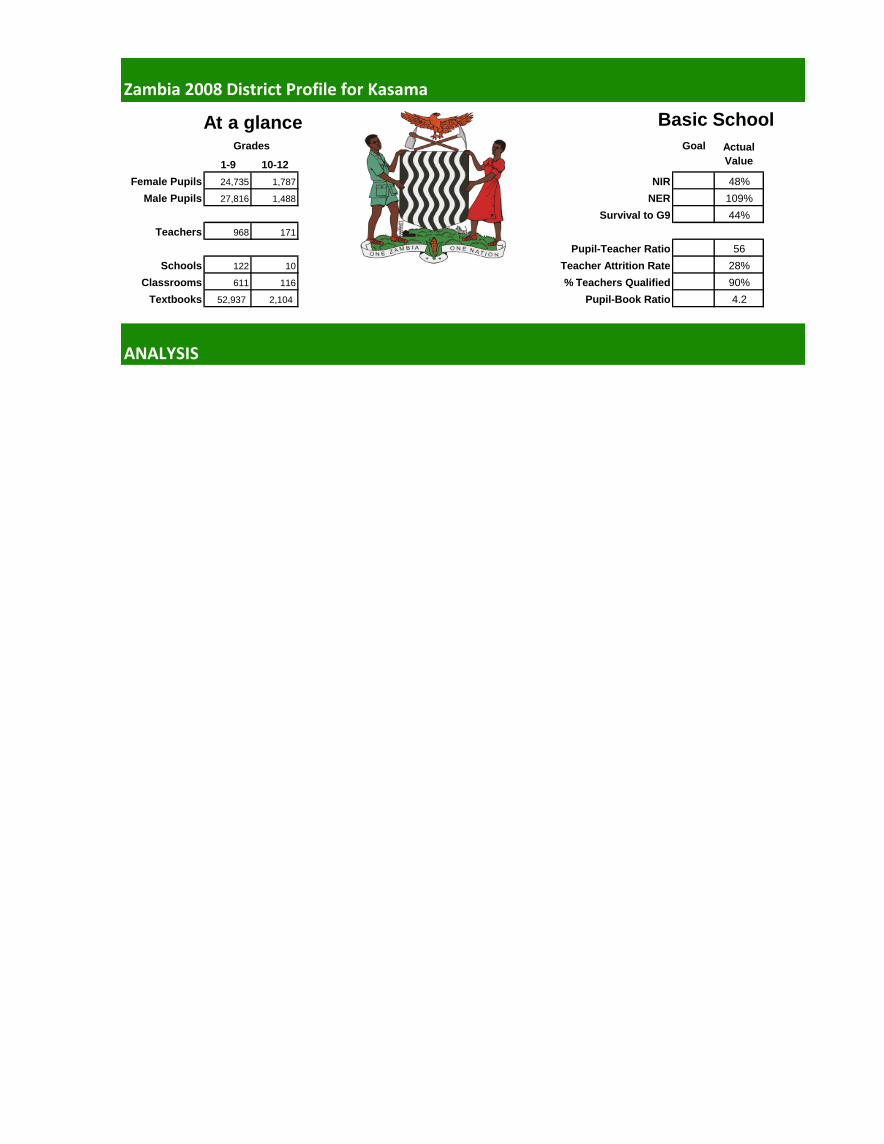
Zambia 2008 District Profile for Kasama
Goal
1-9 10-12
Female Pupils 24,735 1,787 NIR 48%
Male Pupils 27,816 1,488 NER 109%
Survival to G9 44%
Teachers 968 171
Pupil-Teacher Ratio 56
Schools 122 10 Teacher Attrition Rate 28%
Classrooms 611 116 % Teachers Qualified 90%
Textbooks 52,937 2,104 Pupil-Book Ratio 4.2
ANALYSIS
Grades Actual
Value
Basic School At a glance


Issue #1: Progress in primary school enrolment in Kasama
Since 2005 in Kasama:
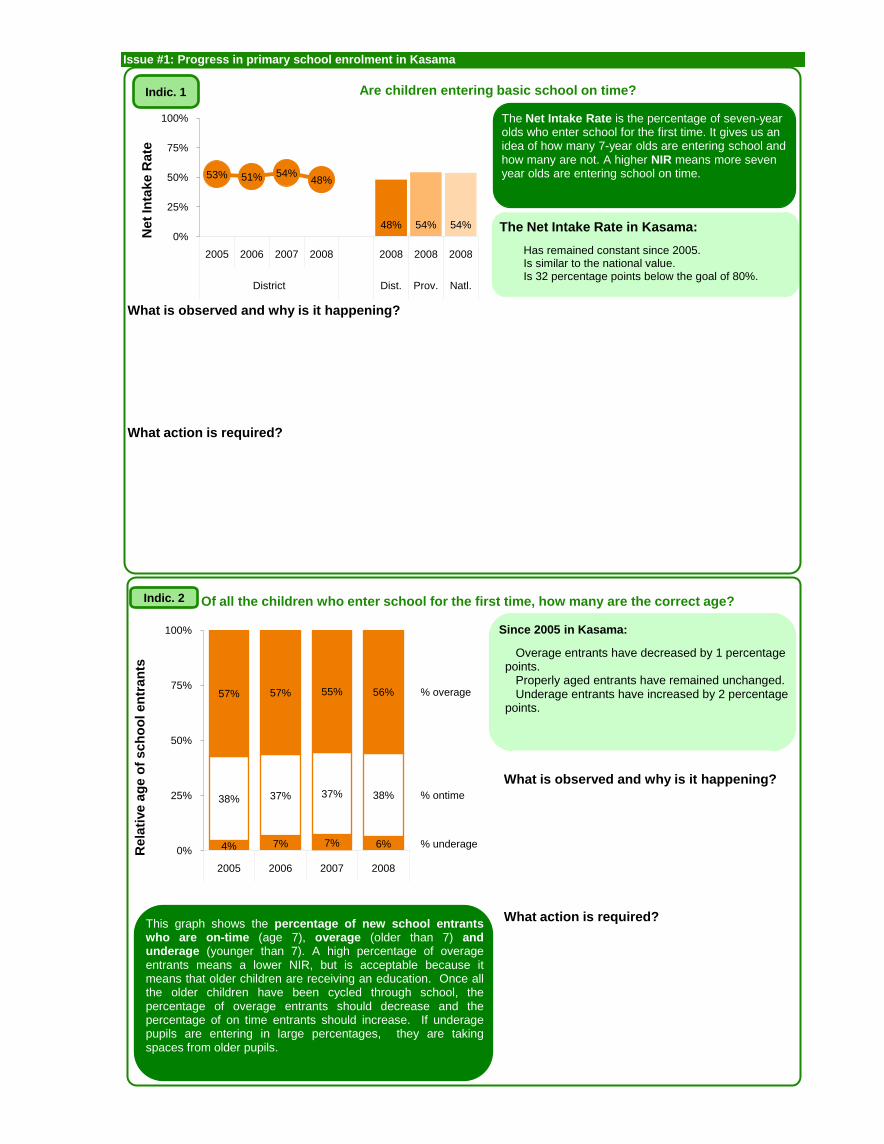
The Net Intake Rate is the percentage of seven-year olds who enter school for the first time. It gives us an idea of how many 7-year olds are entering school and how many are not. A higher NIR means more seven year olds are entering school on time.
What is observed and why is it happening?
What action is required?
Are children entering basic school on time?
Net
Inta
ke R
ate
The Net Intake Rate in Kasama:
Has remained constant since 2005.Is similar to the national value.Is 32 percentage points below the goal of 80%.
48% 54% 54%
53% 51% 54%48%
0%
25%
50%
75%
100%
2005 2006 2007 2008 2008 2008 2008
District Dist. Prov. Natl.
Indic. 1
This graph shows the percentage of new school entrantswho are on-time (age 7), overage (older than 7) andunderage (younger than 7). A high percentage of overageentrants means a lower NIR, but is acceptable because itmeans that older children are receiving an education. Once allthe older children have been cycled through school, thepercentage of overage entrants should decrease and thepercentage of on time entrants should increase. If underagepupils are entering in large percentages, they are takingspaces from older pupils.
Of all the children who enter school for the first time, how many are the correct age?Indic. 2
What is observed and why is it happening?
What action is required?
4% 7% 7% 6%
38% 37% 37% 38%
57% 57% 55% 56%
% underage
% ontime
% overage
0%
25%
50%
75%
100%
2005 2006 2007 2008
Overage entrants have decreased by 1 percentage points.
Properly aged entrants have remained unchanged.Underage entrants have increased by 2 percentage
points.
Rela
tive a
ge
of
sc
ho
ol en
tra
nts
What is observed and why is it happening?
What action is required?
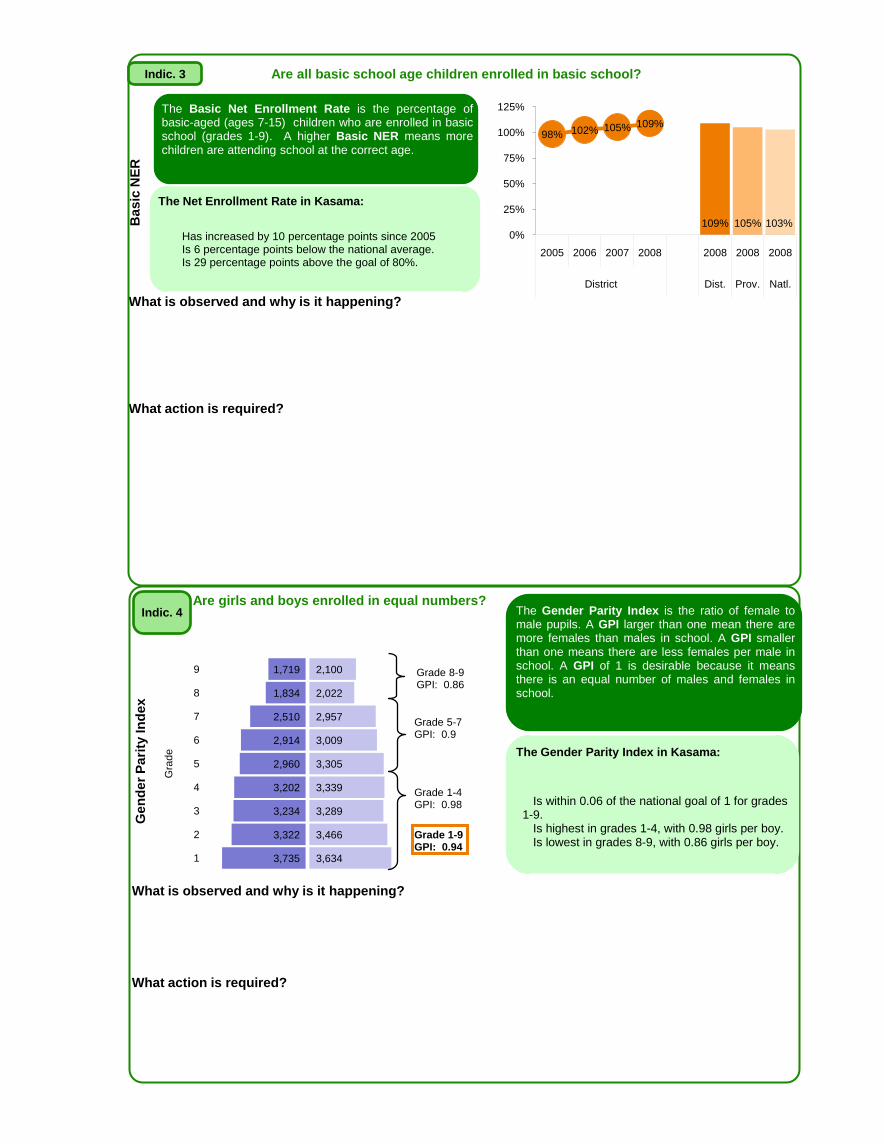
Are all basic school age children enrolled in basic school?
Ba
sic
NE
R
The Net Enrollment Rate in Kasama:
Has increased by 10 percentage points since 2005Is 6 percentage points below the national average.Is 29 percentage points above the goal of 80%.
109% 105% 103%
98% 102% 105% 109%
0%
25%
50%
75%
100%
125%
2005 2006 2007 2008 2008 2008 2008
District Dist. Prov. Natl.
The Basic Net Enrollment Rate is the percentage ofbasic-aged (ages 7-15) children who are enrolled in basicschool (grades 1-9). A higher Basic NER means morechildren are attending school at the correct age.
Indic. 3
3,634
3,466
3,289
3,339
3,305
3,009
2,957
2,022
2,100
3,735
3,322
3,234
3,202
2,960
2,914
2,510
1,834
1,719
1
2
3
4
5
6
7
8
9
Gra
de
Are girls and boys enrolled in equal numbers?Indic. 4
The Gender Parity Index in Kasama:
Is within 0.06 of the national goal of 1 for grades 1-9.
Is highest in grades 1-4, with 0.98 girls per boy.Is lowest in grades 8-9, with 0.86 girls per boy.
The Gender Parity Index is the ratio of female tomale pupils. A GPI larger than one mean there aremore females than males in school. A GPI smallerthan one means there are less females per male inschool. A GPI of 1 is desirable because it meansthere is an equal number of males and females inschool.
What is observed and why is it happening?
What action is required?
Ge
nd
er
Pari
ty In
dex
Grade 1-9GPI: 0.94
Grade 8-9GPI: 0.86
Grade 5-7GPI: 0.9
Grade 1-4GPI: 0.98
ISSUE #2: Efficiency in Kasama
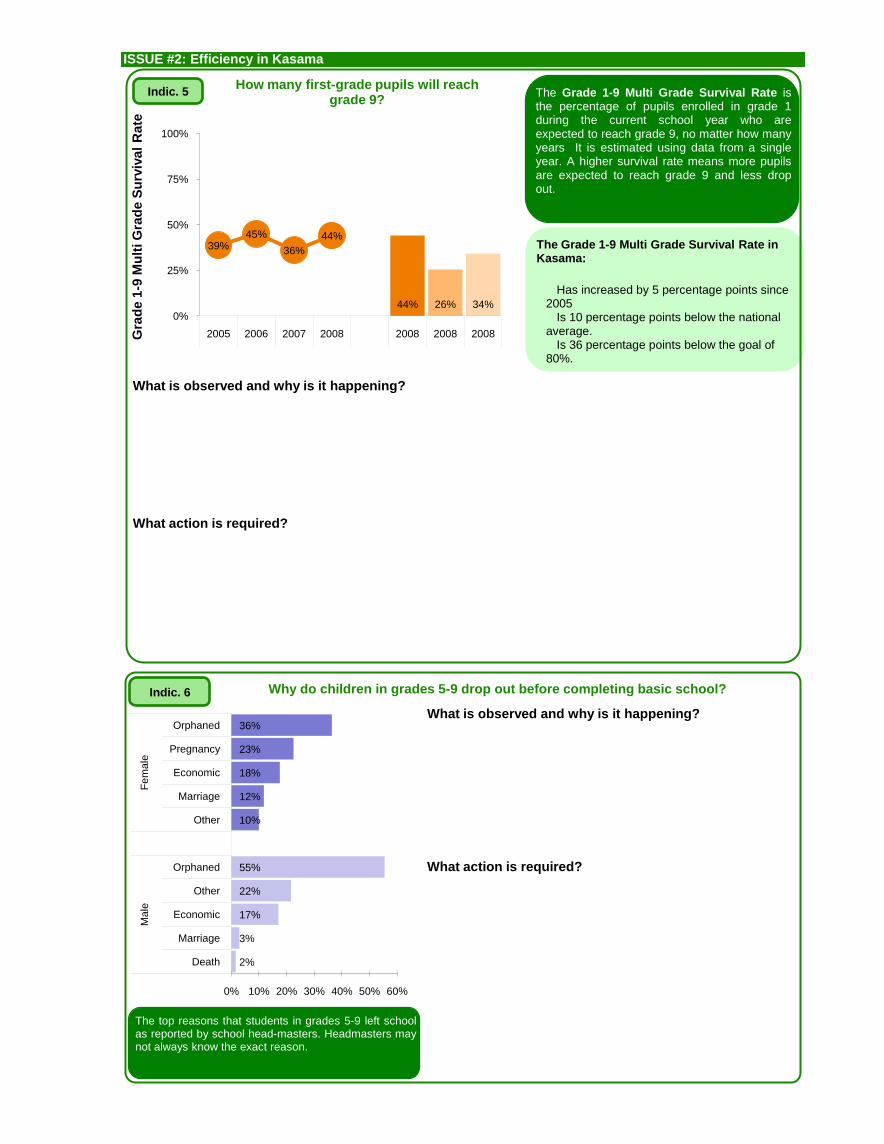
The Grade 1-9 Multi Grade Survival Rate isthe percentage of pupils enrolled in grade 1during the current school year who areexpected to reach grade 9, no matter how manyyears It is estimated using data from a singleyear. A higher survival rate means more pupilsare expected to reach grade 9 and less dropout.
What is observed and why is it happening?
What action is required?
How many first-grade pupils will reach grade 9?
Gra
de
1-9
Mu
lti G
rad
e S
urv
iva
l R
ate
The top reasons that students in grades 5-9 left schoolas reported by school head-masters. Headmasters maynot always know the exact reason.
What is observed and why is it happening?
What action is required?
Why do children in grades 5-9 drop out before completing basic school?
The Grade 1-9 Multi Grade Survival Rate in Kasama:
Has increased by 5 percentage points since 2005
Is 10 percentage points below the national average.
Is 36 percentage points below the goal of 80%.
44% 26% 34%
39%45%
36%
44%
0%
25%
50%
75%
100%
2005 2006 2007 2008 2008 2008 2008
Indic. 5
Indic. 6
2%
3%
17%
22%
55%
10%
12%
18%
23%
36%
0% 10% 20% 30% 40% 50% 60%
Death
Marriage
Economic
Other
Orphaned
Other
Marriage
Economic
Pregnancy
Orphaned
Male
Fem
ale
100%
107%
111%
117%
108%
111%
113%
98%
105%
Urban
100%
88%
78%
75%
69%
59%
51%
29%
27%
Rural
100% 50% 0 50% 100%
Grade 1
Grade 2
Grade 3
Grade 4
Grade 5
Grade 6
Grade 7
Grade 8
Grade 9
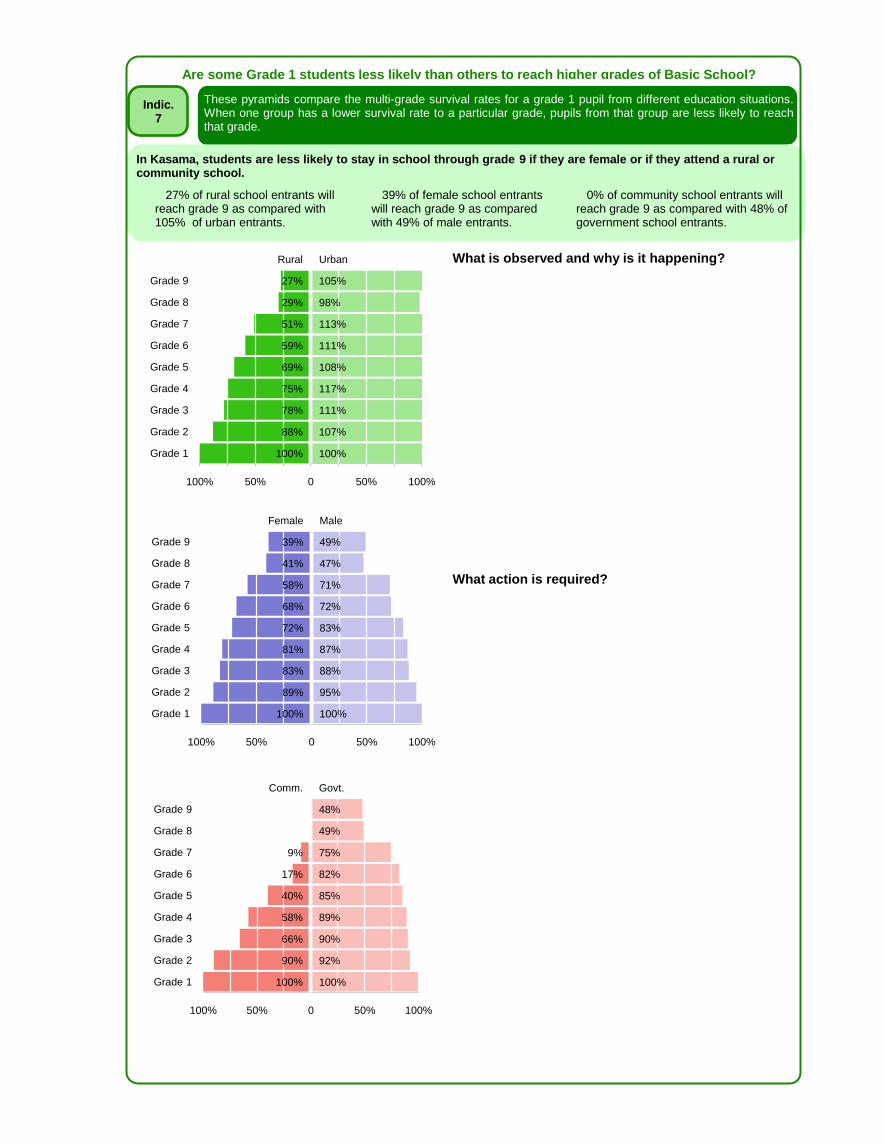
Are some Grade 1 students less likely than others to reach higher grades of Basic School?
These pyramids compare the multi-grade survival rates for a grade 1 pupil from different education situations.When one group has a lower survival rate to a particular grade, pupils from that group are less likely to reachthat grade.
What is observed and why is it happening?
What action is required?
In Kasama, students are less likely to stay in school through grade 9 if they are female or if they attend a rural or community school.
27% of rural school entrants will reach grade 9 as compared with 105% of urban entrants.
39% of female school entrants will reach grade 9 as compared with 49% of male entrants.
0% of community school entrants will reach grade 9 as compared with 48% of government school entrants.
Indic.7
100%
95%
88%
87%
83%
72%
71%
47%
49%
Male
100%
89%
83%
81%
72%
68%
58%
41%
39%
Female
100% 50% 0 50% 100%
Grade 1
Grade 2
Grade 3
Grade 4
Grade 5
Grade 6
Grade 7
Grade 8
Grade 9
100%
92%
90%
89%
85%
82%
75%
49%
48%
Govt.
100%
90%
66%
58%
40%
17%
9%
Comm.
100% 50% 0 50% 100%
Grade 1
Grade 2
Grade 3
Grade 4
Grade 5
Grade 6
Grade 7
Grade 8
Grade 9
ISSUE #3: Are children learning?
What is observed and why is it happening?
What action is required?
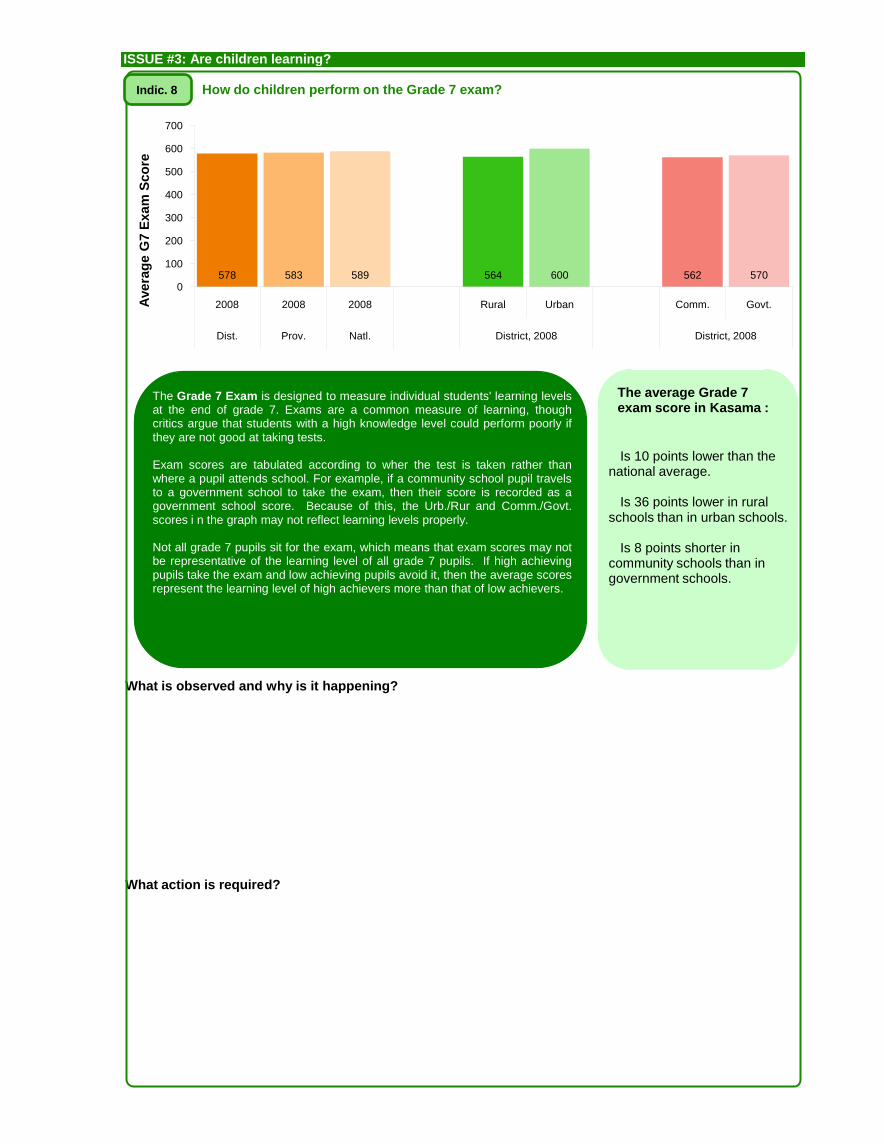
How do children perform on the Grade 7 exam?
The Grade 7 Exam is designed to measure individual students' learning levelsat the end of grade 7. Exams are a common measure of learning, thoughcritics argue that students with a high knowledge level could perform poorly ifthey are not good at taking tests.
Exam scores are tabulated according to wher the test is taken rather thanwhere a pupil attends school. For example, if a community school pupil travelsto a government school to take the exam, then their score is recorded as agovernment school score. Because of this, the Urb./Rur and Comm./Govt.scores i n the graph may not reflect learning levels properly.
Not all grade 7 pupils sit for the exam, which means that exam scores may notbe representative of the learning level of all grade 7 pupils. If high achievingpupils take the exam and low achieving pupils avoid it, then the average scoresrepresent the learning level of high achievers more than that of low achievers.
The average Grade 7 exam score in Kasama :
Is 10 points lower than the national average.
Is 36 points lower in rural schools than in urban schools.
Is 8 points shorter in community schools than in government schools.
Indic. 8
578 583 589 564 600 562 5700
100
200
300
400
500
600
700
2008 2008 2008 Rural Urban Comm. Govt.
Dist. Prov. Natl. District, 2008 District, 2008
Avera
ge
G7
Exa
m S
co
re
Issue #4: How are school resources distributed in Kasama ?
What is observed and why is it happening?
What action is required?
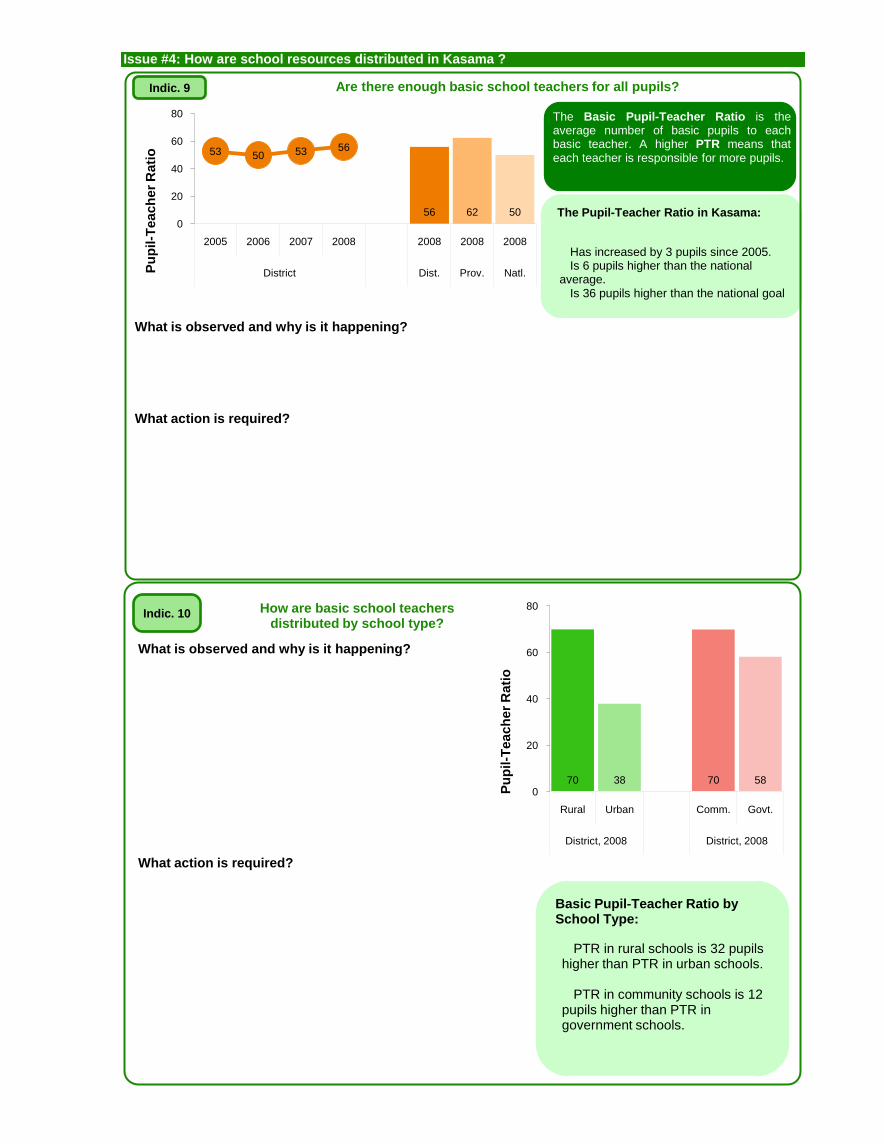
Are there enough basic school teachers for all pupils?
Pu
pil-T
ea
ch
er
Rati
o
How are basic school teachersdistributed by school type?
What is observed and why is it happening?
What action is required?
The Basic Pupil-Teacher Ratio is theaverage number of basic pupils to eachbasic teacher. A higher PTR means thateach teacher is responsible for more pupils.
The Pupil-Teacher Ratio in Kasama:
Has increased by 3 pupils since 2005.Is 6 pupils higher than the national
average.Is 36 pupils higher than the national goal
Basic Pupil-Teacher Ratio by School Type:
PTR in rural schools is 32 pupils higher than PTR in urban schools.
PTR in community schools is 12 pupils higher than PTR in government schools.
56 62 50
53 50 53 56
0
20
40
60
80
2005 2006 2007 2008 2008 2008 2008
District Dist. Prov. Natl.
70 38 70 580
20
40
60
80
Rural Urban Comm. Govt.
District, 2008 District, 2008
Indic. 9
Indic. 10
Pu
pil-T
ea
ch
er
Rati
o
<= 39 40-59 60-119 >= 120 Total
25 26 62 14 128
PTR
# Schools
125
127
130
131
133
134
142
145
146
149
150
180
198
250
72
73
73
73
74
74
75
75
76
77
78
80
80
82
84
86
87
87
89
89
89
91
91
92
93
95
97
97
97
98
100
103
105
106
109
112
114
116
117
120
0 50 100 150 200 250 300
Kateshi
Kapanda Lower Basic
Luyeye
Chiwala
Chishipula Community School
Chanda Mukulu
Masuba Community School
Lukulu South Iri
Munkonge
Chilufya
Shimumbo Primary
Muchanga Community School
Ngoli Primary
Tibi Upper Basic
Kashinka
Chanda Kopa Community
Mponda Community School
Kasenga
Mankalala Community
Kancule
Ntumpa
Nyola Community School
Mwamba
Milenge
Misengo
Kankonshi
Kafula
Mubanga Lupiya
Kasonde Chisuna
Chileshe Mwamba
Pontini
Chisanga Mwamba Community …
Kondamu Community
Chitambi M. Basic
Mapango Community
Chafwa
Mumbi Mukulu
Lwabwe M. Basic
Nkole Mwanakulya
Chimalilo Community
Chilubanama
Ndoloka
Mwelwa
Mumbimfumu
Chitila
Nkolemfumu
Katampa Community
Mukumbe
Musenga Community School
Nkunkulusha Community School
Kalolesha Community
Mulanshi M. Basic
Mulumika
Moboshi Community School
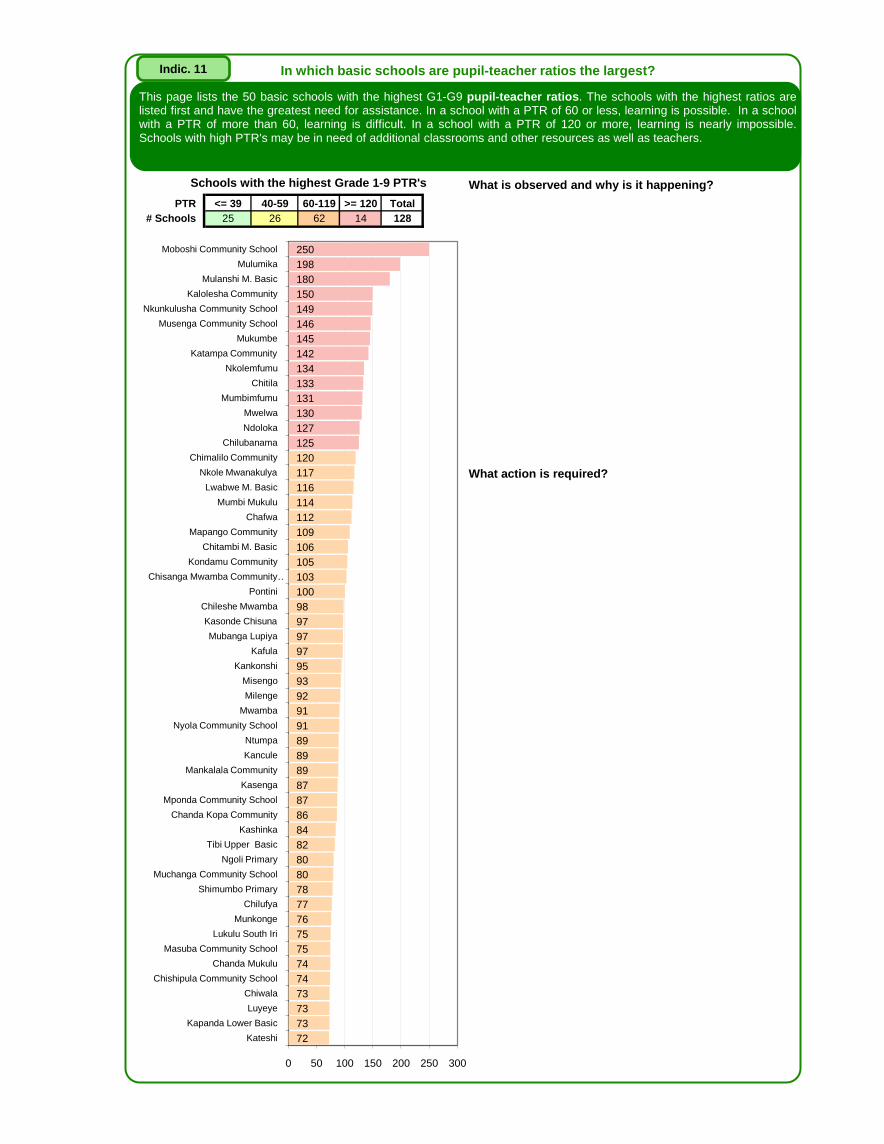
Schools with the highest Grade 1-9 PTR's
In which basic schools are pupil-teacher ratios the largest?
What is observed and why is it happening?
What action is required?
Indic. 11
This page lists the 50 basic schools with the highest G1-G9 pupil-teacher ratios. The schools with the highest ratios arelisted first and have the greatest need for assistance. In a school with a PTR of 60 or less, learning is possible. In a schoolwith a PTR of more than 60, learning is difficult. In a school with a PTR of 120 or more, learning is nearly impossible.Schools with high PTR's may be in need of additional classrooms and other resources as well as teachers.
Teach
er
Att
riti
on
Rate
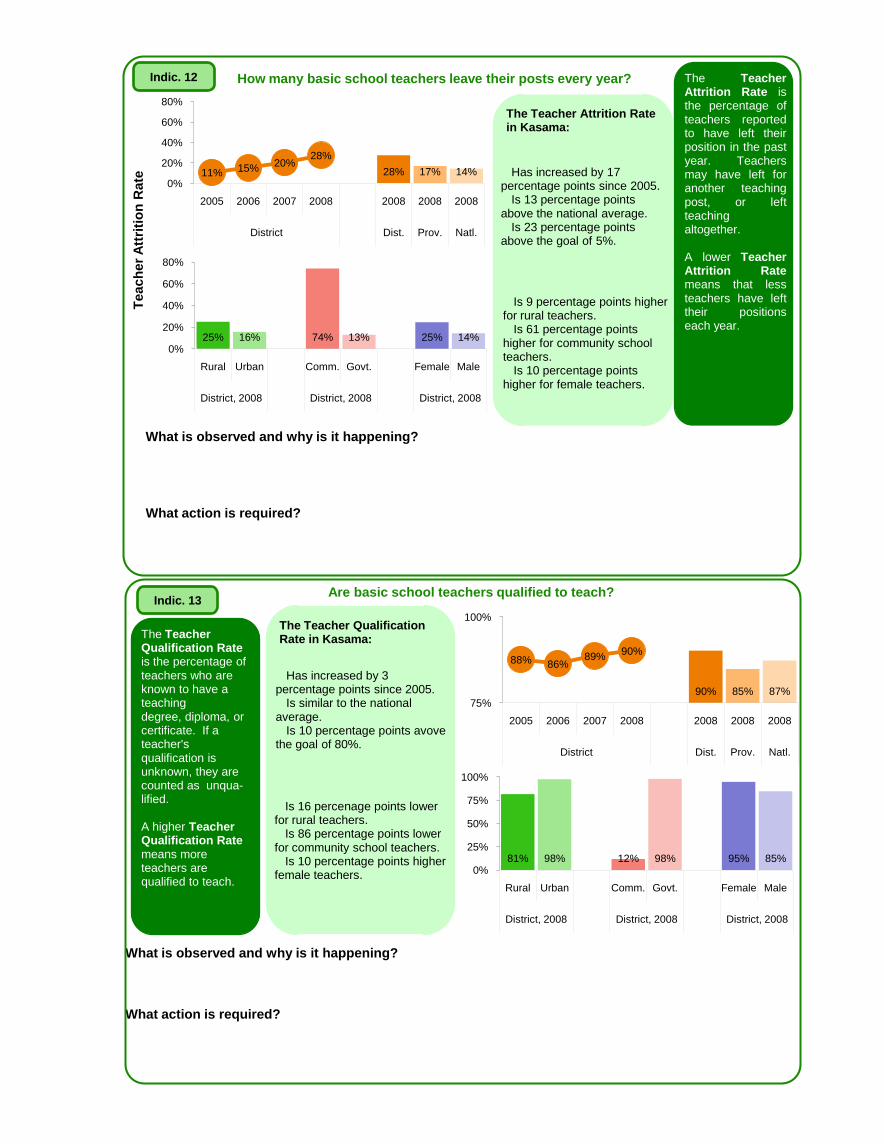
How many basic school teachers leave their posts every year? The TeacherAttrition Rate isthe percentage ofteachers reportedto have left theirposition in the pastyear. Teachersmay have left foranother teachingpost, or leftteachingaltogether.
A lower TeacherAttrition Ratemeans that lessteachers have lefttheir positionseach year.
What is observed and why is it happening?
What action is required?
Are basic school teachers qualified to teach?
The Teacher Qualification Rateis the percentage of teachers who are known to have a teaching degree, diploma, or certificate. If a teacher's qualification is unknown, they are counted as unqua-lified.
A higher Teacher Qualification Rate means more teachers are qualified to teach.
What is observed and why is it happening?
What action is required?
25% 16% 74% 13% 25% 14%0%
20%
40%
60%
80%
Rural Urban Comm. Govt. Female Male
District, 2008 District, 2008 District, 2008
28% 17% 14%11% 15%20%
28%
0%
20%
40%
60%
80%
2005 2006 2007 2008 2008 2008 2008
District Dist. Prov. Natl.
81% 98% 12% 98% 95% 85%0%
25%
50%
75%
100%
Rural Urban Comm. Govt. Female Male
District, 2008 District, 2008 District, 2008
90% 85% 87%
88% 86%89%
90%
75%
100%
2005 2006 2007 2008 2008 2008 2008
District Dist. Prov. Natl.
The Teacher Attrition Rate in Kasama:
Has increased by 17 percentage points since 2005.
Is 13 percentage points above the national average.
Is 23 percentage points above the goal of 5%.
Is 9 percentage points higher for rural teachers.
Is 61 percentage points higher for community school teachers.
Is 10 percentage points higher for female teachers.
The Teacher Qualification Rate in Kasama:
Has increased by 3 percentage points since 2005.
Is similar to the national average.
Is 10 percentage points avove the goal of 80%.
Is 16 percenage points lower for rural teachers.
Is 86 percentage points lower for community school teachers.
Is 10 percentage points higher female teachers.
Indic. 12
Indic. 13
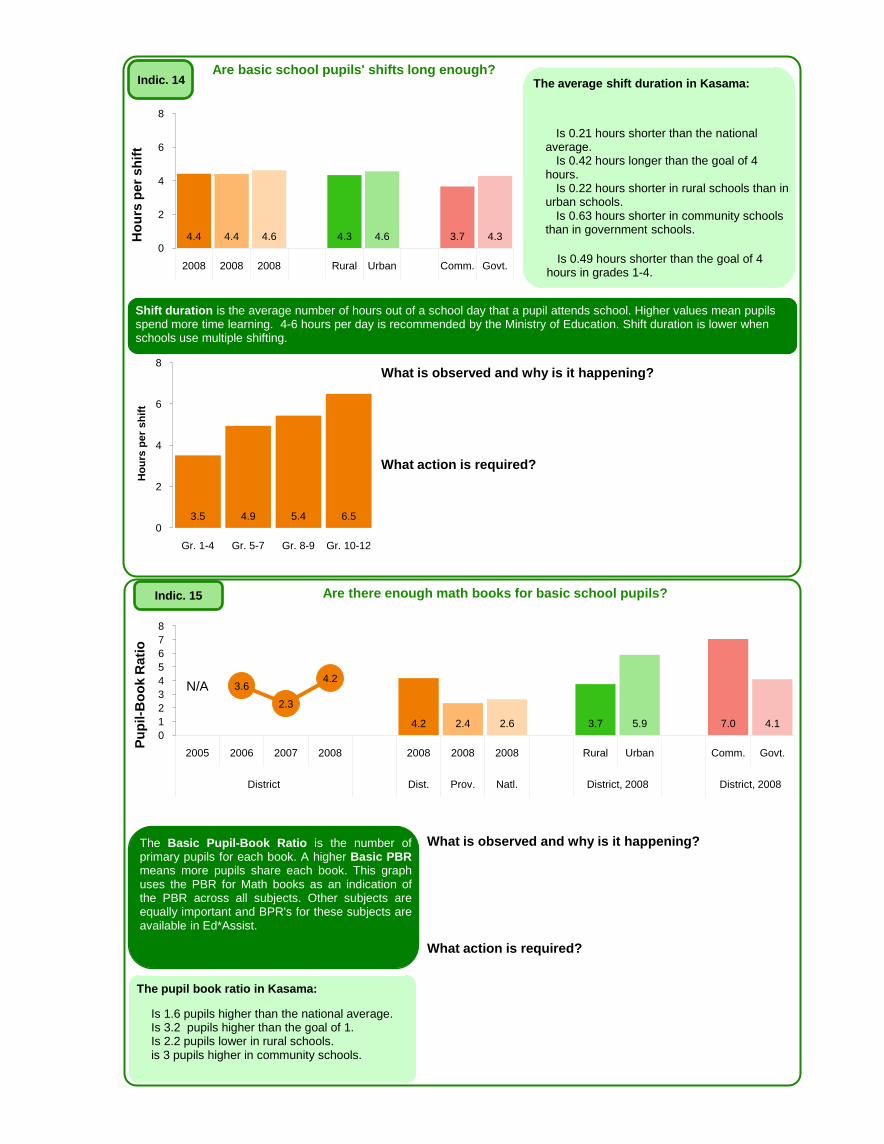
Are there enough math books for basic school pupils?
Pu
pil-B
oo
k R
ati
o
The Basic Pupil-Book Ratio is the number ofprimary pupils for each book. A higher Basic PBRmeans more pupils share each book. This graphuses the PBR for Math books as an indication ofthe PBR across all subjects. Other subjects areequally important and BPR's for these subjects areavailable in Ed*Assist.
What is observed and why is it happening?
What action is required?
The pupil book ratio in Kasama:
Is 1.6 pupils higher than the national average.Is 3.2 pupils higher than the goal of 1.Is 2.2 pupils lower in rural schools.is 3 pupils higher in community schools.
Indic. 15
4.2 2.4 2.6 3.7 5.9 7.0 4.1
N/A 3.6
2.3
4.2
0
1
2
3
4
5
6
7
8
2005 2006 2007 2008 2008 2008 2008 Rural Urban Comm. Govt.
District Dist. Prov. Natl. District, 2008 District, 2008
3.5 4.9 5.4 6.50
2
4
6
8
Gr. 1-4 Gr. 5-7 Gr. 8-9 Gr. 10-12
Ho
urs
per
sh
ift
4.4 4.4 4.6 4.3 4.6 3.7 4.30
2
4
6
8
2008 2008 2008 Rural Urban Comm. Govt.
Ho
urs
per
sh
ift
Are basic school pupils' shifts long enough?
Shift duration is the average number of hours out of a school day that a pupil attends school. Higher values mean pupils spend more time learning. 4-6 hours per day is recommended by the Ministry of Education. Shift duration is lower when schools use multiple shifting.
What is observed and why is it happening?
What action is required?
Indic. 14 The average shift duration in Kasama:
Is 0.21 hours shorter than the national average.
Is 0.42 hours longer than the goal of 4 hours.
Is 0.22 hours shorter in rural schools than in urban schools.
Is 0.63 hours shorter in community schools than in government schools.
Is 0.49 hours shorter than the goal of 4 hours in grades 1-4.
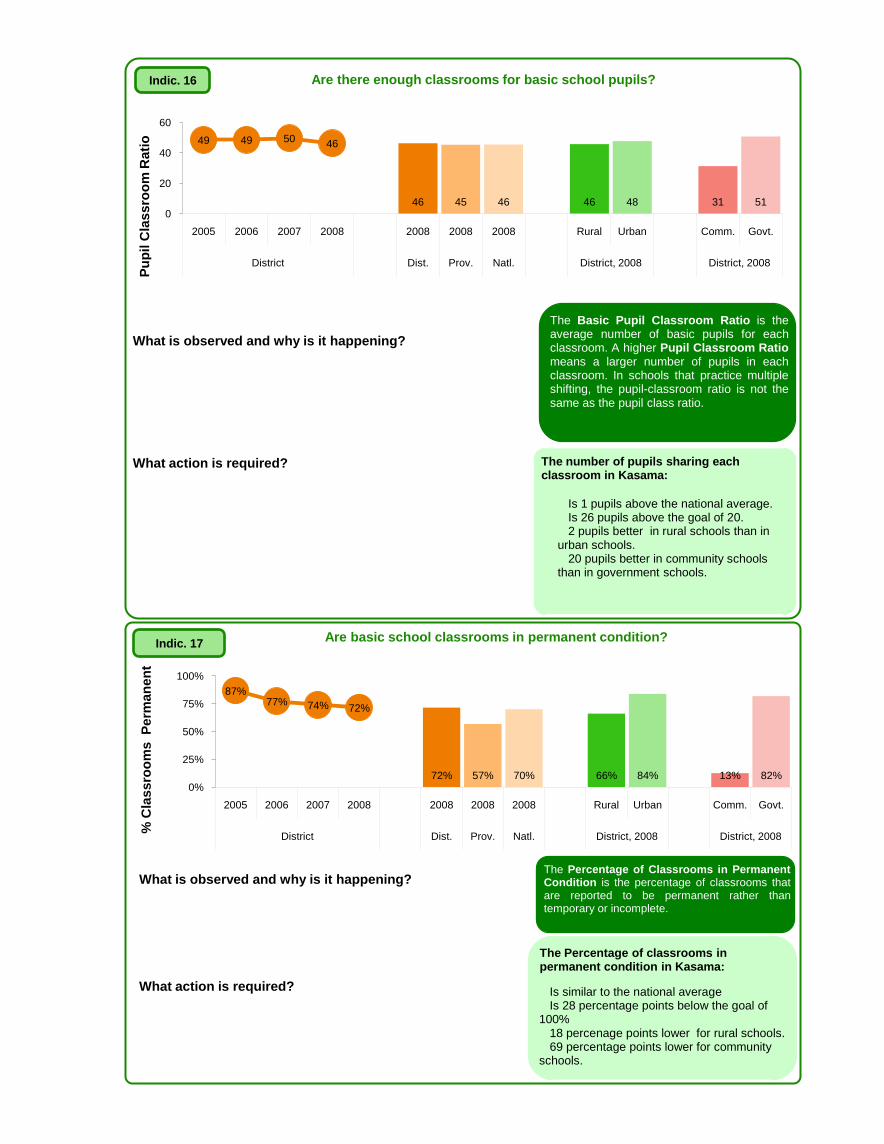
Are there enough classrooms for basic school pupils?
Pu
pil C
las
sro
om
Rati
o
The Basic Pupil Classroom Ratio is theaverage number of basic pupils for eachclassroom. A higher Pupil Classroom Ratiomeans a larger number of pupils in eachclassroom. In schools that practice multipleshifting, the pupil-classroom ratio is not thesame as the pupil class ratio.
What is observed and why is it happening?
What action is required?
Are basic school classrooms in permanent condition?
% C
las
sro
om
s P
erm
an
en
t
The Percentage of Classrooms in PermanentCondition is the percentage of classrooms thatare reported to be permanent rather thantemporary or incomplete.
What is observed and why is it happening?
What action is required?
Indic. 16
Indic. 17
The number of pupils sharing each classroom in Kasama:
Is 1 pupils above the national average.Is 26 pupils above the goal of 20.2 pupils better in rural schools than in
urban schools.20 pupils better in community schools
than in government schools.
The Percentage of classrooms in permanent condition in Kasama:
Is similar to the national averageIs 28 percentage points below the goal of
100%18 percenage points lower for rural schools.69 percentage points lower for community
schools.
46 45 46 46 48 31 51
49 49 5046
0
20
40
60
2005 2006 2007 2008 2008 2008 2008 Rural Urban Comm. Govt.
District Dist. Prov. Natl. District, 2008 District, 2008
72% 57% 70% 66% 84% 13% 82%
87%77% 74% 72%
0%
25%
50%
75%
100%
2005 2006 2007 2008 2008 2008 2008 Rural Urban Comm. Govt.
District Dist. Prov. Natl. District, 2008 District, 2008
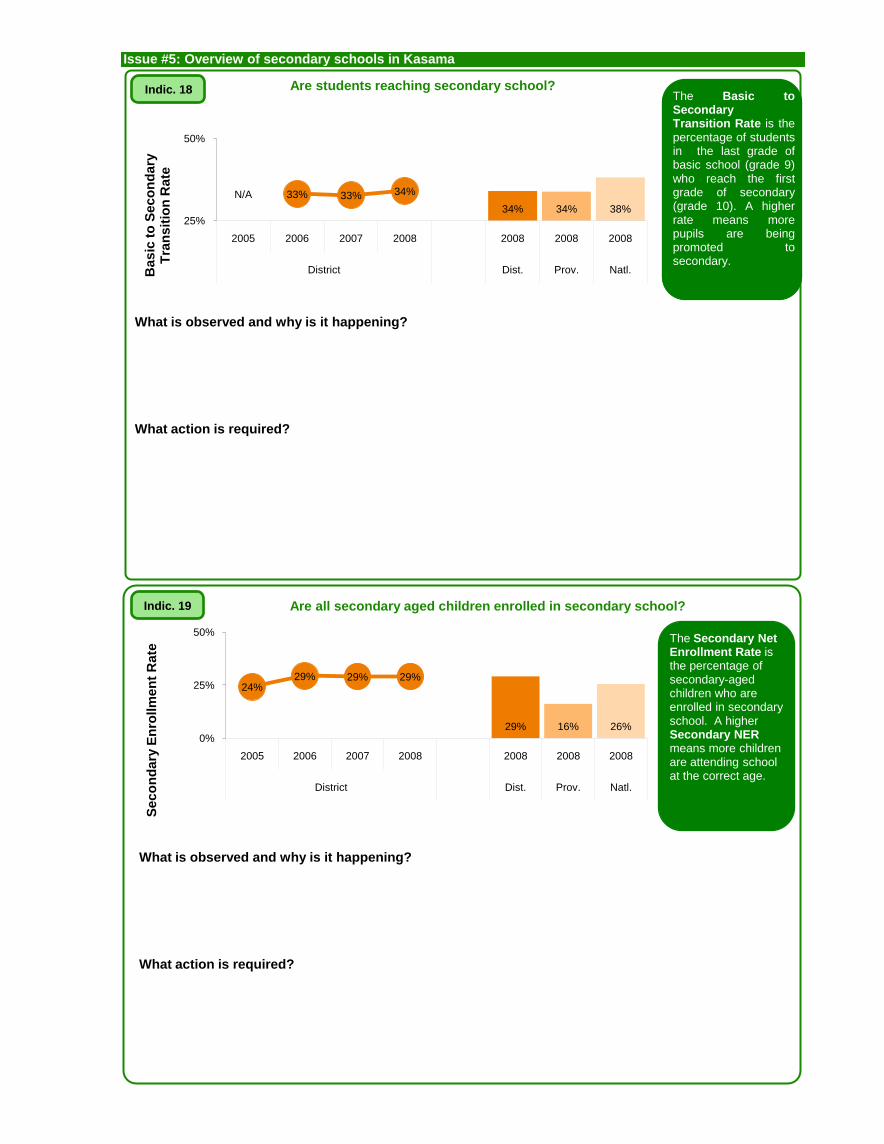
Issue #5: Overview of secondary schools in Kasama
34% 34% 38%
N/A 33% 33% 34%
25%
50%
2005 2006 2007 2008 2008 2008 2008
District Dist. Prov. Natl.
29% 16% 26%
24%29% 29% 29%
0%
25%
50%
2005 2006 2007 2008 2008 2008 2008
District Dist. Prov. Natl.
Bas
ic t
o S
ec
on
dary
T
ran
sit
ion
Ra
teS
ec
on
dary
En
rollm
en
t R
ate
Indic. 18
Indic. 19
Are students reaching secondary school?
Are all secondary aged children enrolled in secondary school?
The Basic toSecondaryTransition Rate is thepercentage of studentsin the last grade ofbasic school (grade 9)who reach the firstgrade of secondary(grade 10). A higherrate means morepupils are beingpromoted tosecondary.
What is observed and why is it happening?
What action is required?
The Secondary Net Enrollment Rate is the percentage of secondary-aged children who are enrolled in secondary school. A higher Secondary NERmeans more children are attending school at the correct age.
What is observed and why is it happening?
What action is required?
Sec
on
dary
PT
RS
ec
on
da
ry P
CR
Sec
on
dary
PB
R
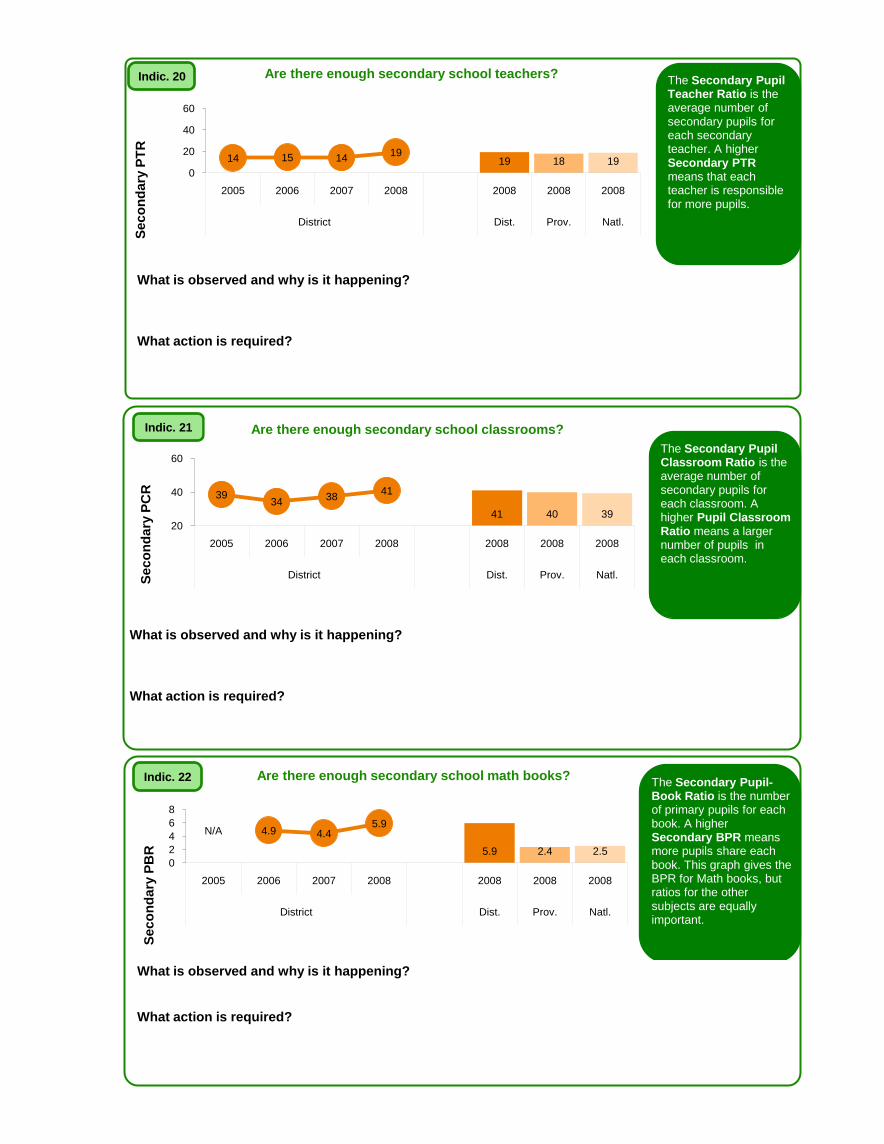
Indic. 20
Indic. 21
Indic. 22
Are there enough secondary school teachers?
Are there enough secondary school classrooms?
Are there enough secondary school math books?
The Secondary Pupil Teacher Ratio is the average number of secondary pupils for each secondary teacher. A higher Secondary PTR means that each teacher is responsible for more pupils.
The Secondary Pupil-Book Ratio is the number of primary pupils for each book. A higher Secondary BPR means more pupils share each book. This graph gives the BPR for Math books, but ratios for the other subjects are equally important.
The Secondary Pupil Classroom Ratio is the average number of secondary pupils for each classroom. A higher Pupil Classroom Ratio means a larger number of pupils in each classroom.
What is observed and why is it happening?
What action is required?
What is observed and why is it happening?
What action is required?
What is observed and why is it happening?
What action is required?
5.9 2.4 2.5
N/A 4.9 4.45.9
0
2
4
6
8
2005 2006 2007 2008 2008 2008 2008
District Dist. Prov. Natl.
19 18 1914 15 1419
0
20
40
60
2005 2006 2007 2008 2008 2008 2008
District Dist. Prov. Natl.
41 40 39
3934
3841
20
40
60
2005 2006 2007 2008 2008 2008 2008
District Dist. Prov. Natl.