zambia economy profile 2014 world bank
DESCRIPTION
Zambia Economy Profile 2014 World BankTRANSCRIPT
SoEconomy
Economy Profile:
St. Zambia
2 Zambia Doing Business 2014
© 2013 The International Bank for Reconstruction and Development /
The World Bank
1818 H Street NW, Washington, DC 20433
Telephone: 202-473-1000; Internet: www.worldbank.org
All rights reserved.
1 2 3 4 15 14 13 12
A copublication of The World Bank and the International Finance Corporation.
This work is a product of the staff of The World Bank with external contributions.
Note that The World Bank does not necessarily own each component of the content
included in the work. The World Bank therefore does not warrant that the use of the
content contained in the work will not infringe on the rights of third parties. The risk
of claims resulting from such infringement rests solely with you.
The findings, interpretations, and conclusions expressed in this work do not
necessarily reflect the views of The World Bank, its Board of Executive Directors, or
the governments they represent. The World Bank does not guarantee the accuracy of
the data included in this work. The boundaries, colors, denominations, and other
information shown on any map in this work do not imply any judgment on the part of
The World Bank concerning the legal status of any territory or the endorsement or
acceptance of such boundaries.
Nothing herein shall constitute or be considered to be a limitation upon or waiver of
the privileges and immunities of The World Bank, all of which are specifically
reserved.
Rights and Permissions
This work is available under the Creative Commons Attribution 3.0
Unported license (CC BY 3.0)
http://creativecommons.org/licenses/by/3.0. Under the Creative
Commons Attribution license, you are free to copy, distribute, transmit, and adapt
this work, including for commercial purposes, under the following conditions:
Attribution—Please cite the work as follows: World Bank. 2013. Doing Business 2014:
Understanding Regulations for Small and Medium-Size Enterprises. Washington, DC:
World Bank Group. DOI: 10.1596/978-0-8213-9615-5. License: Creative Commons
Attribution CC BY 3.0
Translations—If you create a translation of this work, please add the following
disclaimer along with the attribution: This translation was not created by The World
Bank and should not be considered an official World Bank translation. The World Bank
shall not be liable for any content or error in this translation.
All queries on rights and licenses should be addressed to the Office of the Publisher,
The World Bank, 1818 H Street NW, Washington, DC 20433, USA; fax: 202-522-2625;
e-mail: [email protected].
Additional copies of all 11 editions of Doing Business may be purchased at
www.doingbusiness.org.
Cover design: The Word Express

3 Zambia Doing Business 2014
CONTENTS
Introduction .................................................................................................................................. 4
The business environment .......................................................................................................... 5
Starting a business ..................................................................................................................... 14
Dealing with construction permits ........................................................................................... 22
Getting electricity ....................................................................................................................... 31
Registering property .................................................................................................................. 38
Getting credit .............................................................................................................................. 47
Protecting investors ................................................................................................................... 54
Paying taxes ................................................................................................................................ 63
Trading across borders .............................................................................................................. 70
Enforcing contracts .................................................................................................................... 78
Resolving insolvency .................................................................................................................. 88
Employing workers .................................................................................................................... 93
Data notes ................................................................................................................................. 100
Resources on the Doing Business website ............................................................................ 106
4 Zambia Doing Business 2014
INTRODUCTION
Doing Business sheds light on how easy or difficult it is
for a local entrepreneur to open and run a small to
medium-size business when complying with relevant
regulations. It measures and tracks changes in
regulations affecting 11 areas in the life cycle of a
business: starting a business, dealing with construction
permits, getting electricity, registering property,
getting credit, protecting investors, paying taxes,
trading across borders, enforcing contracts, resolving
insolvency and employing workers.
In a series of annual reports Doing Business presents
quantitative indicators on business regulations and the
protection of property rights that can be compared
across 189 economies, from Afghanistan to Zimbabwe,
over time. The data set covers 47 economies in Sub-
Saharan Africa, 33 in Latin America and the Caribbean,
25 in East Asia and the Pacific, 25 in Eastern Europe
and Central Asia, 20 in the Middle East and North
Africa and 8 in South Asia, as well as 31 OECD high-
income economies. The indicators are used to analyze
economic outcomes and identify what reforms have
worked, where and why.
This economy profile presents the Doing Business
indicators for Zambia. To allow useful comparison, it
also provides data for other selected economies
(comparator economies) for each indicator. The data in
this report are current as of June 1, 2013 (except for
the paying taxes indicators, which cover the period
January–December 2012).
The Doing Business methodology has limitations. Other
areas important to business—such as an economy’s
proximity to large markets, the quality of its
infrastructure services (other than those related to
trading across borders and getting electricity), the
security of property from theft and looting, the
transparency of government procurement,
macroeconomic conditions or the underlying strength
of institutions—are not directly studied by Doing
Business. The indicators refer to a specific type of
business, generally a local limited liability company
operating in the largest business city. Because
standard assumptions are used in the data collection,
comparisons and benchmarks are valid across
economies. The data not only highlight the extent of
obstacles to doing business; they also help identify the
source of those obstacles, supporting policy makers in
designing regulatory reform.
More information is available in the full report. Doing
Business 2014 presents the indicators, analyzes their
relationship with economic outcomes and presents
business regulatory reforms. The data, along with
information on ordering Doing Business 2014, are
available on the Doing Business website at
http://www.doingbusiness.org.

5 Zambia Doing Business 2014
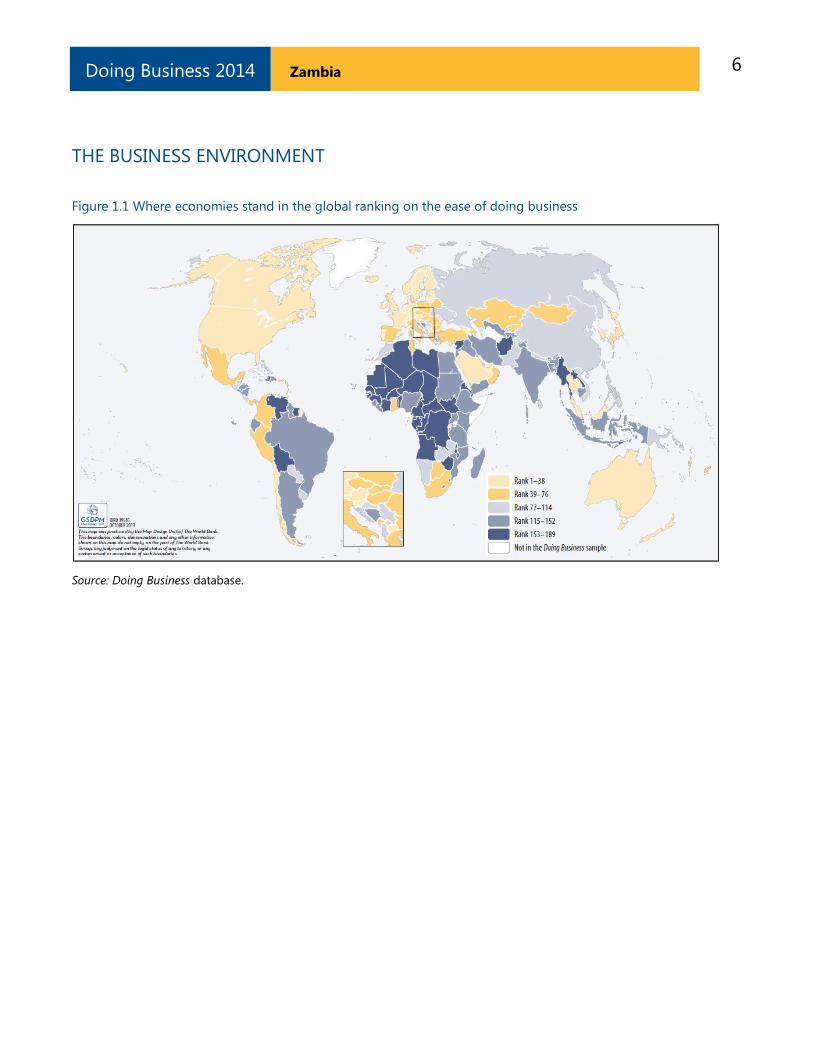
THE BUSINESS ENVIRONMENT
For policy makers trying to improve their economy’s
regulatory environment for business, a good place to
start is to find out how it compares with the regulatory
environment in other economies. Doing Business
provides an aggregate ranking on the ease of doing
business based on indicator sets that measure and
benchmark regulations applying to domestic small to
medium-size businesses through their life cycle.
Economies are ranked from 1 to 189 by the ease of
doing business index. For each economy the index is
calculated as the ranking on the simple average of its
percentile rankings on each of the 10 topics included in
the index in Doing Business 2014: starting a business,
dealing with construction permits, getting electricity,
registering property, getting credit, protecting
investors, paying taxes, trading across borders,
enforcing contracts and resolving insolvency. The
ranking on each topic is the simple average of the
percentile rankings on its component indicators (see
the data notes for more details). The employing workers
indicators are not included in this year’s aggregate ease
of doing business ranking, but the data are presented
in this year’s economy profile.
The aggregate ranking on the ease of doing business
benchmarks each economy’s performance on the
indicators against that of all other economies in the
Doing Business sample (figure 1.1). While this ranking
tells much about the business environment in an
economy, it does not tell the whole story. The ranking on
the ease of doing business, and the underlying
indicators, do not measure all aspects of the business
environment that matter to firms and investors or that
affect the competitiveness of the economy. Still, a high
ranking does mean that the government has created a
regulatory environment conducive to operating a
business.
ECONOMY OVERVIEW
Region: Sub-Saharan Africa
Income category: Lower middle income
Population: 14,075,099
GNI per capita (US$): 1,350
DB2014 rank: 83
DB2013 rank: 90*
Change in rank: 7
DB 2014 DTF: 64.58
DB 2013 DTF: 63.04
Change in DTF: 1.58
* DB2013 ranking shown is not last year’s published
ranking but a comparable ranking for DB2013 that
captures the effects of such factors as data
corrections and the addition of 4 economies (Libya,
Myanmar, San Marino and South Sudan) to the
sample this year. See the data notes for sources and
definitions.
6 Zambia Doing Business 2014
THE BUSINESS ENVIRONMENT
Figure 1.1 Where economies stand in the global ranking on the ease of doing business
Source: Doing Business database.
7 Zambia Doing Business 2014
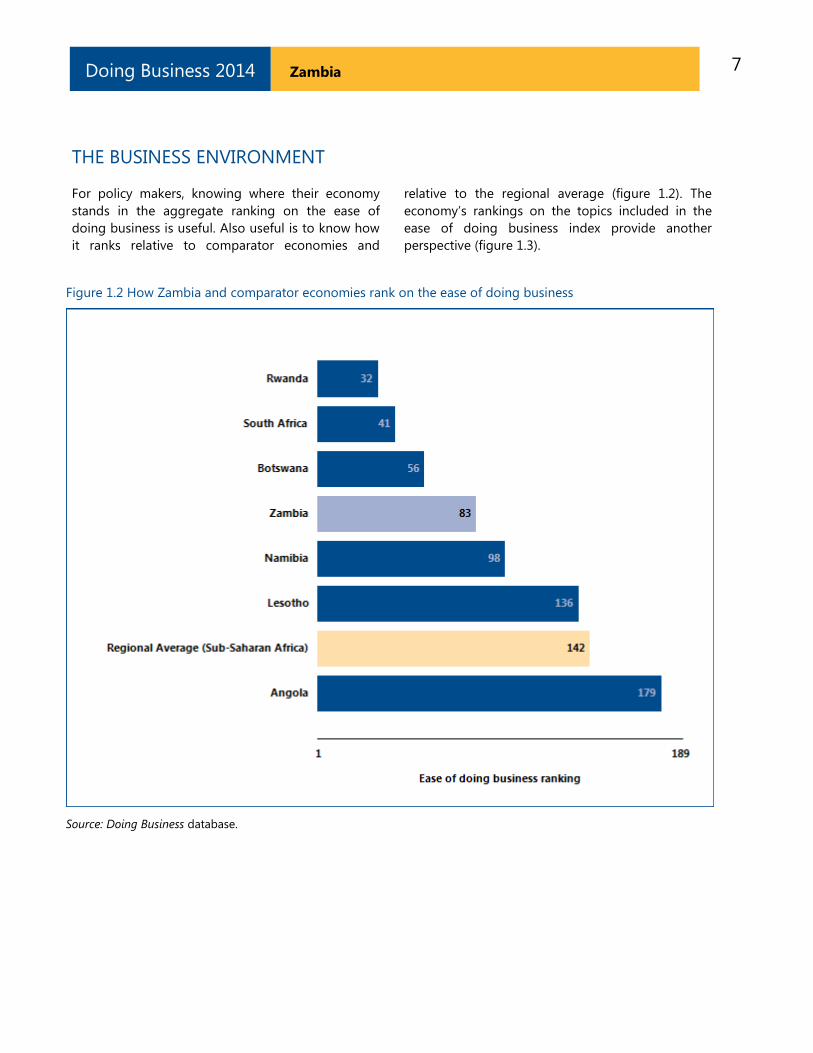
THE BUSINESS ENVIRONMENT
For policy makers, knowing where their economy
stands in the aggregate ranking on the ease of
doing business is useful. Also useful is to know how
it ranks relative to comparator economies and
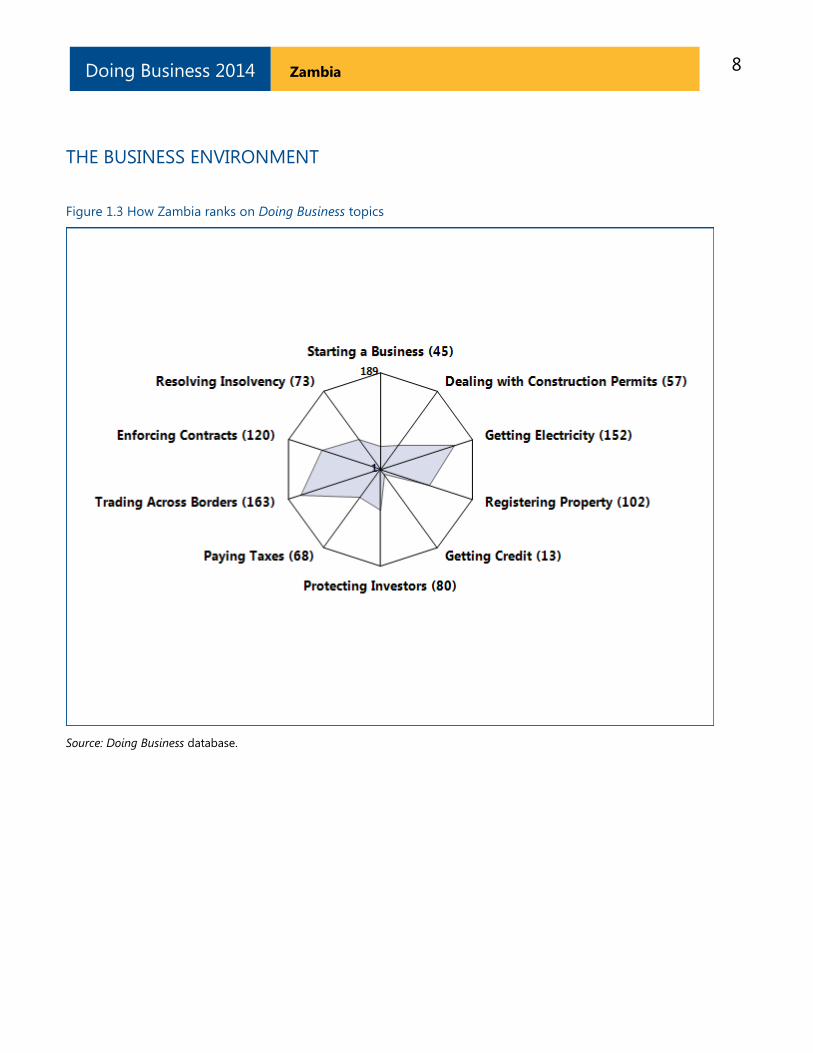
relative to the regional average (figure 1.2). The
economy’s rankings on the topics included in the
ease of doing business index provide another
perspective (figure 1.3).
Figure 1.2 How Zambia and comparator economies rank on the ease of doing business
Source: Doing Business database.
8 Zambia Doing Business 2014
THE BUSINESS ENVIRONMENT
Figure 1.3 How Zambia ranks on Doing Business topics
Source: Doing Business database.
9 Zambia Doing Business 2014
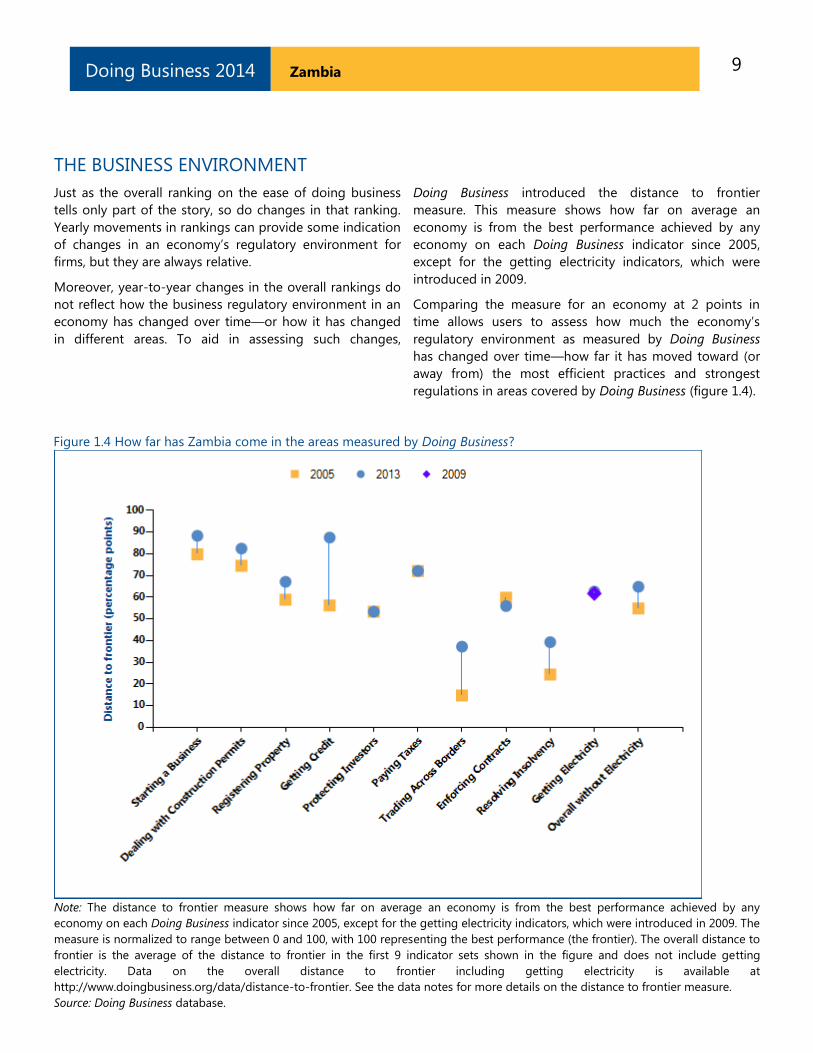
THE BUSINESS ENVIRONMENT
Just as the overall ranking on the ease of doing business
tells only part of the story, so do changes in that ranking.
Yearly movements in rankings can provide some indication
of changes in an economy’s regulatory environment for
firms, but they are always relative.
Moreover, year-to-year changes in the overall rankings do
not reflect how the business regulatory environment in an
economy has changed over time—or how it has changed
in different areas. To aid in assessing such changes,
Doing Business introduced the distance to frontier
measure. This measure shows how far on average an
economy is from the best performance achieved by any
economy on each Doing Business indicator since 2005,
except for the getting electricity indicators, which were
introduced in 2009.
Comparing the measure for an economy at 2 points in
time allows users to assess how much the economy’s
regulatory environment as measured by Doing Business
has changed over time—how far it has moved toward (or
away from) the most efficient practices and strongest
regulations in areas covered by Doing Business (figure 1.4).
Figure 1.4 How far has Zambia come in the areas measured by Doing Business?
Note: The distance to frontier measure shows how far on average an economy is from the best performance achieved by any
economy on each Doing Business indicator since 2005, except for the getting electricity indicators, which were introduced in 2009. The
measure is normalized to range between 0 and 100, with 100 representing the best performance (the frontier). The overall distance to
frontier is the average of the distance to frontier in the first 9 indicator sets shown in the figure and does not include getting
electricity. Data on the overall distance to frontier including getting electricity is available at
http://www.doingbusiness.org/data/distance-to-frontier. See the data notes for more details on the distance to frontier measure.
Source: Doing Business database.
10 Zambia Doing Business 2014
THE BUSINESS ENVIRONMENT
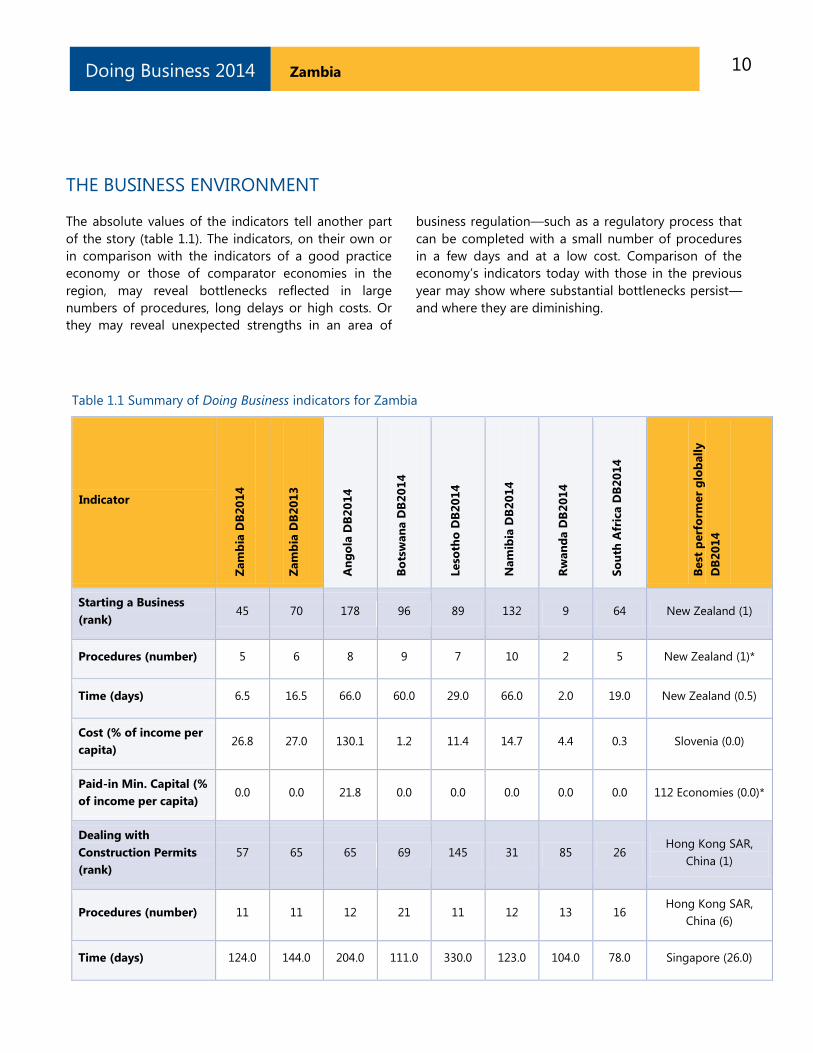
The absolute values of the indicators tell another part
of the story (table 1.1). The indicators, on their own or
in comparison with the indicators of a good practice
economy or those of comparator economies in the
region, may reveal bottlenecks reflected in large
numbers of procedures, long delays or high costs. Or
they may reveal unexpected strengths in an area of
business regulation—such as a regulatory process that
can be completed with a small number of procedures
in a few days and at a low cost. Comparison of the
economy’s indicators today with those in the previous
year may show where substantial bottlenecks persist—
and where they are diminishing.
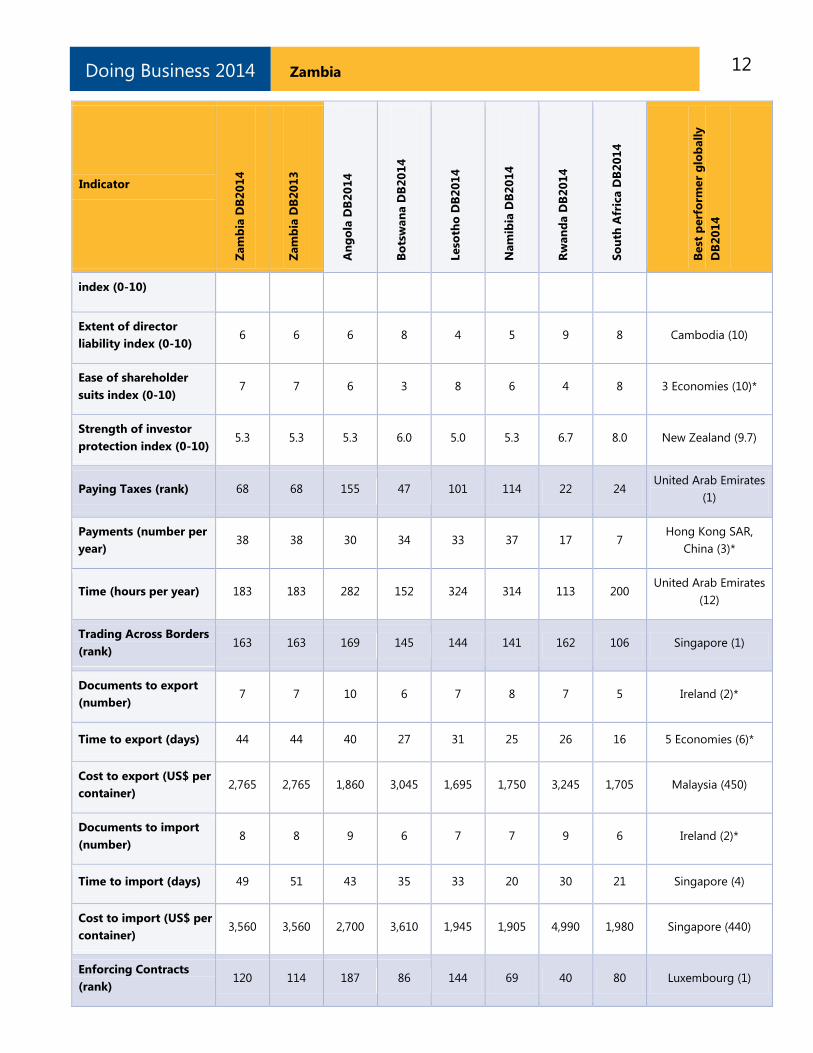
Table 1.1 Summary of Doing Business indicators for Zambia
Indicator
Zam
bia
DB
20
14
Zam
bia
DB
20
13
An
go
la D
B2
01
4
Bo
tsw
an
a D
B2
01
4
Leso
tho
DB
20
14
Nam
ibia
DB
20
14
Rw
an
da D
B2
01
4
So
uth
Afr
ica D
B2
01
4
Best
perf
orm
er
glo
ball
y
DB
20
14
Starting a Business
(rank) 45 70 178 96 89 132 9 64 New Zealand (1)
Procedures (number) 5 6 8 9 7 10 2 5 New Zealand (1)*
Time (days) 6.5 16.5 66.0 60.0 29.0 66.0 2.0 19.0 New Zealand (0.5)
Cost (% of income per
capita) 26.8 27.0 130.1 1.2 11.4 14.7 4.4 0.3 Slovenia (0.0)
Paid-in Min. Capital (%
of income per capita) 0.0 0.0 21.8 0.0 0.0 0.0 0.0 0.0 112 Economies (0.0)*
Dealing with
Construction Permits
(rank)
57 65 65 69 145 31 85 26 Hong Kong SAR,
China (1)
Procedures (number) 11 11 12 21 11 12 13 16 Hong Kong SAR,
China (6)
Time (days) 124.0 144.0 204.0 111.0 330.0 123.0 104.0 78.0 Singapore (26.0)

11 Zambia Doing Business 2014
Indicator
Zam
bia
DB
20
14
Zam
bia
DB
20
13
An
go
la D
B2
01
4
Bo
tsw
an
a D
B2
01
4
Leso
tho
DB
20
14
Nam
ibia
DB
20
14
Rw
an
da D
B2
01
4
So
uth
Afr
ica D
B2
01
4
Best
perf
orm
er
glo
ball
y
DB
20
14
Cost (% of income per
capita) 198.5 222.0 28.6 17.6 832.6 30.6 375.7 9.9 Qatar (1.1)
Getting Electricity
(rank) 152 152 170 107 136 72 53 150 Iceland (1)
Procedures (number) 6 6 7 5 5 6 4 5 10 Economies (3)*
Time (days) 117 117 145 121 125 37 30 226 Germany (17)
Cost (% of income per
capita) 955.8 1,109.5 689.7 389.1 1,991.8 395.9 4,018.7 1,432.1 Japan (0.0)
Registering Property
(rank) 102 98 132 41 88 178 8 99 Georgia (1)
Procedures (number) 5 5 7 4 4 8 3 7 4 Economies (1)*
Time (days) 45.0 45.0 191.0 15.0 43.0 54.0 12.0 23.0 New Zealand (1.0)*
Cost (% of property
value) 8.6 8.2 3.0 5.1 8.7 13.8 0.2 6.1 5 Economies (0.0)*
Getting Credit (rank) 13 11 130 73 159 55 13 28 Malaysia (1)*
Strength of legal rights
index (0-10) 9 9 3 6 6 7 8 7 10 Economies (10)*
Depth of credit
information index (0-6) 5 5 4 4 0 4 6 6 31 Economies (6)*
Public registry coverage
(% of adults) 0.0 0.0 2.4 0.0 0.0 0.0 2.1 0.0 Portugal (100.0)*
Private bureau
coverage (% of adults) 12.0 5.4 0.0 60.7 0.0 66.2 13.0 55.6 22 Economies (100.0)*
Protecting Investors
(rank) 80 80 80 52 98 80 22 10 New Zealand (1)
Extent of disclosure 3 3 4 7 3 5 7 8 10 Economies (10)*
12 Zambia Doing Business 2014
Indicator
Zam
bia
DB
20
14
Zam
bia
DB
20
13
An
go
la D
B2
01
4
Bo
tsw
an
a D
B2
01
4
Leso
tho
DB
20
14
Nam
ibia
DB
20
14
Rw
an
da D
B2
01
4
So
uth
Afr
ica D
B2
01
4
Best
perf
orm
er
glo
ball
y
DB
20
14
index (0-10)
Extent of director
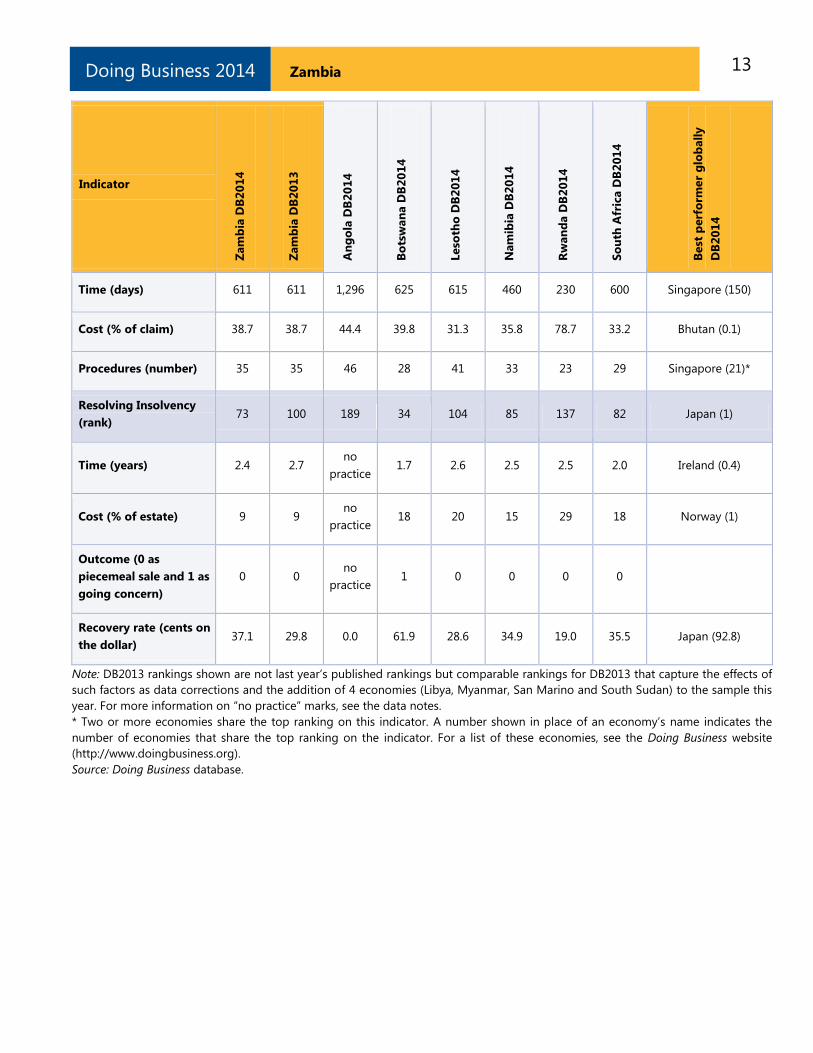
liability index (0-10) 6 6 6 8 4 5 9 8 Cambodia (10)
Ease of shareholder
suits index (0-10) 7 7 6 3 8 6 4 8 3 Economies (10)*
Strength of investor
protection index (0-10) 5.3 5.3 5.3 6.0 5.0 5.3 6.7 8.0 New Zealand (9.7)
Paying Taxes (rank) 68 68 155 47 101 114 22 24 United Arab Emirates
(1)
Payments (number per
year) 38 38 30 34 33 37 17 7
Hong Kong SAR,
China (3)*
Time (hours per year) 183 183 282 152 324 314 113 200 United Arab Emirates
(12)
Trading Across Borders
(rank) 163 163 169 145 144 141 162 106 Singapore (1)
Documents to export
(number) 7 7 10 6 7 8 7 5 Ireland (2)*
Time to export (days) 44 44 40 27 31 25 26 16 5 Economies (6)*
Cost to export (US$ per
container) 2,765 2,765 1,860 3,045 1,695 1,750 3,245 1,705 Malaysia (450)
Documents to import
(number) 8 8 9 6 7 7 9 6 Ireland (2)*
Time to import (days) 49 51 43 35 33 20 30 21 Singapore (4)
Cost to import (US$ per
container) 3,560 3,560 2,700 3,610 1,945 1,905 4,990 1,980 Singapore (440)
Enforcing Contracts
(rank) 120 114 187 86 144 69 40 80 Luxembourg (1)
13 Zambia Doing Business 2014
Indicator
Zam
bia
DB
20
14
Zam
bia
DB
20
13
An
go
la D
B2
01
4
Bo
tsw
an
a D
B2
01
4
Leso
tho
DB
20
14
Nam
ibia
DB
20
14
Rw
an
da D
B2
01
4
So
uth
Afr
ica D
B2
01
4
Best
perf
orm
er
glo
ball
y
DB
20
14
Time (days) 611 611 1,296 625 615 460 230 600 Singapore (150)
Cost (% of claim) 38.7 38.7 44.4 39.8 31.3 35.8 78.7 33.2 Bhutan (0.1)
Procedures (number) 35 35 46 28 41 33 23 29 Singapore (21)*
Resolving Insolvency
(rank) 73 100 189 34 104 85 137 82 Japan (1)
Time (years) 2.4 2.7 no
practice 1.7 2.6 2.5 2.5 2.0 Ireland (0.4)
Cost (% of estate) 9 9 no
practice 18 20 15 29 18 Norway (1)
Outcome (0 as
piecemeal sale and 1 as
going concern)
0 0 no
practice 1 0 0 0 0
Recovery rate (cents on
the dollar) 37.1 29.8 0.0 61.9 28.6 34.9 19.0 35.5 Japan (92.8)
Note: DB2013 rankings shown are not last year’s published rankings but comparable rankings for DB2013 that capture the effects of
such factors as data corrections and the addition of 4 economies (Libya, Myanmar, San Marino and South Sudan) to the sample this
year. For more information on “no practice” marks, see the data notes.
* Two or more economies share the top ranking on this indicator. A number shown in place of an economy’s name indicates the
number of economies that share the top ranking on the indicator. For a list of these economies, see the Doing Business website
(http://www.doingbusiness.org).
Source: Doing Business database.
14 Zambia Doing Business 2014
STARTING A BUSINESS
Formal registration of companies has many
immediate benefits for the companies and for
business owners and employees. Legal entities can
outlive their founders. Resources are pooled as
several shareholders join forces to start a company.
Formally registered companies have access to
services and institutions from courts to banks as
well as to new markets. And their employees can
benefit from protections provided by the law. An
additional benefit comes with limited liability
companies. These limit the financial liability of
company owners to their investments, so personal
assets of the owners are not put at risk. Where
governments make registration easy, more
entrepreneurs start businesses in the formal sector,
creating more good jobs and generating more
revenue for the government.
What do the indicators cover?
Doing Business measures the ease of starting a
business in an economy by recording all
procedures officially required or commonly done in
practice by an entrepreneur to start up and
formally operate an industrial or commercial
business—as well as the time and cost required to
complete these procedures. It also records the
paid-in minimum capital that companies must
deposit before registration (or within 3 months).
The ranking on the ease of starting a business is
the simple average of the percentile rankings on
the 4 component indicators: procedures, time, cost
and paid-in minimum capital requirement.
To make the data comparable across economies,
Doing Business uses several assumptions about the
business and the procedures. It assumes that all
information is readily available to the entrepreneur
and that there has been no prior contact with
officials. It also assumes that the entrepreneur will
pay no bribes. And it assumes that the business:
Is a limited liability company, located in the
largest business city and is 100% domestically
owned.
Has between 10 and 50 employees.
Conducts general commercial or industrial
activities.
WHAT THE STARTING A BUSINESS
INDICATORS MEASURE
Procedures to legally start and operate a
company (number)
Preregistration (for example, name
verification or reservation, notarization)
Registration in the economy’s largest
business city
Postregistration (for example, social security
registration, company seal)
Time required to complete each procedure
(calendar days)
Does not include time spent gathering
information
Each procedure starts on a separate day (2
procedures cannot start on the same day).
Procedures that can be fully completed
online are an exception to this rule.
Procedure completed once final document is
received
No prior contact with officials
Cost required to complete each procedure
(% of income per capita)
Official costs only, no bribes
No professional fees unless services required
by law
Paid-in minimum capital (% of income
per capita)
Deposited in a bank or with a notary before
registration (or within 3 months)
Has a start-up capital of 10 times income per
capita.
Has a turnover of at least 100 times income per
capita.
Does not qualify for any special benefits.
Does not own real estate.
15 Zambia Doing Business 2014
STARTING A BUSINESS
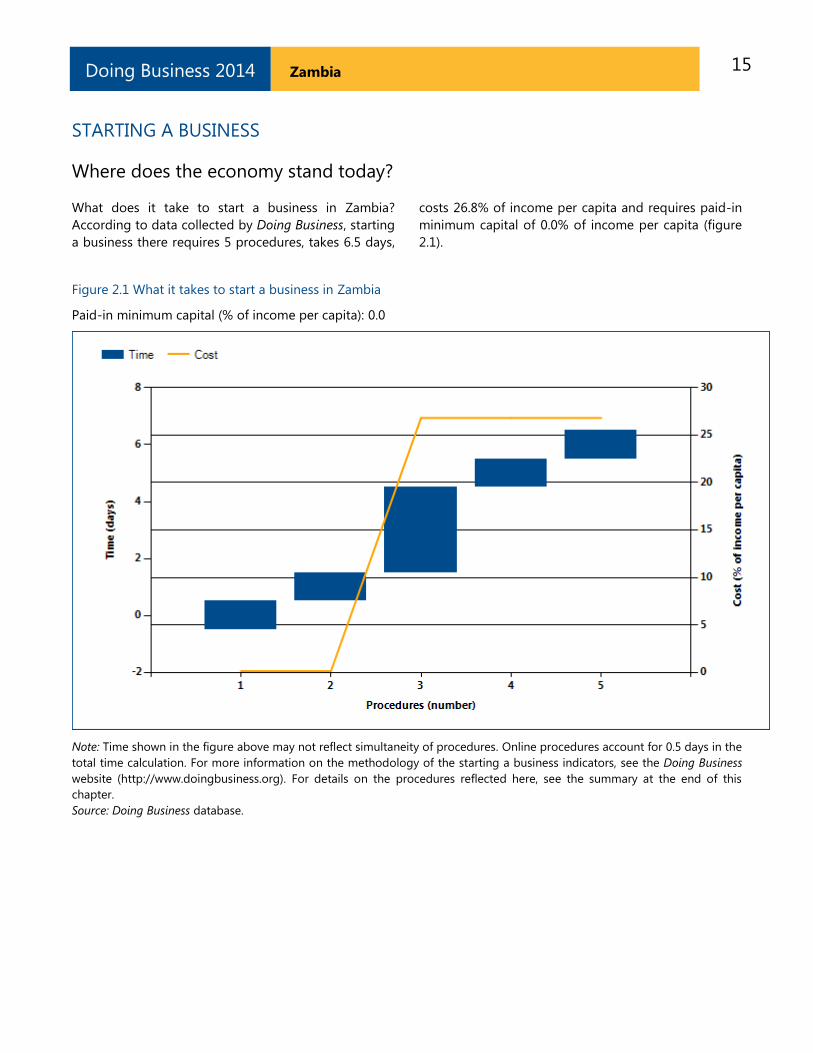
Where does the economy stand today?
What does it take to start a business in Zambia?
According to data collected by Doing Business, starting
a business there requires 5 procedures, takes 6.5 days,
costs 26.8% of income per capita and requires paid-in
minimum capital of 0.0% of income per capita (figure
2.1).
Figure 2.1 What it takes to start a business in Zambia
Paid-in minimum capital (% of income per capita): 0.0
Note: Time shown in the figure above may not reflect simultaneity of procedures. Online procedures account for 0.5 days in the
total time calculation. For more information on the methodology of the starting a business indicators, see the Doing Business
website (http://www.doingbusiness.org). For details on the procedures reflected here, see the summary at the end of this
chapter.
Source: Doing Business database.

16 Zambia Doing Business 2014
STARTING A BUSINESS
Globally, Zambia stands at 45 in the ranking of 189
economies on the ease of starting a business (figure
2.2). The rankings for comparator economies and the
regional average ranking provide other useful
information for assessing how easy it is for an
entrepreneur in Zambia to start a business.
Figure 2.2 How Zambia and comparator economies rank on the ease of starting a business
Source: Doing Business database.
17 Zambia Doing Business 2014
STARTING A BUSINESS
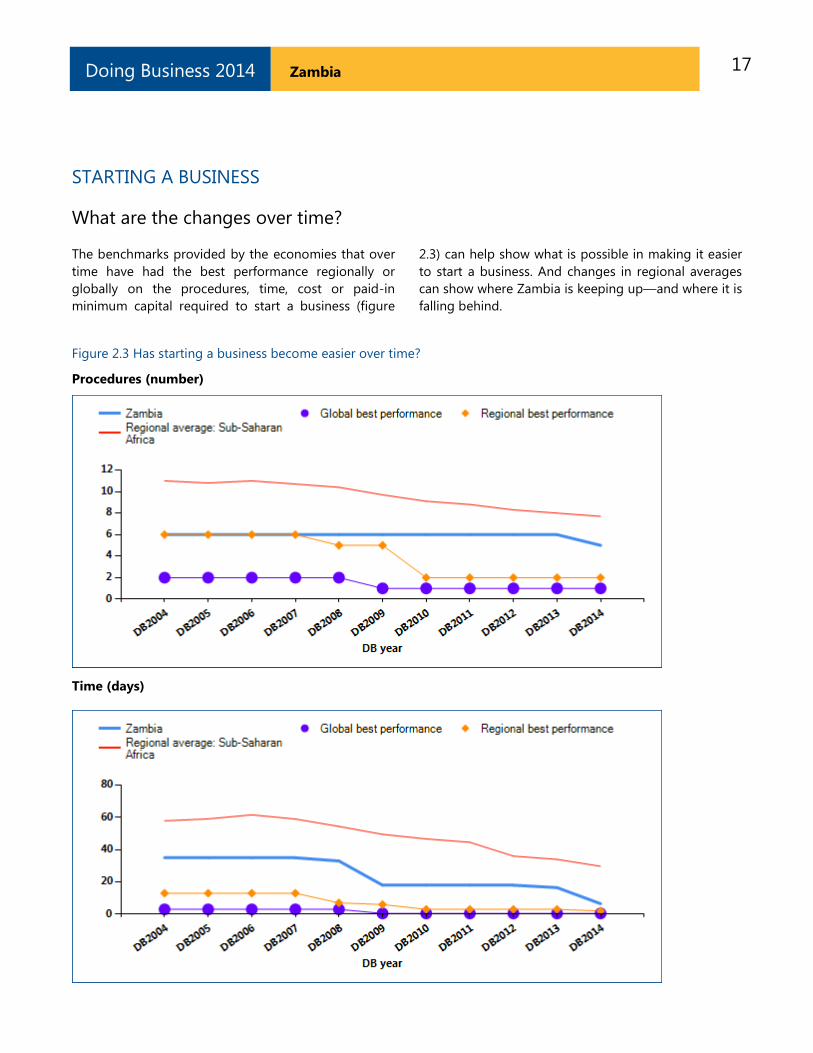
What are the changes over time?
The benchmarks provided by the economies that over
time have had the best performance regionally or
globally on the procedures, time, cost or paid-in
minimum capital required to start a business (figure
2.3) can help show what is possible in making it easier
to start a business. And changes in regional averages
can show where Zambia is keeping up—and where it is
falling behind.
Figure 2.3 Has starting a business become easier over time?
Procedures (number)
Time (days)
18 Zambia Doing Business 2014
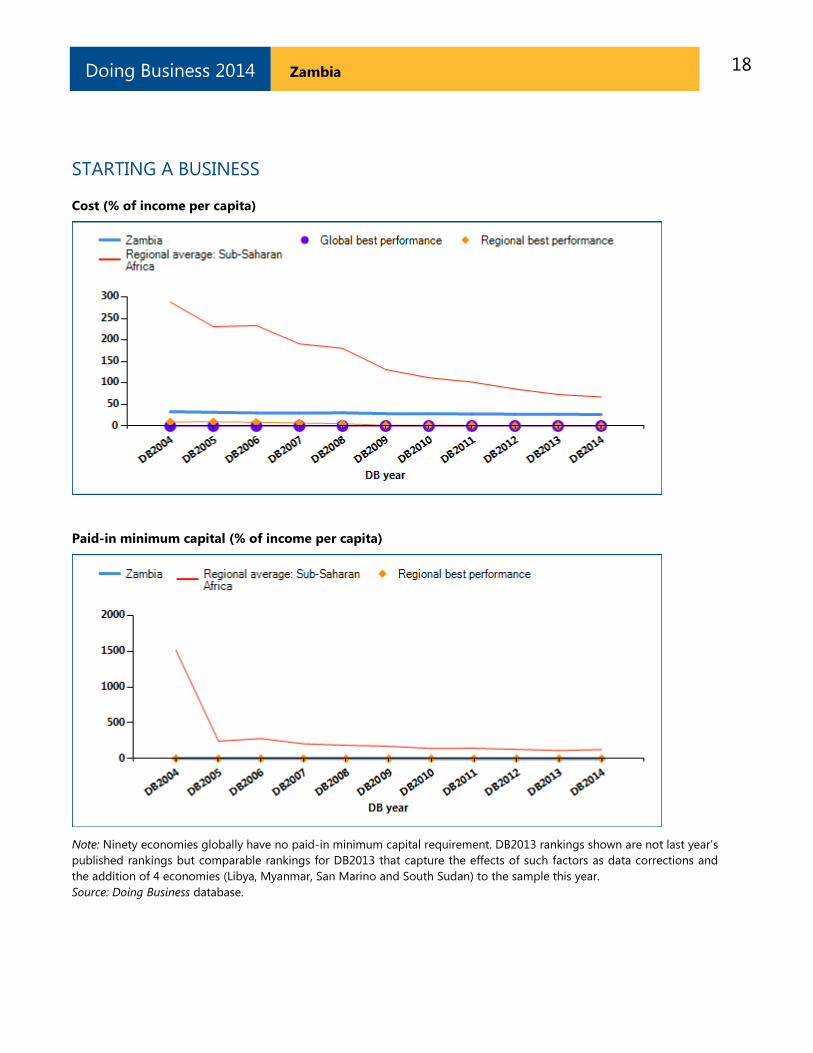
STARTING A BUSINESS
Cost (% of income per capita)
Paid-in minimum capital (% of income per capita)
Note: Ninety economies globally have no paid-in minimum capital requirement. DB2013 rankings shown are not last year’s
published rankings but comparable rankings for DB2013 that capture the effects of such factors as data corrections and
the addition of 4 economies (Libya, Myanmar, San Marino and South Sudan) to the sample this year.
Source: Doing Business database.
19 Zambia Doing Business 2014
STARTING A BUSINESS
Economies around the world have taken steps making
it easier to start a business—streamlining procedures
by setting up a one-stop shop, making procedures
simpler or faster by introducing technology and
reducing or eliminating minimum capital requirements.
Many have undertaken business registration reforms in
stages—and they often are part of a larger regulatory
reform program. Among the benefits have been
greater firm satisfaction and savings and more
registered businesses, financial resources and job
opportunities.
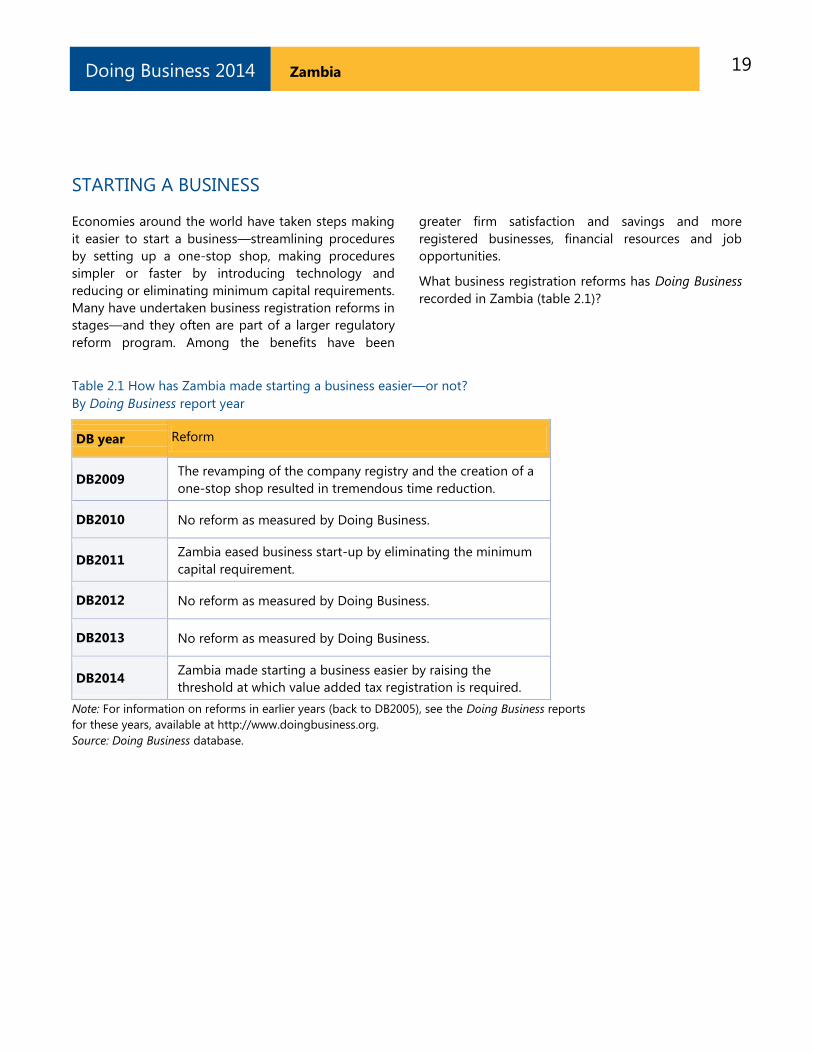
What business registration reforms has Doing Business
recorded in Zambia (table 2.1)?
Table 2.1 How has Zambia made starting a business easier—or not?
By Doing Business report year
DB year Reform
DB2009 The revamping of the company registry and the creation of a
one-stop shop resulted in tremendous time reduction.
DB2010 No reform as measured by Doing Business.
DB2011 Zambia eased business start-up by eliminating the minimum
capital requirement.
DB2012 No reform as measured by Doing Business.
DB2013 No reform as measured by Doing Business.
DB2014 Zambia made starting a business easier by raising the
threshold at which value added tax registration is required.
Note: For information on reforms in earlier years (back to DB2005), see the Doing Business reports
for these years, available at http://www.doingbusiness.org.
Source: Doing Business database.
20 Zambia Doing Business 2014
STARTING A BUSINESS
What are the details?
Underlying the indicators shown in this chapter for
Zambia is a set of specific procedures—the
bureaucratic and legal steps that an entrepreneur
must complete to incorporate and register a new
firm. These are identified by Doing Business
through collaboration with relevant local
professionals and the study of laws, regulations and
publicly available information on business entry in
that economy. Following is a detailed summary of
those procedures, along with the associated time
and cost. These procedures are those that apply to
a company matching the standard assumptions
(the “standardized company”) used by Doing
Business in collecting the data (see the section in
this chapter on what the indicators measure).
STANDARDIZED COMPANY
City: Lusaka
Legal Form: Private Company Limited by shares
Paid in Minimum Capital Requirement: None
Start-up Capital: 10 times GNI per capita
Summary of procedures for starting a business in Zambia—and the time and cost
No. Procedure Time to
complete Cost to complete
1
Check name for uniqueness at PACRA
The name clearance is done at the Patent And Companies Registration
Agency (PACRA). Recently, the online name search was also introduced
on the website of PACRA.
Procedure can be done online
Less than one day
(online procedure) ZMK 10
2
Open a bank account
1 day no charge
3
Register the company at PACRA
The registrar is located at the PACRA. PACRA is a stand-alone office
with a customer service center designed in a process chain platform,
where the applicant goes through various steps: check name, submit
the completed Form 2: Application for Incorporation, Form 5:
Declaration of Consent to act as a Director or Secretary, Form 11:
Declaration of compliance, receive a case number to track the
application status, and pay the fees at the cashier. At the end of the
process, the applicant returns to PACRA to obtain the certificate of
incorporation and the certificate of share capital.
The fees payable to PACRA are as follows:
- Registration Fee: 2.5% of nominal capital
- Sealing Fee: ZMK 10
- Certificate of incorporation: ZMK 30
- Certificate of share capital: ZMK 30
3 days see comments
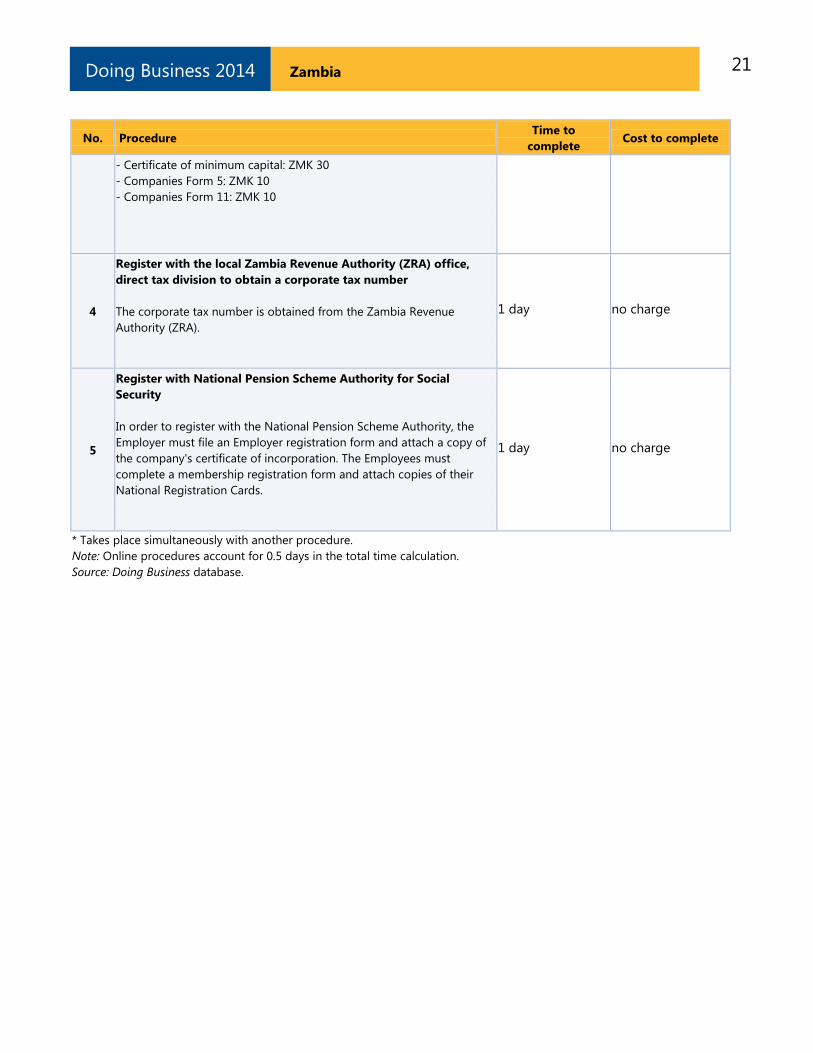
21 Zambia Doing Business 2014
No. Procedure Time to
complete Cost to complete
- Certificate of minimum capital: ZMK 30
- Companies Form 5: ZMK 10
- Companies Form 11: ZMK 10
4
Register with the local Zambia Revenue Authority (ZRA) office,
direct tax division to obtain a corporate tax number
The corporate tax number is obtained from the Zambia Revenue
Authority (ZRA).
1 day no charge
5
Register with National Pension Scheme Authority for Social
Security
In order to register with the National Pension Scheme Authority, the
Employer must file an Employer registration form and attach a copy of
the company's certificate of incorporation. The Employees must
complete a membership registration form and attach copies of their
National Registration Cards.
1 day no charge
* Takes place simultaneously with another procedure.
Note: Online procedures account for 0.5 days in the total time calculation.
Source: Doing Business database.
22 Zambia Doing Business 2014
DEALING WITH CONSTRUCTION PERMITS
Regulation of construction is critical to protect the
public. But it needs to be efficient, to avoid
excessive constraints on a sector that plays an
important part in every economy. Where complying
with building regulations is excessively costly in
time and money, many builders opt out. They may
pay bribes to pass inspections or simply build
illegally, leading to hazardous construction that
puts public safety at risk. Where compliance is
simple, straightforward and inexpensive, everyone
is better off.
What do the indicators cover?
Doing Business records the procedures, time and
cost for a business in the construction industry to
obtain all the necessary approvals to build a
warehouse in the economy’s largest business city,
connect it to basic utilities and register the
property so that it can be used as collateral or
transferred to another entity.
The ranking on the ease of dealing with
construction permits is the simple average of the
percentile rankings on its component indicators:
procedures, time and cost.
To make the data comparable across economies,
Doing Business uses several assumptions about the
business and the warehouse, including the utility
connections.
The business:
Is a limited liability company operating in
the construction business and located in
the largest business city.
Is domestically owned and operated.
Has 60 builders and other employees.
The warehouse:
Is a new construction (there was no
previous construction on the land).
Has complete architectural and technical
plans prepared by a licensed architect or
engineer.
WHAT THE DEALING WITH CONSTRUCTION
PERMITS INDICATORS MEASURE
Procedures to legally build a warehouse
(number)
Submitting all relevant documents and
obtaining all necessary clearances, licenses,
permits and certificates
Submitting all required notifications and
receiving all necessary inspections
Obtaining utility connections for water,
sewerage and a land telephone line
Registering the warehouse after its
completion (if required for use as collateral or
for transfer of the warehouse)
Time required to complete each procedure
(calendar days)
Does not include time spent gathering
information
Each procedure starts on a separate day.
Procedures that can be fully completed online
are an exception to this rule.
Procedure considered completed once final
document is received
No prior contact with officials
Cost required to complete each procedure (%
of income per capita)
Official costs only, no bribes
Will be connected to water, sewerage
(sewage system, septic tank or their
equivalent) and a fixed telephone line. The
connection to each utility network will be 10
meters (32 feet, 10 inches) long.
Will be used for general storage, such as of
books or stationery (not for goods requiring
special conditions).
Will take 30 weeks to construct (excluding all
delays due to administrative and regulatory
requirements).
23 Zambia Doing Business 2014
DEALING WITH CONSTRUCTION PERMITS
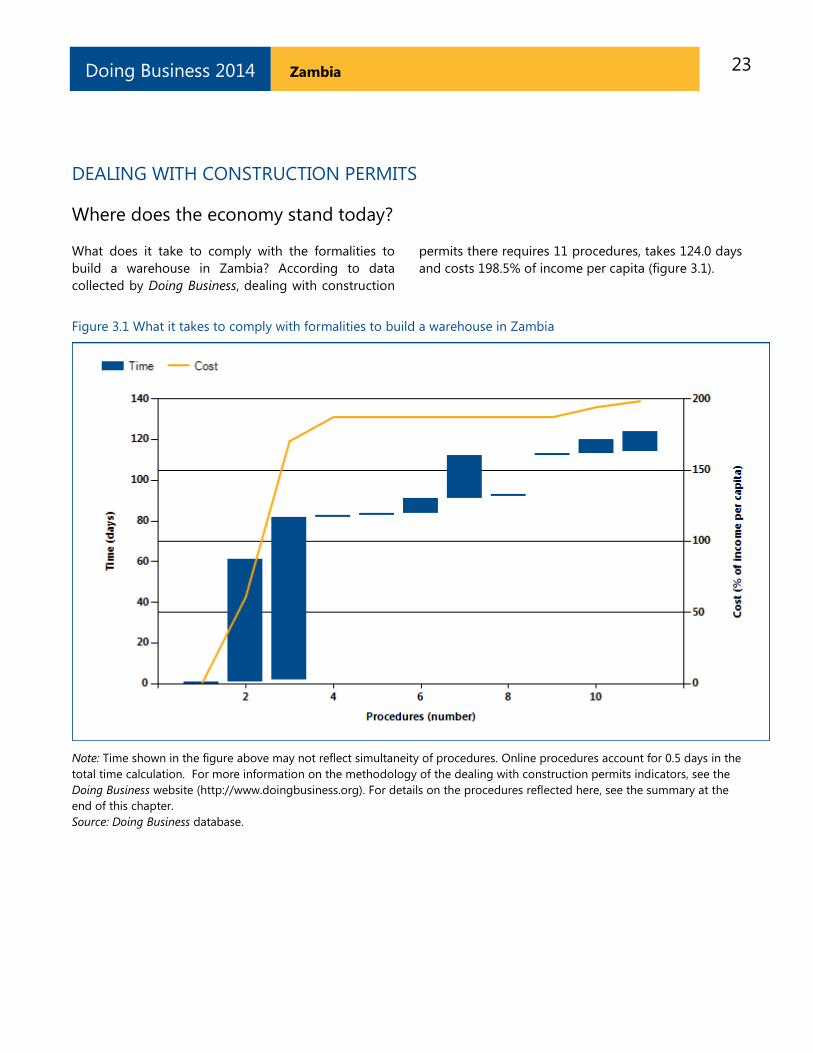
Where does the economy stand today?
What does it take to comply with the formalities to
build a warehouse in Zambia? According to data
collected by Doing Business, dealing with construction
permits there requires 11 procedures, takes 124.0 days
and costs 198.5% of income per capita (figure 3.1).
Figure 3.1 What it takes to comply with formalities to build a warehouse in Zambia
Note: Time shown in the figure above may not reflect simultaneity of procedures. Online procedures account for 0.5 days in the
total time calculation. For more information on the methodology of the dealing with construction permits indicators, see the
Doing Business website (http://www.doingbusiness.org). For details on the procedures reflected here, see the summary at the
end of this chapter.
Source: Doing Business database.
24 Zambia Doing Business 2014
DEALING WITH CONSTRUCTION PERMITS
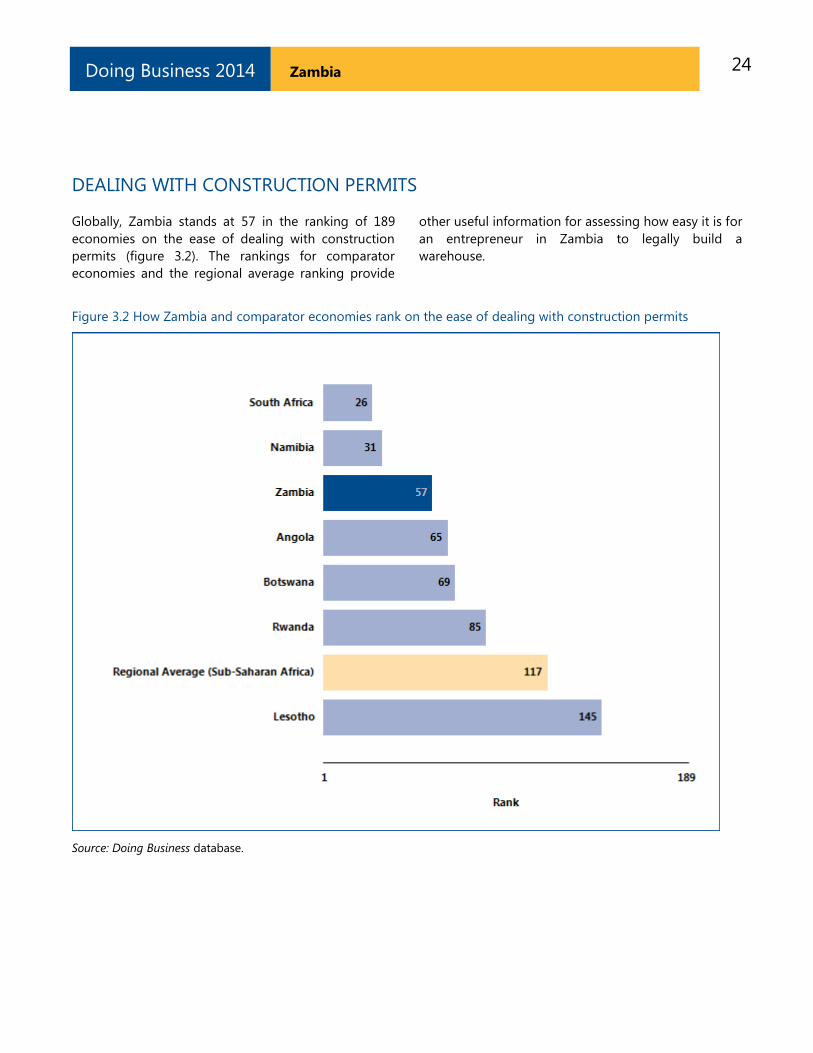
Globally, Zambia stands at 57 in the ranking of 189
economies on the ease of dealing with construction
permits (figure 3.2). The rankings for comparator
economies and the regional average ranking provide
other useful information for assessing how easy it is for
an entrepreneur in Zambia to legally build a
warehouse.
Figure 3.2 How Zambia and comparator economies rank on the ease of dealing with construction permits
Source: Doing Business database.

25 Zambia Doing Business 2014
DEALING WITH CONSTRUCTION PERMITS
What are the changes over time?
The benchmarks provided by the economies that over
time have had the best performance regionally or
globally on the procedures, time or cost required to
deal with construction permits (figure 3.3) help show
what is possible in making it easier to deal with
construction permits. And changes in regional
averages can show where Zambia is keeping up—and
where it is falling behind.
Figure 3.3 Has dealing with construction permits become easier over time?
Procedures (number)
Time (days)

26 Zambia Doing Business 2014
DEALING WITH CONSTRUCTION PERMITS
Cost (% of income per capita)
Note: DB2013 rankings shown are not last year’s published rankings but comparable rankings for DB2013 that capture the
effects of such factors as data corrections and the addition of 4 economies (Libya, Myanmar, San Marino and South Sudan) to
the sample this year. For more information on “no practice” marks, see the data notes.
Source: Doing Business database.
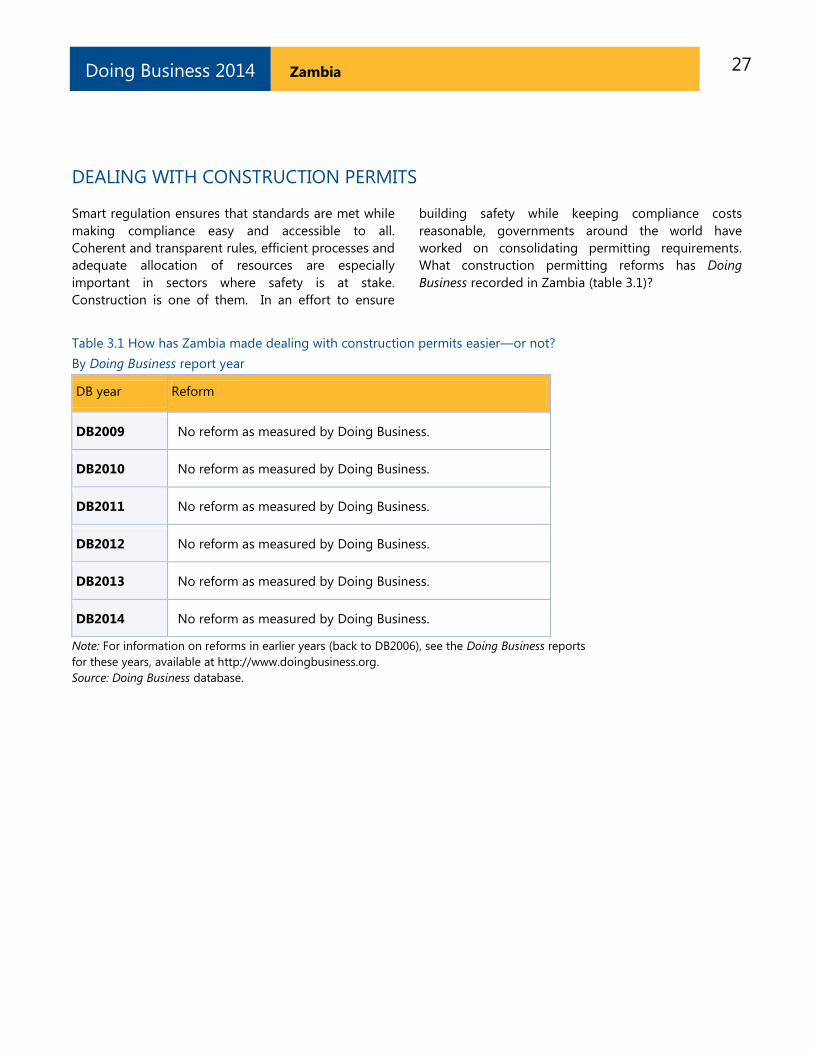
27 Zambia Doing Business 2014
DEALING WITH CONSTRUCTION PERMITS
Smart regulation ensures that standards are met while
making compliance easy and accessible to all.
Coherent and transparent rules, efficient processes and
adequate allocation of resources are especially
important in sectors where safety is at stake.
Construction is one of them. In an effort to ensure
building safety while keeping compliance costs
reasonable, governments around the world have
worked on consolidating permitting requirements.
What construction permitting reforms has Doing
Business recorded in Zambia (table 3.1)?
Table 3.1 How has Zambia made dealing with construction permits easier—or not?
By Doing Business report year
DB year Reform
DB2009 No reform as measured by Doing Business.
DB2010 No reform as measured by Doing Business.
DB2011 No reform as measured by Doing Business.
DB2012 No reform as measured by Doing Business.
DB2013 No reform as measured by Doing Business.
DB2014 No reform as measured by Doing Business.
Note: For information on reforms in earlier years (back to DB2006), see the Doing Business reports
for these years, available at http://www.doingbusiness.org.
Source: Doing Business database.
28 Zambia Doing Business 2014
DEALING WITH CONSTRUCTION PERMITS
What are the details?
The indicators reported here for Zambia are based
on a set of specific procedures—the steps that a
company must complete to legally build a
warehouse—identified by Doing Business through
information collected from experts in construction
licensing, including architects, civil engineers,
construction lawyers, construction firms, utility
service providers and public officials who deal with
building regulations. These procedures are those
that apply to a company and structure matching
the standard assumptions used by Doing Business
in collecting the data (see the section in this
chapter on what the indicators cover).
BUILDING A WAREHOUSE
City : Lusaka
Estimated
Warehouse Value : ZMK 2,972,907,800
The procedures, along with the associated time and
cost, are summarized below.
Summary of procedures for dealing with construction permits in Zambia —and the time and cost
No. Procedure Time to
complete Cost to complete
1
Obtain notarization of property title
There is no requirement that the title be notarized by a notary public
(who might charge up to USD 100.00).
One can obtain a copy of the title and have it stamped either by a
lawyer, for about USD 2.00, or by the local court, for free. The former
alternative is more common. This process takes few minutes, and no
appointment is needed. Due to fraud, however, the law might be
changed in the future to require notarization by a notary public.
1 day USD 2
2
Obtain building permit from the municipal authority (City
Development Department)
The approval permit is valid for 6 months and may be extended for
another 6 months. The following documents are required to obtain a
building permit:
• 4 copies of technical drawings which include:
1. Floor plan
2. Foundation plan
3. Elevations
4. Roof Plan
5. Door and window schedule
6. Site plan
7. Block Plan
8. Cross section
9. Structural drawing for multi story structures
• Certified copy of ownership of the plot
• Complete application form
60 days ZMK 4,330,998
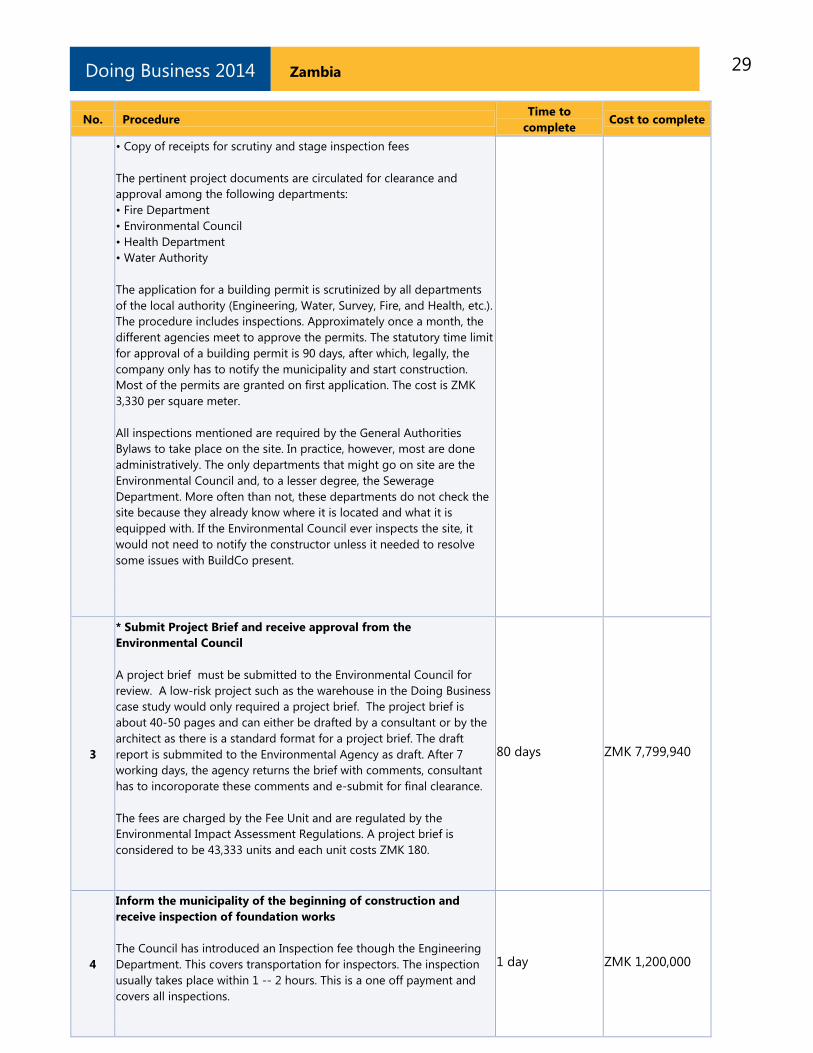
29 Zambia Doing Business 2014
No. Procedure Time to
complete Cost to complete
• Copy of receipts for scrutiny and stage inspection fees
The pertinent project documents are circulated for clearance and
approval among the following departments:
• Fire Department
• Environmental Council
• Health Department
• Water Authority
The application for a building permit is scrutinized by all departments
of the local authority (Engineering, Water, Survey, Fire, and Health, etc.).
The procedure includes inspections. Approximately once a month, the
different agencies meet to approve the permits. The statutory time limit
for approval of a building permit is 90 days, after which, legally, the
company only has to notify the municipality and start construction.
Most of the permits are granted on first application. The cost is ZMK
3,330 per square meter.
All inspections mentioned are required by the General Authorities
Bylaws to take place on the site. In practice, however, most are done
administratively. The only departments that might go on site are the
Environmental Council and, to a lesser degree, the Sewerage
Department. More often than not, these departments do not check the
site because they already know where it is located and what it is
equipped with. If the Environmental Council ever inspects the site, it
would not need to notify the constructor unless it needed to resolve
some issues with BuildCo present.
3
* Submit Project Brief and receive approval from the
Environmental Council
A project brief must be submitted to the Environmental Council for
review. A low-risk project such as the warehouse in the Doing Business
case study would only required a project brief. The project brief is
about 40-50 pages and can either be drafted by a consultant or by the
architect as there is a standard format for a project brief. The draft
report is submmited to the Environmental Agency as draft. After 7
working days, the agency returns the brief with comments, consultant
has to incoroporate these comments and e-submit for final clearance.
The fees are charged by the Fee Unit and are regulated by the
Environmental Impact Assessment Regulations. A project brief is
considered to be 43,333 units and each unit costs ZMK 180.
80 days ZMK 7,799,940
4
Inform the municipality of the beginning of construction and
receive inspection of foundation works
The Council has introduced an Inspection fee though the Engineering
Department. This covers transportation for inspectors. The inspection
usually takes place within 1 -- 2 hours. This is a one off payment and
covers all inspections.
1 day ZMK 1,200,000
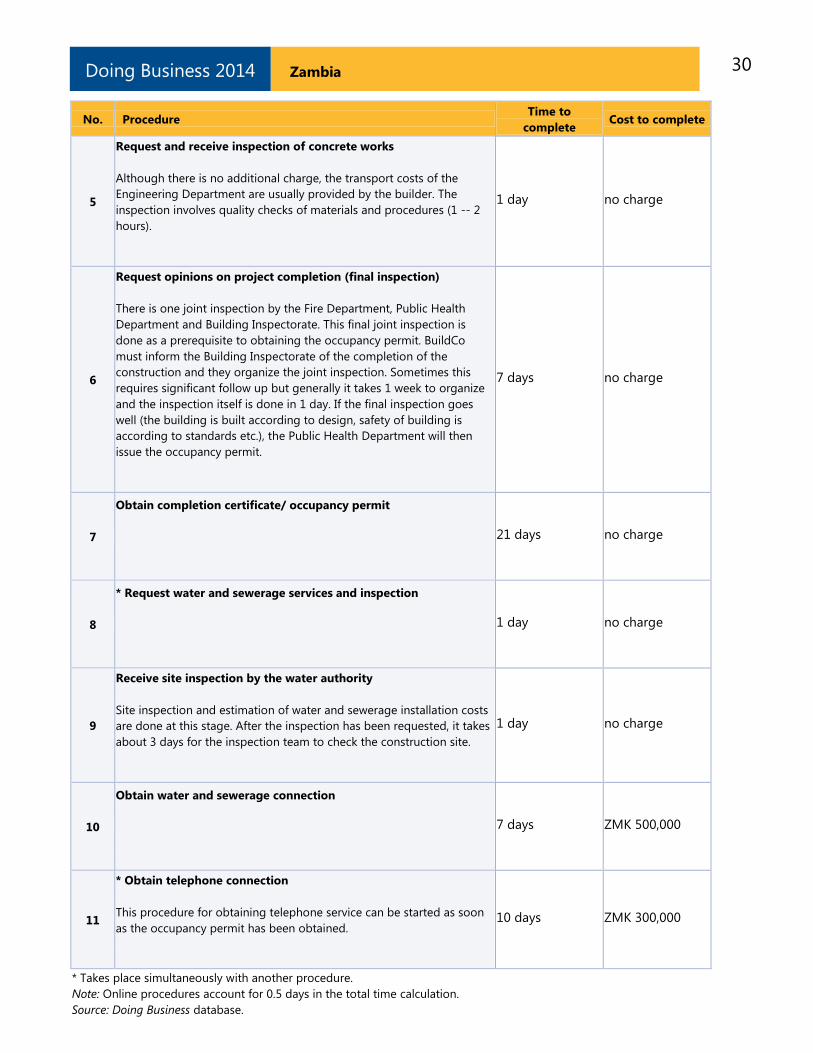
30 Zambia Doing Business 2014
No. Procedure Time to
complete Cost to complete
5
Request and receive inspection of concrete works
Although there is no additional charge, the transport costs of the
Engineering Department are usually provided by the builder. The
inspection involves quality checks of materials and procedures (1 -- 2
hours).
1 day no charge
6
Request opinions on project completion (final inspection)
There is one joint inspection by the Fire Department, Public Health
Department and Building Inspectorate. This final joint inspection is
done as a prerequisite to obtaining the occupancy permit. BuildCo
must inform the Building Inspectorate of the completion of the
construction and they organize the joint inspection. Sometimes this
requires significant follow up but generally it takes 1 week to organize
and the inspection itself is done in 1 day. If the final inspection goes
well (the building is built according to design, safety of building is
according to standards etc.), the Public Health Department will then
issue the occupancy permit.
7 days no charge
7
Obtain completion certificate/ occupancy permit
21 days no charge
8
* Request water and sewerage services and inspection
1 day no charge
9
Receive site inspection by the water authority
Site inspection and estimation of water and sewerage installation costs
are done at this stage. After the inspection has been requested, it takes
about 3 days for the inspection team to check the construction site.
1 day no charge
10
Obtain water and sewerage connection
7 days ZMK 500,000
11
* Obtain telephone connection
This procedure for obtaining telephone service can be started as soon
as the occupancy permit has been obtained.
10 days ZMK 300,000
* Takes place simultaneously with another procedure.
Note: Online procedures account for 0.5 days in the total time calculation.
Source: Doing Business database.
31 Zambia Doing Business 2014
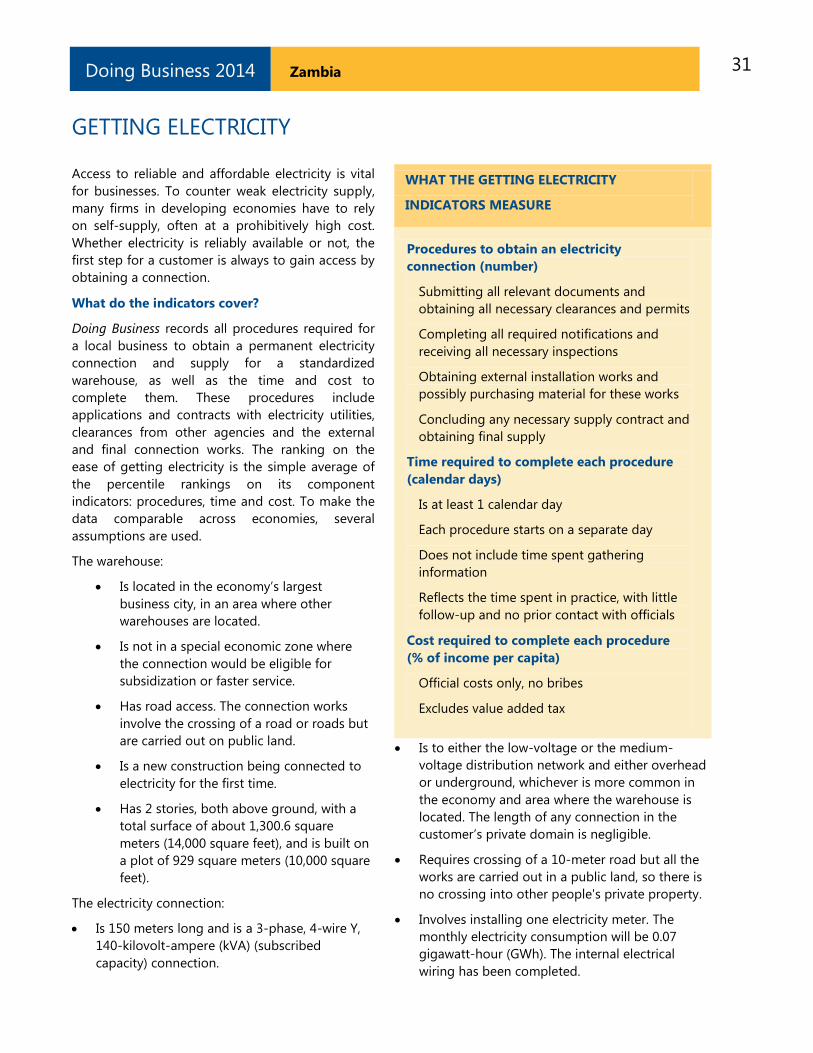
GETTING ELECTRICITY
Access to reliable and affordable electricity is vital
for businesses. To counter weak electricity supply,
many firms in developing economies have to rely
on self-supply, often at a prohibitively high cost.
Whether electricity is reliably available or not, the
first step for a customer is always to gain access by
obtaining a connection.
What do the indicators cover?
Doing Business records all procedures required for
a local business to obtain a permanent electricity
connection and supply for a standardized
warehouse, as well as the time and cost to
complete them. These procedures include
applications and contracts with electricity utilities,
clearances from other agencies and the external
and final connection works. The ranking on the
ease of getting electricity is the simple average of
the percentile rankings on its component
indicators: procedures, time and cost. To make the
data comparable across economies, several
assumptions are used.
The warehouse:
Is located in the economy’s largest
business city, in an area where other
warehouses are located.
Is not in a special economic zone where
the connection would be eligible for
subsidization or faster service.
Has road access. The connection works
involve the crossing of a road or roads but
are carried out on public land.
Is a new construction being connected to
electricity for the first time.
Has 2 stories, both above ground, with a
total surface of about 1,300.6 square
meters (14,000 square feet), and is built on
a plot of 929 square meters (10,000 square
feet).
The electricity connection:
Is 150 meters long and is a 3-phase, 4-wire Y,
140-kilovolt-ampere (kVA) (subscribed
capacity) connection.
WHAT THE GETTING ELECTRICITY
INDICATORS MEASURE
Procedures to obtain an electricity
connection (number)
Submitting all relevant documents and
obtaining all necessary clearances and permits
Completing all required notifications and
receiving all necessary inspections
Obtaining external installation works and
possibly purchasing material for these works
Concluding any necessary supply contract and
obtaining final supply
Time required to complete each procedure
(calendar days)
Is at least 1 calendar day
Each procedure starts on a separate day
Does not include time spent gathering
information
Reflects the time spent in practice, with little
follow-up and no prior contact with officials
Cost required to complete each procedure
(% of income per capita)
Official costs only, no bribes
Excludes value added tax
Is to either the low-voltage or the medium-
voltage distribution network and either overhead
or underground, whichever is more common in
the economy and area where the warehouse is
located. The length of any connection in the
customer’s private domain is negligible.
Requires crossing of a 10-meter road but all the
works are carried out in a public land, so there is
no crossing into other people's private property.
Involves installing one electricity meter. The
monthly electricity consumption will be 0.07
gigawatt-hour (GWh). The internal electrical
wiring has been completed.
32 Zambia Doing Business 2014
GETTING ELECTRICITY
Where does the economy stand today?
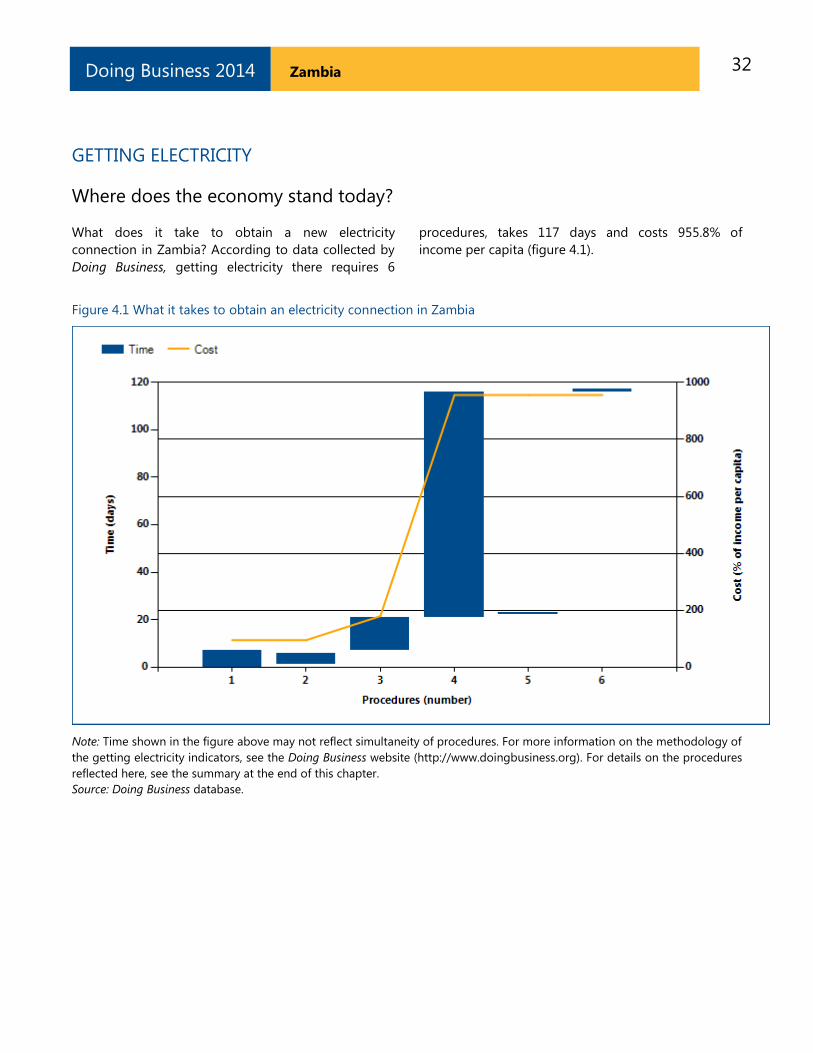
What does it take to obtain a new electricity
connection in Zambia? According to data collected by
Doing Business, getting electricity there requires 6
procedures, takes 117 days and costs 955.8% of
income per capita (figure 4.1).
Figure 4.1 What it takes to obtain an electricity connection in Zambia
Note: Time shown in the figure above may not reflect simultaneity of procedures. For more information on the methodology of
the getting electricity indicators, see the Doing Business website (http://www.doingbusiness.org). For details on the procedures
reflected here, see the summary at the end of this chapter.
Source: Doing Business database.
33 Zambia Doing Business 2014
GETTING ELECTRICITY
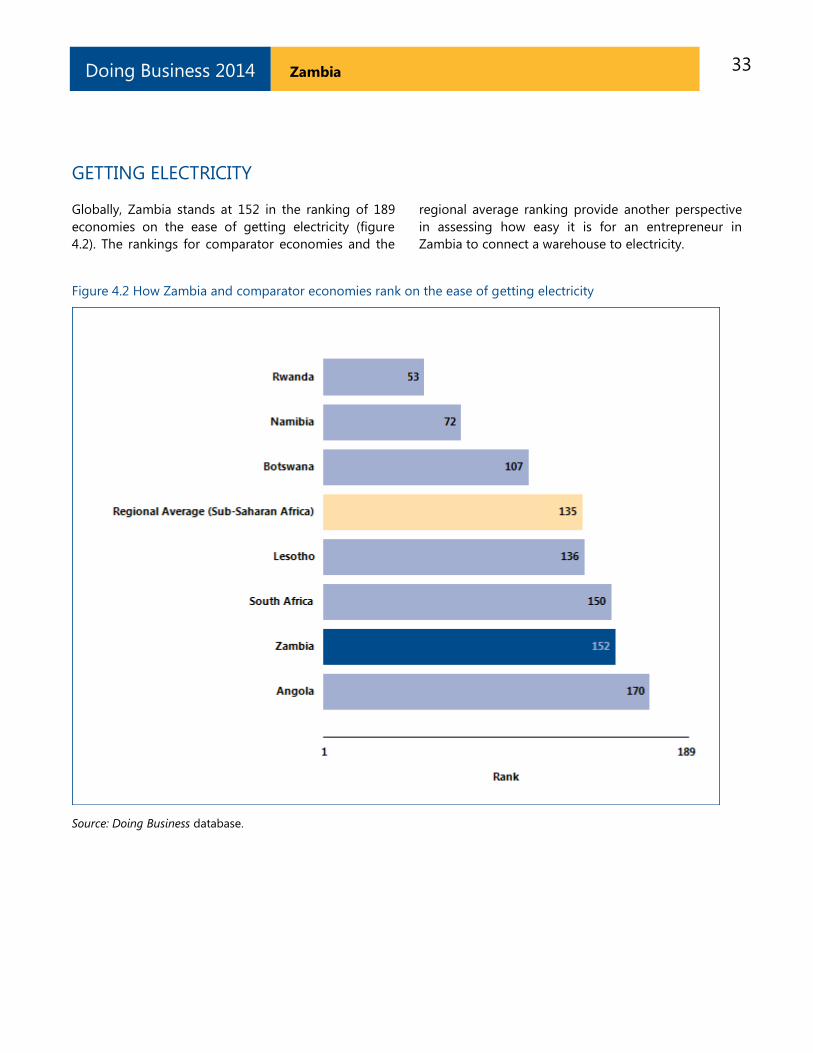
Globally, Zambia stands at 152 in the ranking of 189
economies on the ease of getting electricity (figure
4.2). The rankings for comparator economies and the
regional average ranking provide another perspective
in assessing how easy it is for an entrepreneur in
Zambia to connect a warehouse to electricity.
Figure 4.2 How Zambia and comparator economies rank on the ease of getting electricity
Source: Doing Business database.
34 Zambia Doing Business 2014
GETTING ELECTRICITY
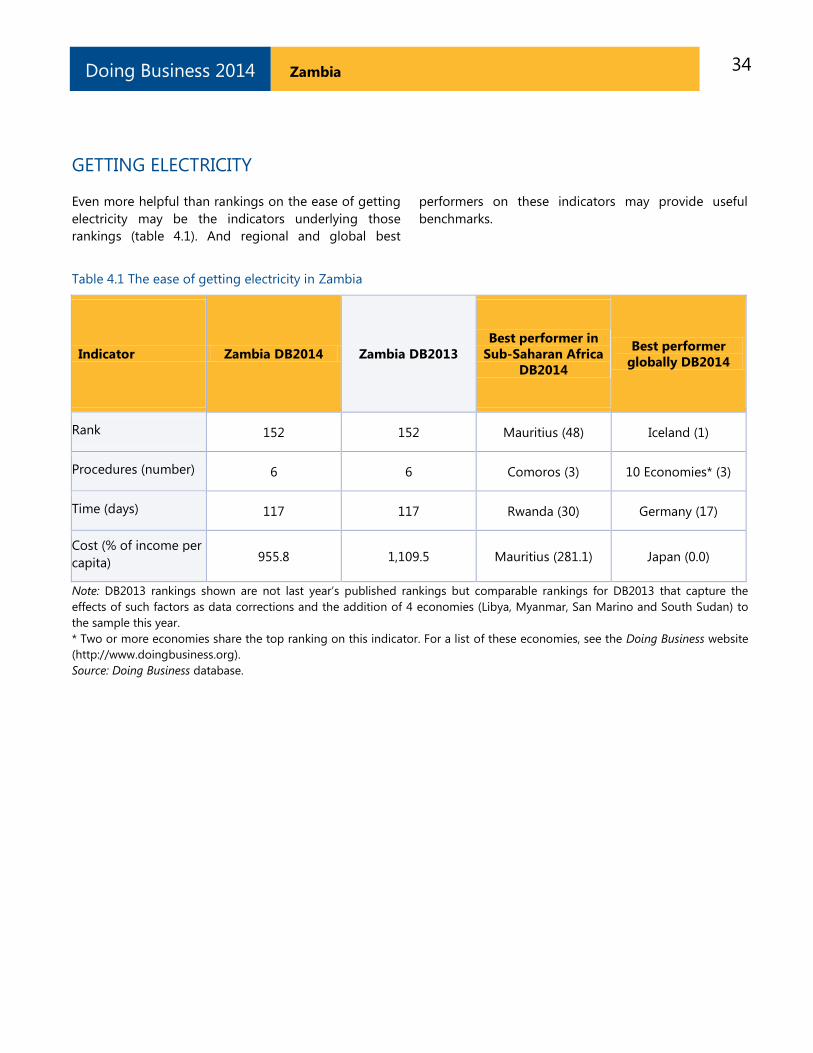
Even more helpful than rankings on the ease of getting
electricity may be the indicators underlying those
rankings (table 4.1). And regional and global best
performers on these indicators may provide useful
benchmarks.
Table 4.1 The ease of getting electricity in Zambia
Indicator Zambia DB2014 Zambia DB2013
Best performer in
Sub-Saharan Africa
DB2014
Best performer
globally DB2014
Rank 152 152 Mauritius (48) Iceland (1)
Procedures (number) 6 6 Comoros (3) 10 Economies* (3)
Time (days) 117 117 Rwanda (30) Germany (17)
Cost (% of income per
capita) 955.8 1,109.5 Mauritius (281.1) Japan (0.0)
Note: DB2013 rankings shown are not last year’s published rankings but comparable rankings for DB2013 that capture the
effects of such factors as data corrections and the addition of 4 economies (Libya, Myanmar, San Marino and South Sudan) to
the sample this year.
* Two or more economies share the top ranking on this indicator. For a list of these economies, see the Doing Business website
(http://www.doingbusiness.org).
Source: Doing Business database.
35 Zambia Doing Business 2014
GETTING ELECTRICITY
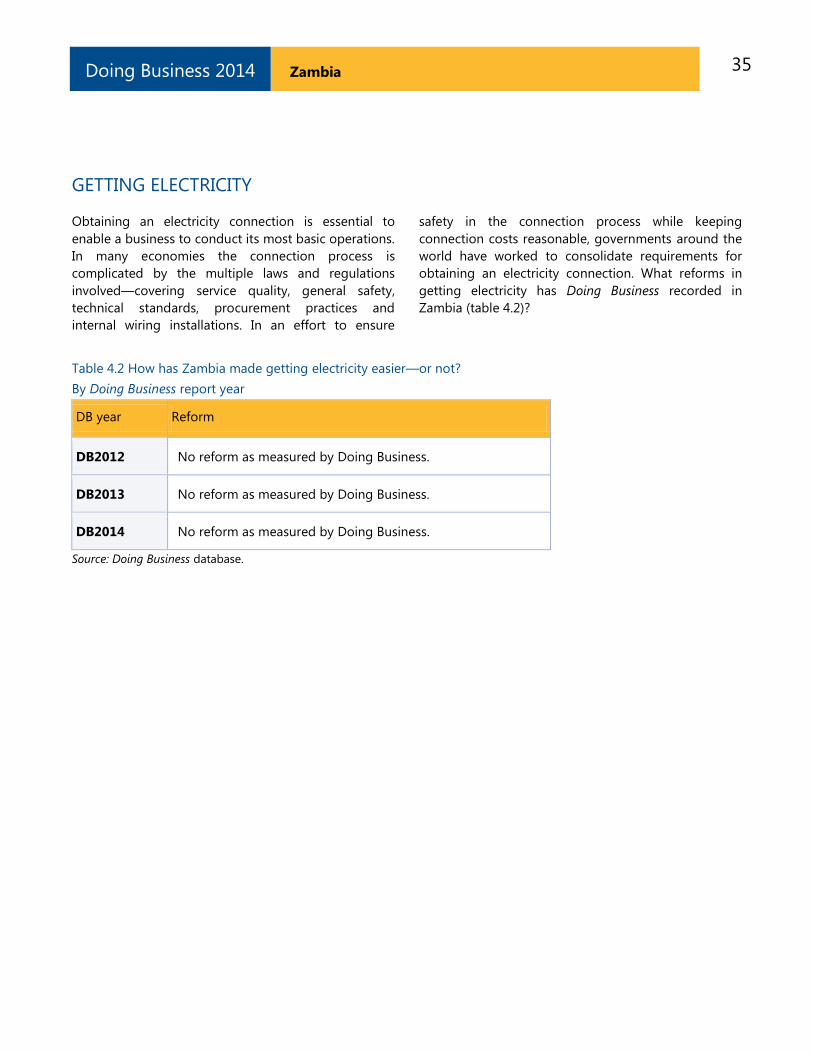
Obtaining an electricity connection is essential to
enable a business to conduct its most basic operations.
In many economies the connection process is
complicated by the multiple laws and regulations
involved—covering service quality, general safety,
technical standards, procurement practices and
internal wiring installations. In an effort to ensure
safety in the connection process while keeping
connection costs reasonable, governments around the
world have worked to consolidate requirements for
obtaining an electricity connection. What reforms in
getting electricity has Doing Business recorded in
Zambia (table 4.2)?
Table 4.2 How has Zambia made getting electricity easier—or not?
By Doing Business report year
DB year Reform
DB2012 No reform as measured by Doing Business.
DB2013 No reform as measured by Doing Business.
DB2014 No reform as measured by Doing Business.
Source: Doing Business database.
36 Zambia Doing Business 2014
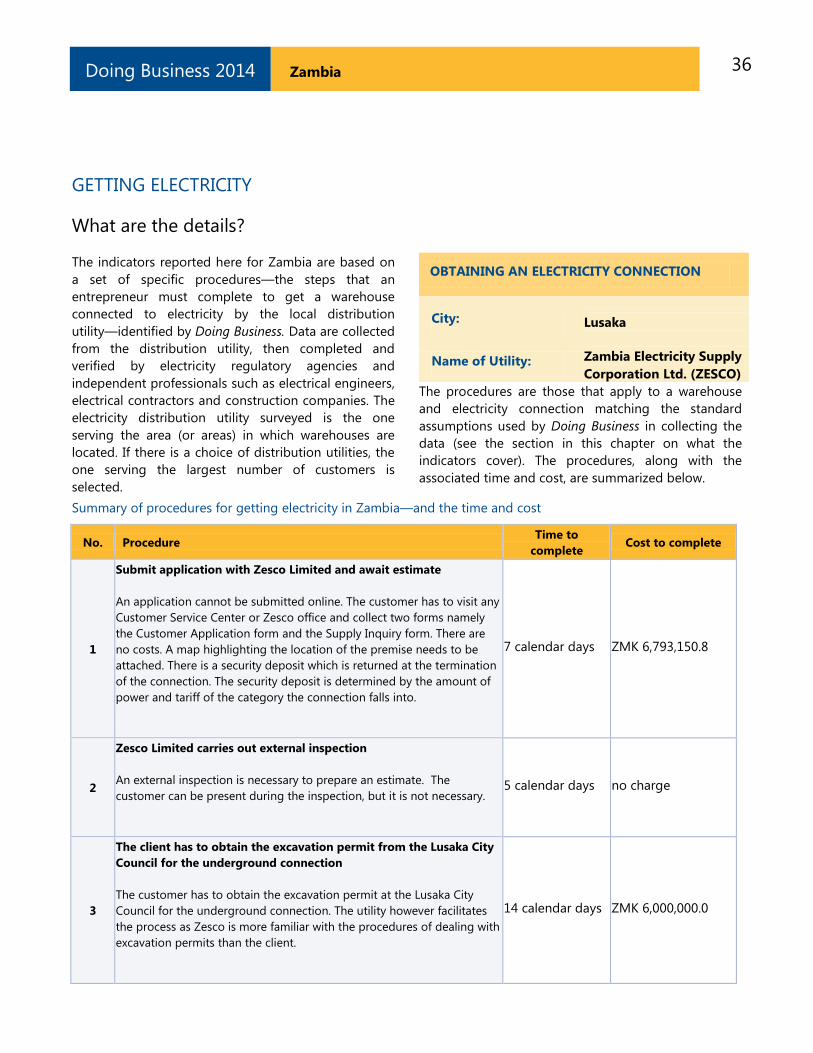
GETTING ELECTRICITY
What are the details?
The indicators reported here for Zambia are based on
a set of specific procedures—the steps that an
entrepreneur must complete to get a warehouse
connected to electricity by the local distribution
utility—identified by Doing Business. Data are collected
from the distribution utility, then completed and
verified by electricity regulatory agencies and
independent professionals such as electrical engineers,
electrical contractors and construction companies. The
electricity distribution utility surveyed is the one
serving the area (or areas) in which warehouses are
located. If there is a choice of distribution utilities, the
one serving the largest number of customers is
selected.
OBTAINING AN ELECTRICITY CONNECTION
City: Lusaka
Name of Utility: Zambia Electricity Supply
Corporation Ltd. (ZESCO)
The procedures are those that apply to a warehouse
and electricity connection matching the standard
assumptions used by Doing Business in collecting the
data (see the section in this chapter on what the
indicators cover). The procedures, along with the
associated time and cost, are summarized below.
Summary of procedures for getting electricity in Zambia—and the time and cost
No. Procedure Time to
complete Cost to complete
1
Submit application with Zesco Limited and await estimate
An application cannot be submitted online. The customer has to visit any
Customer Service Center or Zesco office and collect two forms namely
the Customer Application form and the Supply Inquiry form. There are
no costs. A map highlighting the location of the premise needs to be
attached. There is a security deposit which is returned at the termination
of the connection. The security deposit is determined by the amount of
power and tariff of the category the connection falls into.
7 calendar days ZMK 6,793,150.8
2
Zesco Limited carries out external inspection
An external inspection is necessary to prepare an estimate. The
customer can be present during the inspection, but it is not necessary.
5 calendar days no charge
3
The client has to obtain the excavation permit from the Lusaka City
Council for the underground connection
The customer has to obtain the excavation permit at the Lusaka City
Council for the underground connection. The utility however facilitates
the process as Zesco is more familiar with the procedures of dealing with
excavation permits than the client.
14 calendar days ZMK 6,000,000.0
37 Zambia Doing Business 2014
No. Procedure Time to
complete Cost to complete
4
Accept estimate and await completion of external connection works
by Zesco Limited
Zesco is in charge of the external connection works. After the quotation
has been paid, the customer has to wait before the external connection
works start. The time is needed for material mobilization and other
necessary preparation. All the material is provided by Zesco.
95 calendar days ZMK 55,300,000.0
5
Zesco Limited carries out internal inspection
An internal inspection is necessary to assess if the internal wiring is
conform to Zesco standards. If the wiring is not conforming to Zesco
standards, then Zesco will issue a certificate to “fail” the wiring. The
electrician in charge of the internal wiring does not have to be licensed
and/or registered with Zesco. The electrical contractor should be present
and in case something is wrong, they can be told to rectify and retest.
The internal inspection is a necessary condition for opening the meter.
Once the team verified that your internal wiring is correctly done they
pass over the documents to the team in charge of meter installation.
1 calendar day no charge
6
Zesco Limited installs the meter and does the final connection
The meter gets installed after the connection has been done. Zesco will
call the customer to verify that he and his electrician are on the site and
they will come and install the meter. The installation is done by the
metering department. The cost of the meter is included in the estimate.
1 calendar day no charge
* Takes place simultaneously with another procedure.
Source: Doing Business database.
38 Zambia Doing Business 2014
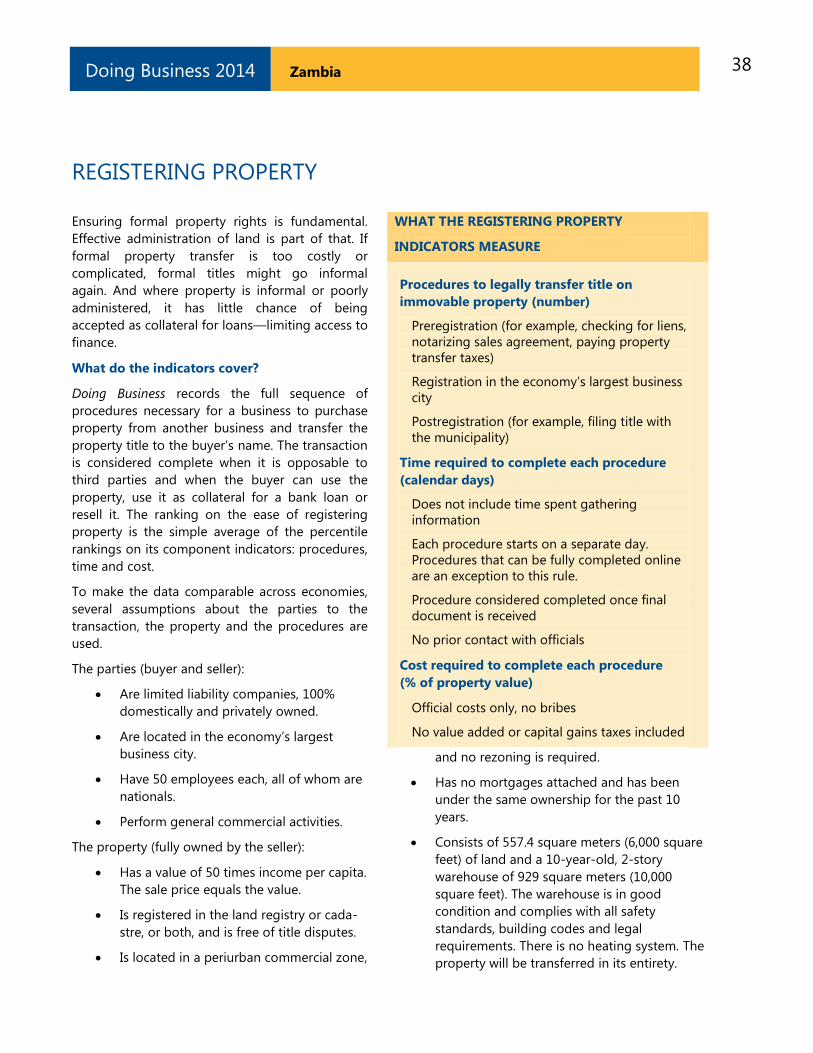
REGISTERING PROPERTY Ensuring formal property rights is fundamental.
Effective administration of land is part of that. If
formal property transfer is too costly or
complicated, formal titles might go informal
again. And where property is informal or poorly
administered, it has little chance of being
accepted as collateral for loans—limiting access to
finance.
What do the indicators cover?
Doing Business records the full sequence of
procedures necessary for a business to purchase
property from another business and transfer the
property title to the buyer’s name. The transaction
is considered complete when it is opposable to
third parties and when the buyer can use the
property, use it as collateral for a bank loan or
resell it. The ranking on the ease of registering
property is the simple average of the percentile
rankings on its component indicators: procedures,
time and cost.
To make the data comparable across economies,
several assumptions about the parties to the
transaction, the property and the procedures are
used.
The parties (buyer and seller):
Are limited liability companies, 100%
domestically and privately owned.
Are located in the economy’s largest
business city.
Have 50 employees each, all of whom are
nationals.
Perform general commercial activities.
The property (fully owned by the seller):
Has a value of 50 times income per capita.
The sale price equals the value.
Is registered in the land registry or cada-
stre, or both, and is free of title disputes.
Is located in a periurban commercial zone,
WHAT THE REGISTERING PROPERTY
INDICATORS MEASURE
Procedures to legally transfer title on
immovable property (number)
Preregistration (for example, checking for liens,
notarizing sales agreement, paying property
transfer taxes)
Registration in the economy’s largest business
city
Postregistration (for example, filing title with
the municipality)
Time required to complete each procedure
(calendar days)
Does not include time spent gathering
information
Each procedure starts on a separate day.
Procedures that can be fully completed online
are an exception to this rule.
Procedure considered completed once final
document is received
No prior contact with officials
Cost required to complete each procedure
(% of property value)
Official costs only, no bribes
No value added or capital gains taxes included
and no rezoning is required.
Has no mortgages attached and has been
under the same ownership for the past 10
years.
Consists of 557.4 square meters (6,000 square
feet) of land and a 10-year-old, 2-story
warehouse of 929 square meters (10,000
square feet). The warehouse is in good
condition and complies with all safety
standards, building codes and legal
requirements. There is no heating system. The
property will be transferred in its entirety.
39 Zambia Doing Business 2014
REGISTERING PROPERTY
Where does the economy stand today?
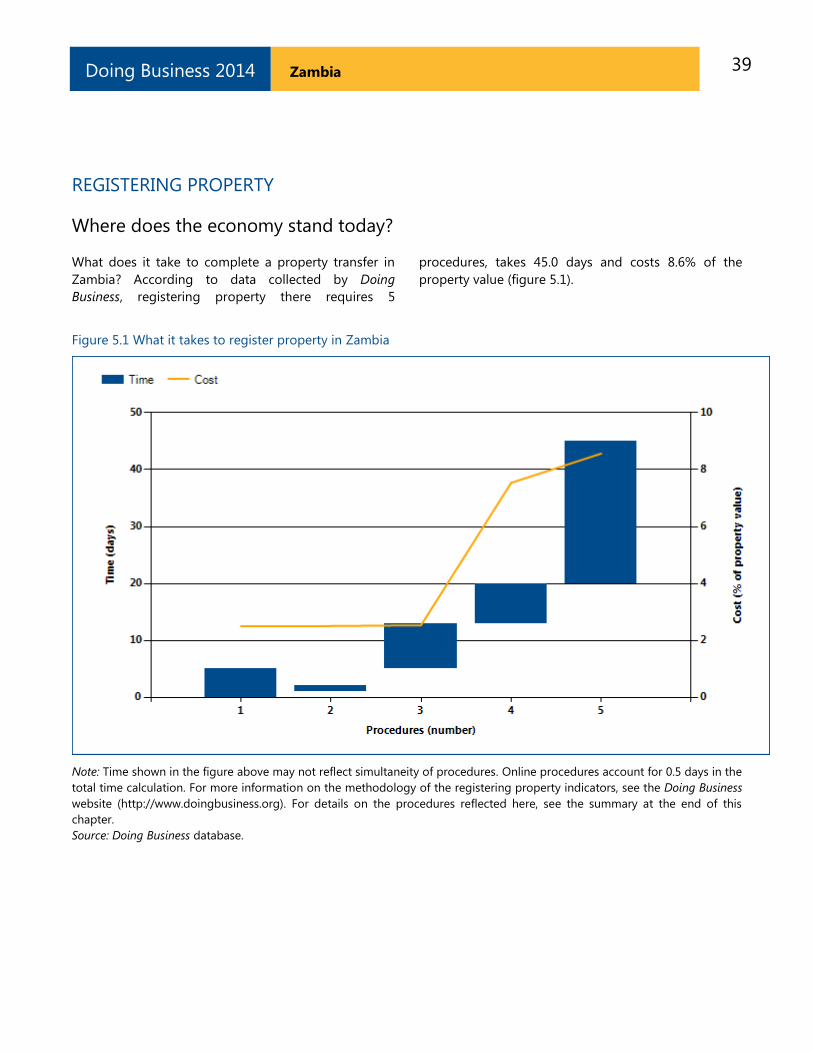
What does it take to complete a property transfer in
Zambia? According to data collected by Doing
Business, registering property there requires 5
procedures, takes 45.0 days and costs 8.6% of the
property value (figure 5.1).
Figure 5.1 What it takes to register property in Zambia
Note: Time shown in the figure above may not reflect simultaneity of procedures. Online procedures account for 0.5 days in the
total time calculation. For more information on the methodology of the registering property indicators, see the Doing Business
website (http://www.doingbusiness.org). For details on the procedures reflected here, see the summary at the end of this
chapter.
Source: Doing Business database.
40 Zambia Doing Business 2014
REGISTERING PROPERTY
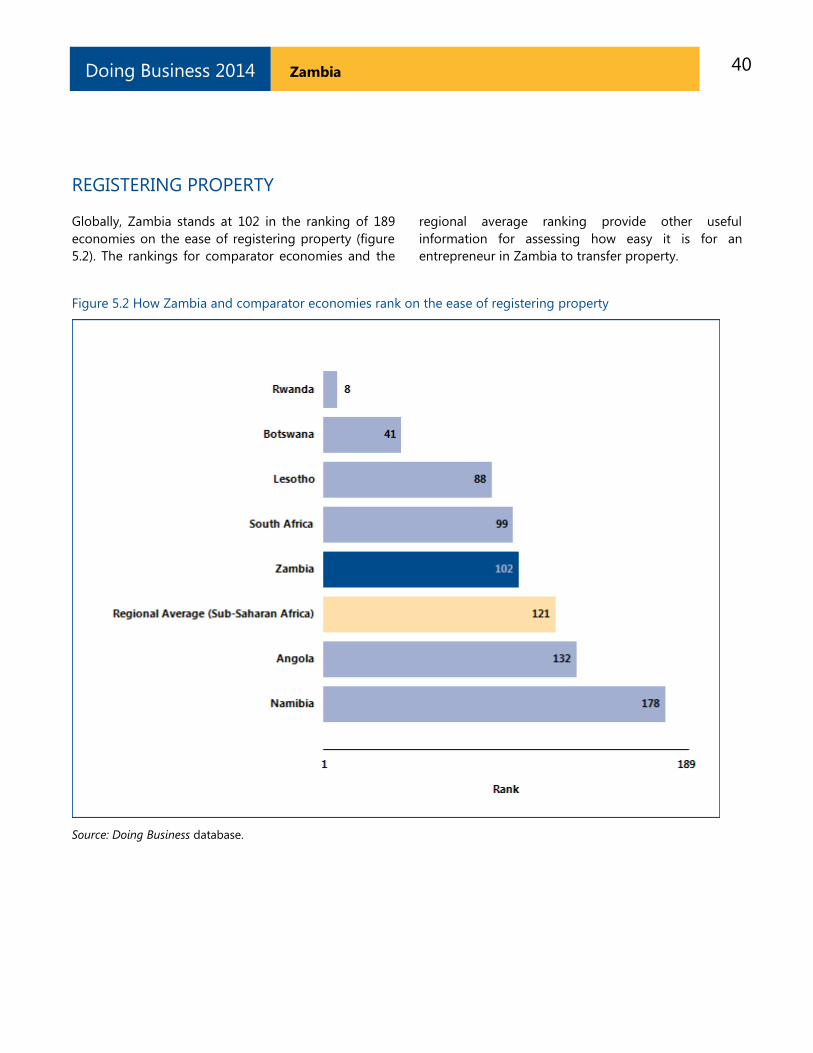
Globally, Zambia stands at 102 in the ranking of 189
economies on the ease of registering property (figure
5.2). The rankings for comparator economies and the
regional average ranking provide other useful
information for assessing how easy it is for an
entrepreneur in Zambia to transfer property.
Figure 5.2 How Zambia and comparator economies rank on the ease of registering property
Source: Doing Business database.

41 Zambia Doing Business 2014
REGISTERING PROPERTY
What are the changes over time?
The benchmarks provided by the economies that over
time have had the best performance regionally or
globally on the procedures, time or cost required to
complete a property transfer (figure 5.3) help show
what is possible in making it easier to register
property. And changes in regional averages can show
where Zambia is keeping up—and where it is falling
behind.
Figure 5.3 Has registering property become easier over time?
Procedures (number)
Time (days)

42 Zambia Doing Business 2014
REGISTERING PROPERTY
Cost (% of property value)
Note: DB2013 rankings shown are not last year’s published rankings but comparable rankings for
DB2013 that capture the effects of such factors as data corrections and the addition of 4 economies
(Libya, Myanmar, San Marino and South Sudan) to the sample this year. For more information on “no
practice” marks, see the data notes.
Source: Doing Business database.

43 Zambia Doing Business 2014
REGISTERING PROPERTY
Economies worldwide have been making it easier for
entrepreneurs to register and transfer property—such
as by computerizing land registries, introducing time
limits for procedures and setting low fixed fees. Many
have cut the time required substantially—enabling
buyers to use or mortgage their property earlier. What
property registration reforms has Doing Business
recorded in Zambia (table 5.1)?
Table 5.1 How has Zambia made registering property easier—or not?
By Doing Business report year
DB year Reform
DB2009
Zambia computerized its land registry and set up a customer
service center to eliminate the backlog of registration requests.
As a result, the time required to register a property in Zambia
is reduced from 70 to 39 days.
DB2010 No reform as measured by Doing Business.
DB2011 No reform as measured by Doing Business.
DB2012 Zambia made registering property more costly by increasing
the property transfer tax rate.
DB2013 No reform as measured by Doing Business.
DB2014 No reform as measured by Doing Business.
Note: For information on reforms in earlier years (back to DB2005), see the Doing Business
reports for these years, available at http://www.doingbusiness.org.
Source: Doing Business database.
44 Zambia Doing Business 2014
REGISTERING PROPERTY
What are the details?
The indicators reported here are based on a set of
specific procedures—the steps that a buyer and
seller must complete to transfer the property to the
buyer’s name—identified by Doing Business
through information collected from local property
lawyers, notaries and property registries. These
procedures are those that apply to a transaction
matching the standard assumptions used by Doing
Business in collecting the data (see the section in
this chapter on what the indicators cover).
STANDARD PROPERTY TRANSFER
City: Lusaka
Property Value: ZMK 356,218,320
The procedures, along with the associated time and
cost, are summarized below.
Summary of procedures for registering property in Zambia—and the time and cost
No. Procedure Time to
complete Cost to complete
1
* Lawyer drafts the sale agreement, which is exchanged between
buyer and seller
In practice, both the seller and purchaser employ a lawyer for the
transaction. The fees are negotiable, but cannot legally exceed 10%.
3-7 days
(simultaneous
with procedure 1)
1- 10% of the
property value
2
* Lawyer obtains a non-encumbrance certificate
The search is conducted at the Registry of Land and Deeds. The
interested parties can conduct an electronic search that provides basic
information about the land, the owner of the lease, and the date of
ownership of the lease. In order to get more detailed information, a
manual search needs to be conducted. For this search, the lawyer must
go directly to the Ministry of Lands to search for the history of the plot
and the relevant documents.
1 day
(simultaneous
with procedure 2)
ZMK 25,000 /
ZMW 25
3
The seller applies for the state’s consent to assign
The Commissioner of Lands will verify that the property can be
transferred, by checking if ground rent has been paid, and who is buying.
The land in Zambia belongs to the State, and can only be purchased by
Zambians, Zambian companies, established residents or investors. This
application is lodged with the Commissioner of Lands and if all ground
rent has been settled and all application papers are in order, the
Commissioner of Lands will issue the consent to assign. While the
State’s consent to assign application is being processed, the buyer and
seller can finalize the deed of assignment, but the sale price stated
therein will be subject to the State’s consent for the sale at that price.
7-10 days ZMK 100,000 /
ZMW 100
45 Zambia Doing Business 2014
No. Procedure Time to
complete Cost to complete
The documentation shall include: the consent application, consent fees,
buyer’s details such as nationality, address, etc. to show he qualifies to
purchase property.
4
The seller settles the Property Transfer Tax with the Zambian
Revenue Authority (ZRA)
The Property Transfer Tax Act, CAP340, provides that whenever property
is transferred, Property Transfer Tax (PTT) is charged upon and collected
from, the person transferring the property (transferor) on the Realizable
Value (i.e. Open Market Value or Contract Price, whichever is higher). The
ZRA assesses if the value of the property is correctly stated in the deed
of assignment and then it will produce a clearance certificate which is
valid for 6 months. The tax is payable by the transferor. PTT filings
require the following documentation:
• NRC/Certificate of Incorporation of both the BUYER & SELLER;
•State/Council CONSENT;
•Seller’s TPIN #;
•Contract of Sale/Deed of Gift or Transfer;
•Lawyer’s STAMP (where dealing as an Advocate of EITHER party);
•VALUATION REPORT (for ALL transactions above ZMK 500 million/ZMW
500,000).
Both a receipt for the payment of the Property Transfer Tax and the Tax
Clearance Certificate are obtained in this step.
7 days
5% of the
consideration of
the transaction or
the value of the
property,
whichever is
higher.
5
The purchaser lodges the assignment for registration at the Lands
and Deeds Registry to complete the process
The documentation shall include:
Seller’s title deeds (Certificate of Title)
Executed assignment in duplicate
State’s consent to assign (obtain in Procedure 3)
Receipt for payment of Property Transfer Tax (obtained in Procedure 4)
Tax Clearance Certificate (obtained in Procedure 4)
Form DR53 (gives brief details of the transaction, such as seller, buyer,
consideration, property number, rentable value, etc.)
Receipt for payment of transfer fees
In June 2008, the Government of Zambia, following a survey done in
2007 to understand the reason of the backlog at the Lands Registry,
implemented a Customer Service Relation Centre and also fully
computerized the Land Registry.
The Statutory Instrument No. 8 of 2013 on January 15, 2013 eliminated
the maximum fee of ZMK 2 million / ZMW 2,000 payable for the
registration of assignments and transfers. As a result, companies now
25 days
1% of property
value (registration
fee) + ZMK
100,000 (ZMW
100) for the Deed
of Assignment
46 Zambia Doing Business 2014
No. Procedure Time to
complete Cost to complete
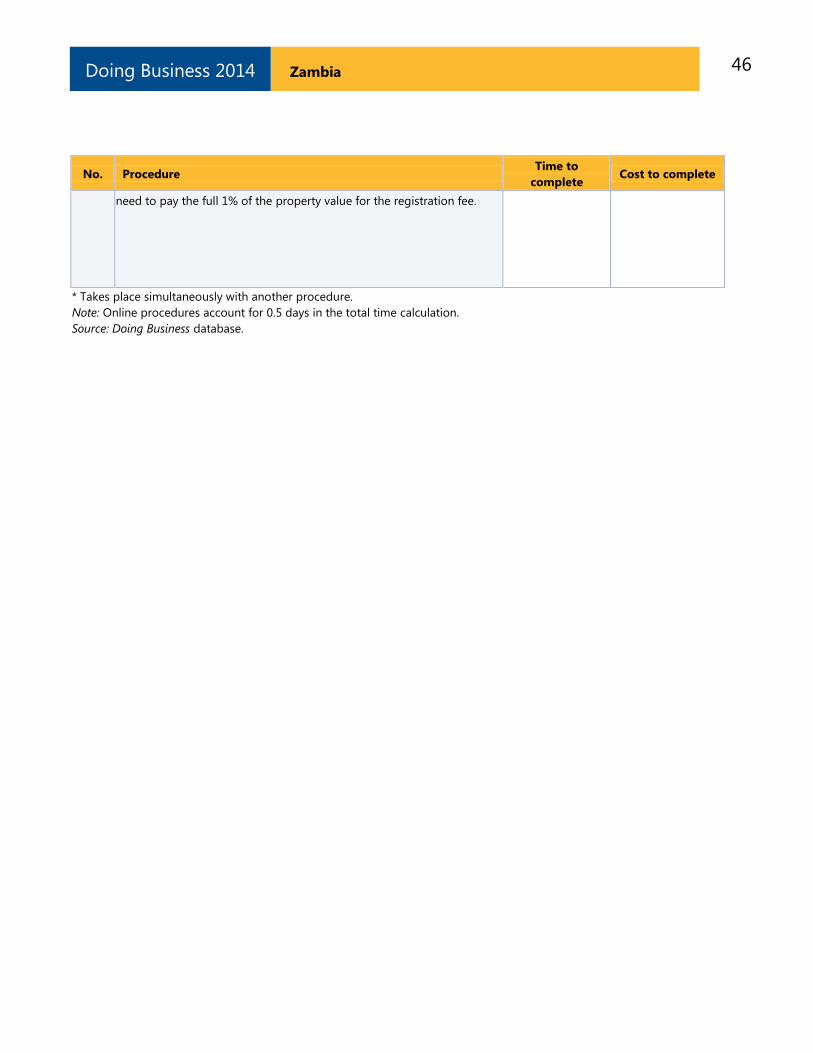
need to pay the full 1% of the property value for the registration fee.
* Takes place simultaneously with another procedure.
Note: Online procedures account for 0.5 days in the total time calculation.
Source: Doing Business database.
47 Zambia Doing Business 2014
GETTING CREDIT
Two types of frameworks can facilitate access to
credit and improve its allocation: credit information
systems and borrowers and lenders in collateral and
bankruptcy laws. Credit information systems enable
lenders’ rights to view a potential borrower’s
financial history (positive or negative)—valuable
information to consider when assessing risk. And
they permit borrowers to establish a good credit
history that will allow easier access to credit. Sound
collateral laws enable businesses to use their assets,
especially movable property, as security to generate
capital—while strong creditors’ rights have been
associated with higher ratios of private sector credit
to GDP.
What do the indicators cover?
Doing Business assesses the sharing of credit
information and the legal rights of borrowers and
lenders with respect to secured transactions
through 2 sets of indicators. The depth of credit
information index measures rules and practices
affecting the coverage, scope and accessibility of
credit information available through a public credit
registry or a private credit bureau. The strength of
legal rights index measures whether certain features
that facilitate lending exist within the applicable
collateral and bankruptcy laws. Doing Business uses
case scenarios to determine the scope of the
secured transactions system, involving a secured
borrower and a secured lender and examining legal
restrictions on the use of movable collateral. These
scenarios assume that the borrower:
Is a private, incorporated, limited liability
company.
Has its headquarters and only base of
operations in the largest business city.
WHAT THE GETTING CREDIT INDICATORS
MEASURE
Strength of legal rights index (0–10)
Rights of borrowers and lenders through
collateral laws
Protection of secured creditors’ rights through
bankruptcy laws
Depth of credit information index (0–6)
Scope and accessibility of credit information
distributed by public credit registries and
private credit bureaus
Public credit registry coverage (% of adults)
Number of individuals and firms listed in
public credit registry as percentage of adult
population
Private credit bureau coverage (% of adults)
Number of individuals and firms listed in
largest private credit bureau as percentage of
adult population
Has up to 100 employees.
Is 100% domestically owned, as is the lender.
The ranking on the ease of getting credit is based on
the percentile rankings on the sum of its component
indicators: the depth of credit information index and
the strength of legal rights index.
48 Zambia Doing Business 2014
GETTING CREDIT
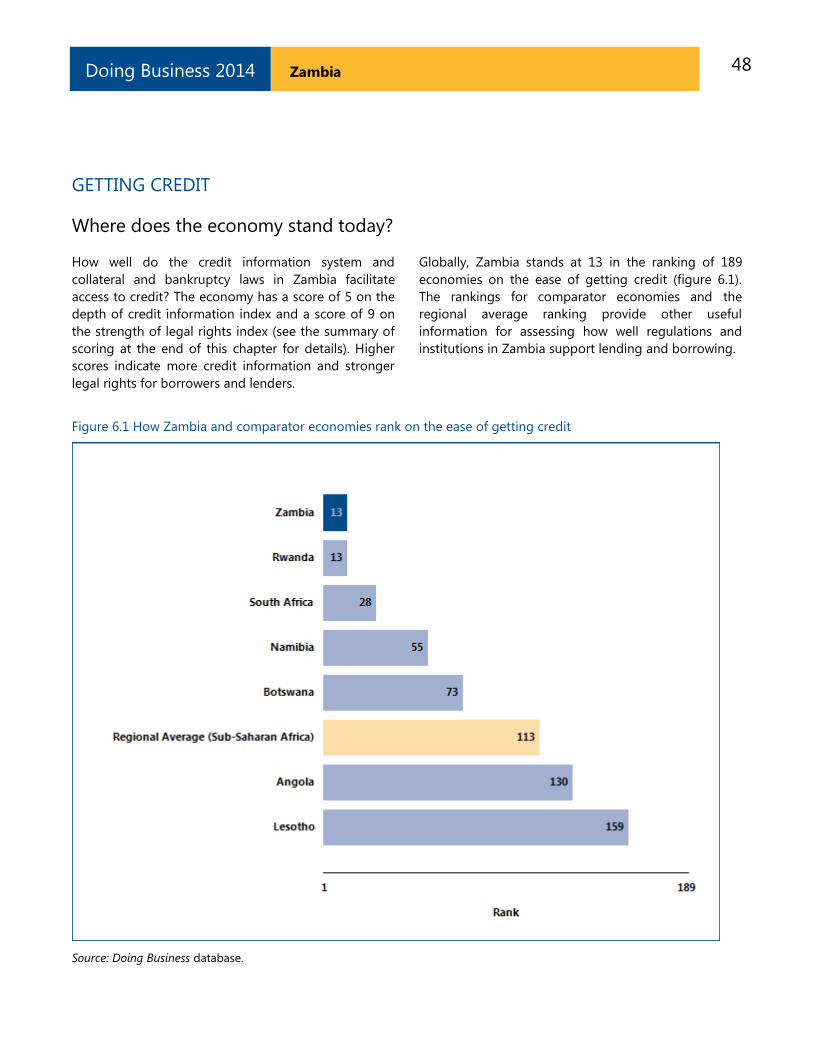
Where does the economy stand today?
How well do the credit information system and
collateral and bankruptcy laws in Zambia facilitate
access to credit? The economy has a score of 5 on the
depth of credit information index and a score of 9 on
the strength of legal rights index (see the summary of
scoring at the end of this chapter for details). Higher
scores indicate more credit information and stronger
legal rights for borrowers and lenders.
Globally, Zambia stands at 13 in the ranking of 189
economies on the ease of getting credit (figure 6.1).
The rankings for comparator economies and the
regional average ranking provide other useful
information for assessing how well regulations and
institutions in Zambia support lending and borrowing.
Figure 6.1 How Zambia and comparator economies rank on the ease of getting credit
Source: Doing Business database.

49 Zambia Doing Business 2014
GETTING CREDIT
What are the changes over time?
While the most recent Doing Business data reflect how
well the credit information system and collateral and
bankruptcy laws in Zambia support lending and
borrowing today, data over time can help show where
institutions and regulations have been strengthened—
and where they have not (table 6.1). That can help
identify where the potential for improvement is
greatest.
Table 6.1 The ease of getting credit in Zambia over time
By Doing Business report year
Indicator DB2005 DB2006 DB2007 DB2008 DB2009 DB2010 DB2011 DB2012 DB2013 DB2014
Rank .. .. .. .. .. .. .. .. 11 13
Strength of legal rights
index (0-10) 9 9 9 9 9 9 9 9 9 9
Depth of credit
information index (0-6) 0 0 0 0 0 3 5 5 5 5
Public registry coverage
(% of adults) 0.0 0.0 0.0 0.0 0.0 0.0 0.0 0.0 0.0 0.0
Private bureau
coverage (% of adults) 0.0 0.0 0.0 0.0 0.1 0.4 3.0 4.3 5.4 12.0
Note: n.a. = not applicable (the economy was not included in Doing Business for that year). DB2013 rankings shown are not last
year’s published rankings but comparable rankings for DB2013 that capture the effects of such factors as data corrections and
the addition of 4 economies (Libya, Myanmar, San Marino and South Sudan) to the sample this year.
Source: Doing Business database.
50 Zambia Doing Business 2014
GETTING CREDIT
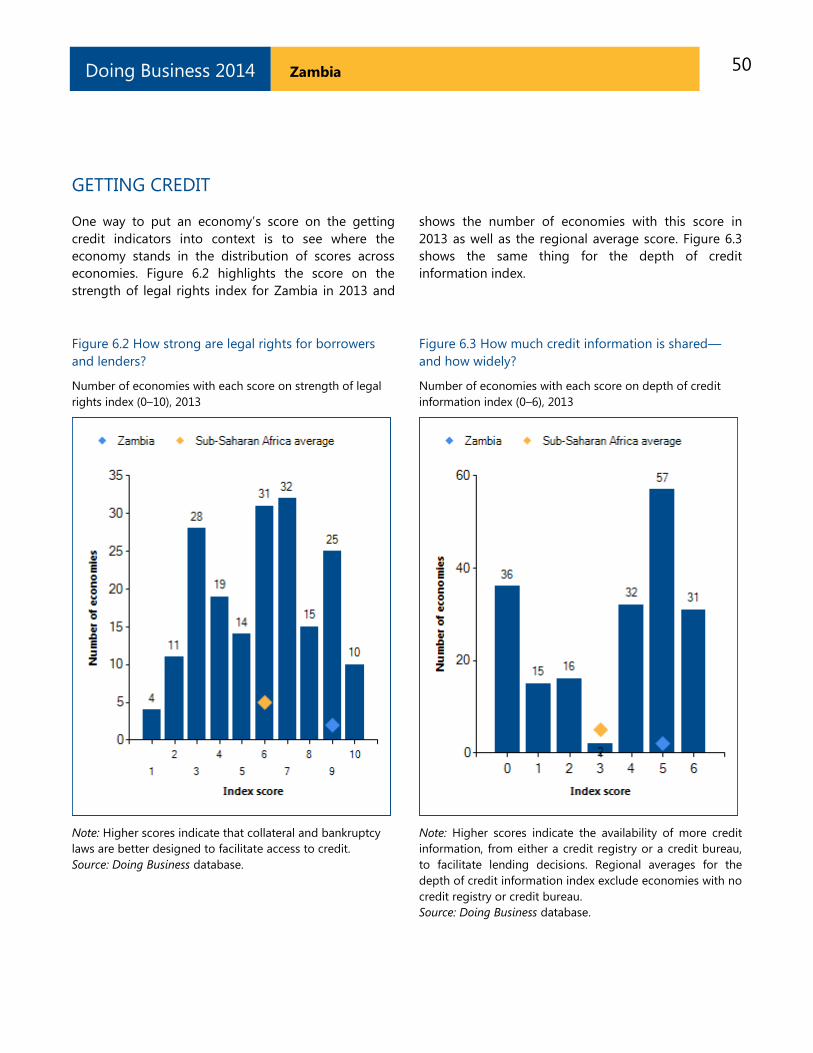
One way to put an economy’s score on the getting
credit indicators into context is to see where the
economy stands in the distribution of scores across
economies. Figure 6.2 highlights the score on the
strength of legal rights index for Zambia in 2013 and
shows the number of economies with this score in
2013 as well as the regional average score. Figure 6.3
shows the same thing for the depth of credit
information index.
Figure 6.2 How strong are legal rights for borrowers
and lenders?
Figure 6.3 How much credit information is shared—
and how widely?
Number of economies with each score on strength of legal
rights index (0–10), 2013
Note: Higher scores indicate that collateral and bankruptcy
laws are better designed to facilitate access to credit.
Source: Doing Business database.
Number of economies with each score on depth of credit
information index (0–6), 2013
Note: Higher scores indicate the availability of more credit
information, from either a credit registry or a credit bureau,
to facilitate lending decisions. Regional averages for the
depth of credit information index exclude economies with no
credit registry or credit bureau.
Source: Doing Business database.
51 Zambia Doing Business 2014
GETTING CREDIT
When economies strengthen the legal rights of lenders
and borrowers under collateral and bankruptcy laws,
and increase the scope, coverage and accessibility of
credit information, they can increase entrepreneurs’
access to credit. What credit reforms has Doing
Business recorded in Zambia (table 6.2)?
Table 6.2 How has Zambia made getting credit easier—or not?
By Doing Business report year
DB year Reform
DB2009 No reform as measured by Doing Business.
DB2010
Zambia strengthened access to credit information by making it
mandatory for banks and non-bank financial instituitions
registered with Bank of Zambia to use credit reference reports
and provide data to the Bureau.
DB2011 No reform as measured by Doing Business.
DB2012 No reform as measured by Doing Business.
DB2013 No reform as measured by Doing Business.
DB2014 No reform as measured by Doing Business.
Note: For information on reforms in earlier years (back to DB2005), see the Doing Business reports
for these years, available at http://www.doingbusiness.org.
Source: Doing Business database.
52 Zambia Doing Business 2014
GETTING CREDIT
What are the details?
The getting credit indicators reported here for Zambia
are based on detailed information collected in that
economy. The data on credit information sharing are
collected through a survey of a credit registry and/or
credit bureau (if one exists). To construct the depth of
credit information index, a score of 1 is assigned for
each of 6 features of the credit registry or credit
bureau (see summary of scoring below).
The data on the legal rights of borrowers and lenders
are gathered through a survey of financial lawyers and
verified through analysis of laws and regulations as
well as public sources of information on collateral and
bankruptcy laws. For the strength of legal rights index,
a score of 1 is assigned for each of 8 aspects related to
legal rights in collateral law and 2 aspects in
bankruptcy law.
Summary of scoring for the getting credit indicators in Zambia
Indicator Zambia Sub-Saharan Africa
average
OECD high income
average
Strength of legal rights index (0-10) 9 6 7
Depth of credit information index (0-6) 5 3 5
Public registry coverage (% of adults) 0.0 7.8 42.9
Private bureau coverage (% of adults) 12.0 25.2 73.9
Note: In cases where an economy’s regional classification is “OECD high income,” regional averages above are only
displayed once. Regional averages for the depth of credit information index exclude economies with no credit
registry or credit bureau. Regional averages for the credit registry coverage exclude economies with no credit
registry. Regional averages for the credit bureau coverage exclude economies with no credit bureau.
Strength of legal rights index (0–10) Index score: 9
Can any business use movable assets as collateral while keeping possession of the assets; and
any financial institution accept such assets as collateral ? Yes
Does the law allow businesses to grant a non possessory security right in a single category of
movable assets, without requiring a specific description of collateral? Yes
Does the law allow businesses to grant a non possessory security right in substantially all of
its assets, without requiring a specific description of collateral? Yes
May a security right extend to future or after-acquired assets, and may it extend automatically
to the products, proceeds or replacements of the original assets ? Yes
Is a general description of debts and obligations permitted in collateral agreements; can all
types of debts and obligations be secured between parties; and can the collateral agreement
include a maximum amount for which the assets are encumbered?
Yes
Is a collateral registry in operation, that is unified geographically and by asset type, with an
electronic database indexed by debtor's names? No
53 Zambia Doing Business 2014
Strength of legal rights index (0–10) Index score: 9
Are secured creditors paid first (i.e. before tax claims and employee claims) when a debtor
defaults outside an insolvency procedure? Yes
Are secured creditors paid first (i.e. before tax claims and employee claims) when a business is
liquidated? Yes
Are secured creditors either not subject to an automatic stay on enforcement when a debtor
enters a court-supervised reorganization procedure, or does the law provide secured
creditors with grounds for relief from an automatic stay or/and sets a time limit to it?
Yes
Does the law allow parties to agree in a collateral agreement that the lender may enforce its
security right out of court, at the time a security interest is created? Yes
Depth of credit information index (0–6) Credit bureau Credit registry Index score: 5
Are data on both firms and individuals distributed? Yes No 1
Are both positive and negative data distributed? Yes No 1
Does the registry distribute credit information from
retailers, trade creditors or utility companies as well as
financial institutions?
No No 0
Are more than 2 years of historical credit information
distributed? Yes No 1
Is data on all loans below 1% of income per capita
distributed? Yes No 1
Is it guaranteed by law that borrowers can inspect
their data in the largest credit registry? Yes No 1
Note: An economy receives a score of 1 if there is a "yes" to either private bureau or public registry.
Coverage Credit bureau
(% of adults)
Credit registry
(% of adults)
Number of firms 175,202 0
Number of individuals 676,749 0
Source: Doing Business database.
54 Zambia Doing Business 2014
PROTECTING INVESTORS
Protecting investors matters for the ability of
companies to raise the capital they need to grow,
innovate, diversify and compete. If the laws do not
protect minority shareholders, investors may be
reluctant to provide funding to companies through
the purchase of shares unless they become the
controlling shareholders. Effective regulations define
related-party transactions precisely, promote clear
and efficient disclosure requirements, require
shareholder participation in major decisions of the
company and set detailed standards of accountability
for company insiders.
What do the indicators cover?
Doing Business measures the strength of minority
shareholder protections against directors’ use of
corporate assets for personal gain—or self-dealing.
The indicators distinguish 3 dimensions of investor
protections: transparency of related-party
transactions (extent of disclosure index), liability for
self-dealing (extent of director liability index) and
minority shareholders’ access to evidence before and
during trial (ease of shareholder suits index). The
ranking on the strength of investor protection index is
the simple average of the percentile rankings on
these 3 indices. To make the data comparable across
economies, a case study uses several assumptions
about the business and the transaction.
The business (Buyer):
Is a publicly traded corporation listed on the
economy’s most important stock exchange (or
at least a large private company with multiple
shareholders).
Has a board of directors and a chief executive
officer (CEO) who may legally act on behalf of
Buyer where permitted, even if this is not
specifically required by law.
The transaction involves the following details:
Mr. James, a director and the majority
shareholder of the company, proposes that
WHAT THE PROTECTING INVESTORS
INDICATORS MEASURE
Extent of disclosure index (0–10)
Approval process for related-party
transactions
Disclosure requirements in case of related-
party transactions
Extent of director liability index (0–10)
Ability of minority shareholders to file a direct
or derivative lawsuit
Ability of minority shareholders to hold
interested parties and members of the
approving body liable for prejudicial related-
party transactions
Available legal remedies (damages, repayment
of profits, fines, imprisonment and rescission
of the transaction)
Ease of shareholder suits index (0–10)
Access to internal corporate documents
(directly or through a government inspector)
Documents and information available during
trial
Strength of investor protection index (0–10)
Simple average of the extent of disclosure,
extent of director liability and ease of
shareholder suits indices
the company purchase used trucks from another
company he owns.
The price is higher than the going price for used
trucks, but the transaction goes forward.
All required approvals are obtained, and all
required disclosures made, though the transaction
is prejudicial to Buyer.
Shareholders sue the interested parties and the
members of the board of directors.
55 Zambia Doing Business 2014
PROTECTING INVESTORS
Where does the economy stand today?
How strong are investor protections against self-
dealing in Zambia? The economy has a score of 5.3 on
the strength of investor protection index, with a higher
score indicating stronger protections (see the
summary of scoring at the end of this chapter for
details).
Globally, Zambia stands at 80 in the ranking of 189
economies on the strength of investor protection
index (figure 7.1). While the indicator does not
measure all aspects related to the protection of
minority investors, a higher ranking does indicate that
an economy’s regulations offer stronger investor
protections against self-dealing in the areas measured.
Figure 7.1 How Zambia and comparator economies rank on the strength of investor protection index
Source: Doing Business database.
56 Zambia Doing Business 2014
PROTECTING INVESTORS
What are the changes over time?
While the most recent Doing Business data reflect how
well regulations in Zambia protect minority investors
today, data over time show whether the protections
have been strengthened (table 7.1). And the global
ranking on the strength of investor protection index
over time shows whether the economy is slipping
behind other economies in investor protections—or
surpassing them.
Table 7.1 The strength of investor protections in Zambia over time
By Doing Business report year
Indicator DB2006 DB2007 DB2008 DB2009 DB2010 DB2011 DB2012 DB2013 DB2014
Rank .. .. .. .. .. .. .. 80 80
Extent of disclosure
index (0-10) 3 3 3 3 3 3 3 3 3
Extent of director
liability index (0-10) 6 6 6 6 6 6 6 6 6
Ease of shareholder
suits index (0-10) 7 7 7 7 7 7 7 7 7
Strength of investor
protection index (0-
10)
5.3 5.3 5.3 5.3 5.3 5.3 5.3 5.3 5.3
Note: n.a. = not applicable (the economy was not included in Doing Business for that year). DB2013 rankings shown are not last
year’s published rankings but comparable rankings for DB2013 that capture the effects of such factors as data corrections and
the addition of 4 economies (Libya, Myanmar, San Marino and South Sudan) to the sample this year.
Source: Doing Business database.
57 Zambia Doing Business 2014
PROTECTING INVESTORS
One way to put an economy’s scores on the protecting
investors indicators into context is to see where the
economy stands in the distribution of scores across
economies. Figure 7.2 highlights the score on the
extent of disclosure index for Zambia in 2013 and
shows the number of economies with this score in
2013 as well as the regional average score. Figure 7.3
applies to the extent of director liability index, and
figure 7.4 to the ease of shareholder suits index.
Figure 7.2 How strong are disclosure requirements?
Number of economies with each score on the extent of
disclosure index (0–10), 2013
Note: Higher scores indicate greater disclosure.
Source: Doing Business database.
Figure 7.3 How strong is the liability regime for directors?
Number of economies with each score on the extent of
director liability index (0–10), 2013
Note: Higher scores indicate greater liability of directors.
Source: Doing Business database.
58 Zambia Doing Business 2014
PROTECTING INVESTORS
Figure 7.4 How easy is accessing internal corporate documents?
Number of economies with each score on the ease of
shareholder suits index (0–10), 2013
Note: Higher scores indicate greater minority shareholder
access to evidence before and during trial.
Source: Doing Business database.
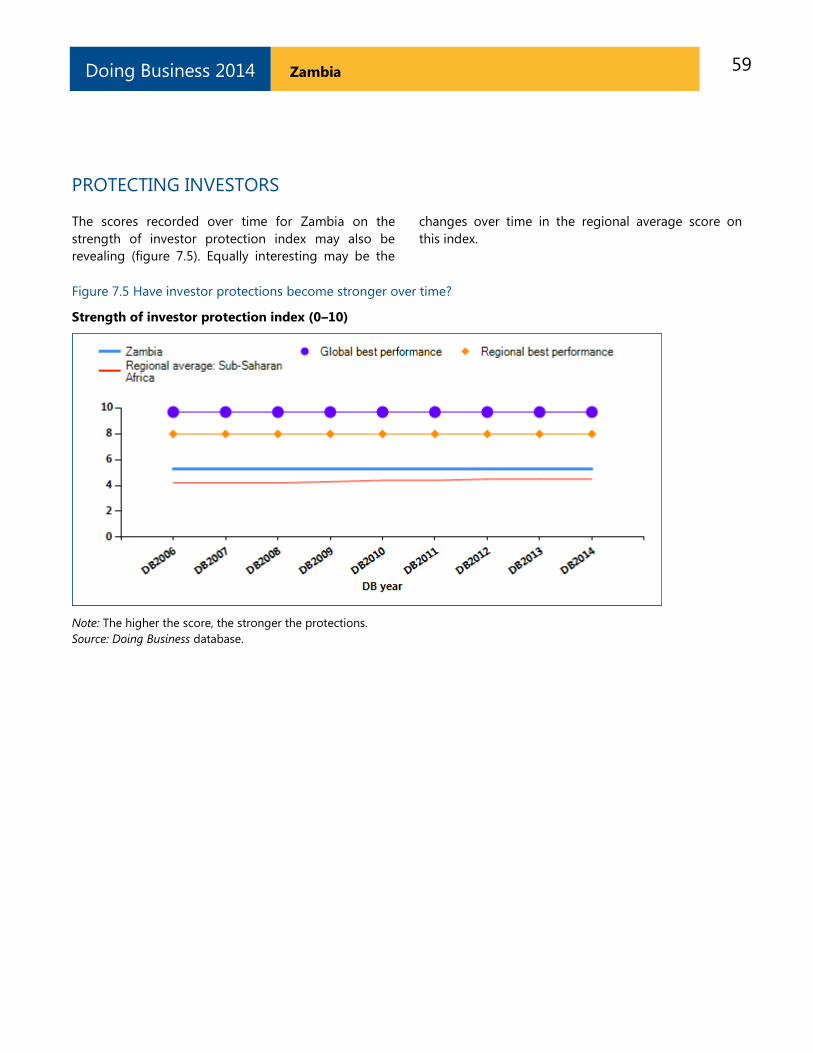
59 Zambia Doing Business 2014
PROTECTING INVESTORS
The scores recorded over time for Zambia on the
strength of investor protection index may also be
revealing (figure 7.5). Equally interesting may be the
changes over time in the regional average score on
this index.
Figure 7.5 Have investor protections become stronger over time?
Strength of investor protection index (0–10)
Note: The higher the score, the stronger the protections.
Source: Doing Business database.
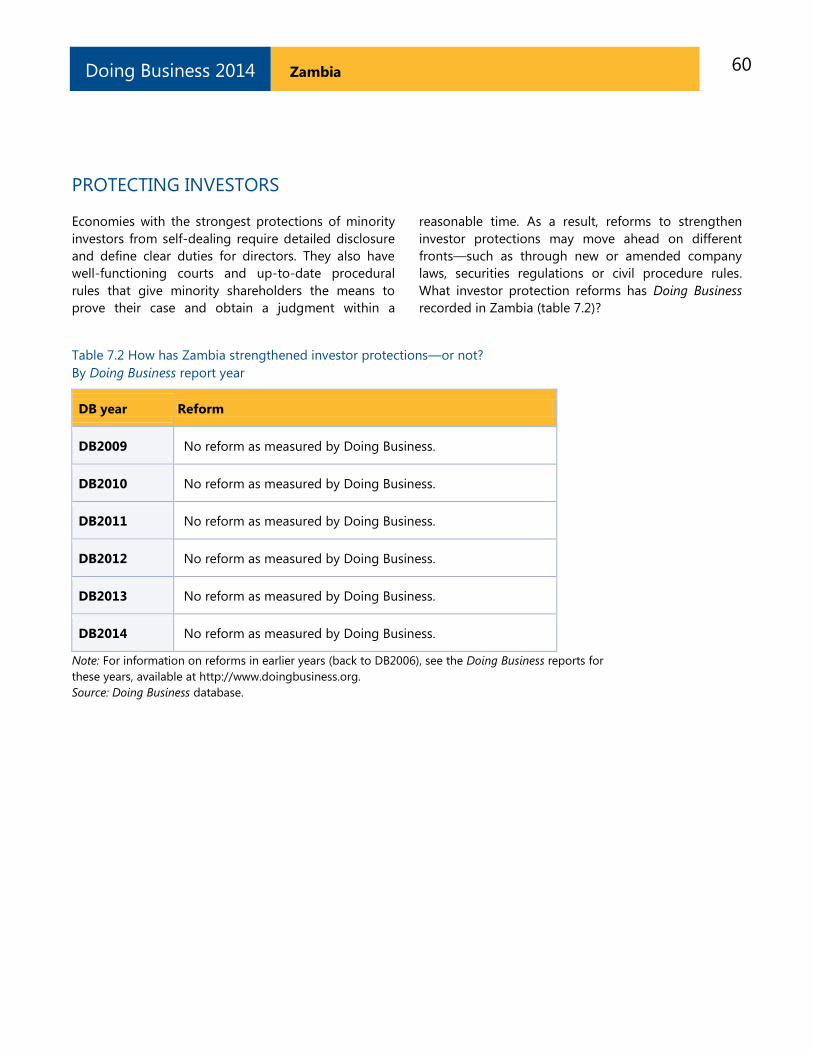
60 Zambia Doing Business 2014
PROTECTING INVESTORS
Economies with the strongest protections of minority
investors from self-dealing require detailed disclosure
and define clear duties for directors. They also have
well-functioning courts and up-to-date procedural
rules that give minority shareholders the means to
prove their case and obtain a judgment within a
reasonable time. As a result, reforms to strengthen
investor protections may move ahead on different
fronts—such as through new or amended company
laws, securities regulations or civil procedure rules.
What investor protection reforms has Doing Business
recorded in Zambia (table 7.2)?
Table 7.2 How has Zambia strengthened investor protections—or not?
By Doing Business report year
DB year Reform
DB2009 No reform as measured by Doing Business.
DB2010 No reform as measured by Doing Business.
DB2011 No reform as measured by Doing Business.
DB2012 No reform as measured by Doing Business.
DB2013 No reform as measured by Doing Business.
DB2014 No reform as measured by Doing Business.
Note: For information on reforms in earlier years (back to DB2006), see the Doing Business reports for
these years, available at http://www.doingbusiness.org.
Source: Doing Business database.
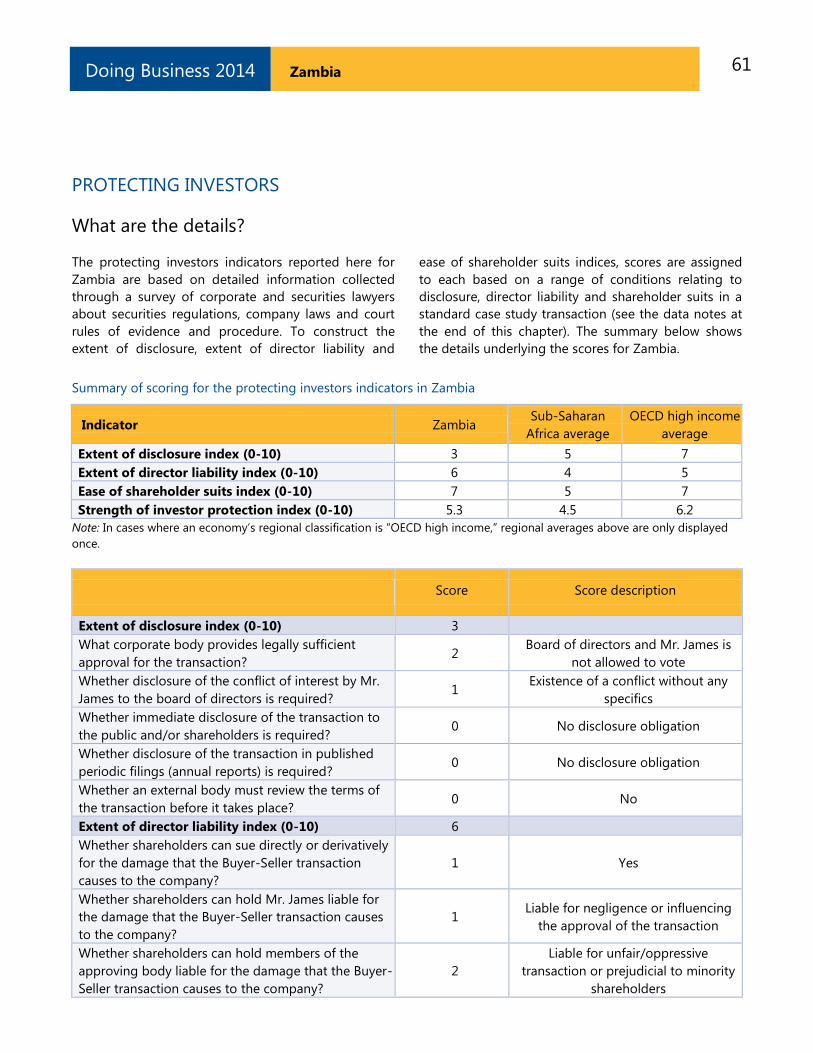
61 Zambia Doing Business 2014
PROTECTING INVESTORS
What are the details?
The protecting investors indicators reported here for
Zambia are based on detailed information collected
through a survey of corporate and securities lawyers
about securities regulations, company laws and court
rules of evidence and procedure. To construct the
extent of disclosure, extent of director liability and
ease of shareholder suits indices, scores are assigned
to each based on a range of conditions relating to
disclosure, director liability and shareholder suits in a
standard case study transaction (see the data notes at
the end of this chapter). The summary below shows
the details underlying the scores for Zambia.
Summary of scoring for the protecting investors indicators in Zambia
Indicator Zambia Sub-Saharan
Africa average
OECD high income
average
Extent of disclosure index (0-10) 3 5 7
Extent of director liability index (0-10) 6 4 5
Ease of shareholder suits index (0-10) 7 5 7
Strength of investor protection index (0-10) 5.3 4.5 6.2
Note: In cases where an economy’s regional classification is “OECD high income,” regional averages above are only displayed
once.
Score Score description
Extent of disclosure index (0-10) 3
What corporate body provides legally sufficient
approval for the transaction? 2
Board of directors and Mr. James is
not allowed to vote
Whether disclosure of the conflict of interest by Mr.
James to the board of directors is required? 1
Existence of a conflict without any
specifics
Whether immediate disclosure of the transaction to
the public and/or shareholders is required? 0 No disclosure obligation
Whether disclosure of the transaction in published
periodic filings (annual reports) is required? 0 No disclosure obligation
Whether an external body must review the terms of
the transaction before it takes place? 0 No
Extent of director liability index (0-10) 6
Whether shareholders can sue directly or derivatively
for the damage that the Buyer-Seller transaction
causes to the company?
1 Yes
Whether shareholders can hold Mr. James liable for
the damage that the Buyer-Seller transaction causes
to the company?
1 Liable for negligence or influencing
the approval of the transaction
Whether shareholders can hold members of the
approving body liable for the damage that the Buyer-
Seller transaction causes to the company?
2
Liable for unfair/oppressive
transaction or prejudicial to minority
shareholders
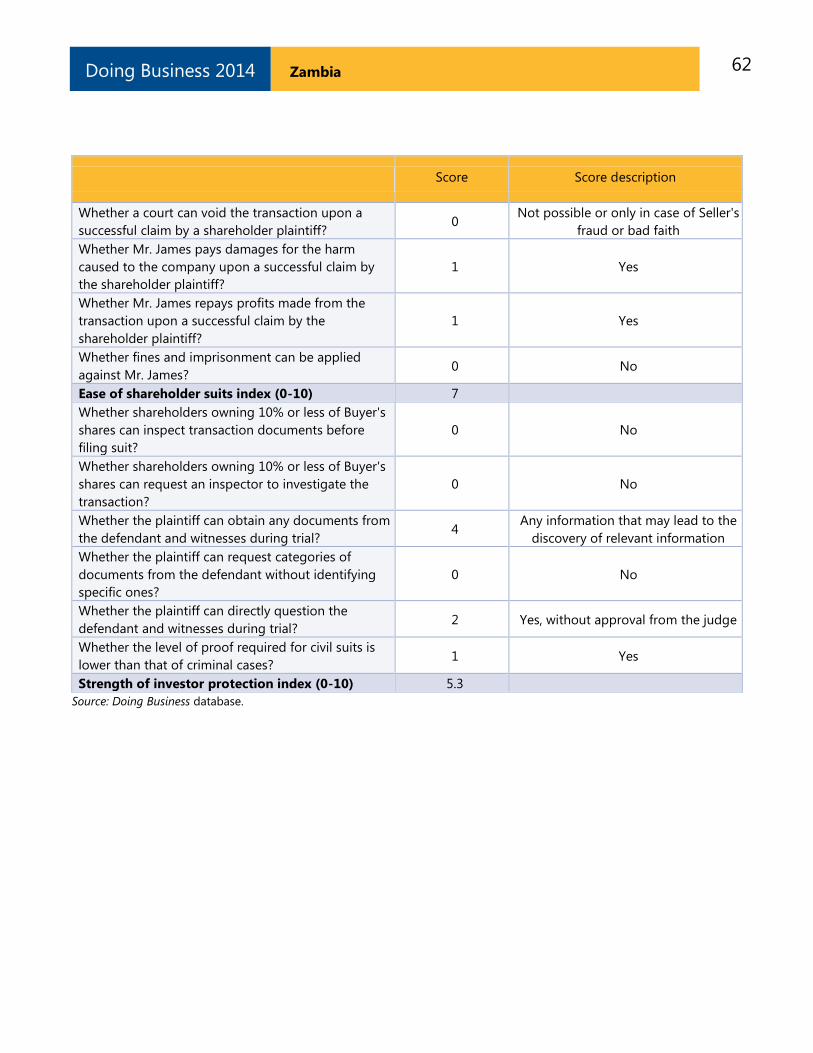
62 Zambia Doing Business 2014
Score Score description
Whether a court can void the transaction upon a
successful claim by a shareholder plaintiff? 0
Not possible or only in case of Seller's
fraud or bad faith
Whether Mr. James pays damages for the harm
caused to the company upon a successful claim by
the shareholder plaintiff?
1 Yes
Whether Mr. James repays profits made from the
transaction upon a successful claim by the
shareholder plaintiff?
1 Yes
Whether fines and imprisonment can be applied
against Mr. James? 0 No
Ease of shareholder suits index (0-10) 7
Whether shareholders owning 10% or less of Buyer's
shares can inspect transaction documents before
filing suit?
0 No
Whether shareholders owning 10% or less of Buyer's
shares can request an inspector to investigate the
transaction?
0 No
Whether the plaintiff can obtain any documents from
the defendant and witnesses during trial? 4
Any information that may lead to the
discovery of relevant information
Whether the plaintiff can request categories of
documents from the defendant without identifying
specific ones?
0 No
Whether the plaintiff can directly question the
defendant and witnesses during trial? 2 Yes, without approval from the judge
Whether the level of proof required for civil suits is
lower than that of criminal cases? 1 Yes
Strength of investor protection index (0-10) 5.3
Source: Doing Business database.
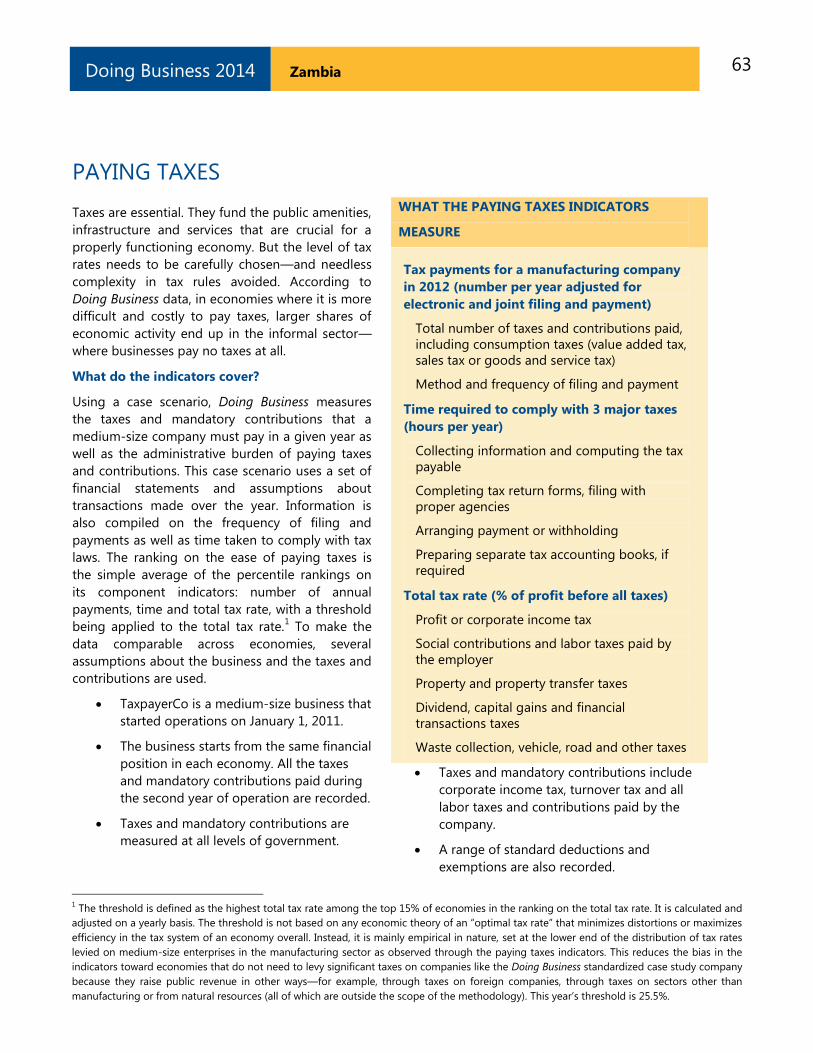
63 Zambia Doing Business 2014
PAYING TAXES
Taxes are essential. They fund the public amenities,
infrastructure and services that are crucial for a
properly functioning economy. But the level of tax
rates needs to be carefully chosen—and needless
complexity in tax rules avoided. According to
Doing Business data, in economies where it is more
difficult and costly to pay taxes, larger shares of
economic activity end up in the informal sector—
where businesses pay no taxes at all.
What do the indicators cover?
Using a case scenario, Doing Business measures
the taxes and mandatory contributions that a
medium-size company must pay in a given year as
well as the administrative burden of paying taxes
and contributions. This case scenario uses a set of
financial statements and assumptions about
transactions made over the year. Information is
also compiled on the frequency of filing and
payments as well as time taken to comply with tax
laws. The ranking on the ease of paying taxes is
the simple average of the percentile rankings on
its component indicators: number of annual
payments, time and total tax rate, with a threshold
being applied to the total tax rate.1 To make the
data comparable across economies, several
assumptions about the business and the taxes and
contributions are used.
TaxpayerCo is a medium-size business that
started operations on January 1, 2011.
The business starts from the same financial
position in each economy. All the taxes
and mandatory contributions paid during
the second year of operation are recorded.
Taxes and mandatory contributions are
measured at all levels of government.
Taxes and mandatory contributions include
corporate income tax, turnover tax and all
labor taxes and contributions paid by the
company.
A range of standard deductions and
exemptions are also recorded.
WHAT THE PAYING TAXES INDICATORS
MEASURE
Tax payments for a manufacturing company
in 2012 (number per year adjusted for
electronic and joint filing and payment)
Total number of taxes and contributions paid,
including consumption taxes (value added tax,
sales tax or goods and service tax)
Method and frequency of filing and payment
Time required to comply with 3 major taxes
(hours per year)
Collecting information and computing the tax
payable
Completing tax return forms, filing with
proper agencies
Arranging payment or withholding
Preparing separate tax accounting books, if
required
Total tax rate (% of profit before all taxes)
Profit or corporate income tax
Social contributions and labor taxes paid by
the employer
Property and property transfer taxes
Dividend, capital gains and financial
transactions taxes
Waste collection, vehicle, road and other taxes
1 The threshold is defined as the highest total tax rate among the top 15% of economies in the ranking on the total tax rate. It is calculated and
adjusted on a yearly basis. The threshold is not based on any economic theory of an “optimal tax rate” that minimizes distortions or maximizes
efficiency in the tax system of an economy overall. Instead, it is mainly empirical in nature, set at the lower end of the distribution of tax rates
levied on medium-size enterprises in the manufacturing sector as observed through the paying taxes indicators. This reduces the bias in the
indicators toward economies that do not need to levy significant taxes on companies like the Doing Business standardized case study company
because they raise public revenue in other ways—for example, through taxes on foreign companies, through taxes on sectors other than
manufacturing or from natural resources (all of which are outside the scope of the methodology). This year’s threshold is 25.5%.
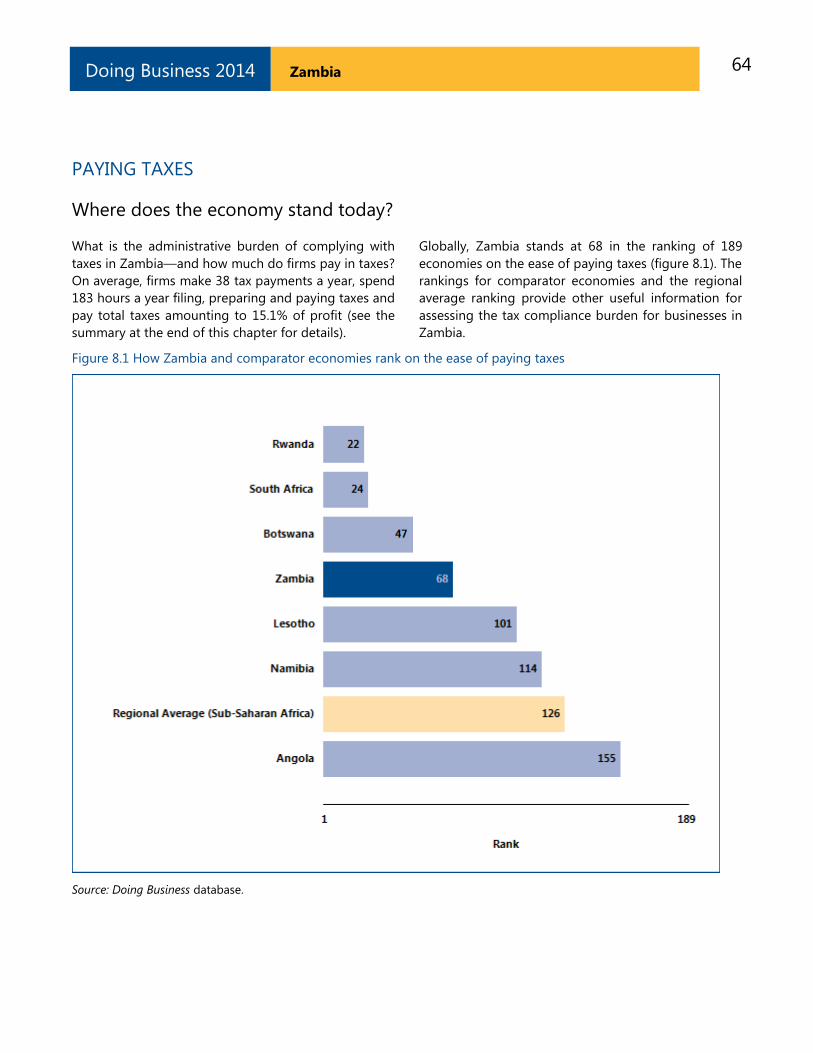
64 Zambia Doing Business 2014
PAYING TAXES
Where does the economy stand today?
What is the administrative burden of complying with
taxes in Zambia—and how much do firms pay in taxes?
On average, firms make 38 tax payments a year, spend
183 hours a year filing, preparing and paying taxes and
pay total taxes amounting to 15.1% of profit (see the
summary at the end of this chapter for details).
Globally, Zambia stands at 68 in the ranking of 189
economies on the ease of paying taxes (figure 8.1). The
rankings for comparator economies and the regional
average ranking provide other useful information for
assessing the tax compliance burden for businesses in
Zambia.
Figure 8.1 How Zambia and comparator economies rank on the ease of paying taxes
Source: Doing Business database.
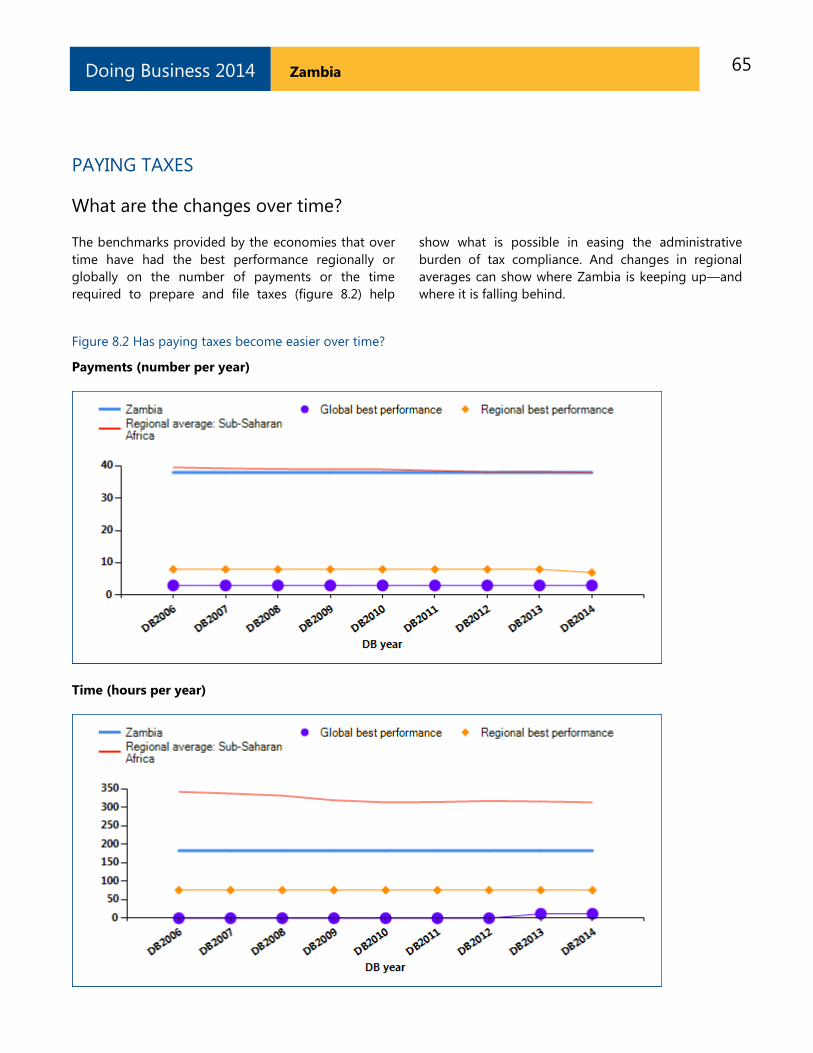
65 Zambia Doing Business 2014
PAYING TAXES
What are the changes over time?
The benchmarks provided by the economies that over
time have had the best performance regionally or
globally on the number of payments or the time
required to prepare and file taxes (figure 8.2) help
show what is possible in easing the administrative
burden of tax compliance. And changes in regional
averages can show where Zambia is keeping up—and
where it is falling behind.
Figure 8.2 Has paying taxes become easier over time?
Payments (number per year)
Time (hours per year)
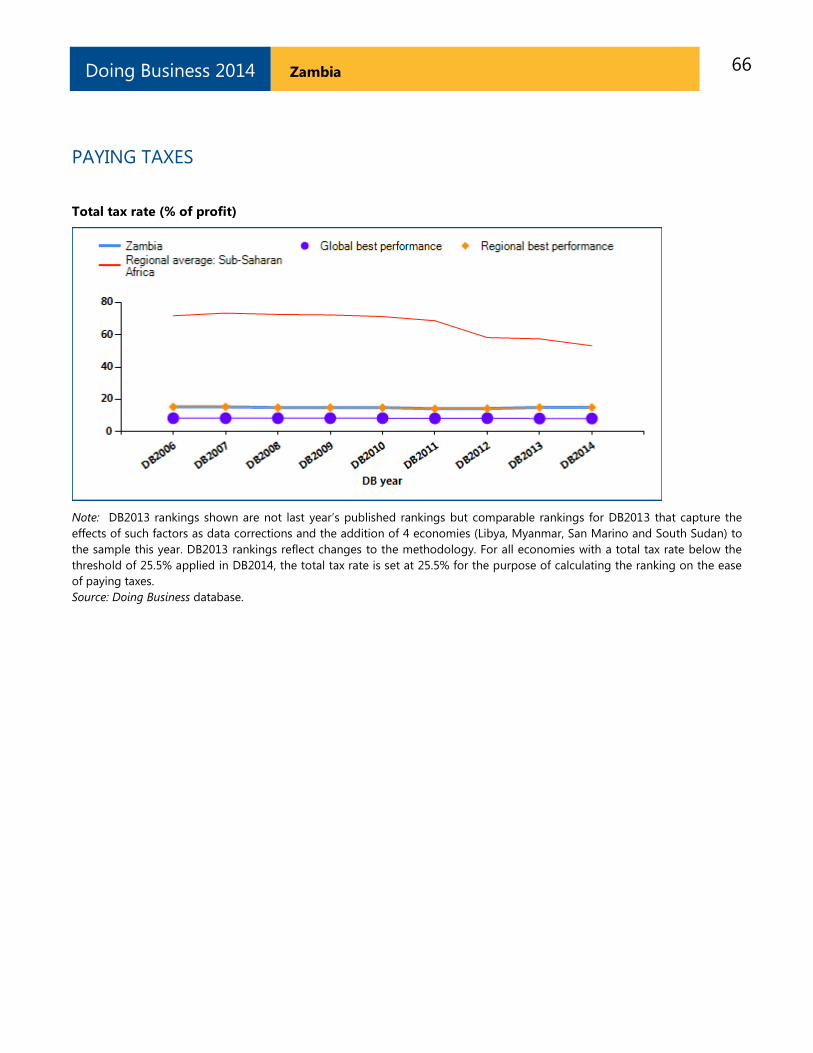
66 Zambia Doing Business 2014
PAYING TAXES
Total tax rate (% of profit)
Note: DB2013 rankings shown are not last year’s published rankings but comparable rankings for DB2013 that capture the
effects of such factors as data corrections and the addition of 4 economies (Libya, Myanmar, San Marino and South Sudan) to
the sample this year. DB2013 rankings reflect changes to the methodology. For all economies with a total tax rate below the
threshold of 25.5% applied in DB2014, the total tax rate is set at 25.5% for the purpose of calculating the ranking on the ease
of paying taxes.
Source: Doing Business database.
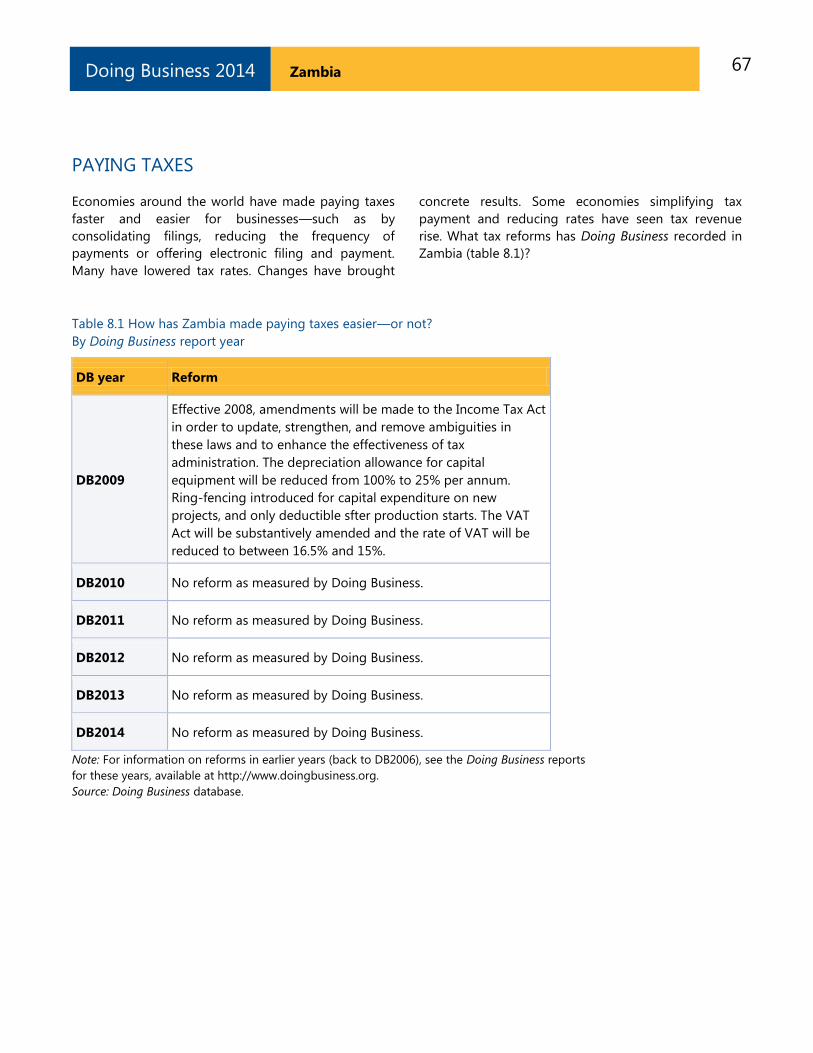
67 Zambia Doing Business 2014
PAYING TAXES
Economies around the world have made paying taxes
faster and easier for businesses—such as by
consolidating filings, reducing the frequency of
payments or offering electronic filing and payment.
Many have lowered tax rates. Changes have brought
concrete results. Some economies simplifying tax
payment and reducing rates have seen tax revenue
rise. What tax reforms has Doing Business recorded in
Zambia (table 8.1)?
Table 8.1 How has Zambia made paying taxes easier—or not?
By Doing Business report year
DB year Reform
DB2009
Effective 2008, amendments will be made to the Income Tax Act
in order to update, strengthen, and remove ambiguities in
these laws and to enhance the effectiveness of tax
administration. The depreciation allowance for capital
equipment will be reduced from 100% to 25% per annum.
Ring-fencing introduced for capital expenditure on new
projects, and only deductible sfter production starts. The VAT
Act will be substantively amended and the rate of VAT will be
reduced to between 16.5% and 15%.
DB2010 No reform as measured by Doing Business.
DB2011 No reform as measured by Doing Business.
DB2012 No reform as measured by Doing Business.
DB2013 No reform as measured by Doing Business.
DB2014 No reform as measured by Doing Business.
Note: For information on reforms in earlier years (back to DB2006), see the Doing Business reports
for these years, available at http://www.doingbusiness.org.
Source: Doing Business database.
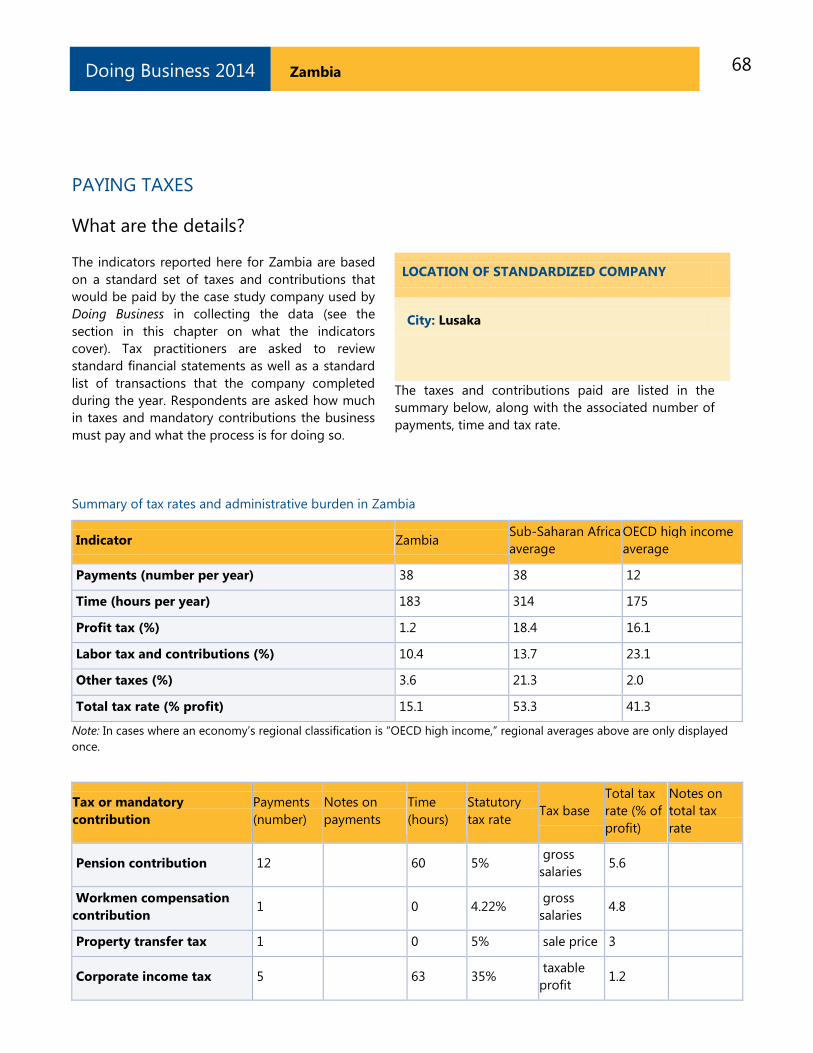
68 Zambia Doing Business 2014
PAYING TAXES
What are the details?
The indicators reported here for Zambia are based
on a standard set of taxes and contributions that
would be paid by the case study company used by
Doing Business in collecting the data (see the
section in this chapter on what the indicators
cover). Tax practitioners are asked to review
standard financial statements as well as a standard
list of transactions that the company completed
during the year. Respondents are asked how much
in taxes and mandatory contributions the business
must pay and what the process is for doing so.
LOCATION OF STANDARDIZED COMPANY
City: Lusaka
The taxes and contributions paid are listed in the
summary below, along with the associated number of
payments, time and tax rate.
Summary of tax rates and administrative burden in Zambia
Indicator Zambia Sub-Saharan Africa
average
OECD high income
average
Payments (number per year) 38 38 12
Time (hours per year) 183 314 175
Profit tax (%) 1.2 18.4 16.1
Labor tax and contributions (%) 10.4 13.7 23.1
Other taxes (%) 3.6 21.3 2.0
Total tax rate (% profit) 15.1 53.3 41.3
Note: In cases where an economy’s regional classification is “OECD high income,” regional averages above are only displayed
once.
Tax or mandatory
contribution
Payments
(number)
Notes on
payments
Time
(hours)
Statutory
tax rate Tax base
Total tax
rate (% of
profit)
Notes on
total tax
rate
Pension contribution 12 60 5% gross
salaries 5.6
Workmen compensation
contribution 1 0 4.22%
gross
salaries 4.8
Property transfer tax 1 0 5% sale price 3
Corporate income tax 5 63 35% taxable
profit 1.2
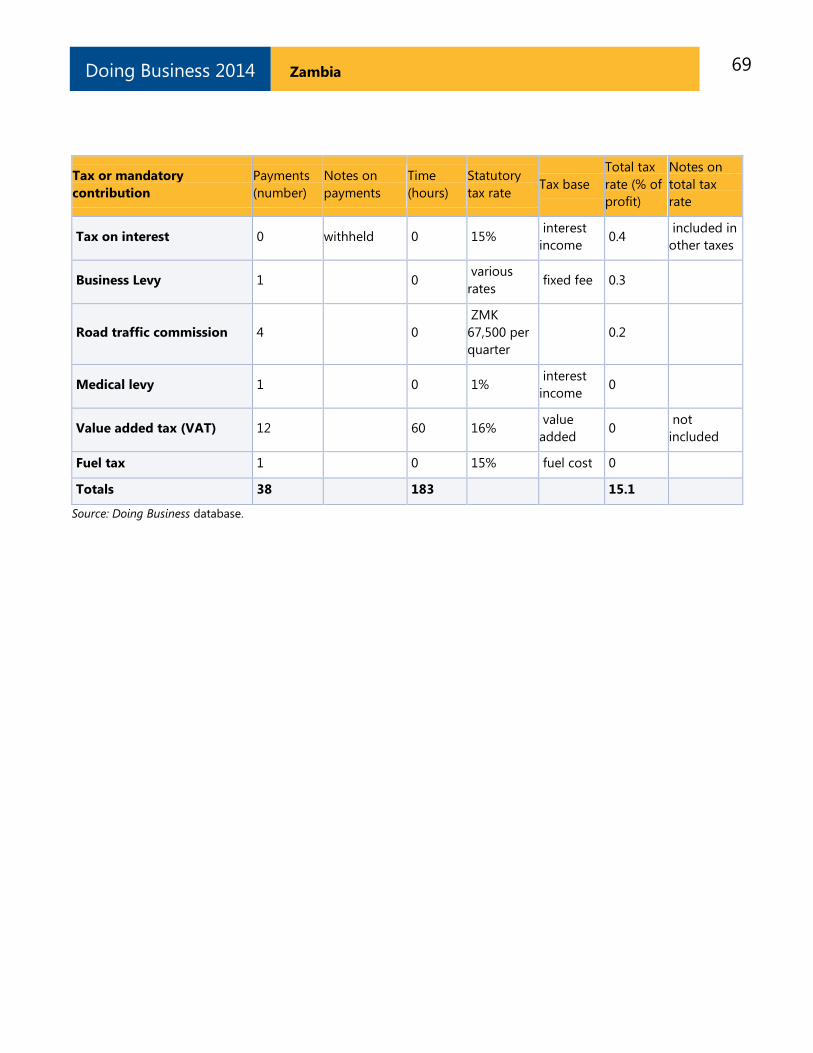
69 Zambia Doing Business 2014
Tax or mandatory
contribution
Payments
(number)
Notes on
payments
Time
(hours)
Statutory
tax rate Tax base
Total tax
rate (% of
profit)
Notes on
total tax
rate
Tax on interest 0 withheld 0 15% interest
income 0.4
included in
other taxes
Business Levy 1 0 various
rates fixed fee 0.3
Road traffic commission 4 0
ZMK
67,500 per
quarter
0.2
Medical levy 1 0 1% interest
income 0
Value added tax (VAT) 12 60 16% value
added 0
not
included
Fuel tax 1 0 15% fuel cost 0
Totals 38 183 15.1
Source: Doing Business database.
70 Zambia Doing Business 2014
TRADING ACROSS BORDERS
In today’s globalized world, making trade between
economies easier is increasingly important for
business. Excessive document requirements,
burdensome customs procedures, inefficient port
operations and inadequate infrastructure all lead to
extra costs and delays for exporters and importers,
stifling trade potential. Research shows that
exporters in developing countries gain more from
a 10% drop in their trading costs than from a
similar reduction in the tariffs applied to their
products in global markets.
What do the indicators cover?
Doing Business measures the time and cost
(excluding tariffs and the time and cost for sea
transport) associated with exporting and importing
a standard shipment of goods by sea transport,
and the number of documents necessary to
complete the transaction. The indicators cover
procedural requirements such as documentation
requirements and procedures at customs and other
regulatory agencies as well as at the port. They also
cover trade logistics, including the time and cost of
inland transport to the largest business city. The
ranking on the ease of trading across borders is
the simple average of the percentile rankings on its
component indicators: documents, time and cost
to export and import.
To make the data comparable across economies,
Doing Business uses several assumptions about the
business and the traded goods.
The business:
Is of medium size and employs 60 people.
Is located in the periurban area of the
economy’s largest business city.
Is a private, limited liability company,
domestically owned, formally registered
and operating under commercial laws and
regulations of the economy.
The traded goods:
Are not hazardous nor do they include
WHAT THE TRADING ACROSS BORDERS
INDICATORS MEASURE
Documents required to export and import
(number)
Bank documents
Customs clearance documents
Port and terminal handling documents
Transport documents
Time required to export and import (days)
Obtaining, filling out and submitting all the
documents
Inland transport and handling
Customs clearance and inspections
Port and terminal handling
Does not include sea transport time
Cost required to export and import (US$ per
container)
All documentation
Inland transport and handling
Customs clearance and inspections
Port and terminal handling
Official costs only, no bribes
military items.
Do not require refrigeration or any other
special environment.
Do not require any special phytosanitary or
environmental safety standards other than
accepted international standards.
Are one of the economy’s leading export or
import products.
Are transported in a dry-cargo, 20-foot full
container load.
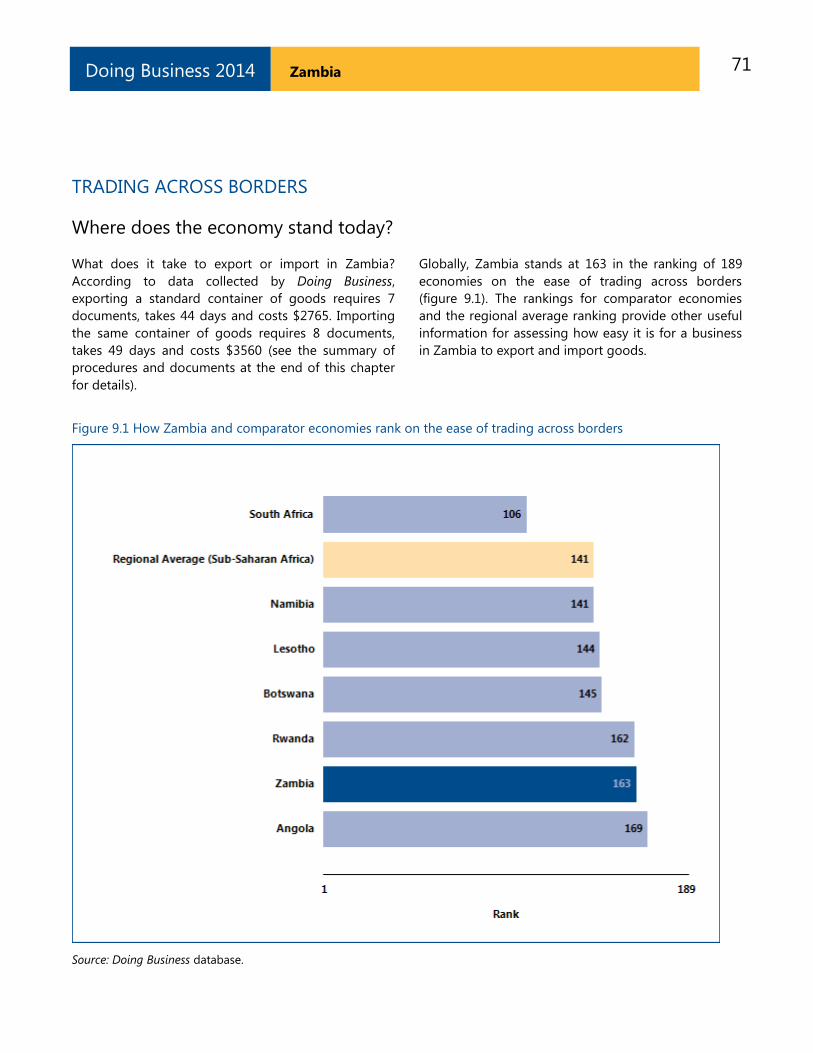
71 Zambia Doing Business 2014
TRADING ACROSS BORDERS
Where does the economy stand today?
What does it take to export or import in Zambia?
According to data collected by Doing Business,
exporting a standard container of goods requires 7
documents, takes 44 days and costs $2765. Importing
the same container of goods requires 8 documents,
takes 49 days and costs $3560 (see the summary of
procedures and documents at the end of this chapter
for details).
Globally, Zambia stands at 163 in the ranking of 189
economies on the ease of trading across borders
(figure 9.1). The rankings for comparator economies
and the regional average ranking provide other useful
information for assessing how easy it is for a business
in Zambia to export and import goods.
Figure 9.1 How Zambia and comparator economies rank on the ease of trading across borders
Source: Doing Business database.
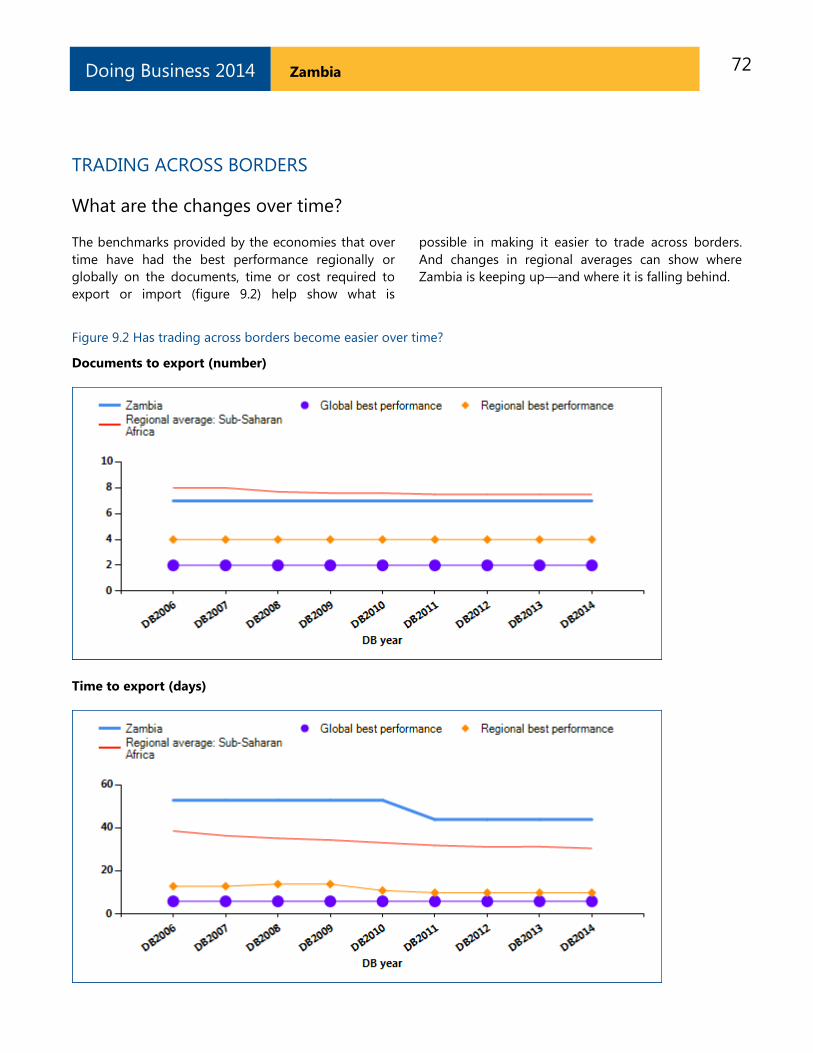
72 Zambia Doing Business 2014
TRADING ACROSS BORDERS
What are the changes over time?
The benchmarks provided by the economies that over
time have had the best performance regionally or
globally on the documents, time or cost required to
export or import (figure 9.2) help show what is
possible in making it easier to trade across borders.
And changes in regional averages can show where
Zambia is keeping up—and where it is falling behind.
Figure 9.2 Has trading across borders become easier over time?
Documents to export (number)
Time to export (days)
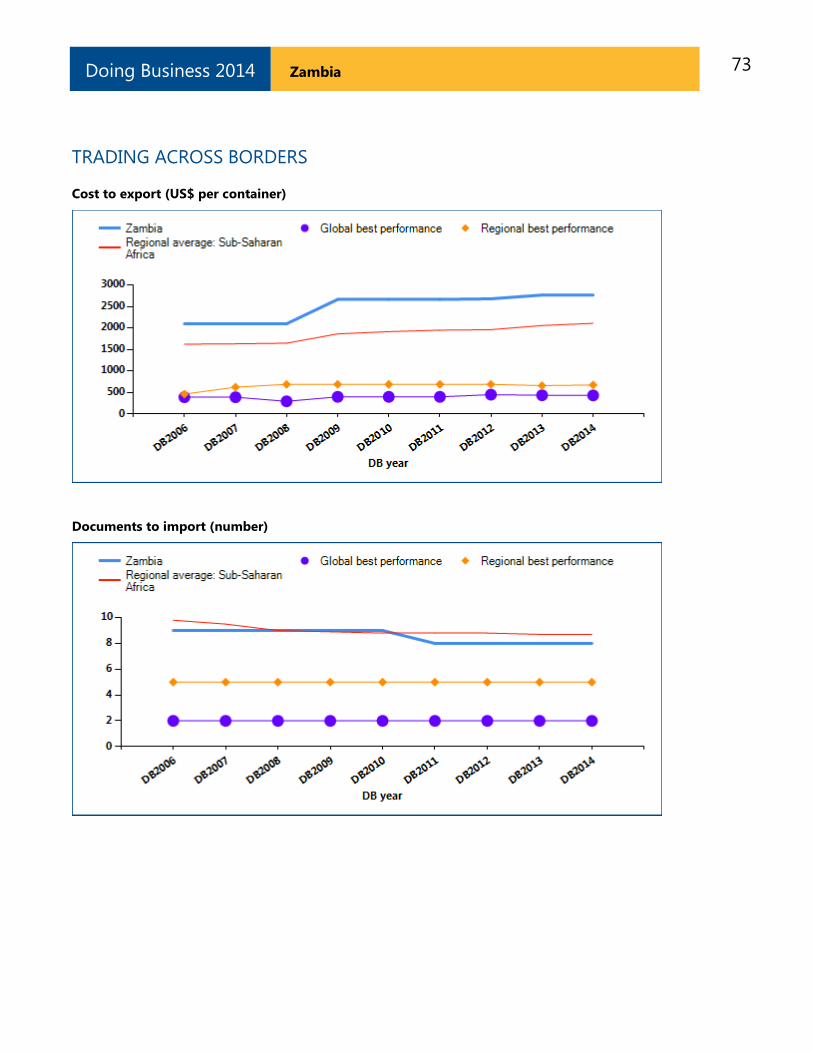
73 Zambia Doing Business 2014
TRADING ACROSS BORDERS
Cost to export (US$ per container)
Documents to import (number)
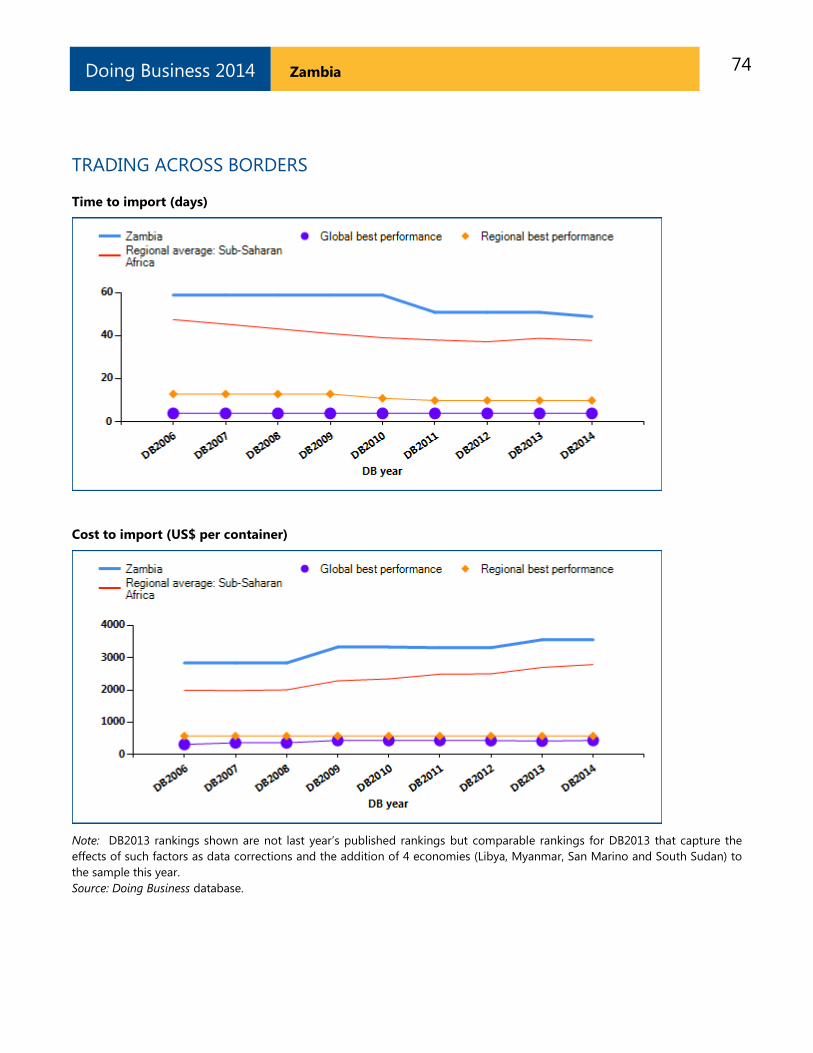
74 Zambia Doing Business 2014
TRADING ACROSS BORDERS
Time to import (days)
Cost to import (US$ per container)
Note: DB2013 rankings shown are not last year’s published rankings but comparable rankings for DB2013 that capture the
effects of such factors as data corrections and the addition of 4 economies (Libya, Myanmar, San Marino and South Sudan) to
the sample this year.
Source: Doing Business database.
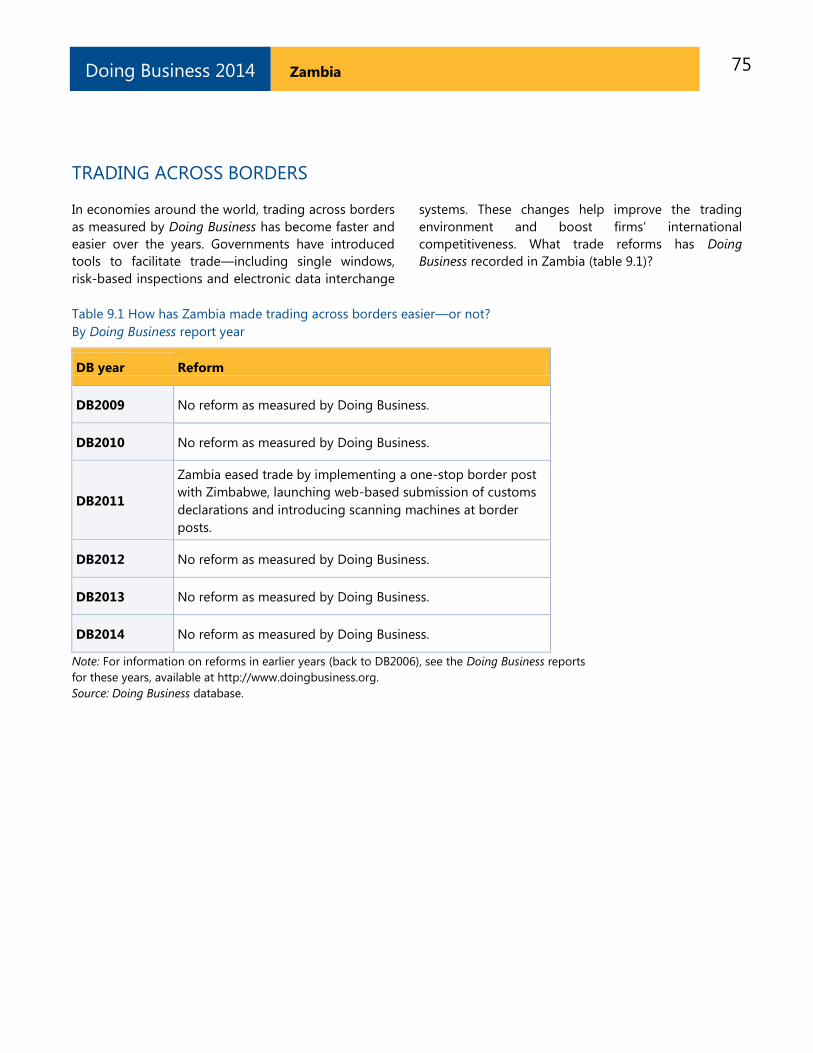
75 Zambia Doing Business 2014
TRADING ACROSS BORDERS
In economies around the world, trading across borders
as measured by Doing Business has become faster and
easier over the years. Governments have introduced
tools to facilitate trade—including single windows,
risk-based inspections and electronic data interchange
systems. These changes help improve the trading
environment and boost firms’ international
competitiveness. What trade reforms has Doing
Business recorded in Zambia (table 9.1)?
Table 9.1 How has Zambia made trading across borders easier—or not?
By Doing Business report year
DB year Reform
DB2009 No reform as measured by Doing Business.
DB2010 No reform as measured by Doing Business.
DB2011
Zambia eased trade by implementing a one-stop border post
with Zimbabwe, launching web-based submission of customs
declarations and introducing scanning machines at border
posts.
DB2012 No reform as measured by Doing Business.
DB2013 No reform as measured by Doing Business.
DB2014 No reform as measured by Doing Business.
Note: For information on reforms in earlier years (back to DB2006), see the Doing Business reports
for these years, available at http://www.doingbusiness.org.
Source: Doing Business database.
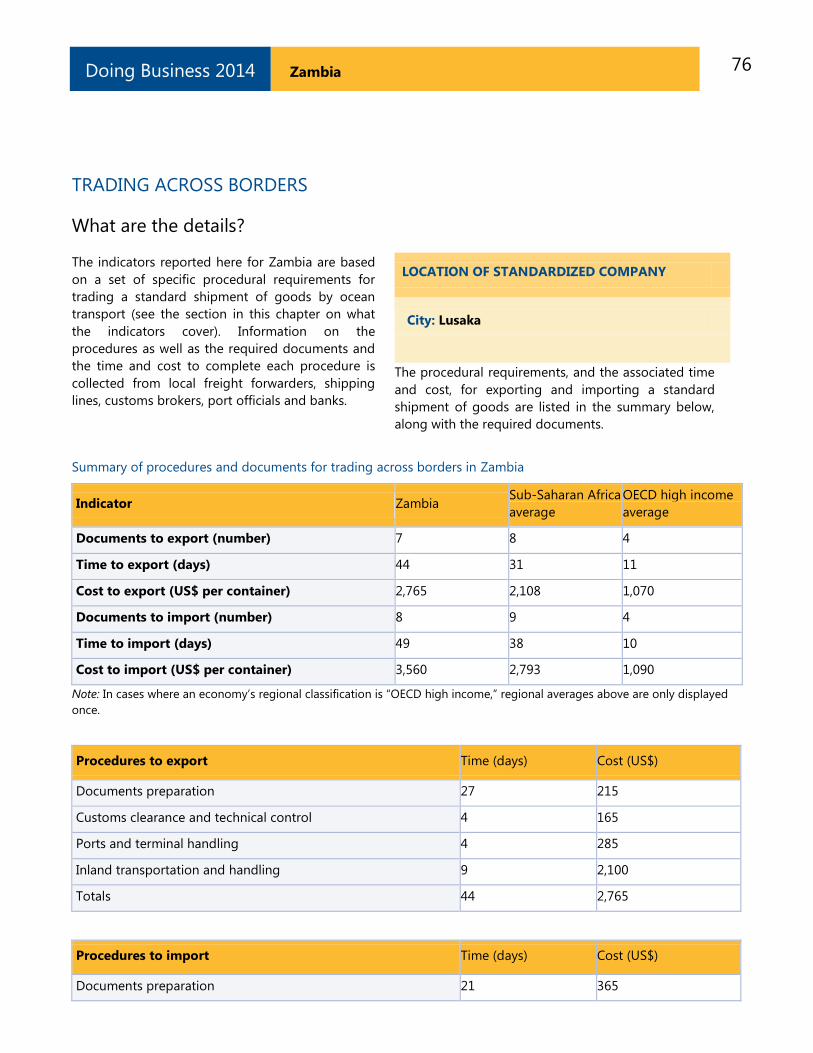
76 Zambia Doing Business 2014
TRADING ACROSS BORDERS
What are the details?
The indicators reported here for Zambia are based
on a set of specific procedural requirements for
trading a standard shipment of goods by ocean
transport (see the section in this chapter on what
the indicators cover). Information on the
procedures as well as the required documents and
the time and cost to complete each procedure is
collected from local freight forwarders, shipping
lines, customs brokers, port officials and banks.
LOCATION OF STANDARDIZED COMPANY
City: Lusaka
The procedural requirements, and the associated time
and cost, for exporting and importing a standard
shipment of goods are listed in the summary below,
along with the required documents.
Summary of procedures and documents for trading across borders in Zambia
Indicator Zambia Sub-Saharan Africa
average
OECD high income
average
Documents to export (number) 7 8 4
Time to export (days) 44 31 11
Cost to export (US$ per container) 2,765 2,108 1,070
Documents to import (number) 8 9 4
Time to import (days) 49 38 10
Cost to import (US$ per container) 3,560 2,793 1,090
Note: In cases where an economy’s regional classification is “OECD high income,” regional averages above are only displayed
once.
Procedures to export Time (days) Cost (US$)
Documents preparation 27 215
Customs clearance and technical control 4 165
Ports and terminal handling 4 285
Inland transportation and handling 9 2,100
Totals 44 2,765
Procedures to import Time (days) Cost (US$)
Documents preparation 21 365
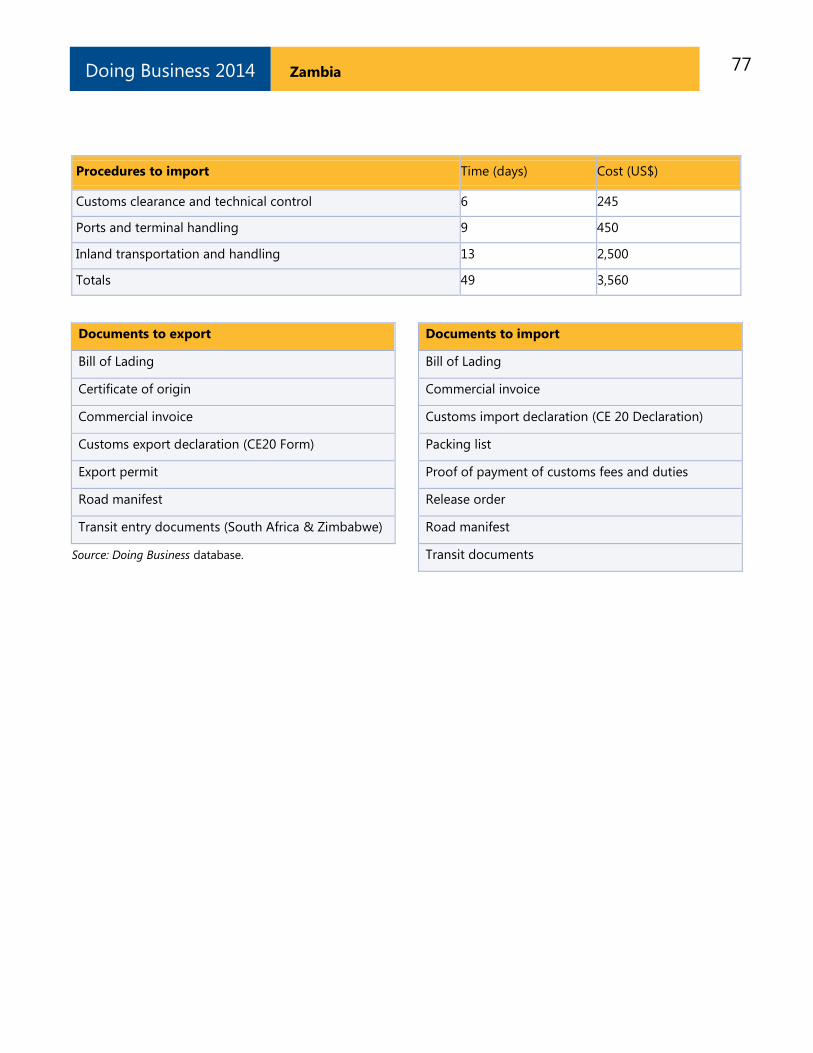
77 Zambia Doing Business 2014
Procedures to import Time (days) Cost (US$)
Customs clearance and technical control 6 245
Ports and terminal handling 9 450
Inland transportation and handling 13 2,500
Totals 49 3,560
Documents to export
Bill of Lading
Certificate of origin
Commercial invoice
Customs export declaration (CE20 Form)
Export permit
Road manifest
Transit entry documents (South Africa & Zimbabwe)
Source: Doing Business database.
Documents to import
Bill of Lading Commercial invoice Customs import declaration (CE 20 Declaration) Packing list Proof of payment of customs fees and duties Release order Road manifest Transit documents
78 Zambia Doing Business 2014
ENFORCING CONTRACTS
Effective commercial dispute resolution has many
benefits. Courts are essential for entrepreneurs
because they interpret the rules of the market and
protect economic rights. Efficient and transparent
courts encourage new business relationships
because businesses know they can rely on the
courts if a new customer fails to pay. Speedy trials
are essential for small enterprises, which may lack
the resources to stay in business while awaiting the
outcome of a long court dispute.
What do the indicators cover?
Doing Business measures the efficiency of the
judicial system in resolving a commercial dispute
before local courts. Following the step-by-step
evolution of a standardized case study, it collects
data relating to the time, cost and procedural
complexity of resolving a commercial lawsuit. The
ranking on the ease of enforcing contracts is the
simple average of the percentile rankings on its
component indicators: procedures, time and cost.
The dispute in the case study involves the breach
of a sales contract between 2 domestic businesses.
The case study assumes that the court hears an
expert on the quality of the goods in dispute. This
distinguishes the case from simple debt
enforcement. To make the data comparable across
economies, Doing Business uses several
assumptions about the case:
The seller and buyer are located in the
economy’s largest business city.
The buyer orders custom-made goods,
then fails to pay.
The seller sues the buyer before a
competent court.
The value of the claim is 200% of income
per capita.
The seller requests a pretrial attachment to
secure the claim.
WHAT THE ENFORCING CONTRACTS
INDICATORS MEASURE
Procedures to enforce a contract through
the courts (number)
Steps to file and serve the case
Steps for trial and judgment
Steps to enforce the judgment
Time required to complete procedures
(calendar days)
Time to file and serve the case
Time for trial and obtaining judgment
Time to enforce the judgment
Cost required to complete procedures (% of
claim)
Average attorney fees
Court costs
Enforcement costs
The dispute on the quality of the goods
requires an expert opinion.
The judge decides in favor of the seller; there
is no appeal.
The seller enforces the judgment through a
public sale of the buyer’s movable assets.
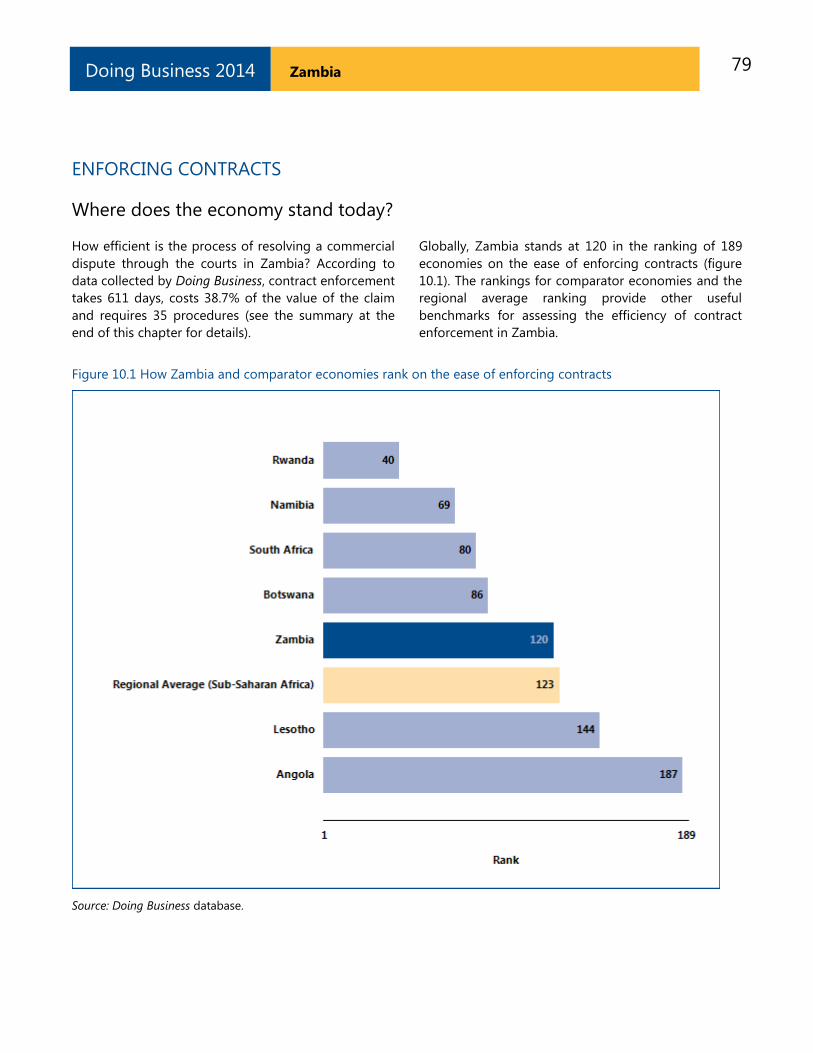
79 Zambia Doing Business 2014
ENFORCING CONTRACTS
Where does the economy stand today?
How efficient is the process of resolving a commercial
dispute through the courts in Zambia? According to
data collected by Doing Business, contract enforcement
takes 611 days, costs 38.7% of the value of the claim
and requires 35 procedures (see the summary at the
end of this chapter for details).
Globally, Zambia stands at 120 in the ranking of 189
economies on the ease of enforcing contracts (figure
10.1). The rankings for comparator economies and the
regional average ranking provide other useful
benchmarks for assessing the efficiency of contract
enforcement in Zambia.
Figure 10.1 How Zambia and comparator economies rank on the ease of enforcing contracts
Source: Doing Business database.
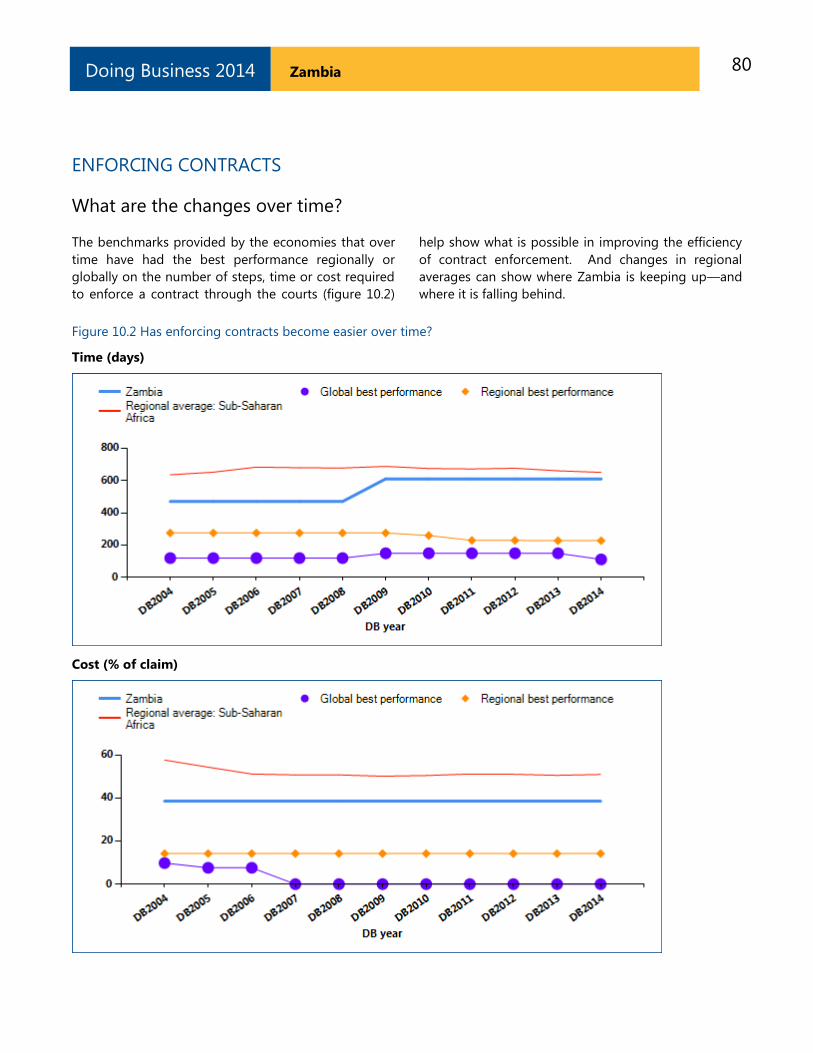
80 Zambia Doing Business 2014
ENFORCING CONTRACTS
What are the changes over time?
The benchmarks provided by the economies that over
time have had the best performance regionally or
globally on the number of steps, time or cost required
to enforce a contract through the courts (figure 10.2)
help show what is possible in improving the efficiency
of contract enforcement. And changes in regional
averages can show where Zambia is keeping up—and
where it is falling behind.
Figure 10.2 Has enforcing contracts become easier over time?
Time (days)
Cost (% of claim)
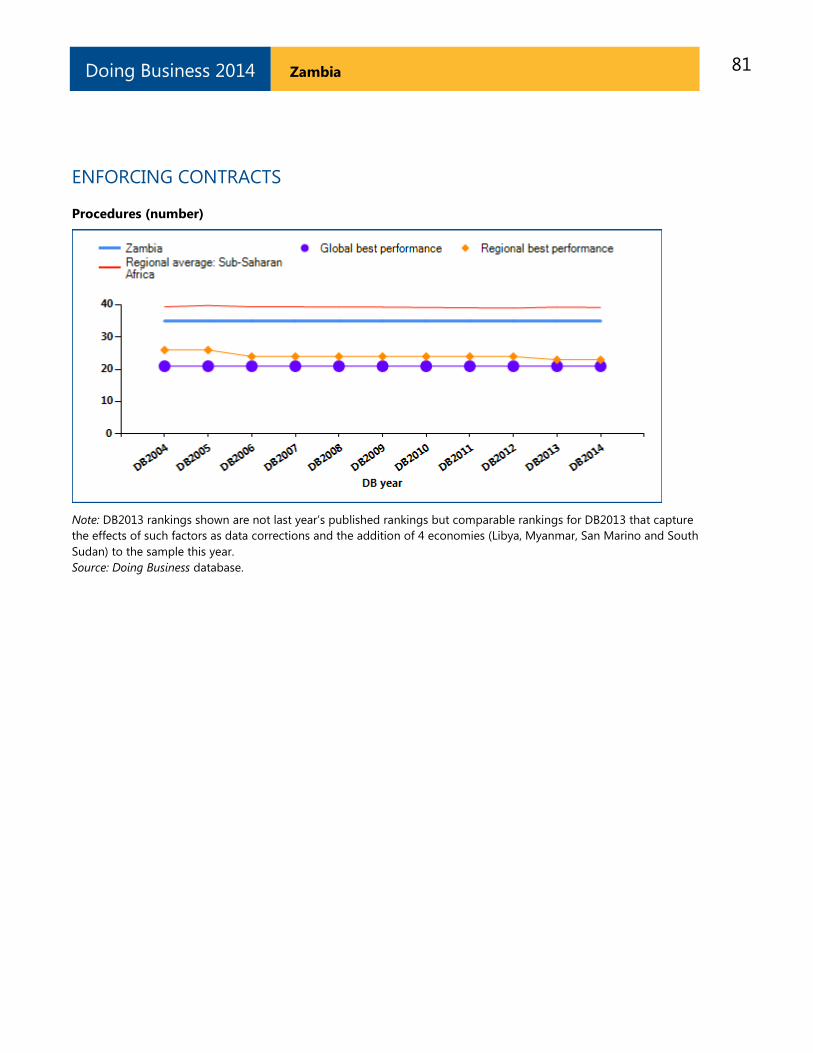
81 Zambia Doing Business 2014
ENFORCING CONTRACTS
Procedures (number)
Note: DB2013 rankings shown are not last year’s published rankings but comparable rankings for DB2013 that capture
the effects of such factors as data corrections and the addition of 4 economies (Libya, Myanmar, San Marino and South
Sudan) to the sample this year.
Source: Doing Business database.
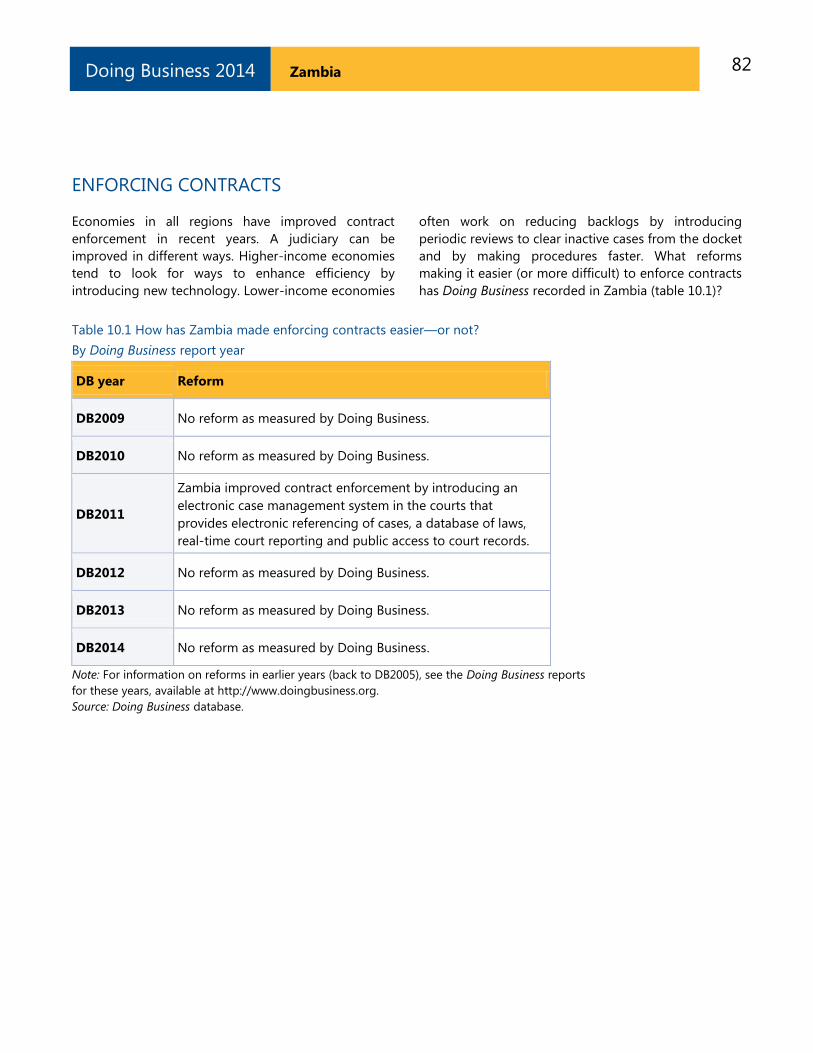
82 Zambia Doing Business 2014
ENFORCING CONTRACTS
Economies in all regions have improved contract
enforcement in recent years. A judiciary can be
improved in different ways. Higher-income economies
tend to look for ways to enhance efficiency by
introducing new technology. Lower-income economies
often work on reducing backlogs by introducing
periodic reviews to clear inactive cases from the docket
and by making procedures faster. What reforms
making it easier (or more difficult) to enforce contracts
has Doing Business recorded in Zambia (table 10.1)?
Table 10.1 How has Zambia made enforcing contracts easier—or not?
By Doing Business report year
DB year Reform
DB2009 No reform as measured by Doing Business.
DB2010 No reform as measured by Doing Business.
DB2011
Zambia improved contract enforcement by introducing an
electronic case management system in the courts that
provides electronic referencing of cases, a database of laws,
real-time court reporting and public access to court records.
DB2012 No reform as measured by Doing Business.
DB2013 No reform as measured by Doing Business.
DB2014 No reform as measured by Doing Business.
Note: For information on reforms in earlier years (back to DB2005), see the Doing Business reports
for these years, available at http://www.doingbusiness.org.
Source: Doing Business database.
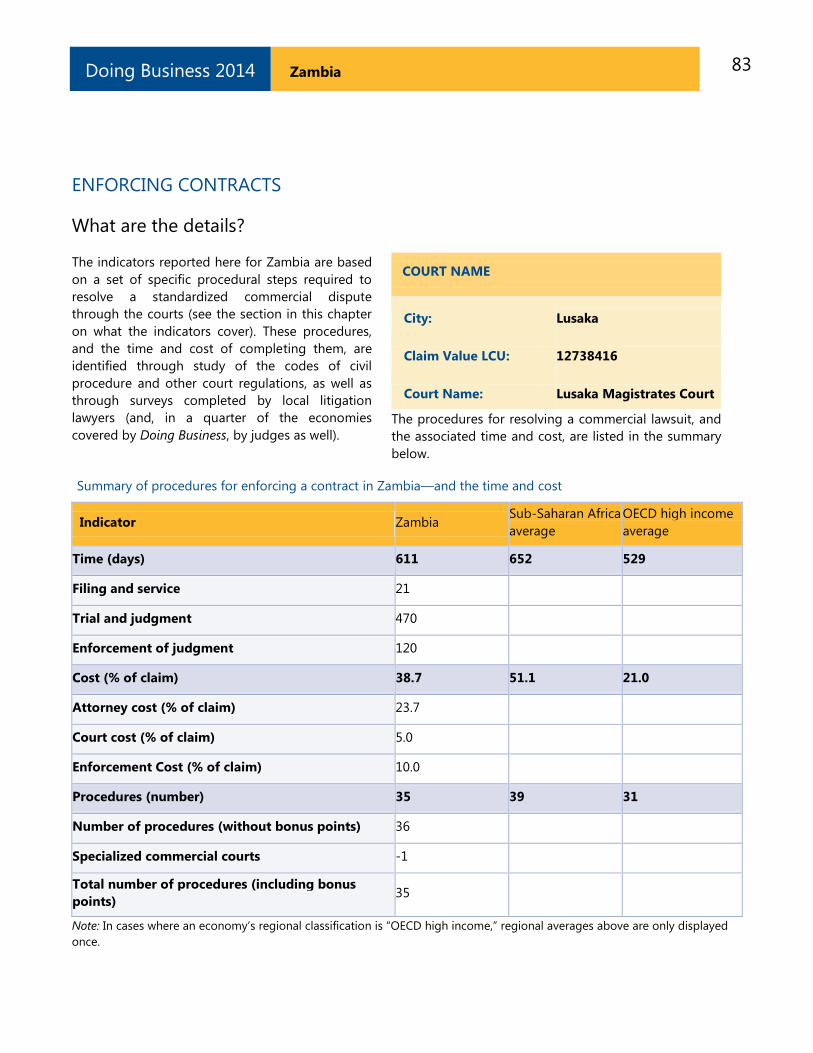
83 Zambia Doing Business 2014
ENFORCING CONTRACTS
What are the details?
The indicators reported here for Zambia are based
on a set of specific procedural steps required to
resolve a standardized commercial dispute
through the courts (see the section in this chapter
on what the indicators cover). These procedures,
and the time and cost of completing them, are
identified through study of the codes of civil
procedure and other court regulations, as well as
through surveys completed by local litigation
lawyers (and, in a quarter of the economies
covered by Doing Business, by judges as well).
COURT NAME
City: Lusaka
Claim Value LCU: 12738416
Court Name: Lusaka Magistrates Court
The procedures for resolving a commercial lawsuit, and
the associated time and cost, are listed in the summary
below.
Summary of procedures for enforcing a contract in Zambia—and the time and cost
Indicator Zambia Sub-Saharan Africa
average
OECD high income
average
Time (days) 611 652 529
Filing and service 21
Trial and judgment 470
Enforcement of judgment 120
Cost (% of claim) 38.7 51.1 21.0
Attorney cost (% of claim) 23.7
Court cost (% of claim) 5.0
Enforcement Cost (% of claim) 10.0
Procedures (number) 35 39 31
Number of procedures (without bonus points) 36
Specialized commercial courts -1
Total number of procedures (including bonus
points) 35
Note: In cases where an economy’s regional classification is “OECD high income,” regional averages above are only displayed
once.
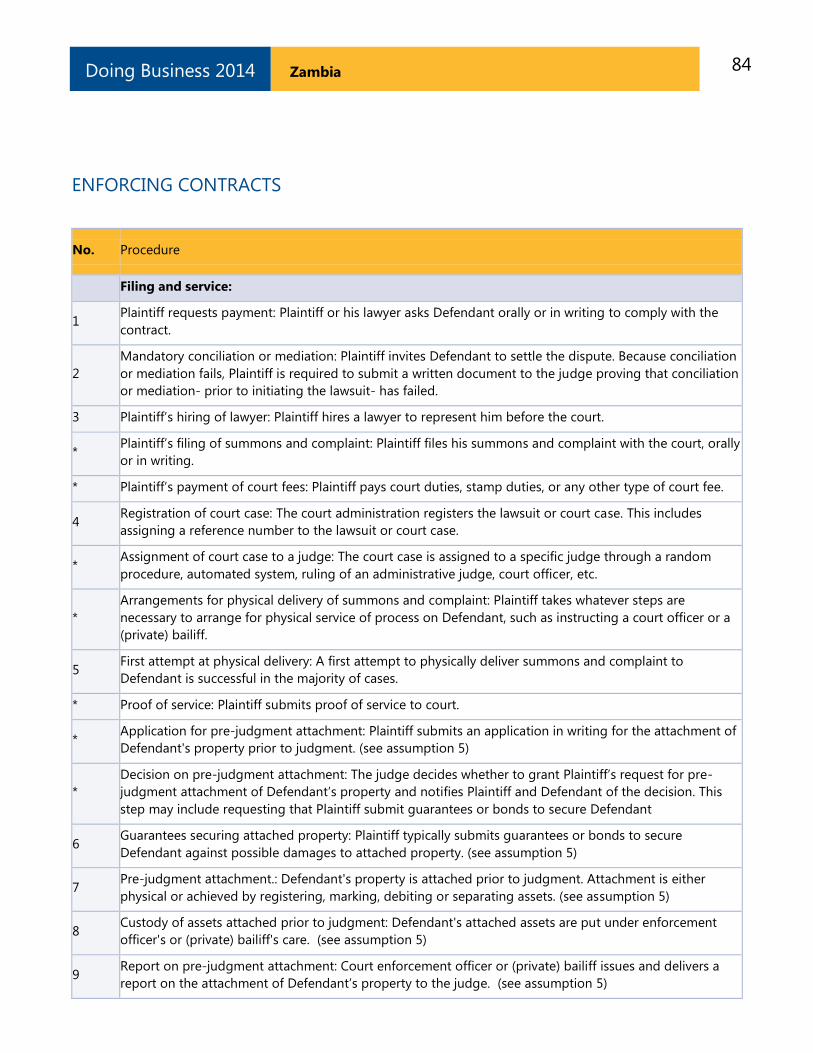
84 Zambia Doing Business 2014
ENFORCING CONTRACTS
No. Procedure
Filing and service:
1 Plaintiff requests payment: Plaintiff or his lawyer asks Defendant orally or in writing to comply with the
contract.
2
Mandatory conciliation or mediation: Plaintiff invites Defendant to settle the dispute. Because conciliation
or mediation fails, Plaintiff is required to submit a written document to the judge proving that conciliation
or mediation- prior to initiating the lawsuit- has failed.
3 Plaintiff’s hiring of lawyer: Plaintiff hires a lawyer to represent him before the court.
* Plaintiff’s filing of summons and complaint: Plaintiff files his summons and complaint with the court, orally
or in writing.
* Plaintiff’s payment of court fees: Plaintiff pays court duties, stamp duties, or any other type of court fee.
4 Registration of court case: The court administration registers the lawsuit or court case. This includes
assigning a reference number to the lawsuit or court case.
* Assignment of court case to a judge: The court case is assigned to a specific judge through a random
procedure, automated system, ruling of an administrative judge, court officer, etc.
*
Arrangements for physical delivery of summons and complaint: Plaintiff takes whatever steps are
necessary to arrange for physical service of process on Defendant, such as instructing a court officer or a
(private) bailiff.
5 First attempt at physical delivery: A first attempt to physically deliver summons and complaint to
Defendant is successful in the majority of cases.
* Proof of service: Plaintiff submits proof of service to court.
* Application for pre-judgment attachment: Plaintiff submits an application in writing for the attachment of
Defendant's property prior to judgment. (see assumption 5)
*
Decision on pre-judgment attachment: The judge decides whether to grant Plaintiff’s request for pre-
judgment attachment of Defendant’s property and notifies Plaintiff and Defendant of the decision. This
step may include requesting that Plaintiff submit guarantees or bonds to secure Defendant
6 Guarantees securing attached property: Plaintiff typically submits guarantees or bonds to secure
Defendant against possible damages to attached property. (see assumption 5)
7 Pre-judgment attachment.: Defendant's property is attached prior to judgment. Attachment is either
physical or achieved by registering, marking, debiting or separating assets. (see assumption 5)
8 Custody of assets attached prior to judgment: Defendant's attached assets are put under enforcement
officer's or (private) bailiff's care. (see assumption 5)
9 Report on pre-judgment attachment: Court enforcement officer or (private) bailiff issues and delivers a
report on the attachment of Defendant’s property to the judge. (see assumption 5)
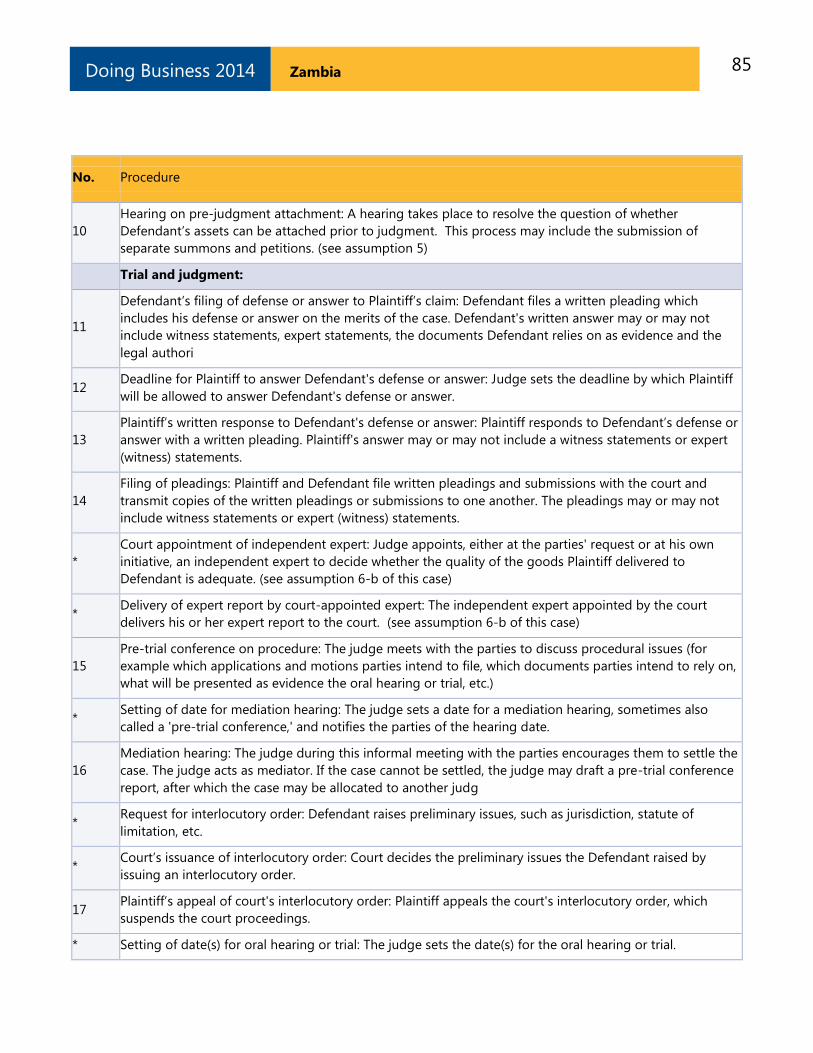
85 Zambia Doing Business 2014
No. Procedure
10
Hearing on pre-judgment attachment: A hearing takes place to resolve the question of whether
Defendant’s assets can be attached prior to judgment. This process may include the submission of
separate summons and petitions. (see assumption 5)
Trial and judgment:
11
Defendant’s filing of defense or answer to Plaintiff’s claim: Defendant files a written pleading which
includes his defense or answer on the merits of the case. Defendant's written answer may or may not
include witness statements, expert statements, the documents Defendant relies on as evidence and the
legal authori
12 Deadline for Plaintiff to answer Defendant's defense or answer: Judge sets the deadline by which Plaintiff
will be allowed to answer Defendant's defense or answer.
13
Plaintiff’s written response to Defendant's defense or answer: Plaintiff responds to Defendant’s defense or
answer with a written pleading. Plaintiff's answer may or may not include a witness statements or expert
(witness) statements.
14
Filing of pleadings: Plaintiff and Defendant file written pleadings and submissions with the court and
transmit copies of the written pleadings or submissions to one another. The pleadings may or may not
include witness statements or expert (witness) statements.
*
Court appointment of independent expert: Judge appoints, either at the parties' request or at his own
initiative, an independent expert to decide whether the quality of the goods Plaintiff delivered to
Defendant is adequate. (see assumption 6-b of this case)
* Delivery of expert report by court-appointed expert: The independent expert appointed by the court
delivers his or her expert report to the court. (see assumption 6-b of this case)
15
Pre-trial conference on procedure: The judge meets with the parties to discuss procedural issues (for
example which applications and motions parties intend to file, which documents parties intend to rely on,
what will be presented as evidence the oral hearing or trial, etc.)
* Setting of date for mediation hearing: The judge sets a date for a mediation hearing, sometimes also
called a 'pre-trial conference,' and notifies the parties of the hearing date.
16
Mediation hearing: The judge during this informal meeting with the parties encourages them to settle the
case. The judge acts as mediator. If the case cannot be settled, the judge may draft a pre-trial conference
report, after which the case may be allocated to another judg
* Request for interlocutory order: Defendant raises preliminary issues, such as jurisdiction, statute of
limitation, etc.
* Court’s issuance of interlocutory order: Court decides the preliminary issues the Defendant raised by
issuing an interlocutory order.
17 Plaintiff’s appeal of court's interlocutory order: Plaintiff appeals the court's interlocutory order, which
suspends the court proceedings.
* Setting of date(s) for oral hearing or trial: The judge sets the date(s) for the oral hearing or trial.
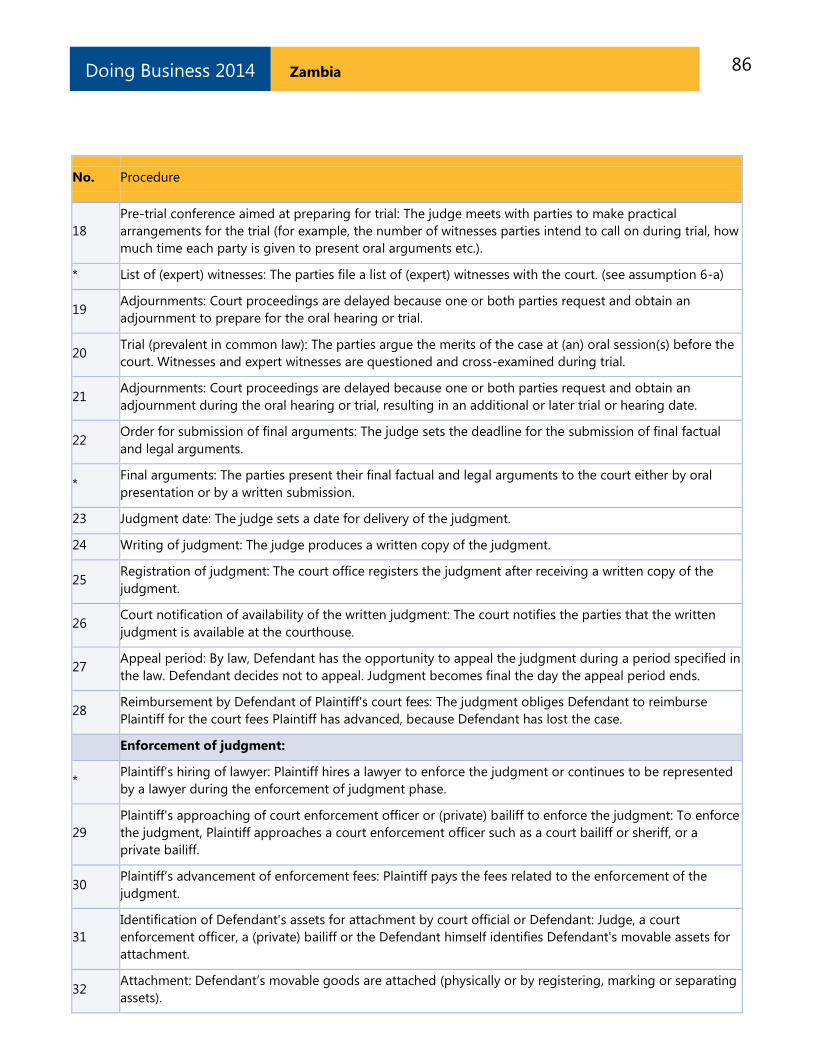
86 Zambia Doing Business 2014
No. Procedure
18
Pre-trial conference aimed at preparing for trial: The judge meets with parties to make practical
arrangements for the trial (for example, the number of witnesses parties intend to call on during trial, how
much time each party is given to present oral arguments etc.).
* List of (expert) witnesses: The parties file a list of (expert) witnesses with the court. (see assumption 6-a)
19 Adjournments: Court proceedings are delayed because one or both parties request and obtain an
adjournment to prepare for the oral hearing or trial.
20 Trial (prevalent in common law): The parties argue the merits of the case at (an) oral session(s) before the
court. Witnesses and expert witnesses are questioned and cross-examined during trial.
21 Adjournments: Court proceedings are delayed because one or both parties request and obtain an
adjournment during the oral hearing or trial, resulting in an additional or later trial or hearing date.
22 Order for submission of final arguments: The judge sets the deadline for the submission of final factual
and legal arguments.
* Final arguments: The parties present their final factual and legal arguments to the court either by oral
presentation or by a written submission.
23 Judgment date: The judge sets a date for delivery of the judgment.
24 Writing of judgment: The judge produces a written copy of the judgment.
25 Registration of judgment: The court office registers the judgment after receiving a written copy of the
judgment.
26 Court notification of availability of the written judgment: The court notifies the parties that the written
judgment is available at the courthouse.
27 Appeal period: By law, Defendant has the opportunity to appeal the judgment during a period specified in
the law. Defendant decides not to appeal. Judgment becomes final the day the appeal period ends.
28 Reimbursement by Defendant of Plaintiff's court fees: The judgment obliges Defendant to reimburse
Plaintiff for the court fees Plaintiff has advanced, because Defendant has lost the case.
Enforcement of judgment:
* Plaintiff’s hiring of lawyer: Plaintiff hires a lawyer to enforce the judgment or continues to be represented
by a lawyer during the enforcement of judgment phase.
29
Plaintiff's approaching of court enforcement officer or (private) bailiff to enforce the judgment: To enforce
the judgment, Plaintiff approaches a court enforcement officer such as a court bailiff or sheriff, or a
private bailiff.
30 Plaintiff’s advancement of enforcement fees: Plaintiff pays the fees related to the enforcement of the
judgment.
31
Identification of Defendant's assets for attachment by court official or Defendant: Judge, a court
enforcement officer, a (private) bailiff or the Defendant himself identifies Defendant's movable assets for
attachment.
32 Attachment: Defendant’s movable goods are attached (physically or by registering, marking or separating
assets).
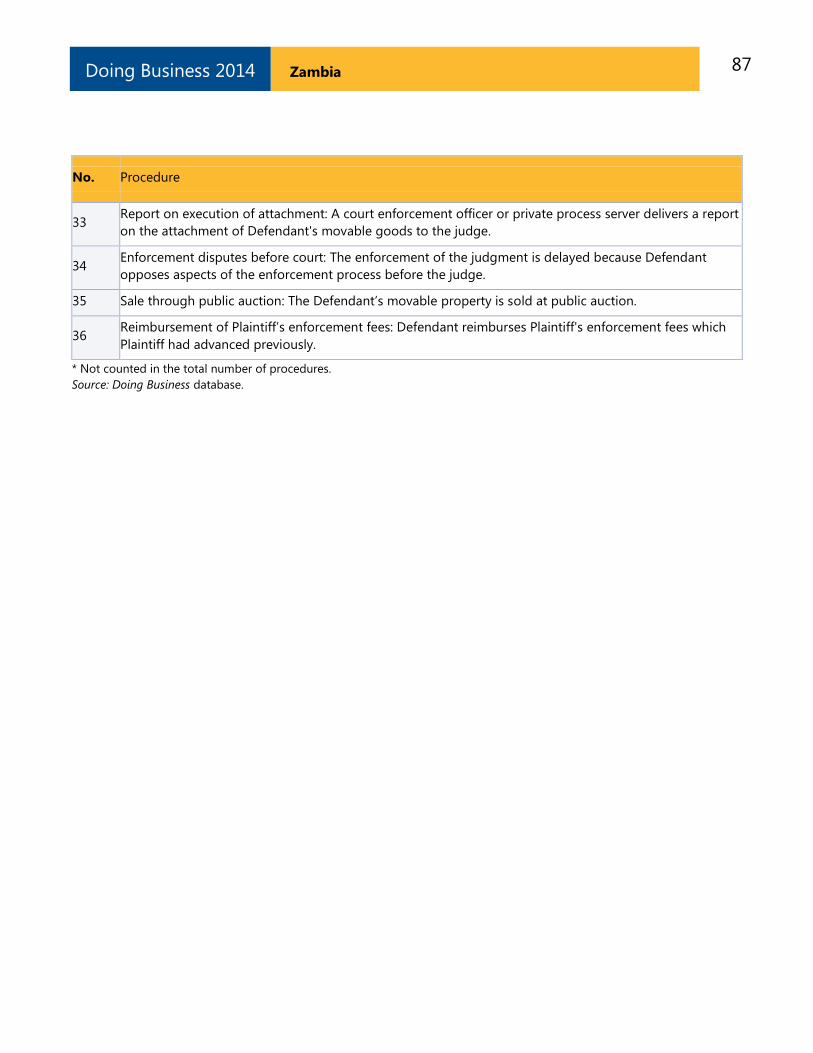
87 Zambia Doing Business 2014
No. Procedure
33 Report on execution of attachment: A court enforcement officer or private process server delivers a report
on the attachment of Defendant's movable goods to the judge.
34 Enforcement disputes before court: The enforcement of the judgment is delayed because Defendant
opposes aspects of the enforcement process before the judge.
35 Sale through public auction: The Defendant’s movable property is sold at public auction.
36 Reimbursement of Plaintiff’s enforcement fees: Defendant reimburses Plaintiff's enforcement fees which
Plaintiff had advanced previously.
* Not counted in the total number of procedures.
Source: Doing Business database.
88 Zambia Doing Business 2014
RESOLVING INSOLVENCY
A robust bankruptcy system functions as a filter,
ensuring the survival of economically efficient
companies and reallocating the resources of
inefficient ones. Fast and cheap insolvency
proceedings result in the speedy return of
businesses to normal operation and increase
returns to creditors. By improving the expectations
of creditors and debtors about the outcome of
insolvency proceedings, well-functioning
insolvency systems can facilitate access to finance,
save more viable businesses and thereby improve
growth and sustainability in the economy overall.
What do the indicators cover?
Doing Business studies the time, cost and outcome
of insolvency proceedings involving domestic
entities. It does not measure insolvency
proceedings of individuals and financial
institutions. The data are derived from survey
responses by local insolvency practitioners and
verified through a study of laws and regulations as
well as public information on bankruptcy systems.
The ranking on the ease of resolving insolvency is
based on the recovery rate, which is recorded as
cents on the dollar recouped by creditors through
reorganization, liquidation or debt enforcement
(foreclosure) proceedings. The recovery rate is a
function of time, cost and other factors, such as
lending rate and the likelihood of the company
continuing to operate.
To make the data comparable across economies,
Doing Business uses several assumptions about the
business and the case. It assumes that the
company:
Is a domestically owned, limited liability
company operating a hotel.
Operates in the economy’s largest business
city.
Has 201 employees, 1 main secured
creditor and 50 unsecured creditors.
WHAT THE RESOLVING INSOLVENCY
INDICATORS MEASURE
Time required to recover debt (years)
Measured in calendar years
Appeals and requests for extension are
included
Cost required to recover debt (% of debtor’s
estate)
Measured as percentage of estate value
Court fees
Fees of insolvency administrators
Lawyers’ fees
Assessors’ and auctioneers’ fees
Other related fees
Outcome
Whether business continues operating as a
going concern or business assets are sold
piecemeal
Recovery rate for creditors (cents on the
dollar)
Measures the cents on the dollar recovered
by creditors
Present value of debt recovered
Official costs of the insolvency proceedings
are deducted
Depreciation of furniture is taken into
account
Outcome for the business (survival or not)
affects the maximum value that can be
recovered
Has a higher value as a going concern—and
the efficient outcome is either reorganization
or sale as a going concern, not piecemeal
liquidation.
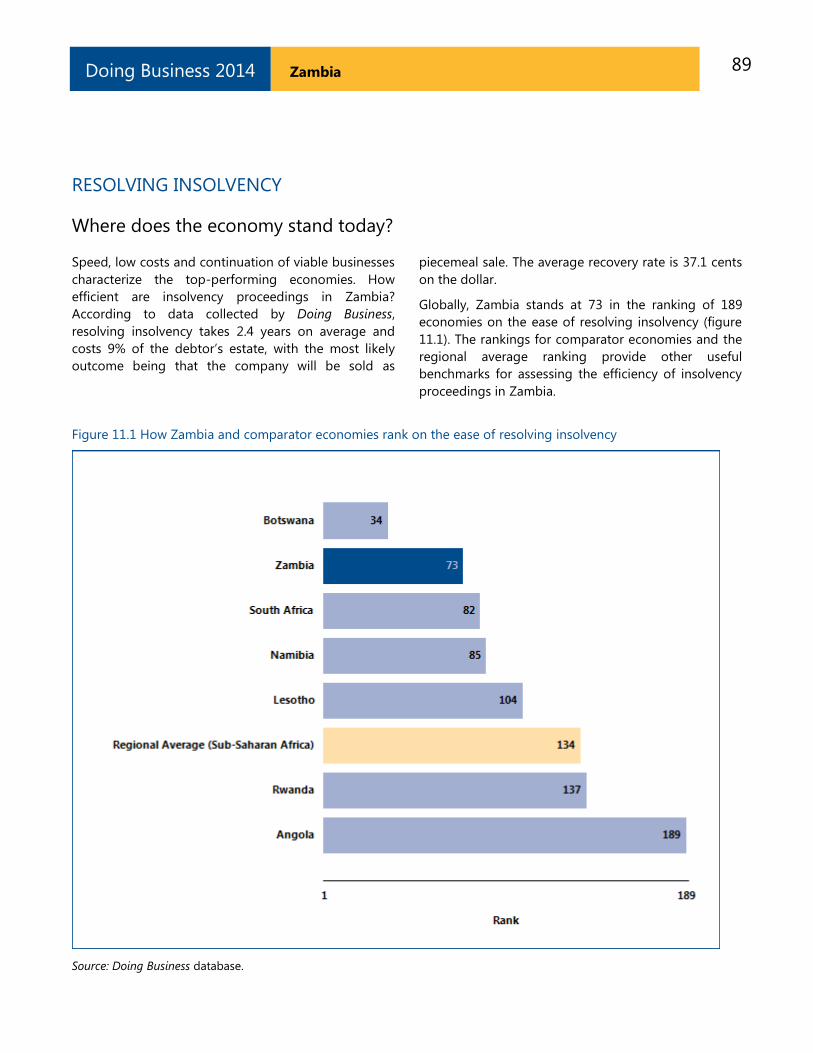
89 Zambia Doing Business 2014
RESOLVING INSOLVENCY
Where does the economy stand today?
Speed, low costs and continuation of viable businesses
characterize the top-performing economies. How
efficient are insolvency proceedings in Zambia?
According to data collected by Doing Business,
resolving insolvency takes 2.4 years on average and
costs 9% of the debtor’s estate, with the most likely
outcome being that the company will be sold as
piecemeal sale. The average recovery rate is 37.1 cents
on the dollar.
Globally, Zambia stands at 73 in the ranking of 189
economies on the ease of resolving insolvency (figure
11.1). The rankings for comparator economies and the
regional average ranking provide other useful
benchmarks for assessing the efficiency of insolvency
proceedings in Zambia.
Figure 11.1 How Zambia and comparator economies rank on the ease of resolving insolvency
Source: Doing Business database.
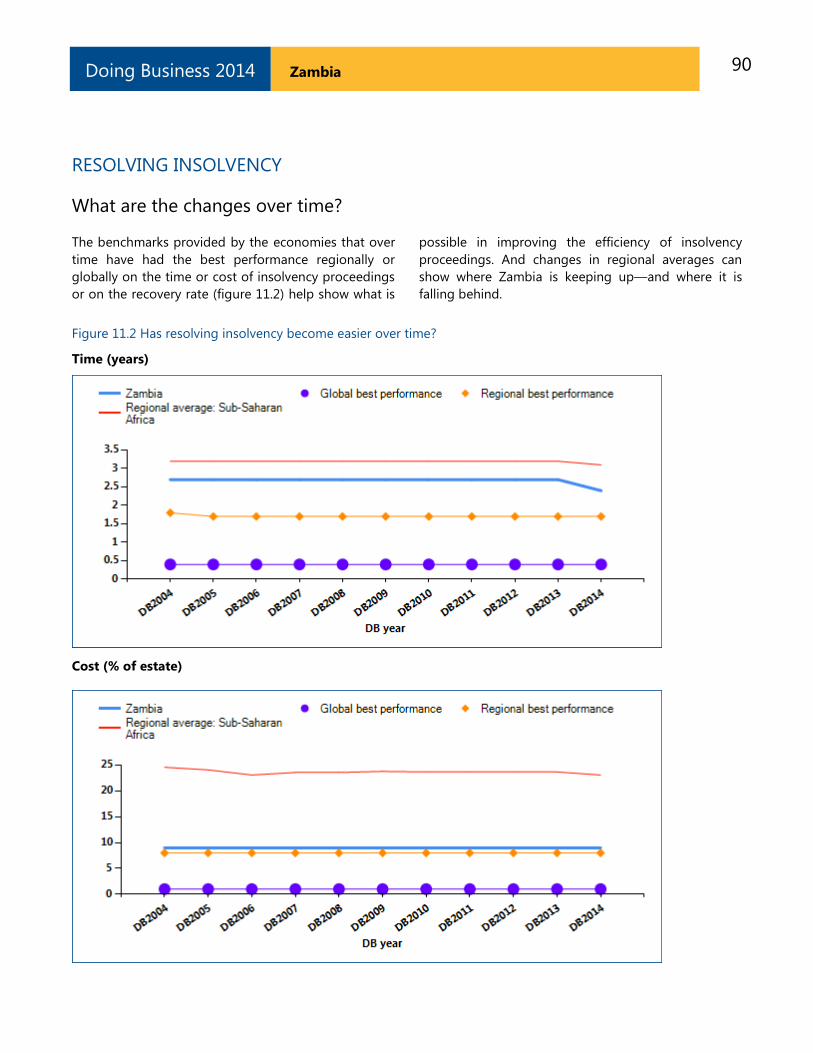
90 Zambia Doing Business 2014
RESOLVING INSOLVENCY
What are the changes over time?
The benchmarks provided by the economies that over
time have had the best performance regionally or
globally on the time or cost of insolvency proceedings
or on the recovery rate (figure 11.2) help show what is
possible in improving the efficiency of insolvency
proceedings. And changes in regional averages can
show where Zambia is keeping up—and where it is
falling behind.
Figure 11.2 Has resolving insolvency become easier over time?
Time (years)
Cost (% of estate)
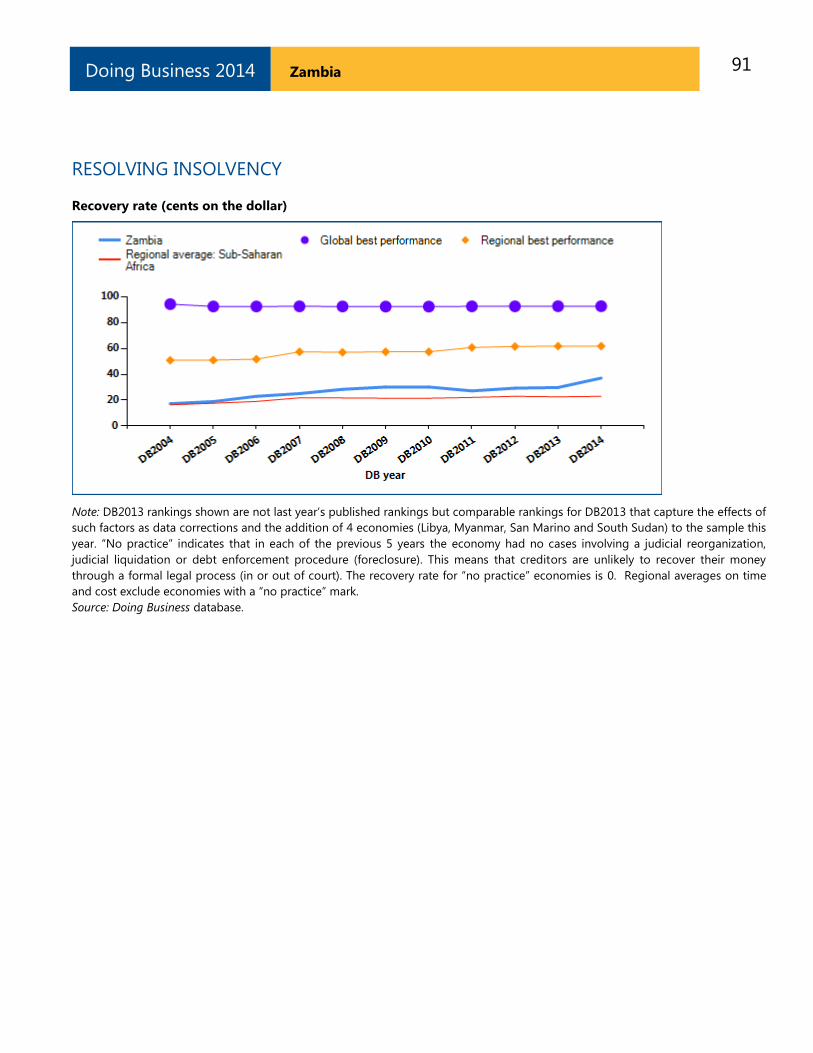
91 Zambia Doing Business 2014
RESOLVING INSOLVENCY
Recovery rate (cents on the dollar)
Note: DB2013 rankings shown are not last year’s published rankings but comparable rankings for DB2013 that capture the effects of
such factors as data corrections and the addition of 4 economies (Libya, Myanmar, San Marino and South Sudan) to the sample this
year. “No practice” indicates that in each of the previous 5 years the economy had no cases involving a judicial reorganization,
judicial liquidation or debt enforcement procedure (foreclosure). This means that creditors are unlikely to recover their money
through a formal legal process (in or out of court). The recovery rate for “no practice” economies is 0. Regional averages on time
and cost exclude economies with a “no practice” mark.
Source: Doing Business database.
92 Zambia Doing Business 2014
RESOLVING INSOLVENCY
A well-balanced bankruptcy system distinguishes
companies that are financially distressed but
economically viable from inefficient companies that
should be liquidated. But in some insolvency systems
even viable businesses are liquidated. This is starting to
change. Many recent reforms of bankruptcy laws have
been aimed at helping more of the viable businesses
survive. What insolvency reforms has Doing Business
recorded in Zambia (table 11.1)?
Table 11.1 How has Zambia made resolving insolvency easier—or not?
By Doing Business report year
DB year Reform
DB2009 No reform as measured by Doing Business.
DB2010 No reform as measured by Doing Business.
DB2011 No reform as measured by Doing Business.
DB2012 No reform as measured by Doing Business.
DB2013
Zambia strengthened its insolvency process by introducing
further qualification requirements for receivers and liquidators
and by establishing specific duties and remuneration rules for
them.
DB2014 No reform as measured by Doing Business.
Note: For information on reforms in earlier years (back to DB2005), see the Doing Business reports
for these years, available at http://www.doingbusiness.org.
Source: Doing Business database.
93 Zambia Doing Business 2014
EMPLOYING WORKERS
Doing Business measures flexibility in the regulation of
employment, specifically as it affects the hiring and
redundancy of workers and the rigidity of working
hours. Over the period from 2007 to 2011
improvements were made to align the methodology
for the employing workers indicators with the letter
and spirit of the International Labour Organization
(ILO) conventions. Only 4 of the 188 ILO conventions
cover areas measured by Doing Business: employee
termination, weekend work, holiday with pay and night
work. The Doing Business methodology is fully
consistent with these 4 conventions. The ILO
conventions covering areas related to the Employing
Workers indicators do not include the ILO core labor
standards—8 conventions covering the right to
collective bargaining, the elimination of forced labor,
the abolition of child labor and equitable treatment in
employment practices.
Between 2009 and 2011 the World Bank Group worked
with a consultative group—including labor lawyers,
employer and employee representatives, and experts
from the ILO, OECD, civil society and the private
sector—to review the employing workers
methodology and explore future areas of research.i A
full report with the conclusions of the consultative
group is available at
http://www.doingbusiness.org/methodology/employin
g-workers.
This year Doing Business continued research collecting
additional data on regulations covering the
probationary period for new employees.
Doing Business 2014 presents the data on the
employing workers indicators in an annex. The report
does not present rankings of economies on the
employing workers indicators nor include the topic in
the aggregate ranking on the ease of doing business.
Detailed data collected on labor regulations and the
employing workers methodology proposed by the
consultative group are available on the Doing Business
website (http://www.doingbusiness.org). The data on
employing workers are based on a detailed survey of
employment regulations that is completed by local
lawyers and public officials. Employment laws and
regulations as well as secondary sources are reviewed
to ensure accuracy.
To make the data comparable across economies,
several assumptions about the worker and the
business are used.
The worker:
Earns a salary plus benefits equal to the
economy’s average wage during the entire
period of his employment.
Has a pay period that is the most common for
workers in the economy.
Is a lawful citizen who belongs to the same
race and religion as the majority of the
economy’s population.
Resides in the economy’s largest business city.
Is not a member of a labor union, unless
membership is mandatory.
The business:
Is a limited liability company.
Operates in the economy’s largest business
city.
Is 100% domestically owned.
Operates in the manufacturing sector.
Has 60 employees.
Is subject to collective bargaining agreements
in economies where such agreements cover
more than half the manufacturing sector and
apply even to firms not party to them.
Abides by every law and regulation but does
not grant workers more benefits than
mandated by law, regulation or (if applicable)
collective bargaining agreement.
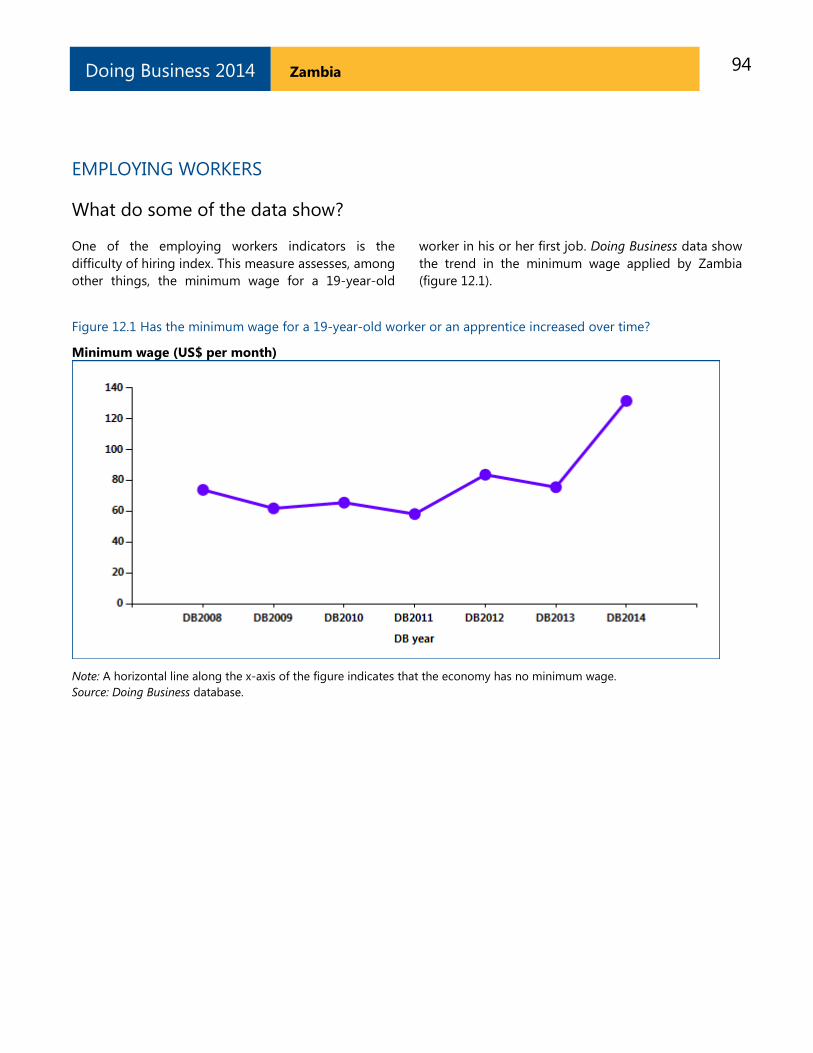
94 Zambia Doing Business 2014
EMPLOYING WORKERS
What do some of the data show?
One of the employing workers indicators is the
difficulty of hiring index. This measure assesses, among
other things, the minimum wage for a 19-year-old
worker in his or her first job. Doing Business data show
the trend in the minimum wage applied by Zambia
(figure 12.1).
Figure 12.1 Has the minimum wage for a 19-year-old worker or an apprentice increased over time?
Minimum wage (US$ per month)
Note: A horizontal line along the x-axis of the figure indicates that the economy has no minimum wage.
Source: Doing Business database.
95 Zambia Doing Business 2014
EMPLOYING WORKERS
Employment laws are needed to protect workers from
arbitrary or unfair treatment and to ensure efficient
contracting between employers and workers. Many
economies that changed their labor regulations in the
past 5 years did so in ways that increased labor market
flexibility. What changes did Zambia adopt that
affected the Doing Business indicators on employing
workers (table 12.1)?
Table 12.1 What changes did Zambia make in employing workers in 2013?
DB year Reform
DB2009 No reform as measured by Doing Business.
DB2010 No reform as measured by Doing Business.
DB2011 No reform as measured by Doing Business.
DB2012 No reform as measured by Doing Business.
DB2013 No reform as measured by Doing Business.
DB2014 No reform as measured by Doing Business.
Source: Doing Business database.
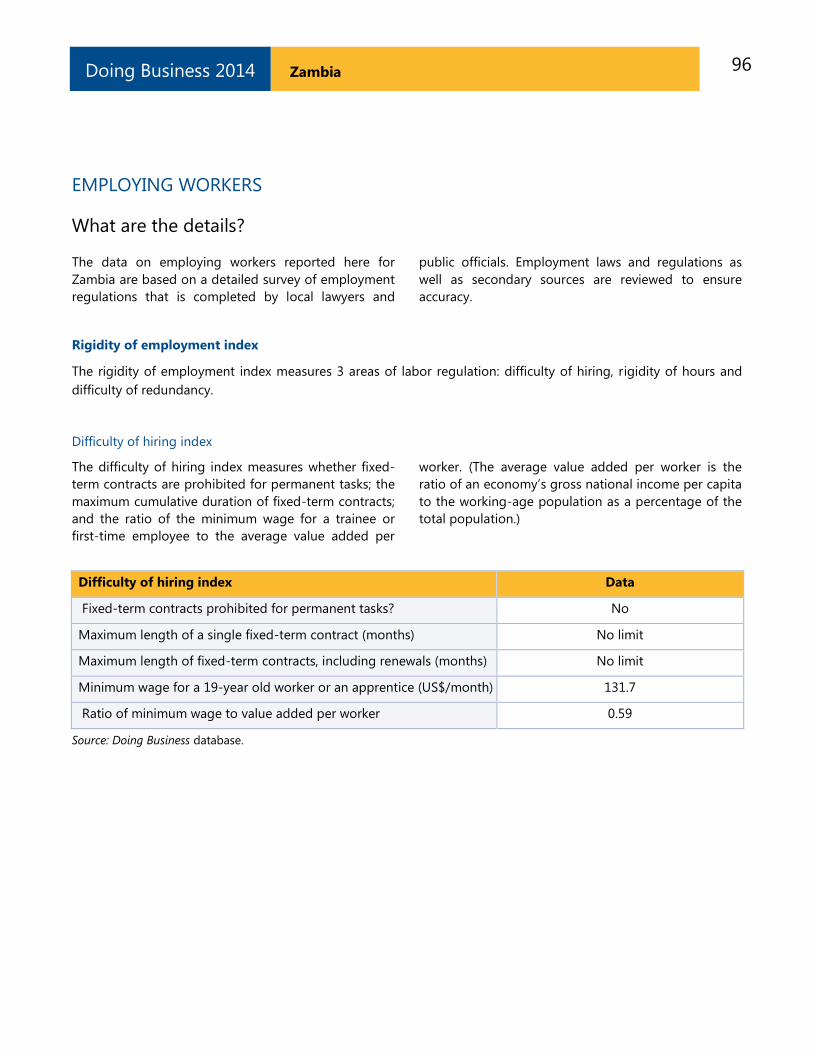
96 Zambia Doing Business 2014
EMPLOYING WORKERS
What are the details?
The data on employing workers reported here for
Zambia are based on a detailed survey of employment
regulations that is completed by local lawyers and
public officials. Employment laws and regulations as
well as secondary sources are reviewed to ensure
accuracy.
Rigidity of employment index
The rigidity of employment index measures 3 areas of labor regulation: difficulty of hiring, rigidity of hours and
difficulty of redundancy.
Difficulty of hiring index
The difficulty of hiring index measures whether fixed-
term contracts are prohibited for permanent tasks; the
maximum cumulative duration of fixed-term contracts;
and the ratio of the minimum wage for a trainee or
first-time employee to the average value added per
worker. (The average value added per worker is the
ratio of an economy’s gross national income per capita
to the working-age population as a percentage of the
total population.)
Difficulty of hiring index Data
Fixed-term contracts prohibited for permanent tasks? No
Maximum length of a single fixed-term contract (months) No limit
Maximum length of fixed-term contracts, including renewals (months) No limit
Minimum wage for a 19-year old worker or an apprentice (US$/month) 131.7
Ratio of minimum wage to value added per worker 0.59
Source: Doing Business database.
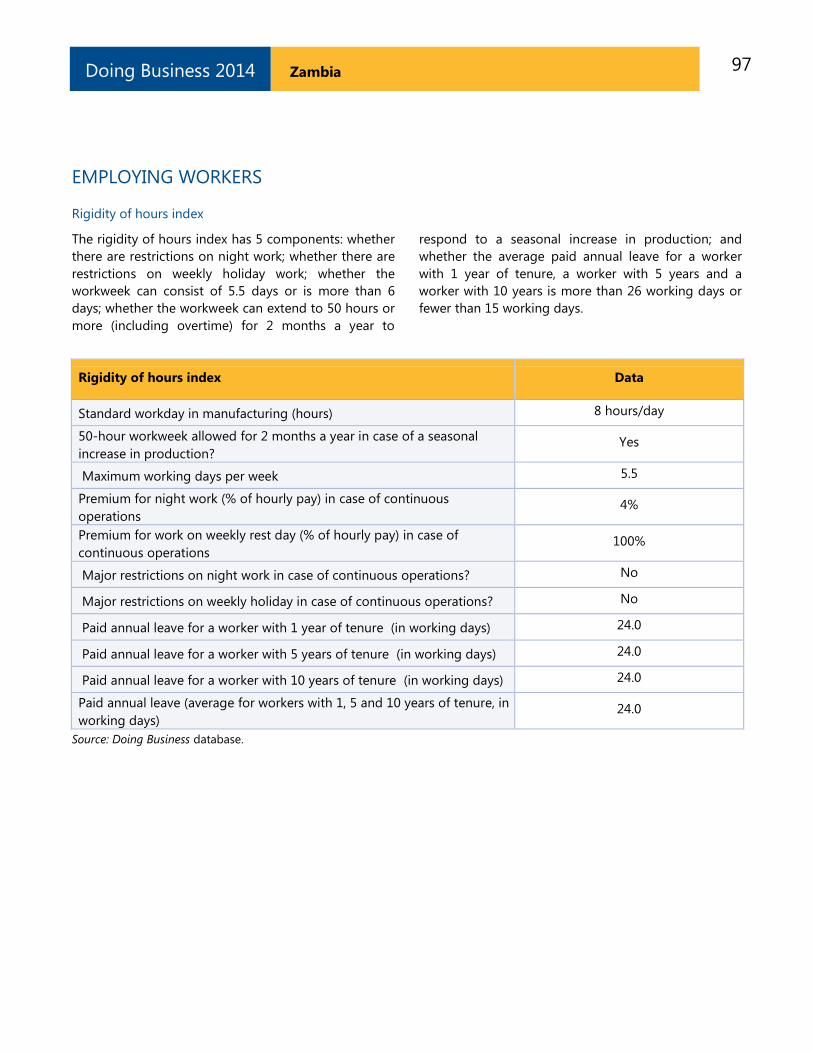
97 Zambia Doing Business 2014
EMPLOYING WORKERS
Rigidity of hours index
The rigidity of hours index has 5 components: whether
there are restrictions on night work; whether there are
restrictions on weekly holiday work; whether the
workweek can consist of 5.5 days or is more than 6
days; whether the workweek can extend to 50 hours or
more (including overtime) for 2 months a year to
respond to a seasonal increase in production; and
whether the average paid annual leave for a worker
with 1 year of tenure, a worker with 5 years and a
worker with 10 years is more than 26 working days or
fewer than 15 working days.
Rigidity of hours index Data
Standard workday in manufacturing (hours) 8 hours/day
50-hour workweek allowed for 2 months a year in case of a seasonal
increase in production? Yes
Maximum working days per week 5.5
Premium for night work (% of hourly pay) in case of continuous
operations 4%
Premium for work on weekly rest day (% of hourly pay) in case of
continuous operations 100%
Major restrictions on night work in case of continuous operations? No
Major restrictions on weekly holiday in case of continuous operations? No
Paid annual leave for a worker with 1 year of tenure (in working days) 24.0
Paid annual leave for a worker with 5 years of tenure (in working days) 24.0
Paid annual leave for a worker with 10 years of tenure (in working days) 24.0
Paid annual leave (average for workers with 1, 5 and 10 years of tenure, in
working days) 24.0
Source: Doing Business database.
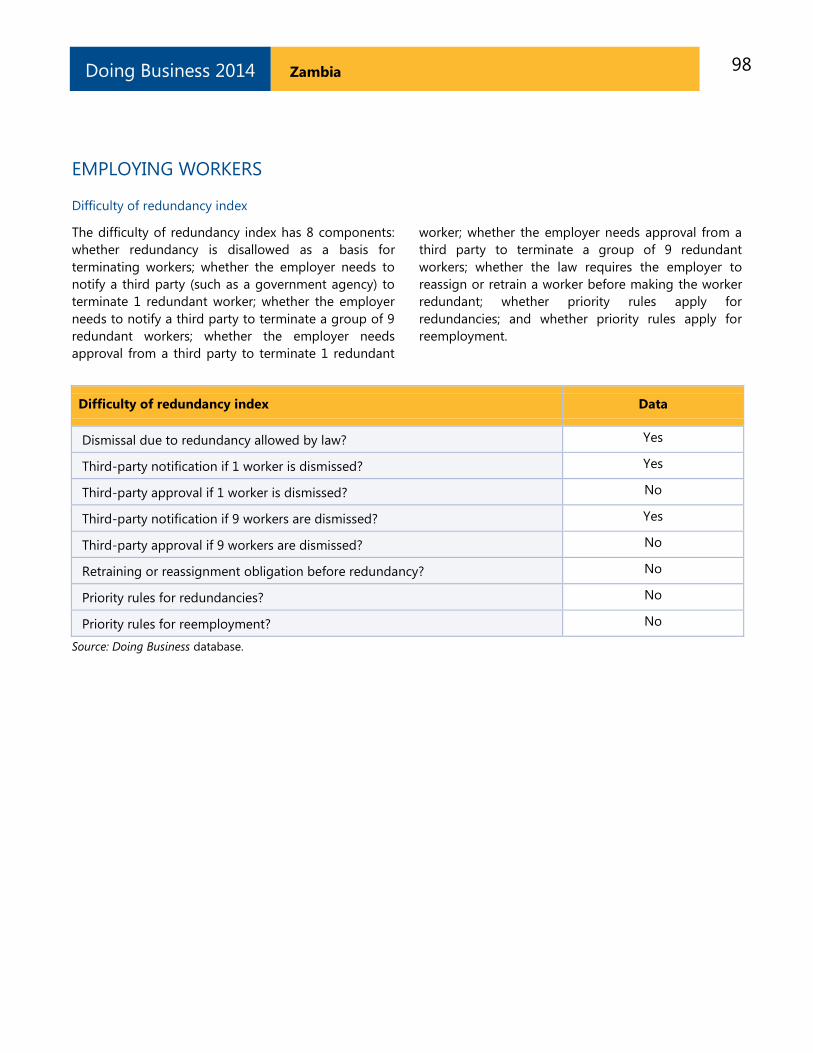
98 Zambia Doing Business 2014
EMPLOYING WORKERS
Difficulty of redundancy index
The difficulty of redundancy index has 8 components:
whether redundancy is disallowed as a basis for
terminating workers; whether the employer needs to
notify a third party (such as a government agency) to
terminate 1 redundant worker; whether the employer
needs to notify a third party to terminate a group of 9
redundant workers; whether the employer needs
approval from a third party to terminate 1 redundant
worker; whether the employer needs approval from a
third party to terminate a group of 9 redundant
workers; whether the law requires the employer to
reassign or retrain a worker before making the worker
redundant; whether priority rules apply for
redundancies; and whether priority rules apply for
reemployment.
Difficulty of redundancy index Data
Dismissal due to redundancy allowed by law? Yes
Third-party notification if 1 worker is dismissed? Yes
Third-party approval if 1 worker is dismissed? No
Third-party notification if 9 workers are dismissed? Yes
Third-party approval if 9 workers are dismissed? No
Retraining or reassignment obligation before redundancy? No
Priority rules for redundancies? No
Priority rules for reemployment? No
Source: Doing Business database.
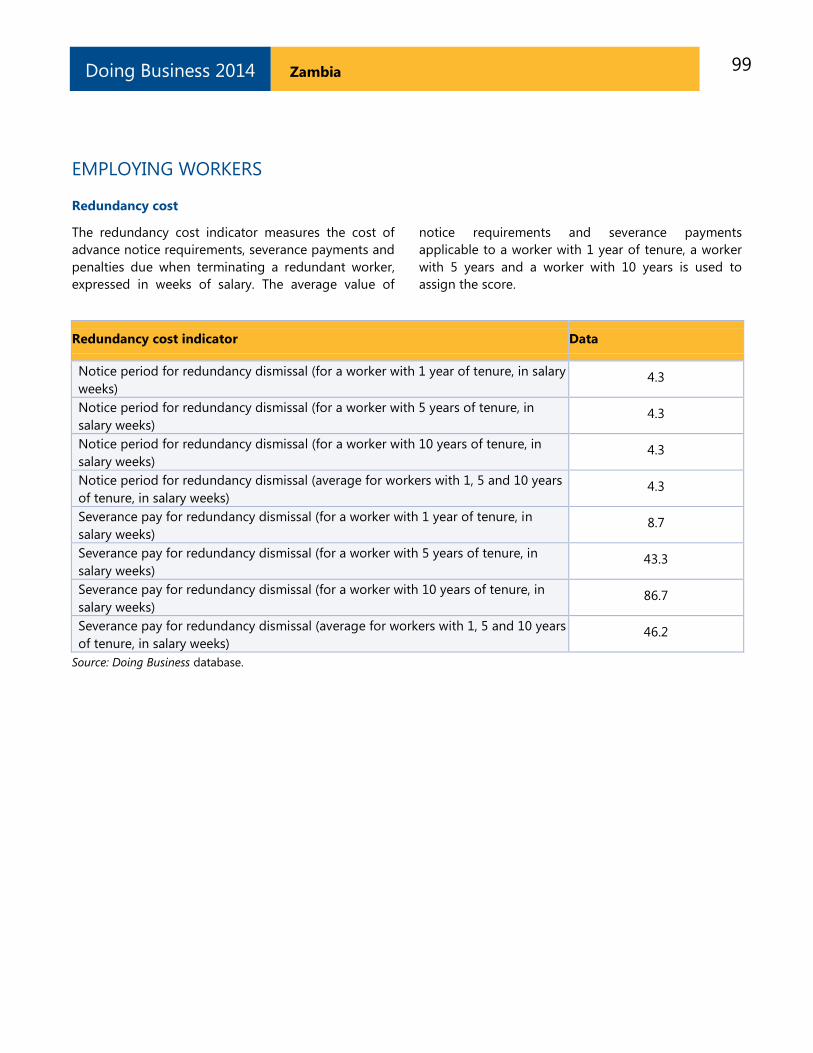
99 Zambia Doing Business 2014
EMPLOYING WORKERS
Redundancy cost
The redundancy cost indicator measures the cost of
advance notice requirements, severance payments and
penalties due when terminating a redundant worker,
expressed in weeks of salary. The average value of
notice requirements and severance payments
applicable to a worker with 1 year of tenure, a worker
with 5 years and a worker with 10 years is used to
assign the score.
Redundancy cost indicator Data
Notice period for redundancy dismissal (for a worker with 1 year of tenure, in salary
weeks) 4.3
Notice period for redundancy dismissal (for a worker with 5 years of tenure, in
salary weeks) 4.3
Notice period for redundancy dismissal (for a worker with 10 years of tenure, in
salary weeks) 4.3
Notice period for redundancy dismissal (average for workers with 1, 5 and 10 years
of tenure, in salary weeks) 4.3
Severance pay for redundancy dismissal (for a worker with 1 year of tenure, in
salary weeks) 8.7
Severance pay for redundancy dismissal (for a worker with 5 years of tenure, in
salary weeks) 43.3
Severance pay for redundancy dismissal (for a worker with 10 years of tenure, in
salary weeks) 86.7
Severance pay for redundancy dismissal (average for workers with 1, 5 and 10 years
of tenure, in salary weeks) 46.2
Source: Doing Business database.
100 Zambia Doing Business 2014
DATA NOTES
The indicators presented and analyzed in Doing
Business measure business regulation and the
protection of property rights—and their effect on
businesses, especially small and medium-size domestic
firms. First, the indicators document the complexity of
regulation, such as the number of procedures to start a
business or to register and transfer commercial
property. Second, they gauge the time and cost to
achieve a regulatory goal or comply with regulation,
such as the time and cost to enforce a contract, go
through bankruptcy or trade across borders. Third,
they measure the extent of legal protections of
property, for example, the protections of investors
against looting by company directors or the range of
assets that can be used as collateral according to
secured transactions laws. Fourth, a set of indicators
documents the tax burden on businesses. Finally, a set
of data covers different aspects of employment
regulation. The 11 sets of indicators measured in
Doing Business were added over time, and the sample
of economies expanded.
The data for all sets of indicators in Doing Business
2014 are for June 2013.2
Methodology
The Doing Business data are collected in a
standardized way. To start, the Doing Business team,
with academic advisers, designs a questionnaire. The
questionnaire uses a simple business case to ensure
comparability across economies and over time—with
assumptions about the legal form of the business, its
size, its location and the nature of its operations.
Questionnaires are administered to more than 10,200
local experts, including lawyers, business consultants,
accountants, freight forwarders, government officials
and other professionals routinely administering or
advising on legal and regulatory requirements (table
21.2). These experts have several rounds of interaction
with the Doing Business team, involving conference
calls, written correspondence and visits by the team.
For Doing Business 2014 team members visited 33
economies to verify data and recruit respondents. The
data from questionnaires are subjected to numerous
2 The data for paying taxes refer to January – December 2012.
rounds of verification, leading to revisions or
expansions of the information collected.
The Doing Business methodology offers several
advantages. It is transparent, using factual information
about what laws and regulations say and allowing
multiple interactions with local respondents to clarify
ECONOMY CHARACTERISTICS
Gross national income per capita
Doing Business 2014 reports 2012 income per capita
as published in the World Bank’s World Development
Indicators 2013. Income is calculated using the Atlas
method (current U.S. dollars). For cost indicators
expressed as a percentage of income per capita,
2012 gross national income (GNI) in U.S. dollars is
used as the denominator. GNI data were not
available from the World Bank for Afghanistan, The
Bahamas, Bahrain, Barbados, Brunei Darussalam,
Djibouti, the Islamic Republic of Iran, Kuwait, Libya,
Myanmar, New Zealand, Oman, San Marino, the
Syrian Arab Republic, West Bank and Gaza, and the
Republic of Yemen. In these cases GDP or GNP per
capita data and growth rates from other sources,
such as the International Monetary Fund’s World
Economic Outlook database and the Economist
Intelligence Unit, were used.
Region and income group
Doing Business uses the World Bank regional and
income group classifications, available at
http://data.worldbank.org/about/country-
classifications. The World Bank does not assign
regional classifications to high-income economies.
For the purpose of the Doing Business report, high-
income OECD economies are assigned the “regional”
classification OECD high income. Figures and tables
presenting regional averages include economies
from all income groups (low, lower middle, upper
middle and high income).
Population
Doing Business 2014 reports midyear 2012
population statistics as published in World
Development Indicators 2013.
101 Zambia Doing Business 2014
potential misinterpretations of questions. Having
representative samples of respondents is not an issue;
Doing Business is not a statistical survey, and the texts
of the relevant laws and regulations are collected and
answers checked for accuracy. The methodology is
inexpensive and easily replicable, so data can be
collected in a large sample of economies. Because
standard assumptions are used in the data collection,
comparisons and benchmarks are valid across
economies. Finally, the data not only highlight the
extent of specific regulatory obstacles to business but
also identify their source and point to what might be
reformed. Information on the methodology for each
Doing Business topic can be found on the Doing
Business website at
http://www.doingbusiness.org/methodology.
Limits to what is measured
The Doing Business methodology has 5 limitations that
should be considered when interpreting the data. First,
the collected data refer to businesses in the economy’s
largest business city (which in some economies differs
from the capital) and may not be representative of
regulation in other parts of the economy. To address
this limitation, subnational Doing Business indicators
were created (box 21.1). Second, the data often focus
on a specific business form—generally a limited
liability company (or its legal equivalent) of a specified
size—and may not be representative of the regulation
on other businesses, for example, sole proprietorships.
Third, transactions described in a standardized case
scenario refer to a specific set of issues and may not
represent the full set of issues a business encounters.
Fourth, the measures of time involve an element of
judgment by the expert respondents. When sources
indicate different estimates, the time indicators
reported in Doing Business represent the median
values of several responses given under the
assumptions of the standardized case.
Finally, the methodology assumes that a business has
full information on what is required and does not
waste time when completing procedures. In practice,
completing a procedure may take longer if the
business lacks information or is unable to follow up
promptly. Alternatively, the business may choose to
disregard some burdensome procedures. For both
reasons the time delays reported in Doing Business
2014 would differ from the recollection of
entrepreneurs reported in the World Bank Enterprise
Surveys or other perception surveys.
This year Doing Business completed subnational
studies in Colombia, Italy and the city of Hargeisa
(Somaliland) and is currently updating indicators in
Egypt, Mexico and Nigeria. Doing Business also
published regional studies for the g7+ and the East
African Community. The g7+ group is a country-
owned and country-led global mechanism established
in April 2010 to monitor, report and draw attention to
the unique challenges faced by fragile states. The
member countries included in the report are
Afghanistan, Burundi, the Central African Republic,
Chad, the Comoros, the Democratic Republic of
Congo, Côte d’Ivoire, Guinea, Guinea-Bissau, Haiti,
Liberia, Papua New Guinea, Sierra Leone, the Solomon
Islands, South Sudan, Timor-Leste and Togo.
The subnational studies point to differences in
business regulation and its implementation—as well as
in the pace of regulatory reform—across cities in the
same economy. For several economies subnational
studies are now periodically updated to measure
change over time or to expand geographic coverage
to additional cities. This year that is the case for all the
subnational studies published.
Changes in what is measured
The methodology for 2 indicator sets—trading across
borders and paying taxes—was updated this year. For
trading across borders, documents that are required
purely for purposes of preferential treatment are no
longer included in the list of documents (for example,
a certificate of origin if the use is only to qualify for a
preferential tariff rate under trade agreements). For
paying taxes, the value of fuel taxes is no longer
included in the total tax rate because of the difficulty
of computing these taxes in a consistent way across all
economies covered. The fuel tax amounts are in most
cases very small, and measuring these amounts is
often complicated because they depend on fuel
consumption. Fuel taxes continue to be counted in the
number of payments.
In a change involving several indicator sets, the rule
establishing that each procedure must take at least 1
day was removed for procedures that can be fully
completed online in just a few hours. This change
affects the time indicator for starting a business,
102 Zambia Doing Business 2014
dealing with construction permits and registering
property.3 For procedures that can be fully completed
online, the duration is now set at half a day rather than
a full day.
The threshold for the total tax rate introduced in 2011
for the purpose of calculating the ranking on the ease
of paying taxes was updated. All economies with a
total tax rate below the threshold (which is calculated
and adjusted on a yearly basis) receive the same
ranking on the total tax rate indicator. The threshold is
not based on any economic theory of an “optimal tax
rate” that minimizes distortions or maximizes efficiency
in the tax system of an economy overall. Instead, it is
mainly empirical in nature, set at the lower end of the
distribution of tax rates levied on medium-size
enterprises in the manufacturing sector as observed
through the paying taxes indicators. This reduces the
bias in the indicators toward economies that do not
need to levy significant taxes on companies like the
Doing Business standardized case study company
because they raise public revenue in other ways—for
example, through taxes on foreign companies, through
taxes on sectors other than manufacturing or from
natural resources (all of which are outside the scope of
the methodology). This year the threshold is 25,5%.
Data challenges and revisions
Most laws and regulations underlying the Doing
Business data are available on the Doing Business
website at http://www.doingbusiness.org. All the
sample questionnaires and the details underlying the
indicators are also published on the website. Questions
on the methodology and challenges to data can be
submitted through the website’s “Ask a Question”
function at http://www.doingbusiness.org.
Ease of doing business and distance to frontier
Doing Business 2014 presents results for 2 aggregate
measures: the aggregate ranking on the ease of doing
business and the distance to frontier measure. The
ease of doing business ranking compares economies
3 For getting electricity the rule that each procedure must take a
minimum of 1 day still applies because in practice there are no
cases in which procedures can be fully completed online in less than
a day. For example, even though in some cases it is possible to
apply for an electricity connection online, additional requirements
mean that the process cannot be completed in less than 1 day.
with one another, while the distance to frontier
measure benchmarks economies to the frontier in
regulatory practice, measuring the absolute distance to
the best performance on each indicator. Both
measures can be used for comparisons over time.
When compared across years, the distance to frontier
measure shows how much the regulatory environment
for local entrepreneurs in each economy has changed
over time in absolute terms, while the ease of doing
business ranking can show only relative change.
Ease of doing business
The ease of doing business index ranks economies
from 1 to 189. For each economy the ranking is
calculated as the simple average of the percentile
rankings on each of the 10 topics included in the index
in Doing Business 2014: starting a business, dealing
with construction permits, getting electricity,
registering property, getting credit, protecting
investors, paying taxes, trading across borders,
enforcing contracts, and resolving insolvency. The
employing workers indicators are not included in this
year’s aggregate ease of doing business ranking.
Construction of the ease of doing business index
Here is one example of how the ease of doing business
index is constructed. In Denmark it takes 4 procedures,
5.5 days and 0.2% of annual income per capita in fees
to open a business. The minimum capital requirement
is 24% of annual income per capita. On these 4
indicators Denmark ranks in the 12th, 11th, 1st and
79th percentiles. So on average Denmark ranks in the
25th percentile on the ease of starting a business. It
ranks in the 21st percentile on getting credit, 19th
percentile on paying taxes, 27th percentile on
enforcing contracts, 5th percentile on resolving
insolvency and so on. Higher rankings indicate simpler
regulation and stronger protection of property rights.
The simple average of Denmark’s percentile rankings
on all topics is 17th. When all economies are ordered
by their average percentile rankings, Denmark stands
at 5 in the aggregate ranking on the ease of doing
business.
More complex aggregation methods—such as
principal components and unobserved components—
yield a ranking nearly identical to the simple average

103 Zambia Doing Business 2014
used by Doing Business.4 Thus, Doing Business uses
the simplest method: weighting all topics equally and,
within each topic, giving equal weight to each of the
topic components.
If an economy has no laws or regulations covering a
specific area—for example, insolvency—it receives a
“no practice” mark. Similarly, an economy receives a
“no practice” or “not possible” mark if regulation exists
but is never used in practice or if a competing
regulation prohibits such practice. Either way, a “no
practice” mark puts the economy at the bottom of the
ranking on the relevant indicator.
The ease of doing business index is limited in scope. It
does not account for an economy’s proximity to large
markets, the quality of its infrastructure services (other
than services related to trading across borders and
getting electricity), the strength of its financial system,
the security of property from theft and looting,
macroeconomic conditions or the strength of
underlying institutions.
Variability of economies’ rankings across topics
Each indicator set measures a different aspect of the
business regulatory environment. The rankings of an
economy can vary, sometimes significantly, across
indicator sets. The average correlation coefficient
between the 10 indicator sets included in the
aggregate ranking is 0.38, and the coefficients
between any 2 sets of indicators range from 0.18
(between getting electricity and getting credit) to 0.58
(between trading across borders and resolving
insolvency and between trading across borders and
getting electricity). These correlations suggest that
economies rarely score universally well or universally
badly on the indicators.
Consider the example of Canada. It stands at 19 in the
aggregate ranking on the ease of doing business. Its
ranking is 2 on starting a business, 4 on protecting
investors, and 8 on paying taxes. But its ranking is only
4 See Simeon Djankov, Darshini Manraj, Caralee McLiesh and Rita
Ramalho, “Doing Business Indicators: Why Aggregate, and How to
Do It” (World Bank, Washington, DC, 2005). Principal components
and unobserved components methods yield a ranking nearly
identical to that from the simple average method because both
these methods assign roughly equal weights to the topics, since the
pairwise correlations among indicators do not differ much. An
alternative to the simple average method is to give different weights
to the topics, depending on which are considered of more or less
importance in the context of a specific economy.
58 on enforcing contracts, 116 on dealing with
construction permits and 145 on getting electricity.
Variation in performance across the indicator sets is
not at all unusual. It reflects differences in the degree
of priority that government authorities give to
particular areas of business regulation reform and the
ability of different government agencies to deliver
tangible results in their area of responsibility.
Distance to frontier measure
A drawback of the ease of doing business ranking is
that it can measure the regulatory performance of
economies only relative to the performance of others.
It does not provide information on how the absolute
quality of the regulatory environment is improving
over time. Nor does it provide information on how
large the gaps are between economies at a single
point in time.
The distance to frontier measure is designed to
address both shortcomings, complementing the ease
of doing business ranking. This measure illustrates the
distance of an economy to the “frontier,” and the
change in the measure over time shows the extent to
which the economy has closed this gap. The frontier is
a score derived from the most efficient practice or
highest score achieved on each of the component
indicators in 10 Doing Business indicator sets
(excluding the employing workers indicators) by any
economy. In starting a business, for example, Canada
and New Zealand have achieved the highest
performance on the number of procedures required (1)
and on the time (0.5 days), Denmark and Slovenia on
the cost (0% of income per capita) and Chile, Zambia
and 99 other economies on the paid-in minimum
capital requirement (0% of income per capita) (table
22.2).
Calculating the distance to frontier for each economy
involves 2 main steps. First, individual indicator scores
are normalized to a common unit: except for the total
tax rate, each of the 31 component indicators y is
rescaled to (max − y)/(max − min), with the minimum
value (min) representing the frontier—the highest
performance on that indicator across all economies
since 2003 or the first year the indicator was collected.5
For the total tax rate, consistent with the calculation of
5 Even though scores for the distance to frontier are calculated from
2005, data from as early as 2003 are used to define the frontier
104 Zambia Doing Business 2014
the rankings, the frontier is defined as the total tax rate
at the 15th percentile of the overall distribution of
total tax rates for all years. Second, for each economy
the scores obtained for individual indicators are
aggregated through simple averaging into one
distance to frontier score, first for each topic and then
across all topics. An economy’s distance to frontier is
indicated on a scale from 0 to 100, where 0 represents
the lowest performance and 100 the frontier.
The maximum (max) and minimum (min) observed
values are computed for all economies included in the
Doing Business sample since 2003 and for all years
(from 2003 to 2013). To mitigate the effects of extreme
outliers in the distributions of the rescaled data (very
few economies need 694 days to complete the
procedures to start a business, but many need 9 days),
the maximum (max) is defined as the 95th
percentile of
the pooled data for all economies and all years for
each indicator. The exceptions are the getting credit,
protecting investors and resolving insolvency
indicators, whose construction precludes outliers. In
addition, the cost to export and cost to import for each
year are divided by the GDP deflator, so as to take the
general price level into account when benchmarking
these absolute-cost indicators across economies with
different inflation trends. The base year for the deflator
is 2013 for all economies.
The difference between an economy’s distance to
frontier score in any previous year and its score in
2013 illustrates the extent to which the economy has
closed the gap to the frontier over time. And in any
given year the score measures how far an economy is
from the highest performance at that time.
Take Colombia, which has a score of 70.5 on the
distance to frontier measure for 2014. This score
indicates that the economy is 29.5 percentage points
away from the frontier constructed from the best
performances across all economies and all years.
Colombia was further from the frontier in 2009, with a
score of 66.2. The difference between the scores shows
an improvement over time.
The distance to frontier measure can also be used for
comparisons across economies in the same year,
complementing the ease of doing business ranking.
For example, Colombia stands at 63 this year in the
ease of doing business ranking, while Peru, which is
29.3 percentage points from the frontier, stands at 42.
Economies that improved the most across 3 or
more Doing Business topics in 2012/13
Doing Business 2014 uses a simple method to calculate
which economies improved the most in the ease of
doing business. First, it selects the economies that in
2012/13 implemented regulatory reforms making it
easier to do business in 3 or more of the 10 topics
included in this year’s ease of doing business ranking.6
Twenty-nine economies meet this criterion: Azerbaijan,
Belarus, Burundi, Côte d’Ivoire, Croatia, Djibouti,
Gabon, Guatemala, Guinea, Italy, Kosovo, Latvia, the
former Yugoslav Republic of Macedonia, Malaysia,
Mauritius, Mexico, Moldova, Mongolia, Morocco,
Panama, the Philippines, the Republic of Congo,
Romania, the Russian Federation, Rwanda, Sri Lanka,
Ukraine, Uzbekistan and the United Arab Emirates.
Second, Doing Business sorts these economies on the
increase in their distance to frontier measure from the
previous year using comparable data.
Selecting the economies that implemented regulatory
reforms in at least 3 topics and improved the most in
the distance to frontier measure is intended to
highlight economies with ongoing, broadbased reform
programs. The criterion for identifying the top
improvers was changed from last year. The
improvement in ease of doing business ranking is no
longer used. The improvement in the distance to
frontier measure is used instead because under this
measure economies are sorted according to their abs-
olute improvement instead of relative improvement.
6 Doing Business reforms making it more difficult to do business are
subtracted from the total number of those making it easier
to do business.

106 Zambia Doing Business 2014
RESOURCES ON THE DOING BUSINESS WEBSITE
Current features
News on the Doing Business project
http://www.doingbusiness.org
Rankings
How economies rank—from 1 to 189
http://www.doingbusiness.org/rankings/
Data
All the data for 189 economies—topic rankings,
indicator values, lists of regulatory procedures and
details underlying indicators
http://www.doingbusiness.org/data/
Reports
Access to Doing Business reports as well as
subnational and regional reports, reform case
studies and customized economy and regional
profiles
http://www.doingbusiness.org/reports/
Methodology
The methodologies and research papers
underlying Doing Business
http://www.doingbusiness.org/methodology/
Research
Abstracts of papers on Doing Business topics and
related policy issues
http://www.doingbusiness.org/research/
Doing Business reforms
Short summaries of DB2014 business regulation
reforms, lists of reforms since DB2008 and a
ranking simulation tool
http://www.doingbusiness.org/reforms/
Historical data
Customized data sets since DB2004
http://www.doingbusiness.org/custom-query/
Law library
Online collection of business laws and regulations
relating to business and gender issues
http://www.doingbusiness.org/law-library/
http://wbl.worldbank.org/
Contributors
More than 10,200 specialists in 189 economies
who participate in Doing Business
http://www.doingbusiness.org/contributors/doing-
business/
Entrepreneurship data
Data on business density for 139 economies
http://www.doingbusiness.org/data/exploretopics/e
ntrepreneurship
Doing Business iPhone App
Doing Business at a Glance App presents the full
report, rankings and highlights
http://www.doingbusiness.org/specialfeatures/
iphone

107 Zambia Doing Business 2014