youth labour market dynamics in south africa: evidence ... & ranchhod 2017... · youth labour...
TRANSCRIPT

REDI3x3 Working paper 39 July 2017
Youth labour market dynamics in South Africa: evidence from NIDS 1-2-3 Cecil Mlatsheni and Vimal Ranchhod
Abstract The South African youth unemployment rate is extremely high, at well over 50% of youth using the narrow definition of unemployment. This high unemployment rate has been a chronic problem and has been at these or similar levels since the democratic transition in 1994. Unemployment rates were probably also very high for a substantial period before 1994, but the lack of suitable data from that period makes precise measurement of the unemployment rates for that era quite impossible. We make use of the first three waves of the nationally representative longitudinal dataset obtained from the National Income Dynamics Study, to explore the factors that assist school leavers in finding employment. By means of descriptive statistics and regression analyses, we estimate the differences in job finding rates by gender, geographical location, educational attainment, household structure and migration status. Our results are not particularly surprising. Male youth, better educated youth, and youth who migrate from rural areas to urban areas tend to have better job prospects on leaving school. The Research Project on Employment, Income Distribution and Inclusive Growth is based at SALDRU at the University of Cape Town and supported by the National Treasury. Views expressed in REDI3x3 Working Papers are those of the authors and are not to be attributed to any of these institutions.
© REDI3x3 1 www.REDI3x3.org

Youth labour market dynamics in South Africa: evidence from NIDS 1-2-3
Cecil Mlatsheni and Vimal Ranchhod1
(School of Economics and SALDRU, University of Cape Town)
1. Introduction
The youth unemployment rate in South Africa is approximately double that of the general
adult unemployment rate and the general unemployment rate is also extremely high from a
global comparative perspective. Moreover, these unemployment levels have been a chronic
feature of the South African economy since the transition to democracy in 1994.
Unemployment rates were probably also very high for a substantial period before 1994, but
the lack of suitable data from that period makes precise measurement of the unemployment
rates for that era quite impossible.
In this paper, we make use of nationally representative longitudinal data from the first three
waves of the National Income Dynamics Study (NIDS), and focus on young people who were
still enrolled in school in the first wave. We are thus interested in their different trajectories
in terms of finding employment as they leave school. Finding a first job can be a particularly
challenging task for youth, due to a mixture of lack of experience and employer perceptions
of low quality schooling.
The major advantage of using longitudinal data relative to cross-sectional data is that we can
observe several background characteristics about the youth in our sample, and see how their
experiences in entering the labour market differ based on these characteristics. In contrast,
in a cross-section, we only observe the employment rates of youth, without knowing how
long it took them to find employment or what their original home environment might have
been like. We also obtain a sense of the security of employment for youth through an analysis
of labour market transitions between the three waves of NIDS. Finally, we estimate
multivariate regression models to determine the factors that correlate with an increase in the
likelihood of some individuals finding employment over others.
1 The authors acknowledge financial support from the Treasury funded REDI 3x3 project, as well as the Programme to Support Pro-Poor Policy Development II (PSPPD II), a partnership between the Presidency, Republic of South Africa and the European Union. The contents of this paper are the sole responsibility of the authors and can in no way be taken to reflect the views of the Presidency, Republic of South Africa and the European Union
© REDI3x3 2 www.REDI3x3.org

Our overall findings are not surprising. We find that better educated people are more likely
to be employed and to find jobs faster upon leaving school. Males have a distinct advantage
in finding employment relative to females. People from urban areas are also relatively
advantaged in terms of their labour market entry experiences, and of those who were
originally from rural areas, migrating to an urban area is one pathway that facilitates finding
employment.
The remainder of this paper is structured as follows. In Section 2, we provide an overview of
the evolution of youth employment and entry into the labour market, including a discussion
of some of the relevant literature. In Section 3, we provide some background and context by
briefly summarizing the labour market outcomes of youth based on nationally representative
cross-sectional data. Section 4 describes the dataset, sample selection and variables that we
use in our analysis. In Section 5, we document the empirical methods that we use, and in
Section 6 we present our results. Section 7 contains a concluding discussion; including some
insights that our research generated that may be of use for policy makers.
2. A brief overview of the evolution of the youth unemployment challenge in South Africa
The challenge of significantly high youth unemployment in South Africa is a by-product of the
longstanding feature of the significantly high level of unemployment in general. The earliest
post 1994 review of the South African labour market is the 1996 ILO country review by
Standing et al. (1996), who report that most analysts agree that unemployment rose sharply
in the 1970s and that this rise continued through the 1980s and 1990s. The Current
Population Survey (CPS) estimated that the strict unemployment rate in 1970 was 12% and
that in 1980 it was 20%. However, comparable figures for 1990 are not available as the CPS
was discontinued because its credibility had been brought into question. In 1991 estimates
using Population Census data reported unemployment of 19%. The Southern Africa Labour
and Development Research Unit survey of 1993, using the broad definition (widely regarded
as the more appropriate definition), placed unemployment at 30%.
Furthermore, many of the current troubling issues with regard to the nature of
unemployment were evident even prior to the mid-1990s. One example of such issues is the
labour absorptive capacity of the economy, which is the percentage of new labour market
entrants employed in any given year. The labour absorptive capacity of the South African
economy was above 90% in the 1960s, it fell to 15% in the 1970s and 1980s, it was negative
between 1991 and 1993, and it rose again to 7% in 1995 (Standing et al., 1996). Similar results
were reported by Loots (1996) and Ligthelm and Kritzinger-Van Niekerk (1990).
© REDI3x3 3 www.REDI3x3.org

Another longstanding undesirable issue is that of high unemployment duration. In the mid-
1990s findings were that nearly two thirds of the unemployed had never worked for pay
(Standing et al., 1996). This feature of the unemployed has persisted as recent datasets such
as the Quarterly Labour Force Surveys indicate significant numbers of unemployed individuals
who have either never been employed or have unemployment durations stretching into years
(Statistics South Africa 2015). In sum, chronic unemployment is not a recent feature of the
South African labour market. Instead, there has been a continuation of a negative trend of
the economy struggling to beat unemployment.
Research focusing on youth unemployment also has precedents. However, improvements in
the quality of available data (pioneered by the SALDRU 1993 household survey) changed the
landscape of research into youth labour market participants and indeed labour market
participants in general. Studies of youth unemployment prior to the mid- 1990s (see Everatt
& Sisulu, 1992; Truscott 1993; Van Zyl Slabbert, 1994 among others) have mainly focused on
two issues. Firstly, they have detailed the reasons why the circumstances of youth are bleak.
Account is given of the role that youth played in the fight against apartheid and how this led
to social disintegration. There is also discussion of the deficiency in the education of these
youths and its likely negative effect on their employment prospects. There is much debate in
this literature of whether the youth is a ‘lost generation’, whether it is in ‘crisis’, and its state
of being marginalised (Van Zyl Slabbert, 1994). Of course, some of the youth of the late 1980s
are now among the 40 plus year olds whose employability is often debated. Secondly, this
literature has also focused on finding solutions to the huge problem of youth joblessness.
There is discussion of training programmes and possible reasons for their failure (Truscott,
1993) as well as recommendations of public works programmes. The literature of the
subsequent period (see Bhorat & Oosthuizen, 2005; Mhone, 2000; Mlatsheni & Rospabe,
2001; Wittenberg & Pearce, 1996) has made good use of the household surveys and the
censuses to provide more detailed information about the characteristics of youth and the
nature of their labour market participation and outcomes.
A key challenge faced by youth is that of making a successful transition to adulthood. What
constitutes a successful transition is likely to vary from individual to individual and factors
such as socio-economic background and cultural norms are likely to play a role. In general, a
key objective is to achieve independence and for many to ultimately form a family and to
support that family. It is generally accepted that the amount of human capital acquired has a
strong influence on meeting these objectives. A greater degree and quality of education both
aid a smooth transition from schooling to work. However, the reality is that youth often
experience difficulty entering the labour market for various reasons and these will be
© REDI3x3 4 www.REDI3x3.org
discussed in more detail below, with reference to South Africa. For example, job search and
its success depends on the availability of jobs, the kind of jobs that are available and also the
proximity of these jobs. These factors intersect with the level and quality of education of these
young work seekers. Physical and mental health is also a concern. Single parenthood and poor
physical health can inhibit labour market participation. These factors along with the stress of
not finding employment may give rise to de-motivation and depression which, in turn, further
hamper effective labour market participation. Given that this is the situation confronting
youth as they consider entering the labour market, it can also be a useful angle from which
to assess policy initiatives directed at facilitating youth labour market entry2.
2.1 Demand side factors that influence labour market success
A major influence on youth employment is the extent of job availability while another related
influence is the nature of that employment. Economic conditions and the structure of the
labour market have an important bearing on the probability of securing employment. Chief
among the macroeconomic determinants of youth unemployment is aggregate demand
(O’Higgins, 1994). When an economy is in a slump or is not growing at a fast enough pace,
employment creation tends to be dampened. Under such circumstances, any attempts to
increase the extent of youth labour market preparedness and employability would fail to
significantly increase overall youth employment in the short term.
The 2000s are evidence of the importance of aggregate demand within the South African
context. The early to middle 2000s was a time when the South African economy was growing
relatively well in comparison with other available periods. The growth rate of GDP was on an
upward trajectory in the early to mid-2000s, peaking above 5% per annum. A number of
economic shocks rocked the global economy subsequently such that the South African
economy was also adversely affected. The economy was already beginning to slow down at
the time of the 2008-09 recession and it subsequently went into recession. The negative
effects of the global economic shocks were dampened by prudent macroeconomic policies.
Nevertheless, South Africa lost close to 1 million jobs during the 2008-09 recession (IMF,
2011). In addition to this, by 2011 the ratio of employment to the working-age population
had declined from around 45% in 2008 to 40% in 2011, implying that employment had
remained below the pre-crisis level. The labour market has therefore remained in a relatively
depressed state.
2 These issues are beyond the scope of this paper but are nevertheless important to consider for future research.
© REDI3x3 5 www.REDI3x3.org

The effects of the 2008-09 global recession served to reverse any employment gains that had
been made in the earlier period of peak economic growth. It is only in 2013 that employment
levels returned, for the first time, to the levels of 2008. The lack of sustained economic growth
has led to the overall unemployment rate consistently hovering around 25%.
One could argue that inadequate aggregate demand is as much an obstacle to non-youth
employment as it is to youth employment because a fall in aggregate demand would lead to
a general increase in the number of lay-offs and a fall in new hires. However, to the extent
that the nature of the employer-employee relationship is different for youth and non-youth,
the influence of aggregate demand on employment would be different for youth and adults.
The opportunity cost to employers of firing youth is lower than that of firing adults partly
because youth are less likely to be unionised or protected by legislation (Rees 1986) and past
investment in them by the employer is likely to have been lower.
2.2 Supply side factors that influence labour market success
Education
Global evidence confirms that generally the higher the level of educational attainment of
youth, the higher the probability of them finding employment (World Development Report,
2007). In the case of South Africa, the strongest effects are observed post matric though
(Altbeker & Johnston 2013, Bhorat et al. 2014, Leibbrandt & Mlatsheni 2015). However, as
will be shown in our analysis, even youth who have only completed secondary schooling do
not necessarily fare well in the labour market. This should send a signal to youth that they
should aim to acquire as much education as possible in order to improve their chances of
employment. Furthermore, education plays an important role not just in finding employment
but also in the ability to create employment. The 2006 Global Entrepreneurship Monitor
reported that their sample reflected that in South Africa the potential of tertiary educated
adults to create employment was 2.5 times greater than those who only completed secondary
education, and 11 times greater than those who have not completed secondary education.
At the same time, many youth quit their studies and enter the labour market prematurely for
various reasons. This premature labour market entry is a cause for concern especially given
that even youth with post-matric tertiary qualifications are not guaranteed employment.
These findings suggest that there is a problem with youth’s work-readiness upon entering the
labour market and that close attention needs to be paid to education and training policies in
order to address this problem. The rate of completion of secondary schooling is a cause for
concern, so are the grades achieved in matric and also the limited success achieved by training
initiatives. (For more detail see Bernstein et al. 2016).
© REDI3x3 6 www.REDI3x3.org

A young person from a background of relative deprivation in South Africa, faced with a
decision of either continuing studies or dropping out, would be influenced by a number of
factors in making his or her decision. According to the literature, three theories are thought
to play a part in such decision-making. The first is the status attainment theory, which posits
that the amount of education a young individual aspires towards is a function of status-
specific values as well as the influence of significant others in the individual’s life (Sewell et
al., 1970; Spaeth, 1968). The second theory is known as the resource constraint theory and it
suggests that educational aspirations depend on perceptions of opportunity structures,
evaluated according to relative direct costs (Kerckhoff, 1974). Human capital theory as
espoused by Becker (1964) and Mincer (1974) is a third theory explaining the choice between
continuing studies and opting for work. The premise of this theory is that educational
attainment is the result of individual choice, which is informed by perceptions of the future
wage returns on investment in education. While the human capital theory has its origins in
economics, the other theories emanate from sociology.
In the South African context, many youth see the value of education but are faced with limited
resources to pursue post-secondary schooling qualifications. Even those individuals who
could find means to finance further education may opt for earlier labour market entry and
thus a low pay, mediocre job in order to supplement family income, especially when there
are younger siblings in need of support.
This premature labour market entry is a serious labour market challenge for youth in many
developing countries (ILO, 2006). Working while at school can be beneficial when done in
moderation and is to be distinguished from premature labour market entry, which is quitting
school in order to look for work. Working while at school can foster such positive traits as
dependability, self-confidence, punctuality, an increased understanding of consumer and
money matters, and generally ease the transition from school to work (Meyer & Wise, 1982).
It may also help finance secondary and tertiary education. However, the danger with working
while at school is that if it is not carefully managed it can lead to premature dropping out of
studies. In the South African context, premature exit out of schooling does not happen on a
large scale, however, failure to satisfactorily complete secondary schooling and to advance to
further studies does. This failure affects later productivity while the forgone earnings and lack
of skill accumulation may make it difficult to escape poverty. The benefits of schooling are
recognised worldwide, as international evidence suggests that across 61 developing countries
the average return per year of schooling is 7.3% for men and 9.8% for women (World
Development Report, 2007).
© REDI3x3 7 www.REDI3x3.org

The discussion above highlights the importance of skills acquisition to favourable employment
outcomes for youth. Failure to acquire appropriate human capital can jeopardise the
probability of finding decent and stable employment and can result in lengthy bouts of
unemployment. Evidence from 60 developing countries suggests that youth spend on average
1.4 years in temporary jobs and intermittent spells of unemployment before finding stable
employment, but there are wide variations across countries ranging up to four years (World
Development Report, 2007).
The high unemployment duration as in the case of South Africa often leads to discouragement
of youth such that a portion of them are neither in school nor work, the NEETs. In more
developed countries such as the US and Canada, youth in times of increased joblessness
increase uptake of training, they stay longer in school and they extend the period living with
parents. These options are not always available in the developing country context such as that
of South Africa. The lack of viable options often encourages criminal activity even in
developed countries. In France, crime rates increase and in the US the probability of
incarceration increases as joblessness increases (Topel & Ward, 1992).
Job search: networks, geographical isolation and perceptions of opportunity
In the absence of a formalised system of facilitating the transition from schooling to work, the
issue of employment search becomes very important. In the developed world context of
relatively low rates of joblessness, a lack of active job search is almost exclusively viewed as
being voluntary and underpinned by reservation wage considerations. In the South African
context of mass unemployment, inactive job search may be due to financial constraints that
are brought about by high costs of active job search accompanied by a low probability of
finding employment. These considerations bring to the fore the issue of the availability and
use of networks in finding employment. Youth who work while at school are likely to have a
better-developed system of networks when they enter the labour market fully.
Findings are that networks are the most popular and effective ways of obtaining jobs,
however, the networks possessed by Black youth are likely to be less productive in securing
employment. Indeed, there is some international evidence that Blacks achieve greater
success with formal methods than with informal ones because informal methods involve
fewer explicit or objective criteria of judgement (Rees, 1986). In this instance, informal job
search methods are those that involve friends and relatives and direct applications to firms
through walk-ins without referral. Methods that are more formal include employment
agencies, responding to newspaper advertisements, and government employment facilitating
© REDI3x3 8 www.REDI3x3.org

initiatives. Given that entrepreneurship is not the first choice of most youth (they would
rather find a job and be guaranteed wages), policy should also focus on facilitating job search.
For this to take place effectively there needs to be an understanding of youth job search
strategies and experiences as spelt out below.
Networks and social capital
The importance of networks in securing employment cannot be overemphasised. Evidence
from a range of surveys conducted in the early 2000s indicates that most people get jobs
through friends and relatives. The Khayelitsha/Mitchell’s Plain Survey (KMPS) conducted in
Cape Town in 2000, for example, reveals that more than half of the respondents obtained
their current job through friends and relatives. The Cape Area Panel Survey also indicates that
by far the most common method of obtaining employment for youth is through networks in
the form of friends and relatives. Interestingly, these datasets reflect that even though most
young individuals obtain employment through networks, relatively few claim to use this as
the main method when searching for work.
Geographical isolation from employment
Another reason that many youth do not actively search for work is the inability to access areas
that could potentially provide employment. This factor predominantly affects Black youth, as
townships are often situated far from business centres. The formal exposition of the effects
of distance on labour market outcomes was first given by Kain (1968) as the “spatial mismatch
hypothesis”. In the US context, the location of jobs was becoming increasingly decentralised
and poor minority households (mainly Black) were being left behind in central cities through
constraints in housing choices. These developments decreased the employment prospects of
the individuals concerned through decreased job access and subsequent earnings.
The South African situation is similar in that individuals from poor households (mainly Black)
are far from where jobs are located. However, the difference in South Africa is that it is the
jobs that have historically been concentrated in the cities while location of poor households
has been on the outskirts. A single trip from a township to seek work in a city or industrial
centre would easily cost R10–R20, a great deal to an unemployed person. Indeed, data from
the March 2005 Labour Force Survey (LFS) in Table 4 reveals that of those individuals (aged
between 16 and 30 years) who did not seek employment or start their own business, 49% said
it was because there were no jobs in their area, while 23% said that they lacked the money
necessary to look for work. Taken together, over 70% of non-searchers indicated that their
© REDI3x3 9 www.REDI3x3.org

location constrained them from looking for work, as lack of money to search is brought about
by lack of proximity to employment sources.
The 'spatial mismatch hypothesis’ has continued to receive attention within the international
literature (Kain, 1992; Holzer, 1991). In the South African context part of the solution would
be to move jobs closer to labour sources, a feature that is already taking place in certain
areas3. In the US context, it would be difficult to move poor minority households from the
central cities towards the decentralised jobs and it would thus be a useful exercise to see how
the US has approached this problem.
Perceptions of opportunity
It is logical that youth perceptions of the labour market have a strong effect on the effort they
invest to find employment. International evidence reflects that such perceptions are formed
in part by the characteristics of the neighbourhoods in which the youth reside (Case & Katz,
1991). In a study of poor neighbourhoods in Boston, Case and Katz (1991) find that
neighbourhood peers significantly influence youth behaviour, including the propensity to
work. Furthermore, a neighbourhood can negatively influence labour market outcomes
through absence of positive role models, lack of informal job contacts and the presence of
disruptive forces. There exists evidence of negative effects of perceptions on job search in the
South African literature as well (Wittenberg, 2002). Wittenberg (2002), using a number of
household data sets, finds that the proportion of unemployed engaged in active search hardly
ever reaches 50%, a factor which suggests that very often discouragement is based on
perceptions of opportunity rather than personal experience. In addition, the depression that
often accompanies failure to find employment would manifest as a type of paralysis that
prevents any structured active job search. It follows from the abovementioned literature that
where perceptions of the labour market are overly pessimistic, the inadequate search
attempt that results then feeds back and contributes to further entrenching youth
unemployment.
Judging by the results of the Cape Area Panel Survey (CAPS) conducted in 2002, youth
perceptions of the labour market are rather gloomy. Of the 1282 respondents between the
ages of 16 and 22 who were unemployed and had indicated that they wanted work, 61% had
never looked for work. When involvement in studies is controlled for, the figure is still
3 For example, the location of malls within townships or in close proximity to them has become increasingly commonplace.
© REDI3x3 10 www.REDI3x3.org

significantly high at 41% of unemployed non-studying youth having never searched for work.
Comparison with the LFS is not possible, as this question was not asked.
When asked what they thought the chances were that they would be working within a few
months, 75% said 50-50 or less. When asked the same question with a reference period of
three years, 40% still said 50-50 or less. Clearly, youth perceptions of the labour market are
poor, though to a considerable extent realistically so.
This discouragement is a serious concern, as duration of unemployment has negative
consequences on the self-esteem of jobseekers as well as on the likelihood of an employer
hiring them. The negative consequences of long-term unemployment are well-documented
outside of South Africa (Winefield et al., 1993). Depression can result from direct negative
labour market experience. Hammarstrom and Janlert (1997) found that amongst Swedish
youth, unemployment correlated positively with changes in nervous complaints and
depressive symptoms, even after controlling for initial psychological health and background
factors. In a study of Australian youth Morrell et al (1998) found youth unemployment and
youth suicide to be strongly associated and so too youth unemployment and psychological
symptoms such as depression and loss of confidence.4
These findings are echoed by Dooley et al. (2000) who found that amongst American youth,
changes from what the respondents regard as adequate employment to what they regard as
inadequate employment as well as from employment to unemployment, resulted in
significant increases in depression. With the high duration of unemployment experienced in
the South African labour market, it is probable that the accompanying link with depression
cited in the above studies is present. This could lead to negative spill-over effects for society
in general. Youth in this situation tend to feel a lack of self-esteem coupled with the need to
feel a sense of control, competence and belonging, which in turn may encourage criminal
activity and gang association. Indeed the presence of gangs within the relatively poverty-
stricken areas of Cape Town is rife (Pinnock 2016). The way to break this vicious cycle is argued
to be through the engaging of idle youth in activities such as training, community projects and
peace education (World Development Report, 2007).
Furthermore, the duration of unemployment has an effect on the perceived productivity of
an individual by prospective employers. Thus, individuals who have been unemployed for
4 The depression scale available in the data set used in this paper requires a judgement call of what an appropriate cut-off would be for respondents of a certain population group or age and this analysis is beyond the scope of this paper.
© REDI3x3 11 www.REDI3x3.org

much of their youth may also remain unemployed for much of their non-youth life. It is
imperative therefore that the connection between youth (especially non-studying) and the
labour market be maintained so that discouragement is kept low or at least its effects are
mitigated.
The introductory discussion above has highlighted a number of key barriers in the functioning
of labour markets with regard to the youth. Furthermore, the importance of education to
labour market outcomes was discussed. Premature labour market entry, in combination with
the corresponding lack of educational attainment, was raised as a factor that negatively
impacts success in the labour market. Of concern are the particularly vulnerable youth who
are neither employed, studying or in any training initiatives, the NEETs.
The discussion above also raised obstacles in job search as contributing factors to youth
joblessness. In particular, geographical isolation from potential employers increases the
monetary cost of search and, with the passing of time, increases the likelihood of
discouragement. Costs of searching actively also increase the likelihood of searching passively
through family and friends. The success of these passive search strategies depends on the
labour-market-related usefulness of the networks of family and friends in use as a factor
contributing to unemployment.
Also discussed above was the role that perceptions of the labour market play in job search
intensity. To the extent that youth perceptions of the labour market are overly pessimistic,
search intensity will be depressed. Furthermore, the negative effects of lengthy duration of
unemployment include labour market discouragement and possible psychological
depression.
It is key to bring to the fore the realities of youth and the labour market from their perspective
as a way of enhancing the impact of the statistical analysis that follows. In this vein, the above
discussion has pointed out that youth firstly have to survive the challenges that entry into the
labour market can pose.
3. Summarizing the labour market outcomes of youth using cross-sectional data
In this section, we present the differences in labour market outcomes that youth of different
ages experience. This gives us some context relative to which we can interpret our main
findings. The data comes from twelve waves of StatsSA’s Quarterly Labour Force Survey
(QLFS), and we combined the data from QLFS2011:1 up to and including QLFS2013:4. We
made use of StatsSA’s officially derived labour market state variable, and the proportions are
© REDI3x3 12 www.REDI3x3.org

obtained after applying the relevant survey weights. The mean percentage in each labour
market state is presented graphically in Figure 1, for each age value. Amongst teenagers, the
levels of labour force participation are very low, as evidenced by the light grey category of
“Not Economically Active”. The size of this group decreases rapidly with age: by age 21 about
half of the youth are in the labour force, and this rises further to almost 80% by age 26.
The percentage employed, however, does not rise as rapidly as the entry into the labour force,
as evidenced by the dark grey category in the bar chart. At ages 21, 25 and 29, the mean
percentages employed are approximately 17%, 40% and 51% respectively. This difference
between the rate of entry into the labour market and the rate at which youth find jobs results
in a rapid increase in unemployment in the early and mid-twenties, as shown by the middle
two groups in each bar. Graphically, this reflects the essential problem that led to the
introduction of the ETI; namely that youth in South Africa experience exceptional difficulty in
finding their first jobs.
In their late twenties, the rate of labour force entry amongst youth stabilizes at just over 80%,
while the rate at which youth find employment continues to increase, albeit rather slowly.
Thus, by age 29, 62% of youth who are in the labour market are employed, which is the highest
employment rate for any age in the youth group, although the corresponding unemployment
rate is still exceptionally high at 38%.
These summary statistics provides an empirical motivation for our study, which is to identify
the factors that correlate with a more successful entry into the labour market.
0%10%20%30%40%50%60%70%80%90%
100%
18 19 20 21 22 23 24 25 26 27 28 29Age
Figure 1. Distribution of labour market states by age
NEA
Discouraged
Unemployed
Employed
© REDI3x3 13 www.REDI3x3.org
4. Data
Data source
The data that we use comes from the first three waves of the longitudinal and nationally
representative National Income Dynamics Study. The first wave was conducted in 2008, the
second in 2010/2011 and the third in 2012. The initial sample included just over 28 000
members of the panel, including children, who resided in about 7300 households. The NIDS
data includes several modules, including a household roster, and questions on fertility,
migration, deaths, education and labour market outcomes.
Sample selection
The purpose of our analysis is to identify the factors that correlate with a more successful
transition out of school and into the labour market, so we restrict our sample in two ways.
First, we focus only on youth aged 16 to 20 in wave 1 who were enrolled in some type of
educational institution. Second, we restrict the sample further to the subset of these youth
who we observe in the dataset in both wave 2 as well as in wave 3. The final sample that we
use in our analysis is thus 1030 youth aged 16 to 20. In Table 1 below, we show how the
sample gets reduced as we impose the two criteria. To begin with, we have a total of 3056
youth in Wave 1 in the age group from 16 to 20. This decreases to 1836 when we only include
those who were also enrolled for some form of studies, or a reduction of about 40%. This
reduction is unsurprisingly more pronounced for the older youth in the age range than the
younger ones.
When we further impose that the youth must form part of the balanced panel, i.e. that they
must be observed in all three waves, the sample reduces further to 1030 observations, or an
additional reduction of about 45%. This is a substantial attrition rate, and brings into question
the external validity of our findings. Beyond the implications that this attrition has in terms of
diminished statistical power, the problem might not be too serious, as we make use of the
attrition adjusted weights provided which, under certain conditions, would cancel out any
bias generated due to selective attrition.
© REDI3x3 14 www.REDI3x3.org

Table 1: Sample sizes and attrition Number of observations
Age in Wave 1 Wave 1 Enrolled in W1 Enrolled in W1 and
observed in all waves 16 665 538 306 17 635 455 259 18 594 376 210 19 623 286 165 20 539 181 90
Total 3,056 1,836 1,030
Variables
The primary variable of interest that we construct is a state variable. This variable classifies
each individual into one of four mutually exclusive and exhaustive states in each wave; namely
employed, enrolled, both enrolled and employed, or neither enrolled nor employed. The last
state is equivalent to the “Not in Education, Employment, or Training” (NEET) category often
seen in the literature. In our sample of 1030 individuals that were enrolled in some form of
education in wave 1, 4.15% were also employed.
We also make use of a number of additional characteristics in our analysis. The characteristics
pertain to gender, age, original household structure, geography, migration and
education.5The specific variables that we use are:
• male – This takes on a value of 1 if the respondent is male and 0 if she is female.
• Age_w1 – This captures the age of the individual in wave 1.
• Hhsize_w1 – This is a count variable which captures the total number of people living
in the young person’s household in wave 1.
• Moth_present_w1 – This is an indicator variable for whether the respondent lived with
his/her mother when interviewed in wave 1.
• Fath_present_w1 – This is an indicator variable for whether the respondent lived with
his/her father when interviewed in wave 1.
• Urban_w1, urban_w2, urban_w3 – Captures whether the household was located in an
urban or non-urban location. Non-urban areas include farming/rural areas as well as
traditional areas.
5 Parenthood amongst the youth has not been included due to the endogeneity of the decision to have children. For example, some youth who find a job may be less willing to have children.
© REDI3x3 15 www.REDI3x3.org

• Rural_Migrant_w2, rural_migrant_w3, urban_migrant_w2, urban_migrant_w3 –
These are indicator variables that reflect whether the location (i.e. urban/non-urban)
in wave 1 has changed in wave 2 or wave 3 respectively. For example,
rural_migrant_w2 takes on a value of 1 if the respondent lived in a rural area in wave
1 and in an urban area in wave 2.
• Hist_disadvantaged_school_w1 – This variable acts as a proxy for the type of school
the respondent was attending in wave 1. It takes on a value of 1 if the school was
previously administered by the Dept. of Education and Training, an Independent
Homeland or a Self-governing Territory.
• Educ_w1, Educ_w2, Educ_w3 – These capture the respondents’ levels of education in
each wave. We collapse the education variables contained in the survey and simplify
it to reflect one of three categories of educational attainment; namely ‘less than
matric’, ’matric’ and ‘some tertiary education’. Note that the last category does not
necessarily mean that the student has successfully attained a tertiary qualification.
In Table 2 below, we summarize these variables by providing the mean in the relevant wave.
For the time invariant variables, or variables where we only use the wave 1 information, we
only provide the mean in wave 1. In our sample, 96% of those who were enrolled were not
employed in wave 1. There is thus a small fraction of respondents who are both studying and
working simultaneously.
By wave 2, approximately two years later, only slightly greater than half are still enrolled. This
is not surprising as we selected the sample to capture those youth who are very close to the
age of either completing secondary school or at high risk of dropping out. Unfortunately, only
9.3% of our sample have left school and are employed, while 38% are NEET. By wave 3, a full
50% of our original sample is in the NEET category. Although the percent in employment has
increased substantially by 11.2 percentage points, this is smaller than the percent of people
who leave their studies between waves 2 and 3, which decreased by 24 percentage points.
Once again we see the clear challenge in the youth school-to-work transition rates, which is
that a substantial fraction of youth leave their studies and then struggle to find employment.
© REDI3x3 16 www.REDI3x3.org
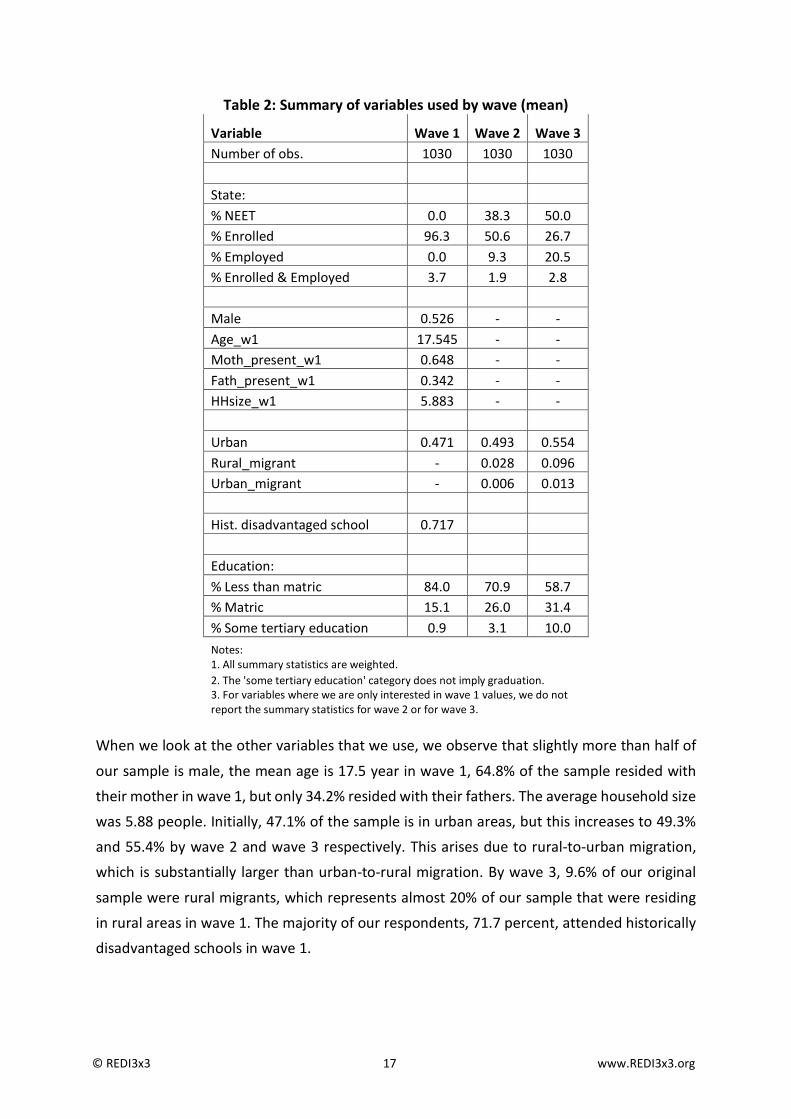
Table 2: Summary of variables used by wave (mean)
Variable Wave 1 Wave 2 Wave 3 Number of obs. 1030 1030 1030 State: % NEET 0.0 38.3 50.0 % Enrolled 96.3 50.6 26.7 % Employed 0.0 9.3 20.5 % Enrolled & Employed 3.7 1.9 2.8 Male 0.526 - - Age_w1 17.545 - - Moth_present_w1 0.648 - - Fath_present_w1 0.342 - - HHsize_w1 5.883 - - Urban 0.471 0.493 0.554 Rural_migrant - 0.028 0.096 Urban_migrant - 0.006 0.013 Hist. disadvantaged school 0.717 Education: % Less than matric 84.0 70.9 58.7 % Matric 15.1 26.0 31.4 % Some tertiary education 0.9 3.1 10.0 Notes: 1. All summary statistics are weighted. 2. The 'some tertiary education' category does not imply graduation. 3. For variables where we are only interested in wave 1 values, we do not report the summary statistics for wave 2 or for wave 3.
When we look at the other variables that we use, we observe that slightly more than half of
our sample is male, the mean age is 17.5 year in wave 1, 64.8% of the sample resided with
their mother in wave 1, but only 34.2% resided with their fathers. The average household size
was 5.88 people. Initially, 47.1% of the sample is in urban areas, but this increases to 49.3%
and 55.4% by wave 2 and wave 3 respectively. This arises due to rural-to-urban migration,
which is substantially larger than urban-to-rural migration. By wave 3, 9.6% of our original
sample were rural migrants, which represents almost 20% of our sample that were residing
in rural areas in wave 1. The majority of our respondents, 71.7 percent, attended historically
disadvantaged schools in wave 1.
© REDI3x3 17 www.REDI3x3.org

We can also observe how our sample becomes more educated over time. The fraction with
less than a matric drops from 84% in wave 1, to 70.9% in wave 2 and then drops further to
58.7% in wave 3. In contrast, the fraction with a matric increases steadily across the three
waves, from 15.1% in wave 1 to 26% in wave 2 and then again to 31.4% in wave 3. The fraction
with some tertiary experience also increases, but from a very small base, and it only becomes
substantial by wave 3 where 10% of the sample have had some post-secondary training.
5. Methods
Our methods consist of two sets of analyses. The first is to investigate the mean rates at which
people transition across different states, and how the distribution of states in wave 2 and
wave 3 differ along the dimensions of gender, household structure, geography and
educational attainment.6
The second set of analyses involves a series of OLS regression models. In the first two
regressions, our dependent variable is an indicator variable called enrolled in wave 2 and wave
3 respectively. Not being enrolled means that the respondent is either employed or NEET,
and we interpret this as a proxy for labour force participation. In the third and fourth
regression models, our dependent variable is an indicator variable for employed in wave 2
and wave 3 respectively. This is the major focus of the paper, and will allow us to consider the
factors correlated with finding employment simultaneously within a multivariate analytical
framework.
6. Results
6.1 Transition matrices
We start by presenting the transition matrices between wave 2 and wave 3 in Table 3 below.
Since our sample was selected to include only people aged 16 to 20 who were enrolled in
wave 1, of whom 3.7% were both employed and enrolled, the wave 2 distribution of states
gives a clear sense of the wave 1 to wave 2 transition.
As already discussed, by wave 2, only 50.6% of these youth were enrolled, while just below
40% were NEET and less than 10% were employed. A further 1.9% were both employed and
enrolled. The transition matrix contains the wave 2 category and the distribution of these
respondents’ state in wave 3. Thus, for example, 60.8% of the NEETs in wave 2 were still NEET
6 Note that we exclude household size from this analysis as the range of this variable in wave 1 went from 1 to 25. An alternative would be to group the variable in categories. We performed this analysis but chose to omit it as the results were not particularly revealing or informative.
© REDI3x3 18 www.REDI3x3.org

in wave 3, while 16.9% had subsequently re-enrolled to study. Similarly, 44% of those enrolled
in wave 2 had transitioned into NEET, while 37.6% were still enrolled.
Our results indicate that the NEET category is quite a stable one over the two years between
wave 2 and wave 3. Three out of five respondents who were in this category are still in this
category two years later, while just over one in five have found employment. About one in six
of these respondents have re-enrolled in their studies. Of those enrolled in wave 2, the largest
category in wave 3 is again NEET, at 44%. A further 37% are still enrolled, while fewer than
one in five has transitioned into employment only, or employment and enrolment combined.
Of the small number of respondents who were employed by wave 2, approximately half are
also employed in wave 3, but approximately two out of every five are no longer employed
and are in the NEET category.
Table 3: Transition rates between wave 2 and wave 3 State_w3 State_w2 Wave 2 % NEET Enrolled Employed Both Total NEET 38.3 60.79 16.91 22.18 0.12 100 Enrolled 50.6 44 37.57 14.02 4.41 100 Employed 9.3 41.54 8.08 49.24 1.13 100 Both 1.9 31.36 14.01 30.33 24.3 100
Our results indicate a lot of churning from all categories for this sample. None of the diagonal
elements are above 66%, or two out of three, and the largest off diagonal category is the NEET
category. Given all that we know based on the existing literature, this is unfortunate but as
expected. The one new insight that we obtain from this transition matrix is that the youth
employment problem is not only about finding a first job, but also about the stability of
employment amongst youth. Of the minority who do find employment by wave 2, only about
half are still in employment in wave 3, and the majority of those who are no longer employed
are NEET.
6.2 Distribution of States by covariates
In Table 4, we document the distribution of the State variable by wave 2 and wave 3, for
different covariates. Starting with the different ages, we see that the older youth are more
likely to transition into NEET or employment, and this is consistently seen over time as the
cohort ages as well. This is offset by a corresponding decrease in enrolments as time passes
by.
© REDI3x3 19 www.REDI3x3.org

The gender differences are striking. Young women are slightly more likely to remain enrolled,
but the biggest differences are manifest in the rate at which the males and females transition
in to NEET or into employment. By wave 3, 57.5% of women are NEET, as compared to 43.2%
of men. Both groups of youth have a very high probability of being NEET, but the difference
between the genders is also very large, at 14.3 percentage points. In contrast, by wave 3,
14.1% of women are employed, or employed and enrolled, while the corresponding number
for men is 31.7%. Thus, approximately one in three males has found employment by wave 3,
but only about one in seven females have found employment.
Table 4: Distribution of States in wave 2 and wave 3 by covariates Variable State 2 State 3 NEET enrolled employed both NEET enrolled employed both Age_w1 = 16 27.05 65.28 6.15 1.53 44.36 38.09 13.84 3.71 Age_w1 = 17 40.95 53.87 3.85 1.33 47.78 32.7 19.19 0.33 Age_w1 = 18 42.21 48.4 7.82 1.57 59.61 16.62 19.59 4.18 Age_w1 = 19 47.51 36.3 13.38 2.81 47.41 17.87 32.53 2.19 Age_w1 = 20 42.54 27.19 26.68 3.59 54.31 15.85 26.45 3.38 Male 40.73 51.28 7.02 0.97 57.48 28.4 10.81 3.31 Female 36.01 49.92 11.31 2.76 43.17 25.14 29.34 2.35 Neither parent (w1) 43.57 43.17 10.2 3.06 51.16 25.72 22.08 1.04 Mother only (w1) 41.87 48.14 8.79 1.2 53.76 25.56 16.88 3.8 Father only (w1) 38.87 53.75 3.22 4.16 25.38 31.34 43.28 0 Both parents (w1) 28.71 60.5 9.54 1.25 47.37 28.4 20.38 3.85 Hist. disadv. school 39.05 48.93 10.53 1.49 51.26 28.67 19.39 0.68 Not hist. disadv school 36.28 54.65 6.11 2.96 46.68 21.69 23.45 8.18 <matric 33.91 58.01 6.57 1.51 51.38 29.84 18.42 0.36 matric 51.57 29.85 17.14 1.45 51.84 19.42 22.83 5.91 matric plus 26.37 54.22 4.63 14.78 36.02 30.49 26.05 7.45 Notes: 1. All proportions are weighted. 2. Only 31 out of the 1030 youth in our sample lived with their fathers but not their mothers in wave 1. 3. The education variables is time varying. We used the wave 2 data for the State 2 means, and the wave 3 data for the State 3 means. Our groups are thus not stable over time.
When we consider whether the respondent was living with either or both of their parents in
wave 1, we see that living with both parents is correlated with remaining enrolled for longer,
and with a lower probability of being NEET in wave 2.7 The interpretation is slightly
7 We do not comment on the group living with only their fathers in wave 1, as this is an extreme minority. Most youth who live with their fathers are living with both parents.
© REDI3x3 20 www.REDI3x3.org
complicated as people might leave home for employment or study purposes, so we cannot
say much about whether a person is not living with their parents because they found
employment, and whether living with one’s parents helps one to find a job. Indeed, by wave
3 it is difficult to observe any clear patterns in the data with regard to co-residency with one’s
parents in wave 1.
In terms of whether a youth attended a historically disadvantaged school or not, we see an
interesting non-linear pattern. By wave 2, the youth from the disadvantaged schools were
about 5.7 percentage points less likely to be enrolled, and some of this is accounted for by
increased employment rates. The youth from disadvantaged schools are about 3 percentage
points more likely to be employed, if we consider those only employed combined with those
both employed and enrolled. Thus, students from disadvantaged schools leave school and
enter the labour market and employment faster than their peers from relatively better
schools. Between wave 2 and wave 3, however, one begins to see a clearer divergence in
outcomes based on school background. The students from the historically disadvantaged
schools are more likely to be NEET (by 4.6 percentage points) and more likely to be enrolled
(by 7 percentage points). Their peers from the relatively advantaged schools are about 11.5
percentage points more likely to be employed, and about 7.5 percentage points of this is
accounted for by being both enrolled and employed simultaneously. This indicates that one’s
school environment and background matters in terms of one’s likely experiences upon leaving
school.
The educational attainment variable does have quite a clear pattern with regard to how the
state distribution evolves across waves. Those who do not yet have a matric, and those who
have some tertiary experience, are substantially more likely to be enrolled in wave 2. This
alludes to the fact that matric is a stopping point for many youths’ educational attainment.
The fraction of NEETs is substantial for each group, but clearly it is the largest amongst those
with just a matric. Employment rates are also low for everyone, but smallest for those who
do not yet have a matric. Of those who have a matric or some tertiary experience, the
employment rate is about 18% for either category, but the majority of employment amongst
those who have some tertiary experience is due to working and studying simultaneously.
By wave 3, many of those who have not yet completed a matric have dropped out of school,
and are mostly in the NEET category. The fraction of NEETs is approximately the same within
the less than matric and matric only category. Enrolment rates have decreased amongst all
groups, while employment rates have increased substantially, although the employment
rates are still fairly low. The total employment rates are approximately 18.8%, 28.7% and
© REDI3x3 21 www.REDI3x3.org

33.5% amongst those with less than matric, matric only and some tertiary experiences
respectively. Thus, within a short amount of time we see the well documented correlation
between educational attainment and employment outcomes start to emerge.
6.3 Migration and employment outcomes
In Table 5 below, we explore how geography and migration potentially relates to differences
in employment outcomes. If we only consider the youth’s initial location, we see by wave 2
that youth in either locale are highly likely to still be enrolled. But the rural youth are
somewhat more likely to be NEET whereas the urban youth and slightly more likely to be
employed. By wave 3, the differences get a bit more pronounced but remain relatively small.
Rural youth are more likely to still be enrolled, and are slightly less likely to be employed.
When we consider the migrants, we do see some strong differentials. The number of urban
to rural migrants is very low, so we do not comment on these. However, there are a
substantial number of youth who migrate from rural to urban areas. About 20% of the youth
originally in rural areas have migrated to an urban area by wave 3. When we compare the
rural youth who did not migrate with those who did migrate in wave 3, we see that the
enrolment rates are almost identical. However, the fraction who are NEET is almost 19
percentage points higher amongst the non-migrants, and this is fully offset by a higher
employment probability amongst the youth who did migrate from a rural to an urban area.
In fact, the employment rate of rural to urban migrant youth is almost double that of urban
youth who were already in urban areas in wave 1. While we cannot attribute causality of
employment outcomes to the decision to migrate, due to either reverse causality or selection
(or both), this correlation remains a striking insight that would not have been possible to
observe in the absence of longitudinal data.
© REDI3x3 22 www.REDI3x3.org

Table 5: Distribution of states by migration status
Variable State 2 State 3 NEET enrolled employed both NEET enrolled employed both Rural (w1) 40.11 50.36 7.53 2 48.87 29.01 21.57 0.55 Urban (w1) 36.22 50.8 11.17 1.81 51.19 24.08 19.39 5.34 Rural-urban non-migrant 38.72 50.83 8.53 1.93 51.78 26.73 18.52 2.97 Rural-urban migrant 22.81 41.8 34.15 1.24 32.87 26.3 39.54 1.29 Urban-rural non-migrant 38.26 50.5 9.32 1.92 49.68 26.94 20.53 2.84 Urban-rural migrant 38.31 61.69 0 0 71.3 7.53 21.17 0 Notes: 1. rural=1 if in a Farming or Traditional area. 2. There were only 7 and 15 urban to rural migrants in wave 2 and wave 3 respectively. 3. There were 37 and 128 rural to urban migrants in wave 2 and wave 3 respectively.
6.4 Regression results
Our final set of results relate to OLS regression models on whether a youth was enrolled or
not in wave 2 and wave 3, and whether a youth was employed or not in wave 2 and wave 3
respectively. Some of our covariates are time invariant, while some such as education are
time varying. Our coefficients are presented in Table 6 below.
By wave 2, youth who were enrolled in historically disadvantaged schools in wave 1 were 8.7
percentage points less likely be enrolled in school, but this difference vanishes by wave 3.
Thus, youth from poorer schooling backgrounds tend to drop out of school at a faster rate
than their peers who attend relatively better schools. At the same time, the employment
regressions do not reveal a statistically significant difference in employment rates by wave 2,
but do reveal a large and statistically significant difference by wave 3. Youth enrolled in
historically disadvantaged schools in wave 1 are 11.7 percentage points less likely to be
employed in wave 3 than their counterparts who attended relatively better schools.8
In wave 2, people with a matric were 28.4 percentage points less likely to have been enrolled,
relative to those without a matric, and the difference is statistically significant. Those with
only a matric were also about 8.5 percentage points more likely to be employed in wave 2. By
wave 3, there are no statistically significant differences in the likelihood of being enrolled, but
8 Note that we cannot disentangle how much of this reflects differences in school quality or learning, and how much of this is really a reflection of other variables such as neighbourhood or poverty status which we are not controlling for in our regression models.
© REDI3x3 23 www.REDI3x3.org

those with a matric and those with some tertiary experiences are significantly more likely to
be employed, at 7.7 and 13 percentage points respectively.
Table 6: Regressions on enrolment and employment (1) (2) (3) (4) Enrolled Enrolled Employed Employed VARIABLES wave 2 wave 3 wave 2 wave 3 Hist. disad. school (w1) -0.0877*
(0.0523) 0.0167
(0.0503) 0.0396
(0.0319) -0.117** (0.0484)
Matric -0.284*** (0.0520)
-0.0524 (0.0431)
0.0852** (0.0380)
0.0774* (0.0437)
Some tertiary 0.139 (0.120)
0.0960 (0.0790)
0.0479 (0.105)
0.130** (0.0608)
Age (w1) 0.0793*** (0.0146)
0.0671*** (0.0182)
0.0371*** (0.0116)
0.0338** (0.0157)
Urban (w1) 0.00459 (0.0493)
-0.0191 (0.0378)
0.0413 (0.0261)
0.0231 (0.0431)
Rural migrant -0.0305 (0.0938)
-0.0296 (0.0408)
0.253*** (0.0753)
0.212*** (0.0544)
Urban migrant 0.198 (0.204)
-0.232*** (0.0654)
-0.153*** (0.0429)
-0.0475 (0.132)
Male 0.0249 (0.0384)
-0.0210 (0.0417)
0.0488** (0.0232)
0.170*** (0.0390)
Mother present (w1) -0.0185 (0.0471)
0.00521 (0.0487)
-0.0124 (0.0311)
-0.0230 (0.0421)
Father present (w1) 0.0694 (0.129)
0.0417 (0.0881)
-0.0662 (0.0554)
0.181* (0.0988)
Both parents present (w1) 0.0697 (0.143)
-0.0105 (0.108)
0.0728 (0.0646)
-0.135 (0.109)
HH size (w1) -0.00810 (0.00742)
-0.0129** (0.00581)
-0.00483 (0.00429)
-0.00174 (0.00844)
Constant 2.048*** (0.250)
1.554*** (0.318)
-0.606*** (0.182)
-0.429 (0.299)
Observations 1,013 1,026 1,027 1,028 R-squared 0.138 0.056 0.086 0.116 Notes: 1. Robust standard errors in parentheses 2. *** p<0.01, ** p<0.05, * p<0.1 3. The education variables are time varying, and correspond to the relevant wave of the dependent variable. 4. A 'rural migrant' was in a rural area in wave 1, and in an urban area in the wave corresponding to the dependent variable. 5. An 'urban migrant' was in an urban area in wave 1, and in a rural area in the wave corresponding to the dependent variable. 6. A 'historically disadvantaged school' is defined in wave 1. Any student enrolled in a school that was administered by Independent homelands, self-governing territories or the DET was classified as historically disadvantaged. All other institutions were classified as not historically disadvantaged.
© REDI3x3 24 www.REDI3x3.org

Enrolment rates clearly decrease with age, and employment rates increase with age, but both
sets of coefficients get slightly smaller in absolute value as the cohort ages into their early
twenties. Thus age matters less as time goes by and the youth transition into adulthood. As
with the bivariate analysis in the previous subsection, we can clearly see how the migration
decision is related to employment outcomes for youth from rural areas. The rural youth who
migrated to urban areas were 25.3 and 21.2 percentage points more likely to be employed in
wave 2 and wave 3 respectively, relative to the rural youth who remained in rural areas.
Finally, we again observe that the entry into the labour market is much more challenging for
young women as compared to young men. The employment rate amongst young men is 4.9
percentage points higher than it is for young women in wave 2, and this difference increases to
17 percentage points by wave 3.
7. Conclusion
In this paper, we investigated the transitions of youth from enrolment into the labour
markets, amongst a cohort of youth who were enrolled in some form of education in 2008.
We estimated the transition rates, the distribution of enrolment and employment outcomes,
and a set of regression models to better understand some of the dynamics involved.
Our analysis confirmed some of the findings in the existing literature in South Africa, and also
yielded some new and interesting insights. For example, we confirmed that a large fraction of
youth enter the labour market by first spending a substantial amount of time where they are
neither employed nor in education or training. There are also significant differences in the
school-to-work transitions of youth who attend historically disadvantaged schools relative to
those who attend relatively better schools. We also measured the substantial gender
differentials in terms of labour market experiences. Then there are also the well-known
correlations between educational attainment and employment outcomes.
We also obtained two new insights into the school to work transition experience. First, we
measured a substantial amount of churning amongst the employed youth. Thus, the youth
employment problem is not only about the challenges of finding a first job, it is also about
finding a stable job. Secondly, the original location of a youth matters in that rural youth who
remain in a rural area have much worse employment outcomes than rural youth who migrate
to urban areas.
From a policy perspective, the net issue is that there are still too many people who live far
from where employment opportunities are. Increased urbanisation will place cities under
© REDI3x3 25 www.REDI3x3.org

increased pressure but rural to urban migration is likely to continue unless rural development
can effectively create job opportunities in rural areas and alleviate this pressure.
As with most research, the existing work has raised more questions that can be explored.
With time, there will be more waves of data in NIDS, and this will allow for an analysis of a
more complete cohort rather than one that is conditional on enrolment. One can also track
the evolution of cohorts for a longer period over the life cycle. There are more sophisticated
forms of analyses, and one can explicitly model the duration of particular states using hazard
models. Finally, one can perform more detailed analysis on specific components of the
youth’s school to work transitions, and these may yield more nuanced and useful insights for
policy makers.
References
Altbeker, A. & Johnston, A. (2013). Graduate unemployment in South Africa: A much exaggerated problem. Centre for Development and Enterprise. ISBN: 978-1-920653-05-7
Becker, G. (1971). The Economics of Discrimination. Chicago, University of Chicago Press. Bhorat H. & Oosthuizen, M. (2005). ‘The Post-Apartheid South African Labour Market’, Development
Policy Research Unit Working Paper, No. 05/93. Bhorat, H., Hirsch, A., Kanbur, R. and Mncube, M. (2014) The Oxford Companion to the Economics of
South Africa. Oxford University Press. Case, A. & Katz, L. (1991). ‘The company you keep: The effects of family and neighborhood on
disadvantaged youths.’ National Bureau of Economic Research Working Paper, No. 3705. Bernstein, A., Altbeker, A., Johnston, A. (2016). Skills. Centre for Development and Enterprise. ISBN:
978-1-920653-24-8. Dooley, D, Prause, J. & Ham-Rowbottom, K. (2000). Underemployment and Depression: Longitudinal
Relationships. Journal of Health and Social Behavior, 41(4): 421-436 Everatt, D. & Sisulu, E. (1992). Black youth in crisis. Braamfontein, South Africa: Ravan Press. Hammarstrom, A. & Janlert, U. (1997). Nervous and depressive symptoms in a longitudinal study of
youth unemployment – selection r exposure? Journal of Adolescence. 20(3): 293-305. Holzer, H. (1991). “The Spatial Mismatch Hypothesis: What Has the Evidence Shown?” Urban
Studies. International Labour Office. (2006). The end of child labour: Within reach. Geneva: International
Labour Office. International Monetary Fund. (2011). South Africa: 2011 Article IV Consultation. (IMF country report;
no. 11/258). Kain, J. (1968). Housing segregation, negro employment, and metropolitan decentralization.
Quarterly Journal of Economics. 82: 175-197. Kerckhoff, A. (1974). Ambition and attainment: A study of four samples of American boys.
Washington, DC: American Sociological Association. Leibbrandt, M & Mlatsheni, C. (2015). Duration of unemployment in youth transitions from
schooling to work in Cape Town. SALDRU Working Paper Number 159.
© REDI3x3 26 www.REDI3x3.org

Ligthelm, A & Kritzinger-Van Niekerk, L. (1990). Unemployment: The role of the public sector in increasing the labour absorption capacity of the South African economy. Development Southern Africa. Vol. 7, No. 4, November.
Loots, A. (1996). ‘Unemployment in South Africa: a case of jobless growth?’ paper presented at the EBM conference, Port Elizabeth.
Meyer, R. H. & Wise, D. A. (1982). The transition from school to work: The experience of Blacks and Whites. In Research in Labour Economics. Greenwich.
Mhone, G. C. Z. (2000). ‘Promoting youth employment in South Africa’, NIEP Occasional Paper Series, No. 19.
Mincer, J. (1974). Schooling, experience and earnings. New York: National Bureau of Economic Research.
Mlatsheni, C & Rospabe, S. (2002). Why is youth unemployment so high and unequally spread in South Africa?, DPRU Working Paper No. 02/65.
Morrell, S., Taylor, R. & Kerr, C. (1998). Unemployment and young people’s health. Medical Journal of Australia. 168: 263-240.
O’Higgins, N. (2001). Youth unemployment and employment policy. A global perspective, Geneva: International Labour Organisation.
Pinnock, D. (2016). Gang town. Tafelberg. South Africa Rees, A. (1986). An essay on youth joblessness. Journal of Economic Literature. 34: 613-628. Sewell, W., Archibold, H. & Ohlendorf, G. 1970. The educational and early occupational attainment
process: replication and revision. American Sociological Review. 35: 1014-1027. Spaeth, J. (1968). Occupational prestige expectations among male college graduates. The American
Journal of Sociology. 73(5). Standing, G., Sender, J. & Weeks, J. (1996). Restructuring the labour market: the South African
challenge. An ILO Country Review. International Labour Office, Geneva. Statistics South Africa (2015) National and Provincial Labour Market: Youth Q1: 2008-Q1:2015.
Statistical release P0211.4.2. Pretoria: Stats SA. Topel, R. & Ward, M. (1992). Job mobility and the careers of young men. Quarterly Journal of
Economics. 107(2): 439-479. Truscott, K. (1993). Youth education and work: The need for an integrated policy and action
approach. CASE, University of Witwatersrand, South Africa. Van Zyl Slabbert, F. (1994). Youth in the new South Africa. Pretoria: HSRC Press. Winefield, A., Tiggemann, M., Winefield, H. & Goldney, R. (1993). Growing up with unemployment: A
longitudinal study of its psychological impact. London: Routledge. Wittenberg M. & Pearce, C. (1996). Youth unemployment: Some perspectives from the South African
Living Standards and Development Survey. In L. Chisholm et al., Out-of-School Youth Report: Policy and Provision for Out-of-School and Out-of-Work Youth, Education Policy Unit, University of the Witwatersrand, 1996.
Wittenberg, M. (2002). Job Search in South Africa: A nonparametric analysis. South African Journal of Economics. 70(8): 1163-1197.
World Bank. (2007). World development report 2007: Development and the next generation. Washington: The World Bank.
© REDI3x3 27 www.REDI3x3.org

The Research Project on Employment, Income Distribution and Inclusive Growth (REDI3x3) is a multi-year collaborative national research initiative. The project seeks to address South Africa's unemployment, inequality and poverty challenges.
It is aimed at deepening understanding of the dynamics of employment, incomes and economic growth trends, in particular by focusing on the interconnections between these three areas.
The project is designed to promote dialogue across disciplines and paradigms and to forge a stronger engagement between research and policy making. By generating an independent, rich and nuanced knowledge base and expert network, it intends to contribute to integrated and consistent policies and development strategies that will address these three critical problem areas effectively.
Collaboration with researchers at universities and research entities and fostering engagement between researchers and policymakers are key objectives of the initiative.
The project is based at SALDRU at the University of Cape Town and supported by the National Treasury.
Consult the website for information on research grants and scholarships.
Tel: (021) 650-5715
© REDI3x3 28 www.REDI3x3.org