women labour market dynamics in el salvador
TRANSCRIPT
MOVING IN AND MOVING UP:
LABOR MARKETS DYNAMICS OF WOMEN AND MEN IN EL SALVADOR
January, 2015
Margarita Béneke de Sanfeliú (FUSADES, El Salvador)
T. H. Gindling (University of Maryland Baltimore County)
José Andrés Oliva Cepeda (FUSADES, El Salvador)
Susana Maria Delgado Vides (FUSADES, El Salvador)
ABSTRACT
We use individual and household level panel data to study labor market dynamics with a focus on what
factors help men and women to achieve advantageous jobs in the labor market and whether those factors
differ between men and women. Specifically, we examine the influence of personal characteristics (such
as education), family characteristics (such as the number of children), and job characteristics (such as
the industry sector of employment) in determining whether a women (or man) moves up into an
advantageous labor market state from an unfavorable state.. We consider three labor market states to be
“advantageous” (“favorable” in Spanish): (1) formal salaried employees, (2) non- agricultural self-
employed workers and employers with a decent wage (defined as reported labor earnings above the legal
minimum wage) and (3) agricultural self-employed workers or employers with a decent wage. We
examine the transitions into and out of these advantageous labor market states and other labor market
and non-labor market states including informal salaried employment, unfavorable non- agricultural
self-employment, unfavorable agricultural self-employment, unemployment and out of the labor force
(distinguishing between those going to school, those engaged in unpaid domestic work, and all other non-
labor force activity).
Our work sheds light on the answers to two key questions: (1) what are the characteristics of the men and
women who move up to an advantageous labor market state from an unfavorable one? and (2) what are
the characteristics of the men and women who fall out of an advantageous labor market states into
unfavorable ones? The answers to these questions contribute to the appropriate design and targeting of
public policy interventions to promote success in the labor market. Our work also sheds light on whether
the characteristics correlated with success in the labor market differ between women and men, and
therefore whether the appropriate design and targeting of policies is different for men and women. Our
findings suggest that education is the most important personal characteristic promoting transitions into
non-agricultural advantageous labor market states and reducing transitions from advantageous labor
market states. In particular, a tertiary (post-secondary) education is a strong predictor of whether a man
or women is found in, and stays in, the most advantageous labor market state, formal salaried employment.
Along with a tertiary education, a secondary education also promotes advantageous non-agricultural self-
employment. For women, dependent children or elderly members in a household reduces the probability
of a transition into an advantageous labor market state. This is likely because unpaid domestic care is still
largely the responsibility of women in El Salvador (especially for a wife/spouse, grandmother or oldest
daughter). This suggests that a key policy intervention to promote advantageous employment for women
would be to make it easier and cheaper to care for children outside of the home while women are working.
1. Introduction
Economic empowerment of women, defined as the “capacity to participate in, contribute to and
benefit from growth processes in ways that recognize the value of their contributions, respect their
dignity and make it possible to negotiate a fairer distribution of the benefits of growth” (OECD,
2011). In the context of this paper, we consider economic empowerment occur when women are
employed in jobs which provide them with a good salary and/or the possibility of improving their
economic status. In our research we study the job, personal and institutional characteristics that
promote the entry of men and women into the labor force and the ability of women to obtain better
jobs once they enter. In particular, the focus of our research is an examination of the characteristics
of women who become empowered and successful in the labor market.
From the Fourth World Conference on Women held in China in September 1995, El Salvador
undertook an action platform for addressing efforts to combat discrimination against women. Thus,
in 1996, was issued the National Policy on Women the Institute for the Development of Women
(ISDEMU) was founded. The Salvadoran government in its Government Plan (2010-2014)
established that gender inequality is one of the most important challenges to overcome. Following
a qualitative evaluation, changes were introduced in the National Policy on Women, so that,
thereafter, its main goal is “to deconstruct the cultural patterns of gender inequality and to give
incentives to build the knowledge that helps create transformative interventions that have a
significant impact on the lives of women”. Thus the efforts of the National Institute for the
Development of Women (ISDEMU) were redirected and, in 2011, the Equality and Elimination of
Discrimination Against Women Act was passed in order to strengthen its institutional framework.
This law determines that ISDEMU is responsible for developing activities, such as training, technical
assistance, technology transfer, tax incentives, access to soft loans, marketing opportunities and to
promote competitiveness, in in order to empower women; it is also responsible for providing
incentives to credit institutions to create special entrepreneurship programs for women (art. 24).
For these programs to be effective at reducing poverty and improving the participation of women
in the process of economic growth, it is important that those designing and running these programs
know the characteristics of the women who could benefit from the programs, as well as the sectors
of the economy where self-employed women or women who are employers in small firms are most
likely to be successful. Many have argued that self-employment in developing countries is not an
indicator of economic empowerment, but rather that workers in developing countries become
self-employed because they are rationed out of formal sector jobs (Fields, 1975; Tokman, 2007, de
Mel, et al, 2010). On the other hand, some point to other self-employed who are innovative and,
successful entrepreneurs (de Soto, 1989; Bennet and Estrin, 2007). In our study of whether the
labor market has contributed to the inclusion of women in the benefits of growth, it is important
to distinguish “successful,” “favorable” or “advantageous” self-employment and small-scale
entrepreneurship, which can promote the inclusion of women in the benefits of development,
from self-employment that exists only because women cannot find the jobs they want in the formal
sector. We consider three labor market states to be “advantageous” (“favorable” in Spanish): (1)
formal salaried employees, (2) non-agricultural self-employed workers and employers with a
decent income, defined as reported labor earnings above the legal minimum wage or (in the
appendix) a household income above the poverty line, and (3) agricultural self-employed workers
or employer with a decent income. We believe that these states are advantageous because they
contribute to meeting basic needs of workers and their households, while providing them with the
ability to respond to adverse situations and in the case of women contribute to the process of
economic empowerment.
Our definition of “advantageous” labor market states is similar to the International Labor Office
(ILO) concept of “decent work.” Two key components of the ILO concept of “decent work” are
remunerative employment and social security (Ghai, 2003). “Social security serves to meet
people’s urgent subsistence needs and to provide protection against contingencies, and as such is
an important aspect of decent work” (Ghia, 2003, p.122). Our first advantageous labor market
state is formal salaried employment, defined as paid employment where workers are insured by
social security. Remunerative employment is work that pays sufficiently to allow a worker’s family
to live at an adequate level. “For developing countries, a good indicator of remunerative work is
provided by data on absolute poverty” (Ghia, 2003, p. 119). The ILO suggests that a good indicator
of whether workers do not have remunerative employment: the first defines advantageous self-
employment as those whose labor earnings are above the legal minimum wage, the second (in the
appendix) defines advantageous self- employment as those who live in a household with an income
above the poverty line. We do not use the term “decent work” in this paper because our measure
of advantageous labor market states does not take into account other components that the ILO
considers when defining decent work, such as basic worker rights and social dialogue (i.e. access
to collective bargaining).
Our study sheds light on the answers to two key questions: (1) what are the characteristics of the
men and women who move up to an advantageous labor market state from an unfavorable one?
and (2) what are the characteristics of the men and women who fall out of an advantageous labor
market states into unfavorable ones? The answers to these questions contribute to the
appropriate design and targeting of public policy interventions to promote success in the labor
market. Our work also sheds light on whether the characteristics correlated with success differ
between women and men, and therefore whether the appropriate design and targeting of policies
is different for men and women. Along with the qualitative study of female employees and self-
employed workers, this paper will inform the debate on the following questions: (1) What public
policies would support the ability of women to benefit from growth? (2) What is the role of formal
wage and salaried employment and small-scale entrepreneurship in supporting the ability of
women to benefit from economic growth? and, (3) What public policies would best support the
ability of women to become successful formal sector employees or successful small-scale
entrepreneurs?
In the empirical work presented in this paper we use panel data to study the determinants of job
mobility for women into and out of the labor force (distinguishing between those going to school,
those engaged in unpaid domestic work and those in other non-labor market states), into and out
of unemployment, and into and out of formal salaried employment,1 informal salaried
employment, self-employment, and employer/owner. We also conduct a similar analysis for men
and compare whether the determinants of job mobility differ between men and women in El
Salvador. We extend the existing literature on labor market mobility in Latin America by separating
self-employment into “advantageous” and “unfavorable”.
We focus our study on what factors help women to achieve advantageous jobs in the labor market.
Specifically, we examine the influence of personal characteristics (such as education), family
characteristics (such as the number of children), and job characteristics (such as the industry sector
of employment) in determining whether a women (or man) moves up into an advantageous labor
market state from an unfavorable state. Because we have panel data on individuals, we will also
be able to pay particular attention to the timing of the transition process. For example,
Cunningham and Bustos Sakvagno (2011) suggest that many successful self-employed workers and
entrepreneurs first spend a short time as informal sector employees acquiring job- relevant skills,
and then move on to formal jobs or return to school, and only then start their own small
businesses. Even then, they may spend short periods of time in informal wage paying jobs or more
education on their way to long-term successful employment states. This suggests that to
understand what makes a woman successful in the labor market and as a small-scale entrepreneur
it is important to simultaneously study the movement of women between formal employment,
informal employment, advantageous self-employment, education and other non-employment
states. For example, if informal or formal employment is an important stepping stone to becoming
a successful entrepreneur, then public policies to promote entrepreneurship might actually need
to promote wage and salaried employment for those workers (at least when they first enter the
labor force), rather than enact policies that encourage women to move directly from non-
employment to self-employment or ownership of small-scale firms. This type of study can only be
done with panel data that follows individuals over time. Firm level enterprise surveys, which follow
enterprises (and not people) over time, would not allow the researcher to examine these
transitions between informal employment, formal employment, schooling, unpaid domestic work
and self- employment.
We find that in El Salvador men are more mobile than women; over 22% of men change states
from one year to the next, compared to only 12% of women. We find substantial mobility of both
men and women between self-employment and the informal sector. For women (but not men)
there is also substantial mobility between the labor market and unpaid domestic care. There is
substantially less mobility out of (and especially into) formal salaried employment than in any other
sector, for both men and women.
For both men and women, the most important characteristic promoting transitions into
advantageous labor market states is education. Any additional education will increase the
probability of transitioning into the salaried formal sector, although tertiary education is the most
1 Originally we had separated part-time and full-time salaried formal employment. However, we found that the few
part-time salaried formal employees had earnings and other characteristics similar to full-time salaried employees
and so decided to combine part-time and full-time into one salaried formal sector.
advantageous for the salaried formal sector while a secondary education is most advantageous for
advantageous non-agricultural self-employment. Our results suggest that, compared to women,
education has a bigger impact on the ability of men to transition into advantageous labor market
states. This suggests that educated women may face a “penalty” in searching for advantageous
employment.
Very young workers are not likely to transition into advantageous non-agricultural self-
employment. It is most likely that a worker transitions into advantageous non-agricultural self-
employment in their 30s or 40s. This suggests that workers most likely to be successful in self-
employment obtain experience before becoming self-employed.
Remittances and other non-labor income promote advantageous non- agricultural self-
employment. Receiving more remittances and other non-labor income increases the probability of
transitioning into advantageous non-agricultural self- employment and decreases the probability
of transitioning out of this advantageous state. This is true for both men and women. For men,
receiving more remittances and other non-labor income decreases the probability of transitioning
into formal sector employment. In general, our results suggest that receiving more remittances
decreases the probability of transitioning into formal sector employment but increases the
probability of transitioning into advantageous self-employment. For women, an increase in
remittances and other non-labor income also increases the probability of leaving the labor force
for unpaid domestic care or other types of non-labor activity.
Access to electricity and other public services increases the probability that both men and women
transition from an unfavorable state into advantageous non-agricultural self-employment. This
suggests that policies of providing access to public services to poor families can also be thought of
as policies to promote advantageous self-employment.
Female spouses are less likely to be salaried formal employees compared to other sectors, while
male spouses are more likely to be in salaried formal employment. A higher number of dependent
members in the household (i.e. too young or too old to work) make it less likely that women (but
not men) are found in the salaried formal sector. A higher number of dependent children (7-19
years old) also reduce the probability that women (but not men) transition into formal salaried
employment. The difference between men and women is likely a consequence of the traditional
expectation that wives will provide unpaid domestic care to children and other dependents, while
husbands are expected to have full-time jobs outside of the home. Surprisingly, the number of
dependent family members does not have a significant influence on the probability that women
will transition into advantageous non- agricultural self-employment. This may be because women
are attracted to self-employment for the flexibility it offers.
The next section of this paper describes the panel data used in this paper. Section 3 describes and
compares the labor market characteristics of men and women in the Salvadoran labor market and
how these characteristics differ between men and women. In this section we use multinomial logit

analysis to identify the personal and job characteristics of men and women in each of the 11 labor
market states, and how those characteristics differ between men and women. Section 4 uses the
panel nature of our data to measure the degree to which men and women move from unfavorable
states to advantageous labor market states, and vice-versa, from one year to the next. Finally,
section 5 identifies the characteristics that determine whether or not men and women transition
into or out of successful labor market states. Section 6 concludes and presents policy
recommendations.
2. Data
To study the labor markets dynamics of women and men in El Salvador, we created an annual panel
data set using the Multipurpose Household Surveys (EHPM) from the years 2008-2012. These
survey data have been collected by the General Directorate of Statistics and Census (DIGESTYC)
since 1975, although we only use the surveys from 2008 to 2012 because it is only in those years
that the necessary variables are available to allow us to match individuals across surveys.
The EHPM includes information related to social, economic and demographic aspects of
households, aimed for diagnosis, planning and evaluation purposes of the country. In addition, the
survey contains the most comprehensive household’s information for both the rural and urban
areas of the country. This data set allows us to follow women and men as they change jobs or as
the job characteristics change.
The EHPM is based on a census mapping technique, developed by DIGESTYC. Every five years,
DIGESTYC updates and renews the sampling frame of households. During a five year period, the
sample is created in a single rotating base from the same sampling framework. The base census
map divides the territory into basic units called “segments”, consisting of one or more blocks (each
block with a group of 12-16 households) and there is a specific unique number for each segment.
Some segments are kept and others are partially rotated every year to reduce the non-response
bias over time.
The division of segments allowed us to create the panel data for the years 2008-2012. The total
sample contains 407,737 observations – 194,508 males (47.7 percent) and 213,229 females (52.3
percent). However, our analysis is restricted to the working age population, therefore, 266,546
observations – 122,403 males (45.9 percent) and 144,143 females (54 percent). From this sample,
165,360 belong to the economically active population – 101,089 males (61.1 percent) and 64,271
females (38.9 percent).
To create the panel data we matched households, then household heads, and finally all the
members of the household. This methodology considers key variables such as the segment
number, geographical location, year of birth, gender and age of each individual to create a unique
identifier that allows a matching process of the head of household and the members living in the
household for each home. We are able to match the same individuals across two consecutive years,
but cannot follow the same individuals for more than two years. Thus, our data effectively consists
of four panel data sets, each of which follows households and individuals for two years (2008-2009,
2009-2010, 2010-2011 and 2011-2012).
On average, 23 percent of the EHPM observations were repeated the following year. Between
2008 and 2009, observations were repeated for 22.6 percent of the 2008 survey sample; from 2009
and 2010, 21.6 percent; for the 2010 and 2011 period, 23.9 percent; and finally, between 2011 and
2012, 23.9 percent as well. The percentages for women are as follows, 22.4 percent from the
period 2008 and 2009; 21.6 percent, between 2009 and 2010; 23.7 between 2010 and 2011, and
finally 24.1 percent between 2011 and 2012. These results are shown in the appendix A (Table A1).
In order to check the representativeness of the panel data sample, we compared some basic
characteristics of the panel data with the full cross-sectional data set (Table 1). The distribution of
workers by gender, region of the country, economic activity and the distribution by employment
status are all similar in the panel and full data.
3. Women in the El Salvador labor market
3.1. Background
The labor market in El Salvador is characterized by a high overall labor force participation
rate for men, an unemployment rate of 6.6 percent on average for the period of 2008-2012
and low level of formal sector employment in general (Table 1). According to the World Bank
statistics, El Salvador had the lowest economic growth among Central American countries
during the period that we study (2008-2012). Remittances from relatives living abroad represent
one sixth of the country’s GDP, and they continue to show increasing trend overtime.
Economic growth plays a pivotal role in the creation of more jobs in El Salvador; as economic
growth increases, unemployment declines. In El Salvador, economic growth shows a high
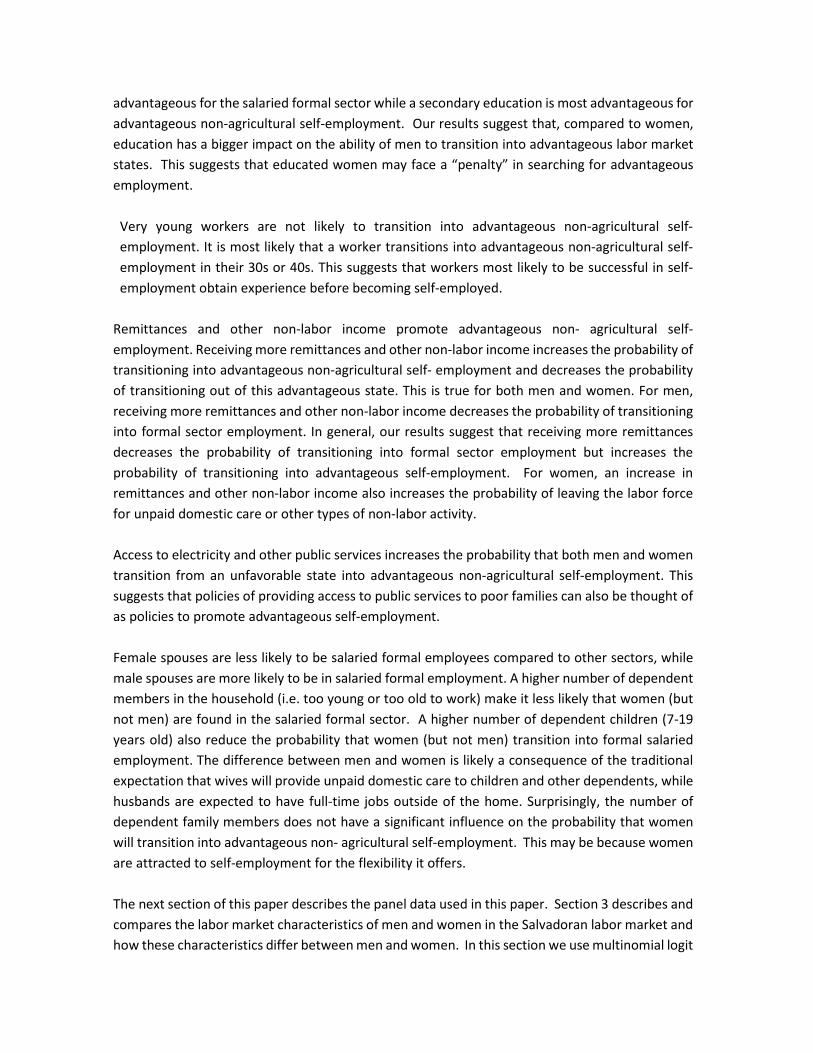
correlation with job creation rates. Figure 1 shows the trends of unemployment vs. economic
growth for the years being examined. Figure 1 is consistent with the hypothesis that low economic
growth provokes higher unemployment rates.
From table 1 it can be observed that for the years that we study about 47 percent of women
participate in the labor market compared to about 81 percent of men. From 2008 to 2012 the
labor force participation rate of women has been steady and remains substantially below that of
men. Also, the distribution of the labor force by employment status is different for men and
women; 10 percent of women focus on paid domestic service, while almost no men belong to
this status. Men are more likely than women to be permanent or temporary wage and salaried
employees. On the other hand, self- employment is higher for women than men (Appendix, Table
A3).
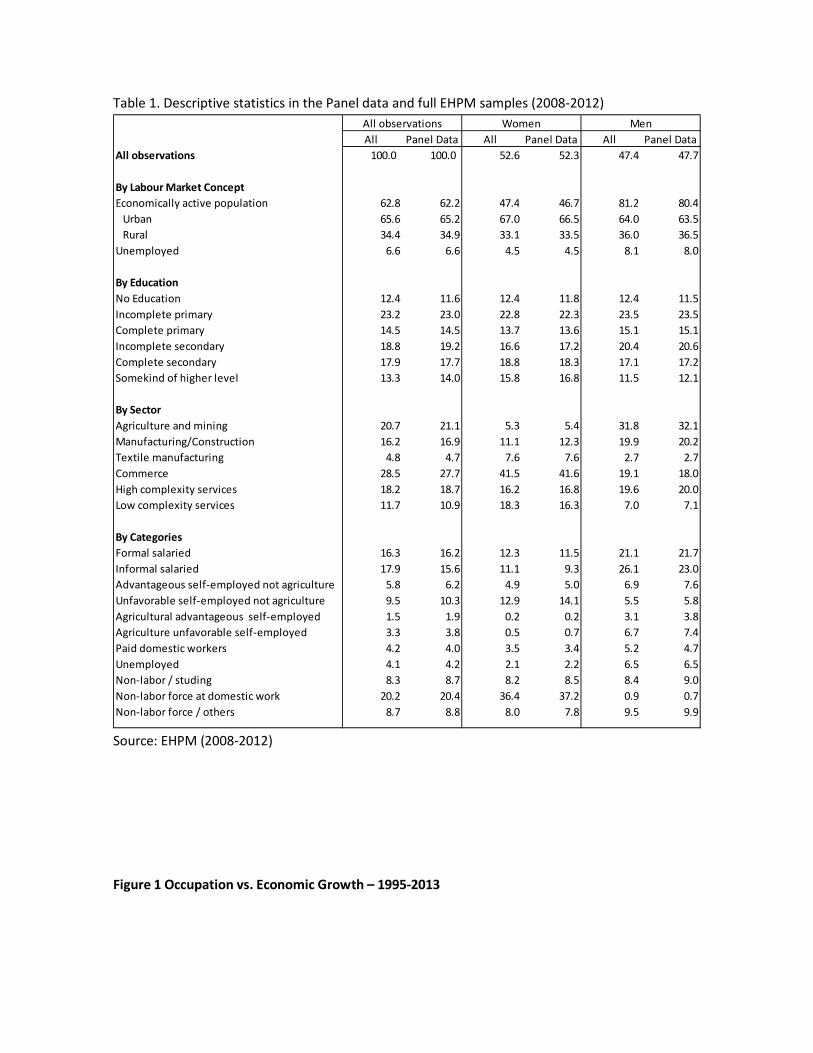
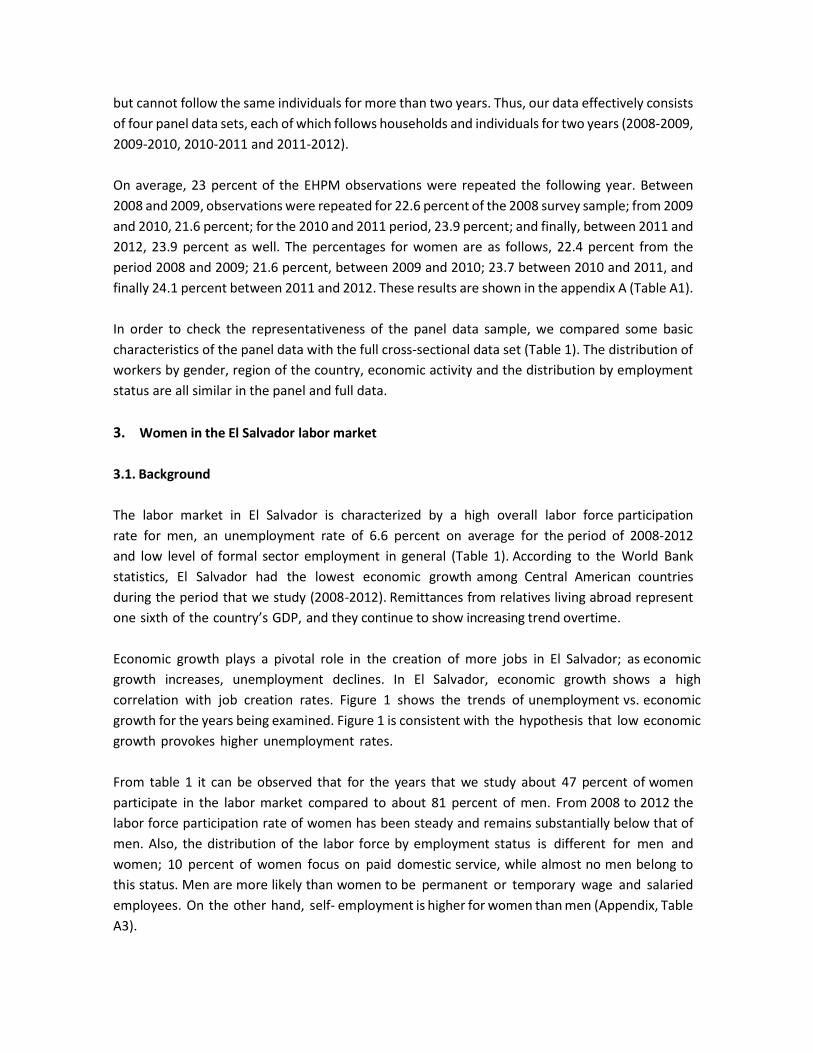
Table 1. Descriptive statistics in the Panel data and full EHPM samples (2008-2012)
Source: EHPM (2008-2012)
Figure 1 Occupation vs. Economic Growth – 1995-2013
All Panel Data All Panel Data All Panel Data
All observations 100.0 100.0 52.6 52.3 47.4 47.7
By Labour Market Concept
Economically active population 62.8 62.2 47.4 46.7 81.2 80.4
Urban 65.6 65.2 67.0 66.5 64.0 63.5
Rural 34.4 34.9 33.1 33.5 36.0 36.5
Unemployed 6.6 6.6 4.5 4.5 8.1 8.0
By Education
No Education 12.4 11.6 12.4 11.8 12.4 11.5
Incomplete primary 23.2 23.0 22.8 22.3 23.5 23.5
Complete primary 14.5 14.5 13.7 13.6 15.1 15.1
Incomplete secondary 18.8 19.2 16.6 17.2 20.4 20.6
Complete secondary 17.9 17.7 18.8 18.3 17.1 17.2
Somekind of higher level 13.3 14.0 15.8 16.8 11.5 12.1
By Sector
Agriculture and mining 20.7 21.1 5.3 5.4 31.8 32.1
Manufacturing/Construction 16.2 16.9 11.1 12.3 19.9 20.2
Textile manufacturing 4.8 4.7 7.6 7.6 2.7 2.7
Commerce 28.5 27.7 41.5 41.6 19.1 18.0
High complexity services 18.2 18.7 16.2 16.8 19.6 20.0
Low complexity services 11.7 10.9 18.3 16.3 7.0 7.1
By Categories
Formal salaried 16.3 16.2 12.3 11.5 21.1 21.7
Informal salaried 17.9 15.6 11.1 9.3 26.1 23.0
Advantageous self-employed not agriculture 5.8 6.2 4.9 5.0 6.9 7.6
Unfavorable self-employed not agriculture 9.5 10.3 12.9 14.1 5.5 5.8
Agricultural advantageous self-employed 1.5 1.9 0.2 0.2 3.1 3.8
Agriculture unfavorable self-employed 3.3 3.8 0.5 0.7 6.7 7.4
Paid domestic workers 4.2 4.0 3.5 3.4 5.2 4.7
Unemployed 4.1 4.2 2.1 2.2 6.5 6.5
Non-labor / studing 8.3 8.7 8.2 8.5 8.4 9.0
Non-labor force at domestic work 20.2 20.4 36.4 37.2 0.9 0.7
Non-labor force / others 8.7 8.8 8.0 7.8 9.5 9.9
All observations Women Men
Notes: 2007 data is not being used due to change in sampling frame.
See appendix A, table A2
Source: own elaboration with data from EHPM y BCR
The EHPM includes a direct question for the reasons of not seeking a paid job. As noted above,
there are more women out of the labor force than men. 69 percent of women state that they
are out of the labor force because of family obligations or unpaid domestic work responsibilities
– 14.8 percent state that they are studying and 11.7 percent report disability or illness. In
contrast, the main reason for men not seeking a job is because they are studying (40 percent,
appendix A, Table A4).
The labor market dynamics of men and women are conditioned by the traditional division of labor
by gender. For instance, the industry sectors where people are likely to work differ between men
and women. Women have a higher participation in commerce, 42 percent vs. 18.8 percent for
men in 2012; low complexity services2 (18.6 percent vs. 7.6 percent for men); and textile
manufacturing (6.9 percent vs. 2.5 percent for men). In the case of men, most work in the
agriculture sector; (34.3 percent of men work in agriculture compared to 5.3 women in 2012),
followed by manufacturing and construction (19.1 percent vs. 11.2 percent of women); and
high complexity services (17.9 percent vs. 15.9 percent for women, Table 1).
Regarding education, women achieve higher education levels than men. For example, in 2012 20.1
percent of women had completed secondary education vs. only 18.5 percent of men; 15.7 percent
of women had some kind on tertiary education vs. 11.9 percent of men (Table 1).
Figure 2 portrays an interesting insight about the income gap between men and women by
education level for wage and salaried employees and the self-employed. At most educational
levels, the income distribution of men is to the right of that for women, indicating that men
earn more than women at these education levels. For employees, the gap between the earnings
of men and women narrows with education, so that for wage and salaried employees with a
tertiary education the earning gap between men and women is almost zero. On the other hand,
2 Low complexity services include: communitarian, social and personal services, private domesticservices. High complexity services include: utilities, transport, storage, telecommunications, financial services, public administration.

the earnings gap between self-employed men and self-employed women increases as education
level increases.
As education increases individuals opt to enter into the service sector; data shows that 79.8
percent of women who belong to the service sector complete upper level education,
meanwhile 44.2 percent of women working in the commerce section either have no education
or incomplete primary level. In the case of men, the least educated remain in agriculture, and
the most educated tend to be employed in the service sector (Appendix A, Table A7).
Another important fact to consider is that the percentage of workers in formal salaried jobs is
similar for both men and women, 26 percent for both (see Table 2). However, due to the lower
rate of job-market participation, women´s participation in formal jobs is also lower. According to
data from the “Instituto Salvadoreño del Seguro Social” (ISSS), 41.8 percent of covered individuals
are women and 58.2 percent are men (Appendix, Table A8).
Figure 2: Monthly earnings male-female gap between wage employees and self- employed
workers by education level
Source: Data base of Multipurpose Household Survey (EHPM), DIGESTYC, 2008 – 2012.
3.2. Characteristics of men and women in each state
0.2
.4.6
.81
Pro
port
ion
0 100 200 300 400 500Wage
Woman Men
Primary
0.2
.4.6
.81
Pro
por
ción
0 200 400 600 800 1000Wage
Woman Men
Secundary
Cuenta Propia
0.2
.4.6
.81
Pro
por
ción
0 500 1000 1500Wage
Woman Men
Terciary
0.2
.4.6
.81
Pro
port
ion
0 100 200 300 400 500Net income
Woman Men
Primary
0.2
.4.6
.81
Pro
por
ción
0 200 400 600 800 1000Net income
Woman Men
Secundary
0.2
.4.6
.81
Pro
por
ción
0 500 1000 1500Net income
Woman Men
Terciary
Wage earners
Self-employed
To study the movement into and out of advantageous labor market states in El Salvador we
classified men and women into the following states: not in the labor force (divided between
those in school, those engaged in unpaid domestic work, and others not in the labor force),
unemployed, unpaid family work, employed in the salaried informal sector, employed in salaried
formal sector, non-agricultural self- employed/employer, agricultural self-employed/employer.
The last two states are also further divided into advantageous and unfavorable self-employment.
The category "salaried formal sector" includes employees who are benefiting from social security,
either employed full time or part-time. All wage and salaried employees who are not benefiting
from social security are classified as "informal".
The category "Advantageous Non-Agricultural Self-employed/Employer" includes self- employed
workers who are not engaged in agriculture and whose labor earnings are greater than the
legal minimum wage.3
All self-employed workers and employers who are not engaged in
agriculture and that do not meet the above conditions are classified as "Unfavorable Non
Agricultural Self-employed/Employer".
The category "Advantageous Agricultural Self-employed/Employer" includes self- employed
workers who are engaged in agriculture and whose labor earnings are greater than the legal
minimum wage. All self-employed workers and employers who are engaged in agriculture and
that do not meet the above conditions are classified as "Unfavorable Agricultural Self-
employed/Employer".
The "Unpaid family worker" category includes any person who works without remuneration in a
business, firm or family farm. The category "Unemployed" includes people who do not have a
job but who are actively seeking one.
The category "Not in the Labor Force - Student" includes persons 16 years of age or older who
are not part of the labor force and who report to be exclusively devoted to studying.
We distinguished between two further categories of non-students what are not in the labor
force. The category "Not in the Labor Force – Unpaid Domestic Work" includes persons 16 years
of age or older who are not part of the labor force who report to be exclusively devoted to
domestic work. “Other inactive” are those who report to not be in the labor force for any other
reason. This last category includes those who are retired and young people who are neither
3 Multiple minimum wages are set by industry sector in El Salvador during different periods of time. Before May 2008 urban monthly minimum wage was $183 compared to rural minimum wage, $85.8. From May 2008 to December 2008, the urban minimum wage was $192.3 against $90 for the rural area. Finally from 2009 the minimum wage for the urban area was $207.9 and $97.2 for the rural area. For comparisons to results of a companion project in Nicaragua we also constructed a separate set of results that define advantageous” as having a household income per capita above the poverty line; the corresponding results w h i c h are presented and discussed in the appendix B, are similar for both definitions of “advantageous”.
working nor in school (sometimes called “NENE”-Not Employed and Not in Education), and the
disabled.
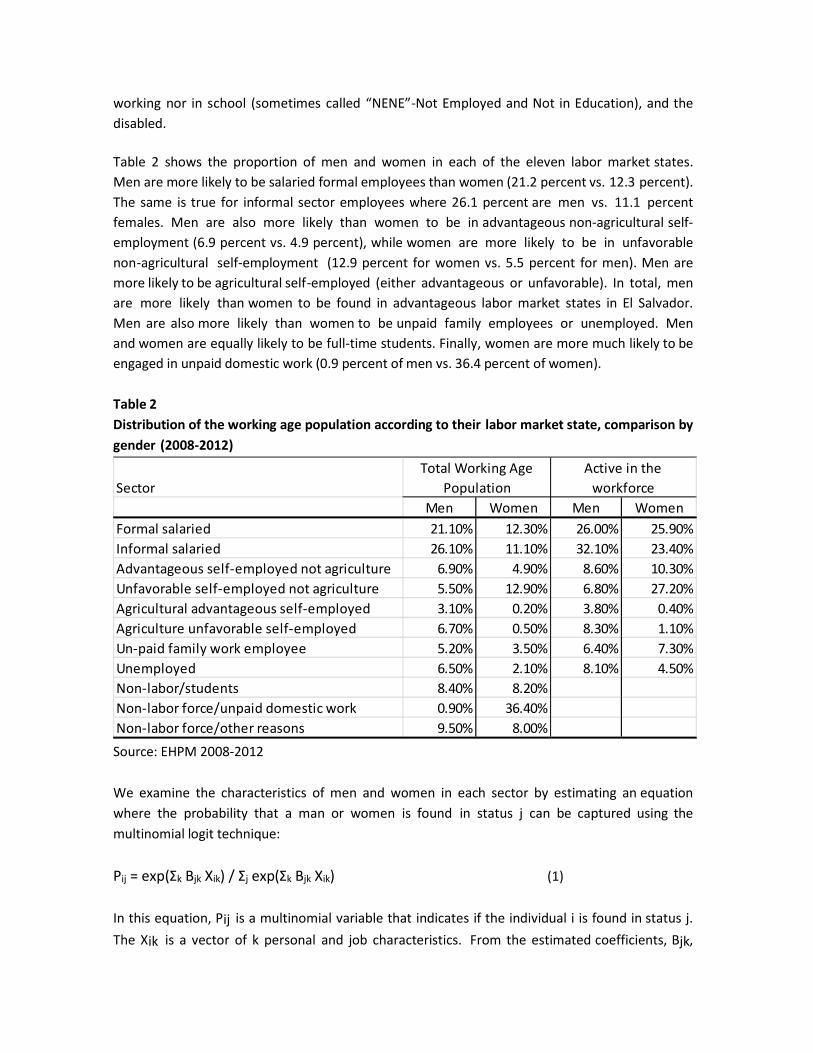
Table 2 shows the proportion of men and women in each of the eleven labor market states.
Men are more likely to be salaried formal employees than women (21.2 percent vs. 12.3 percent).
The same is true for informal sector employees where 26.1 percent are men vs. 11.1 percent
females. Men are also more likely than women to be in advantageous non-agricultural self-
employment (6.9 percent vs. 4.9 percent), while women are more likely to be in unfavorable
non-agricultural self-employment (12.9 percent for women vs. 5.5 percent for men). Men are
more likely to be agricultural self-employed (either advantageous or unfavorable). In total, men
are more likely than women to be found in advantageous labor market states in El Salvador.
Men are also more likely than women to be unpaid family employees or unemployed. Men
and women are equally likely to be full-time students. Finally, women are more much likely to be
engaged in unpaid domestic work (0.9 percent of men vs. 36.4 percent of women).
Table 2
Distribution of the working age population according to their labor market state, comparison by
gender (2008-2012)
Source: EHPM 2008-2012
We examine the characteristics of men and women in each sector by estimating an equation
where the probability that a man or women is found in status j can be captured using the
multinomial logit technique:
Pij = exp(Σk Bjk Xik) / Σj exp(Σk Bjk Xik) (1)
In this equation, Pij is a multinomial variable that indicates if the individual i is found in status j.
The Xik is a vector of k personal and job characteristics. From the estimated coefficients, Bjk,
Sector
Men Women Men Women
Formal salaried 21.10% 12.30% 26.00% 25.90%
Informal salaried 26.10% 11.10% 32.10% 23.40%
Advantageous self-employed not agriculture 6.90% 4.90% 8.60% 10.30%
Unfavorable self-employed not agriculture 5.50% 12.90% 6.80% 27.20%
Agricultural advantageous self-employed 3.10% 0.20% 3.80% 0.40%
Agriculture unfavorable self-employed 6.70% 0.50% 8.30% 1.10%
Un-paid family work employee 5.20% 3.50% 6.40% 7.30%
Unemployed 6.50% 2.10% 8.10% 4.50%
Non-labor/students 8.40% 8.20%
Non-labor force/unpaid domestic work 0.90% 36.40%
Non-labor force/other reasons 9.50% 8.00%
Total Working Age
Population
Active in the
workforce
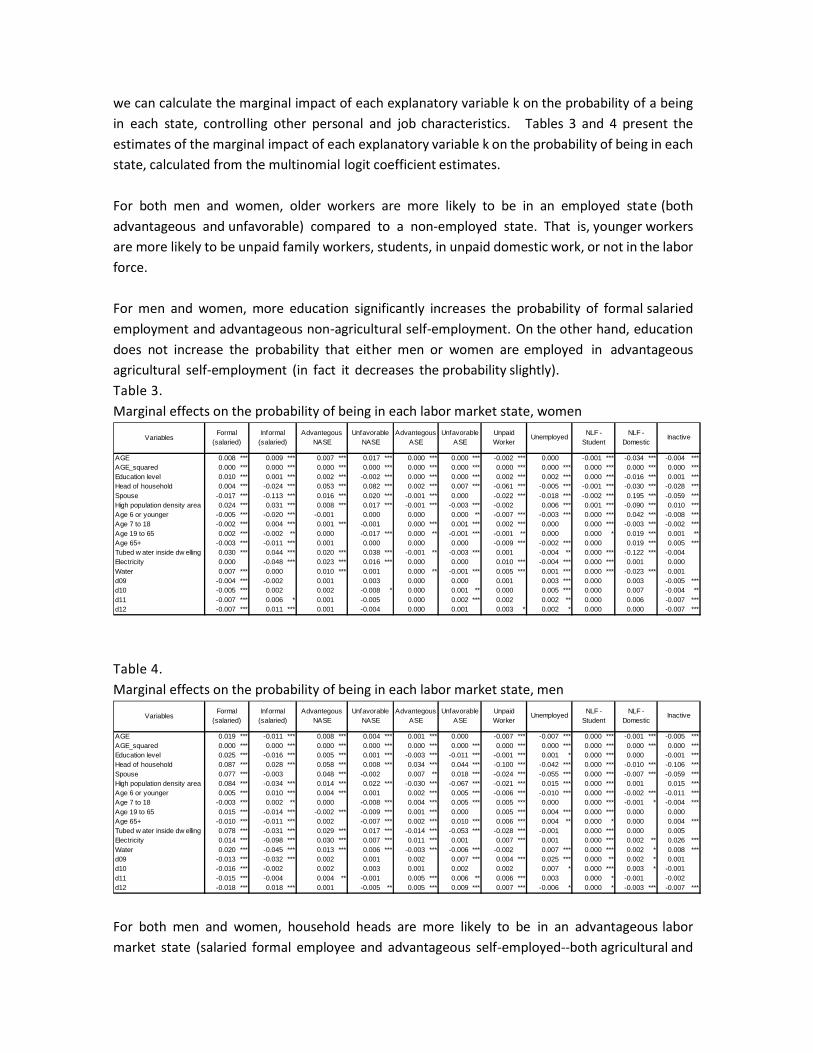
we can calculate the marginal impact of each explanatory variable k on the probability of a being
in each state, controlling other personal and job characteristics. Tables 3 and 4 present the
estimates of the marginal impact of each explanatory variable k on the probability of being in each
state, calculated from the multinomial logit coefficient estimates.
For both men and women, older workers are more likely to be in an employed state (both
advantageous and unfavorable) compared to a non-employed state. That is, younger workers
are more likely to be unpaid family workers, students, in unpaid domestic work, or not in the labor
force.
For men and women, more education significantly increases the probability of formal salaried
employment and advantageous non-agricultural self-employment. On the other hand, education
does not increase the probability that either men or women are employed in advantageous
agricultural self-employment (in fact it decreases the probability slightly).
Table 3.
Marginal effects on the probability of being in each labor market state, women
Table 4.
Marginal effects on the probability of being in each labor market state, men
For both men and women, household heads are more likely to be in an advantageous labor
market state (salaried formal employee and advantageous self-employed--both agricultural and
Variables
AGE 0.008 *** 0.009 *** 0.007 *** 0.017 *** 0.000 *** 0.000 *** -0.002 *** 0.000 -0.001 *** -0.034 *** -0.004 ***AGE_squared 0.000 *** 0.000 *** 0.000 *** 0.000 *** 0.000 *** 0.000 *** 0.000 *** 0.000 *** 0.000 *** 0.000 *** 0.000 ***Education level 0.010 *** 0.001 *** 0.002 *** -0.002 *** 0.000 *** 0.000 *** 0.002 *** 0.002 *** 0.000 *** -0.016 *** 0.001 ***Head of household 0.004 *** -0.024 *** 0.053 *** 0.082 *** 0.002 *** 0.007 *** -0.061 *** -0.005 *** -0.001 *** -0.030 *** -0.028 ***Spouse -0.017 *** -0.113 *** 0.016 *** 0.020 *** -0.001 *** 0.000 -0.022 *** -0.018 *** -0.002 *** 0.195 *** -0.059 ***High population density area 0.024 *** 0.031 *** 0.008 *** 0.017 *** -0.001 *** -0.003 *** -0.002 0.006 *** 0.001 *** -0.090 *** 0.010 ***Age 6 or younger -0.005 *** -0.020 *** -0.001 0.000 0.000 0.000 ** -0.007 *** -0.003 *** 0.000 *** 0.042 *** -0.008 ***Age 7 to 18 -0.002 *** 0.004 *** 0.001 *** -0.001 0.000 *** 0.001 *** 0.002 *** 0.000 0.000 *** -0.003 *** -0.002 ***Age 19 to 65 0.002 *** -0.002 ** 0.000 -0.017 *** 0.000 ** -0.001 *** -0.001 ** 0.000 0.000 * 0.019 *** 0.001 **Age 65+ -0.003 *** -0.011 *** 0.001 0.000 0.000 0.000 -0.009 *** -0.002 *** 0.000 0.019 *** 0.005 ***Tubed w ater inside dw elling 0.030 *** 0.044 *** 0.020 *** 0.038 *** -0.001 ** -0.003 *** 0.001 -0.004 ** 0.000 *** -0.122 *** -0.004Electricity 0.000 -0.048 *** 0.023 *** 0.016 *** 0.000 0.000 0.010 *** -0.004 *** 0.000 *** 0.001 0.000Water 0.007 *** 0.000 0.010 *** 0.001 0.000 ** -0.001 *** 0.005 *** 0.001 *** 0.000 *** -0.023 *** 0.001d09 -0.004 *** -0.002 0.001 0.003 0.000 0.000 0.001 0.003 *** 0.000 0.003 -0.005 ***d10 -0.005 *** 0.002 0.002 -0.008 * 0.000 0.001 ** 0.000 0.005 *** 0.000 0.007 -0.004 **d11 -0.007 *** 0.006 * 0.001 -0.005 0.000 0.002 *** 0.002 0.002 ** 0.000 0.006 -0.007 ***d12 -0.007 *** 0.011 *** 0.001 -0.004 0.000 0.001 0.003 * 0.002 * 0.000 0.000 -0.007 ***
Unpaid Worker
UnemployedNLF -
StudentNLF -
DomesticInactive
Formal (salaried)
Informal (salaried)
Advantegous NASE
Unfavorable NASE
Advantegous ASE
Unfavorable ASE
Variables
AGE 0.019 *** -0.011 *** 0.008 *** 0.004 *** 0.001 *** 0.000 -0.007 *** -0.007 *** 0.000 *** -0.001 *** -0.005 ***AGE_squared 0.000 *** 0.000 *** 0.000 *** 0.000 *** 0.000 *** 0.000 *** 0.000 *** 0.000 *** 0.000 *** 0.000 *** 0.000 ***Education level 0.025 *** -0.016 *** 0.005 *** 0.001 *** -0.003 *** -0.011 *** -0.001 *** 0.001 * 0.000 *** 0.000 -0.001 ***Head of household 0.087 *** 0.028 *** 0.058 *** 0.008 *** 0.034 *** 0.044 *** -0.100 *** -0.042 *** 0.000 *** -0.010 *** -0.106 ***Spouse 0.077 *** -0.003 0.048 *** -0.002 0.007 ** 0.018 *** -0.024 *** -0.055 *** 0.000 *** -0.007 *** -0.059 ***High population density area 0.084 *** -0.034 *** 0.014 *** 0.022 *** -0.030 *** -0.067 *** -0.021 *** 0.015 *** 0.000 *** 0.001 0.015 ***Age 6 or younger 0.005 *** 0.010 *** 0.004 *** 0.001 0.002 *** 0.005 *** -0.006 *** -0.010 *** 0.000 *** -0.002 *** -0.011 ***Age 7 to 18 -0.003 *** 0.002 ** 0.000 -0.008 *** 0.004 *** 0.005 *** 0.005 *** 0.000 0.000 *** -0.001 * -0.004 ***Age 19 to 65 0.015 *** -0.014 *** -0.002 *** -0.009 *** 0.001 *** 0.000 0.005 *** 0.004 *** 0.000 *** 0.000 0.000Age 65+ -0.010 *** -0.011 *** 0.002 -0.007 *** 0.002 *** 0.010 *** 0.006 *** 0.004 ** 0.000 * 0.000 0.004 ***Tubed w ater inside dw elling 0.078 *** -0.031 *** 0.029 *** 0.017 *** -0.014 *** -0.053 *** -0.028 *** -0.001 0.000 *** 0.000 0.005Electricity 0.014 *** -0.098 *** 0.030 *** 0.007 *** 0.011 *** 0.001 0.007 *** 0.001 0.000 *** 0.002 ** 0.026 ***Water 0.020 *** -0.045 *** 0.013 *** 0.006 *** -0.003 *** -0.006 *** -0.002 0.007 *** 0.000 *** 0.002 * 0.008 ***d09 -0.013 *** -0.032 *** 0.002 0.001 0.002 0.007 *** 0.004 *** 0.025 *** 0.000 ** 0.002 * 0.001d10 -0.016 *** -0.002 0.002 0.003 0.001 0.002 0.002 0.007 * 0.000 *** 0.003 * -0.001d11 -0.015 *** -0.004 0.004 ** -0.001 0.005 *** 0.006 ** 0.006 *** 0.003 0.000 * -0.001 -0.002d12 -0.018 *** 0.018 *** 0.001 -0.005 ** 0.005 *** 0.009 *** 0.007 *** -0.006 * 0.000 * -0.003 *** -0.007 ***
Unpaid Worker
UnemployedNLF -
StudentNLF -
DomesticInactive
Formal (salaried)
Informal (salaried)
Advantegous NASE
Unfavorable NASE
Advantegous ASE
Unfavorable ASE
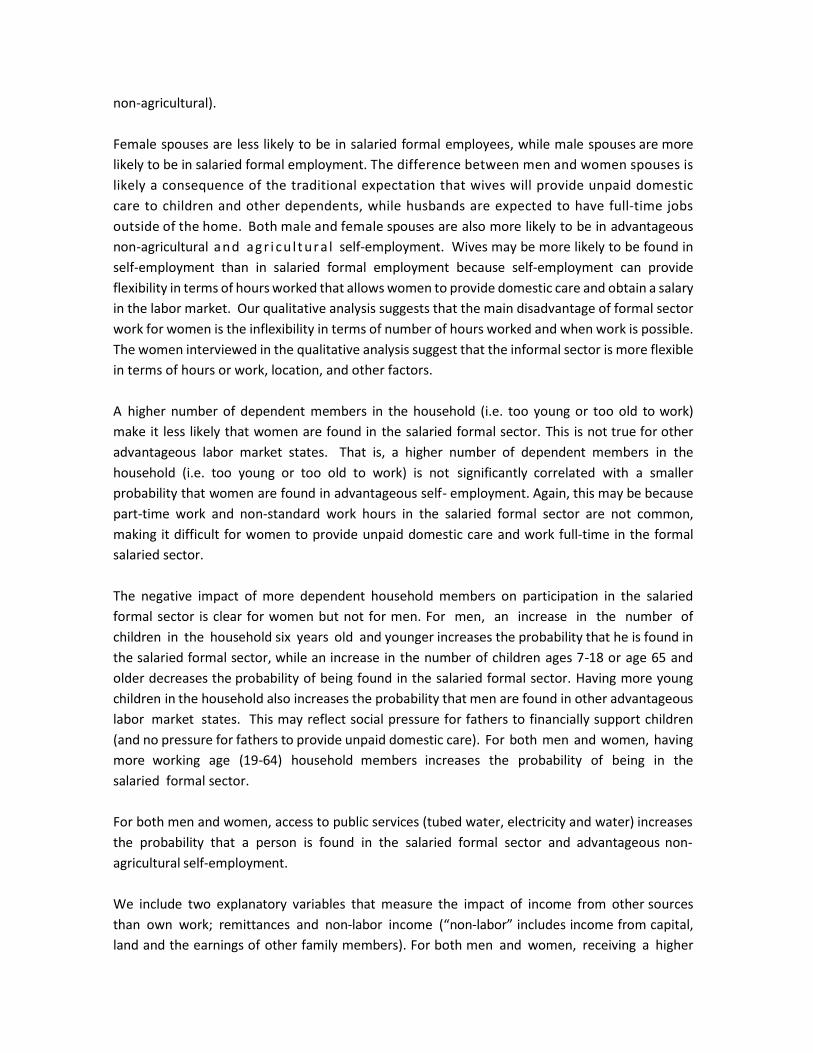
non-agricultural).
Female spouses are less likely to be in salaried formal employees, while male spouses are more
likely to be in salaried formal employment. The difference between men and women spouses is
likely a consequence of the traditional expectation that wives will provide unpaid domestic
care to children and other dependents, while husbands are expected to have full-time jobs
outside of the home. Both male and female spouses are also more likely to be in advantageous
non-agricultural and ag r i cu l t ur a l self-employment. Wives may be more likely to be found in
self-employment than in salaried formal employment because self-employment can provide
flexibility in terms of hours worked that allows women to provide domestic care and obtain a salary
in the labor market. Our qualitative analysis suggests that the main disadvantage of formal sector
work for women is the inflexibility in terms of number of hours worked and when work is possible.
The women interviewed in the qualitative analysis suggest that the informal sector is more flexible
in terms of hours or work, location, and other factors.
A higher number of dependent members in the household (i.e. too young or too old to work)
make it less likely that women are found in the salaried formal sector. This is not true for other
advantageous labor market states. That is, a higher number of dependent members in the
household (i.e. too young or too old to work) is not significantly correlated with a smaller
probability that women are found in advantageous self- employment. Again, this may be because
part-time work and non-standard work hours in the salaried formal sector are not common,
making it difficult for women to provide unpaid domestic care and work full-time in the formal
salaried sector.
The negative impact of more dependent household members on participation in the salaried
formal sector is clear for women but not for men. For men, an increase in the number of
children in the household six years old and younger increases the probability that he is found in
the salaried formal sector, while an increase in the number of children ages 7-18 or age 65 and
older decreases the probability of being found in the salaried formal sector. Having more young
children in the household also increases the probability that men are found in other advantageous
labor market states. This may reflect social pressure for fathers to financially support children
(and no pressure for fathers to provide unpaid domestic care). For both men and women, having
more working age (19-64) household members increases the probability of being in the
salaried formal sector.
For both men and women, access to public services (tubed water, electricity and water) increases
the probability that a person is found in the salaried formal sector and advantageous non-
agricultural self-employment.
We include two explanatory variables that measure the impact of income from other sources
than own work; remittances and non-labor income (“non-labor” includes income from capital,
land and the earnings of other family members). For both men and women, receiving a higher
level of remittances and other non-labor income decreases the probability of being a formal
or informal sector employee. Quantitatively, the negative impact of remittances on the
probability of formal sector employment is larger for women than men. For men, receiving more
remittances increases the probability of being in advantageous self- employment (both non-
agricultural and agricultural) and decreases the probability of being in unfavorable non-
agricultural self-employment. For both men and women a higher level of non-labor income
increases the probability of being in advantageous non- agricultural self-employment and
decreases the probability of being in unfavorable self- employment. However, for women
receiving more remittances decreases the probability of being in advantageous non-agricultural
self-employment. For both men and women, receiving a higher level of remittances or other non-
labor income increases the probability that a person is not in the labor force (either a
student, in unpaid domestic work or other inactive). Taken all together, the evidence from
El Salvador suggests that remittances and other non-labor income reduce labor force
participation but promote advantageous self-employment (and reduce the probability of being
in unfavorable self-employment). This is true for both men and women.
The negative impact of remittances and other non-labor income on employment in the formal and
informal sectors is larger for women than men. It may be that women are more likely to leave
formal and informal employment for unpaid domestic care when non-labor income increases
because women are primarily responsible for the care of children and other unpaid domestic
responsibilities. Consistent with this hypothesis, remittances and other labor income have a bigger
positive impact on the probability that men will be found in advantageous non-agricultural self-
employment. To simplify, our evidence suggests that an increase in remittances and other non-
labor income “allows” workers to avoid or leave formal or informal employment, with men instead
becoming advantageous self-employed workers and women becoming full-time unpaid domestic
care providers.
4. Probabilities of transition
The major focus of this study is on the factors that influence women and men to work and the
places where they do, and in particular on what factors influence whether women
dynamically transition into advantageous labor market states. Using panel data we calculate the
probabilities of finding a person i in status j at time t+k, conditional on being in status z at time
t:
Pizj = Pr(Si,t+k = j | Sit = z) (2)
where Sit = the labor market state of individual i in time t.
We estimated matrices of probabilities of transitions into and out of the 11 labor market and
non-labor market states defined earlier. These 11 X 11 matrices were estimated separately
for men and women. The results are shown in F igure 3 , Table 5 and Table 6 , where the
rows represent the origin or the state in the previous period, and the columns represent the
destination status on the next period. The numbers presented in the main diagonal show the
number of people who did not move from any category (had no mobility); numbers off the
diagonal show the amount transitioned to the indicated state.
4.1. Women
Quantitatively, the most mobility among women is mobility to and from unpaid domestic
work; with 31 percent of women in unpaid domestic work in one year in a different state
the next year, and 30 percent of those in unpaid domestic work in one year who were not in
unpaid domestic work the year before. As noted below, there is very little mobility of men to
and from unpaid domestic work. This is an important difference between the labor market
mobility of men and women, and suggests that there policies that provide skills to women
currently in unpaid domestic work may be effective and efficient. There is also substantial
mobility of women to and from unfavorable non-agricultural self-employment and informal
salaried employment.
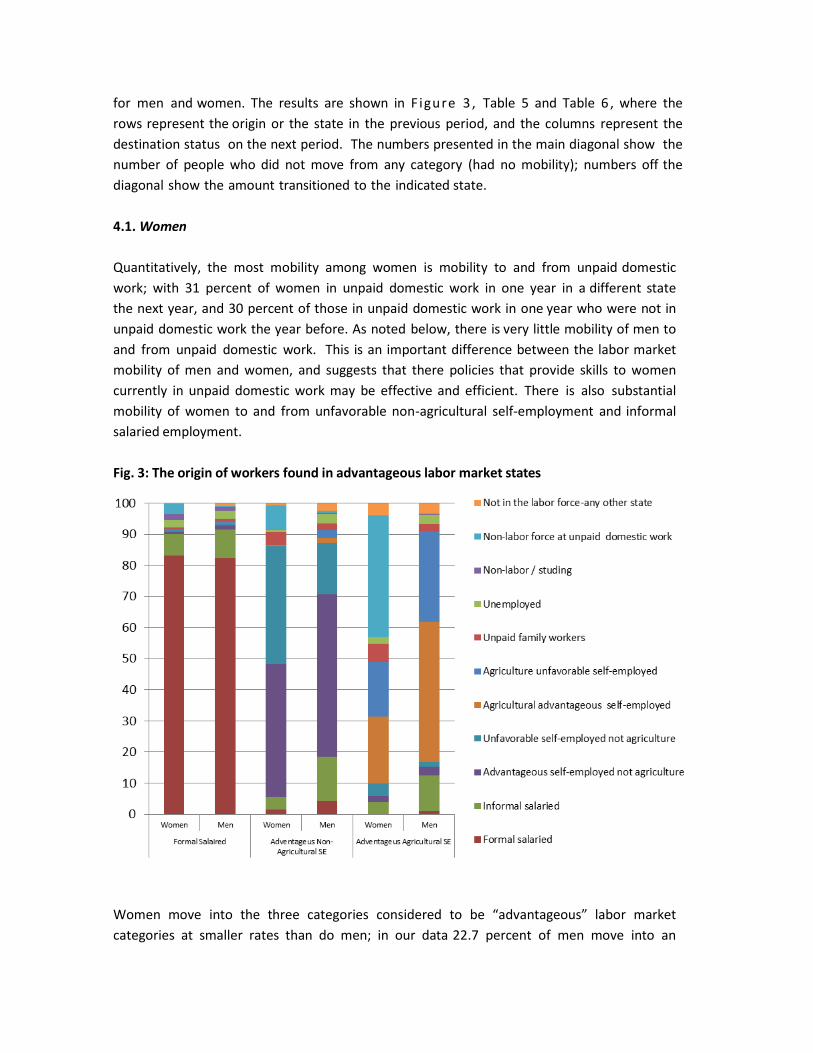
Fig. 3: The origin of workers found in advantageous labor market states
Women move into the three categories considered to be “advantageous” labor market
categories at smaller rates than do men; in our data 22.7 percent of men move into an
advantageous labor market state each year, while only 12 percent of women do. This suggests
that women do not fully participating in the benefits of economic growth in El Salvador.
The results in table 5 and figure 3 also indicate that women who work in formal salaried
employment have a high probability, 85.4 percent, of remaining in this category. Of those
women who enter formal salaried employment, most come from informal salaried employment
or from unpaid domestic work (see figure 3). Of those women who leave the salaried formal
sector most go to the informal sector.
There is much less stability in non-agricultural advantageous self-employment than there is in
salaried formal employment. Fewer than 50% of women who are in advantageous non-agricultural
self-employment in one year are also found in that sector in the next year. Men are significantly
more likely to remain in advantageous non- agricultural self-employment from one year to the
next compared to women. Of those women who transition into advantageous non-agricultural self-
employment, most come from unfavorable non-agricultural self-employment (see Figure 3).
Unpaid domestic work is the next largest source of women who transition into advantageous non-
agricultural self-employment. Of women who transition out of advantageous non- agricultural self-
employment, most go into unfavorable non-agricultural self- employment or into unpaid domestic
work.
Very few women transition into advantageous agricultural self-employment. This state is
dominated by men.
Most women do not remain unemployed for long; 85% of women who are unemployed in one year
are not unemployed the next. Unemployed women are most likely to leave the labor force and
become unpaid domestic workers or informal sector employees.
4.2. Men
Overall, men exhibit higher mobility than women. As with women, the most significant mobility
among men is into and out of informal salaried employment, with 24.1 percent of men in that
sector in one year leaving it the next year, and 25 percent of those found in that sector in one
year coming from a different sector the year before. As with women, the least mobile men are
salaried formal employees; 83 percent of male salaried formal employees remained in that sector
from one year to the next.
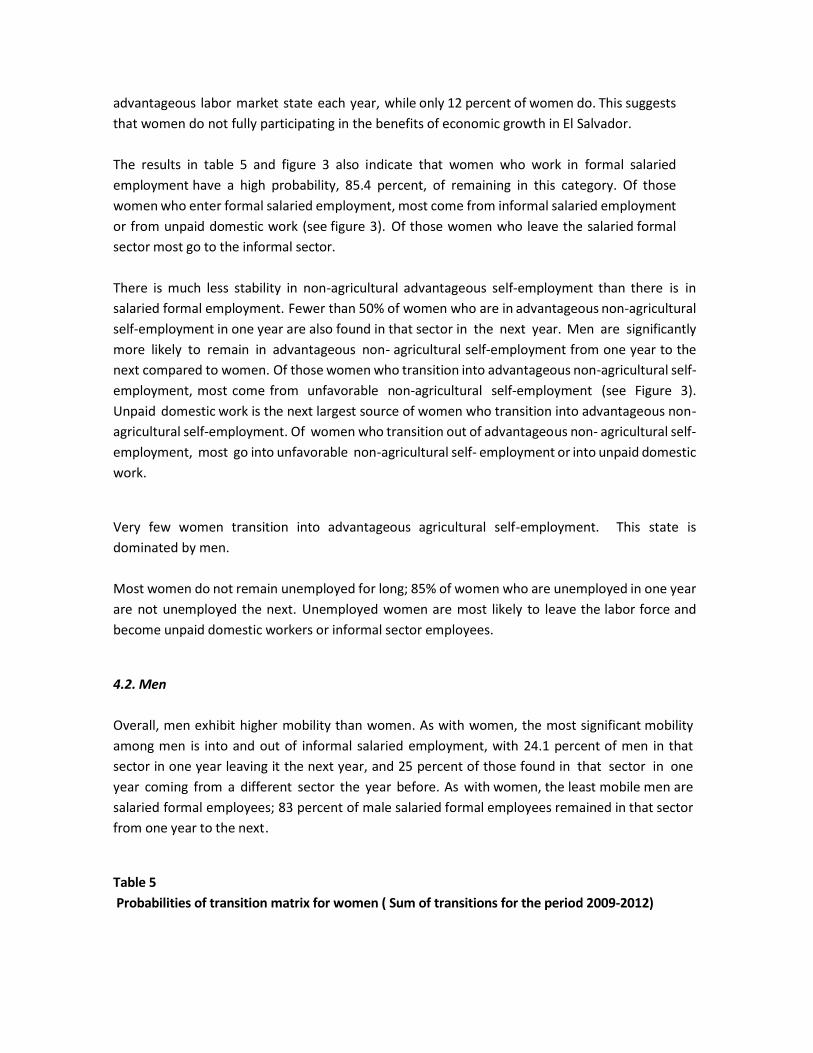
Table 5
Probabilities of transition matrix for women ( Sum of transitions for the period 2009-2012)
Source: For each stata, the first row show the number of observation un each transition, the second row
should the probabilities that in status j at time t+k conditional on being in status Z at time t, the third row
shows the probabilities that an individual in status j at time t+k was in status z a time t.
When men do leave formal sector employment, they are most likely to transition into informal
sector employment or unemployment. Unlike for women, very few men leave formal sector
employment each year to enter unpaid domestic work. Of those men who enter formal
salaried employment, most come from informal salaried employment (see Figure 3). Unlike
women, very few men enter salaried formal employment from unpaid domestic work
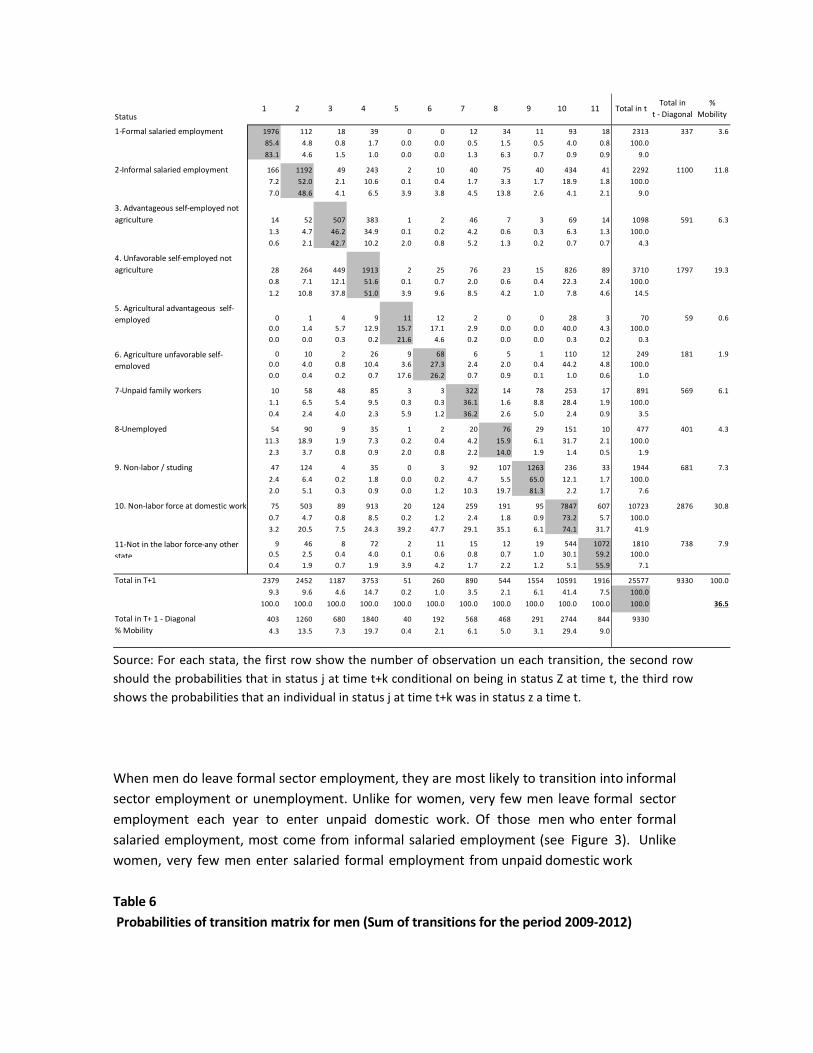
Table 6
Probabilities of transition matrix for men (Sum of transitions for the period 2009-2012)
Status1 2 3 4 5 6 7 8 9 10 11 Total in t
Total in
t - Diagonal
%
Mobility
1-Formal salaried employment 1976 112 18 39 0 0 12 34 11 93 18 2313 337 3.6
85.4 4.8 0.8 1.7 0.0 0.0 0.5 1.5 0.5 4.0 0.8 100.0
83.1 4.6 1.5 1.0 0.0 0.0 1.3 6.3 0.7 0.9 0.9 9.0
2-Informal salaried employment 166 1192 49 243 2 10 40 75 40 434 41 2292 1100 11.8
7.2 52.0 2.1 10.6 0.1 0.4 1.7 3.3 1.7 18.9 1.8 100.0
7.0 48.6 4.1 6.5 3.9 3.8 4.5 13.8 2.6 4.1 2.1 9.0
3. Advantageous self-employed not
agriculture 14 52 507 383 1 2 46 7 3 69 14 1098 591 6.3
1.3 4.7 46.2 34.9 0.1 0.2 4.2 0.6 0.3 6.3 1.3 100.0
0.6 2.1 42.7 10.2 2.0 0.8 5.2 1.3 0.2 0.7 0.7 4.3
4. Unfavorable self-employed not
agriculture 28 264 449 1913 2 25 76 23 15 826 89 3710 1797 19.3
0.8 7.1 12.1 51.6 0.1 0.7 2.0 0.6 0.4 22.3 2.4 100.0
1.2 10.8 37.8 51.0 3.9 9.6 8.5 4.2 1.0 7.8 4.6 14.5
0 1 4 9 11 12 2 0 0 28 3 70 59 0.6
0.0 1.4 5.7 12.9 15.7 17.1 2.9 0.0 0.0 40.0 4.3 100.0
0.0 0.0 0.3 0.2 21.6 4.6 0.2 0.0 0.0 0.3 0.2 0.3
0 10 2 26 9 68 6 5 1 110 12 249 181 1.9
0.0 4.0 0.8 10.4 3.6 27.3 2.4 2.0 0.4 44.2 4.8 100.0
0.0 0.4 0.2 0.7 17.6 26.2 0.7 0.9 0.1 1.0 0.6 1.0
7-Unpaid family workers 10 58 48 85 3 3 322 14 78 253 17 891 569 6.1
1.1 6.5 5.4 9.5 0.3 0.3 36.1 1.6 8.8 28.4 1.9 100.0
0.4 2.4 4.0 2.3 5.9 1.2 36.2 2.6 5.0 2.4 0.9 3.5
8-Unemployed 54 90 9 35 1 2 20 76 29 151 10 477 401 4.3
11.3 18.9 1.9 7.3 0.2 0.4 4.2 15.9 6.1 31.7 2.1 100.0
2.3 3.7 0.8 0.9 2.0 0.8 2.2 14.0 1.9 1.4 0.5 1.9
9. Non-labor / studing 47 124 4 35 0 3 92 107 1263 236 33 1944 681 7.3
2.4 6.4 0.2 1.8 0.0 0.2 4.7 5.5 65.0 12.1 1.7 100.0
2.0 5.1 0.3 0.9 0.0 1.2 10.3 19.7 81.3 2.2 1.7 7.6
10. Non-labor force at domestic work 75 503 89 913 20 124 259 191 95 7847 607 10723 2876 30.8
0.7 4.7 0.8 8.5 0.2 1.2 2.4 1.8 0.9 73.2 5.7 100.0
3.2 20.5 7.5 24.3 39.2 47.7 29.1 35.1 6.1 74.1 31.7 41.9
9 46 8 72 2 11 15 12 19 544 1072 1810 738 7.9
0.5 2.5 0.4 4.0 0.1 0.6 0.8 0.7 1.0 30.1 59.2 100.0
0.4 1.9 0.7 1.9 3.9 4.2 1.7 2.2 1.2 5.1 55.9 7.1
Total in T+1 2379 2452 1187 3753 51 260 890 544 1554 10591 1916 25577 9330 100.0
9.3 9.6 4.6 14.7 0.2 1.0 3.5 2.1 6.1 41.4 7.5 100.0
100.0 100.0 100.0 100.0 100.0 100.0 100.0 100.0 100.0 100.0 100.0 100.0 36.5
Total in T+ 1 - Diagonal 403 1260 680 1840 40 192 568 468 291 2744 844 9330
% Mobility 4.3 13.5 7.3 19.7 0.4 2.1 6.1 5.0 3.1 29.4 9.0
5. Agricultural advantageous self-
employed
6. Agriculture unfavorable self-
employed
11-Not in the labor force-any other
state
Source: For each stata, the first row show the number of observation un each transition, the second row
should the probabilities that in status j at time t+k conditional on being in status Z at time t, the third row
shows the probabilities that an individual in status j at time t+k was in status z a time t.
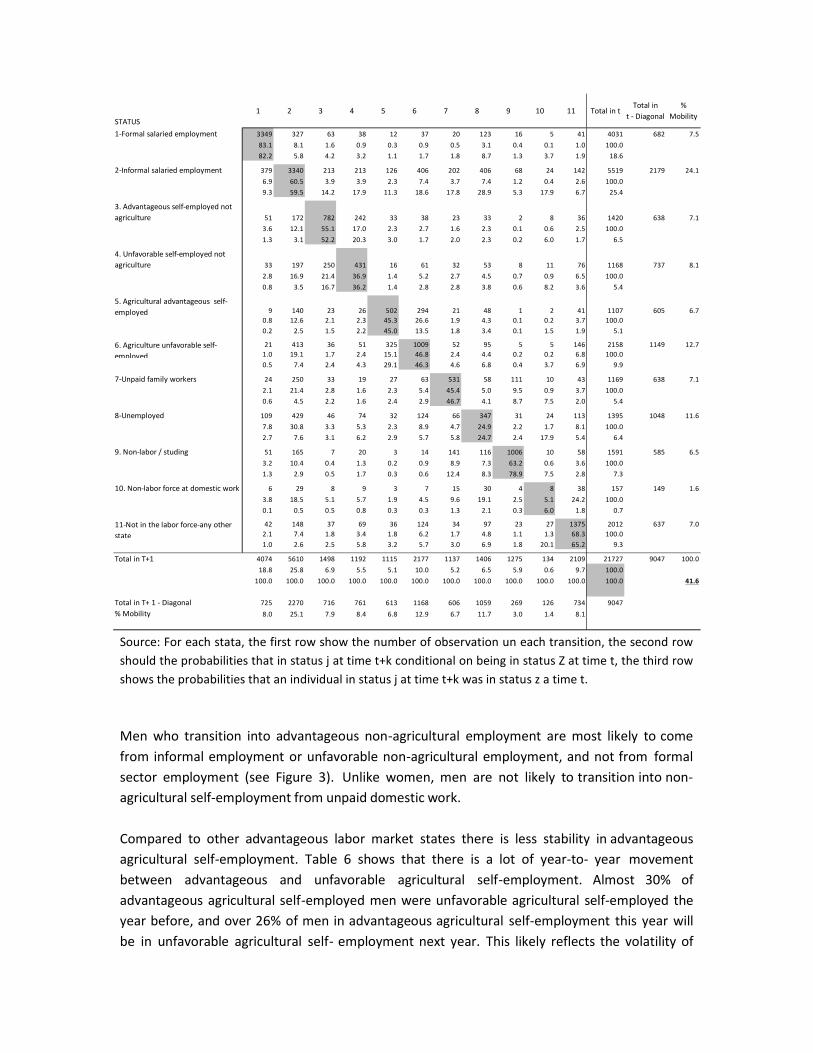
Men who transition into advantageous non-agricultural employment are most likely to come
from informal employment or unfavorable non-agricultural employment, and not from formal
sector employment (see Figure 3). Unlike women, men are not likely to transition into non-
agricultural self-employment from unpaid domestic work.
Compared to other advantageous labor market states there is less stability in advantageous
agricultural self-employment. Table 6 shows that there is a lot of year-to- year movement
between advantageous and unfavorable agricultural self-employment. Almost 30% of
advantageous agricultural self-employed men were unfavorable agricultural self-employed the
year before, and over 26% of men in advantageous agricultural self-employment this year will
be in unfavorable agricultural self- employment next year. This likely reflects the volatility of
STATUS
1 2 3 4 5 6 7 8 9 10 11 Total in tTotal in
t - Diagonal
%
Mobility
1-Formal salaried employment 3349 327 63 38 12 37 20 123 16 5 41 4031 682 7.5
83.1 8.1 1.6 0.9 0.3 0.9 0.5 3.1 0.4 0.1 1.0 100.0
82.2 5.8 4.2 3.2 1.1 1.7 1.8 8.7 1.3 3.7 1.9 18.6
2-Informal salaried employment 379 3340 213 213 126 406 202 406 68 24 142 5519 2179 24.1
6.9 60.5 3.9 3.9 2.3 7.4 3.7 7.4 1.2 0.4 2.6 100.0
9.3 59.5 14.2 17.9 11.3 18.6 17.8 28.9 5.3 17.9 6.7 25.4
3. Advantageous self-employed not
agriculture 51 172 782 242 33 38 23 33 2 8 36 1420 638 7.1
3.6 12.1 55.1 17.0 2.3 2.7 1.6 2.3 0.1 0.6 2.5 100.0
1.3 3.1 52.2 20.3 3.0 1.7 2.0 2.3 0.2 6.0 1.7 6.5
4. Unfavorable self-employed not
agriculture 33 197 250 431 16 61 32 53 8 11 76 1168 737 8.1
2.8 16.9 21.4 36.9 1.4 5.2 2.7 4.5 0.7 0.9 6.5 100.0
0.8 3.5 16.7 36.2 1.4 2.8 2.8 3.8 0.6 8.2 3.6 5.4
9 140 23 26 502 294 21 48 1 2 41 1107 605 6.7
0.8 12.6 2.1 2.3 45.3 26.6 1.9 4.3 0.1 0.2 3.7 100.0
0.2 2.5 1.5 2.2 45.0 13.5 1.8 3.4 0.1 1.5 1.9 5.1
21 413 36 51 325 1009 52 95 5 5 146 2158 1149 12.7
1.0 19.1 1.7 2.4 15.1 46.8 2.4 4.4 0.2 0.2 6.8 100.0
0.5 7.4 2.4 4.3 29.1 46.3 4.6 6.8 0.4 3.7 6.9 9.9
7-Unpaid family workers 24 250 33 19 27 63 531 58 111 10 43 1169 638 7.1
2.1 21.4 2.8 1.6 2.3 5.4 45.4 5.0 9.5 0.9 3.7 100.0
0.6 4.5 2.2 1.6 2.4 2.9 46.7 4.1 8.7 7.5 2.0 5.4
8-Unemployed 109 429 46 74 32 124 66 347 31 24 113 1395 1048 11.6
7.8 30.8 3.3 5.3 2.3 8.9 4.7 24.9 2.2 1.7 8.1 100.0
2.7 7.6 3.1 6.2 2.9 5.7 5.8 24.7 2.4 17.9 5.4 6.4
9. Non-labor / studing 51 165 7 20 3 14 141 116 1006 10 58 1591 585 6.5
3.2 10.4 0.4 1.3 0.2 0.9 8.9 7.3 63.2 0.6 3.6 100.0
1.3 2.9 0.5 1.7 0.3 0.6 12.4 8.3 78.9 7.5 2.8 7.3
10. Non-labor force at domestic work 6 29 8 9 3 7 15 30 4 8 38 157 149 1.6
3.8 18.5 5.1 5.7 1.9 4.5 9.6 19.1 2.5 5.1 24.2 100.0
0.1 0.5 0.5 0.8 0.3 0.3 1.3 2.1 0.3 6.0 1.8 0.7
42 148 37 69 36 124 34 97 23 27 1375 2012 637 7.0
2.1 7.4 1.8 3.4 1.8 6.2 1.7 4.8 1.1 1.3 68.3 100.0
1.0 2.6 2.5 5.8 3.2 5.7 3.0 6.9 1.8 20.1 65.2 9.3
Total in T+1 4074 5610 1498 1192 1115 2177 1137 1406 1275 134 2109 21727 9047 100.0
18.8 25.8 6.9 5.5 5.1 10.0 5.2 6.5 5.9 0.6 9.7 100.0
100.0 100.0 100.0 100.0 100.0 100.0 100.0 100.0 100.0 100.0 100.0 100.0 41.6
Total in T+ 1 - Diagonal 725 2270 716 761 613 1168 606 1059 269 126 734 9047
% Mobility 8.0 25.1 7.9 8.4 6.8 12.9 6.7 11.7 3.0 1.4 8.1
5. Agricultural advantageous self-
employed
6. Agriculture unfavorable self-
employed
11-Not in the labor force-any other
state
agricultural prices and therefore of earnings from agricultural self-employment.
In contrast with women, men tend to remain longer as unemployed, 24.9 percent of
unemployed men in one year are still unemployed in the next year. Of the men who transition
out of unemployment, most go into informal salaried employment. Unlike for women, very few
men transition from unemployment into unpaid domestic work or into any other non-labor
market state.
5. Determinants of the transitions into and out of a successful state
According to the literature, variables that measure human capital, family characteristics and the
characteristics of the job are important determinants of labor market transitions.
Those with more human capital (i.e. education and experience) are more likely to be in the labor
force, and if they work are more likely to be full-time formal sector employees (Duryea, Marqéz,
Pagés and Sarpetta, 2006; Bosch and Maloney, 2010; Cunningham and Bustos-Salvagno, 2011).
Workers with more experience (especially in the formal sector) are more likely to be successful
entrepreneurs (Cunningham and Bustos-Salvagno, 2011). Some studies suggest that human
capital is a more important factor in explaining the success in the case of women entrepreneurs
compared to men (Bardasi, Sabarwal and Terrell, 2010). Age is also important in determining
whether or where a person works. For example, younger workers are more likely to be
informal sector workers while owners/employers are more likely to be older (Bosch and Maloney,
2010).
It has been argued that the reasons for becoming self-employed are different for men and
women; specifically it has been argued that women become self-employed because they seek
more flexible work schedules (Delman and Davidson, 2000). To examine this possibility, other
explanatory variables will include some that describe the structure of the family, including the
number of infant children and marital status.
It has been found that the selection of economic activity differs between men and women
entrepreneurs. Women entrepreneurs are predominantly concentrated in service activities,
while men tend to be owners of companies engaged in manufacturing and construction activities
(Bardasi, Sabarwal and Terrell, 2010). It has also been shown that in developing economies,
women are less likely to operate in high-technology activities (Anna, et al. 1999). To examine
the role of the selection of economic activity as a determinant of advancement, the regressions
will include economic activity dummies as explanatory variables.
Next, we will examine the determinants of the transitions into and out of each advantageous
state by estimating probit models.
5.1. Entering an advantageous state
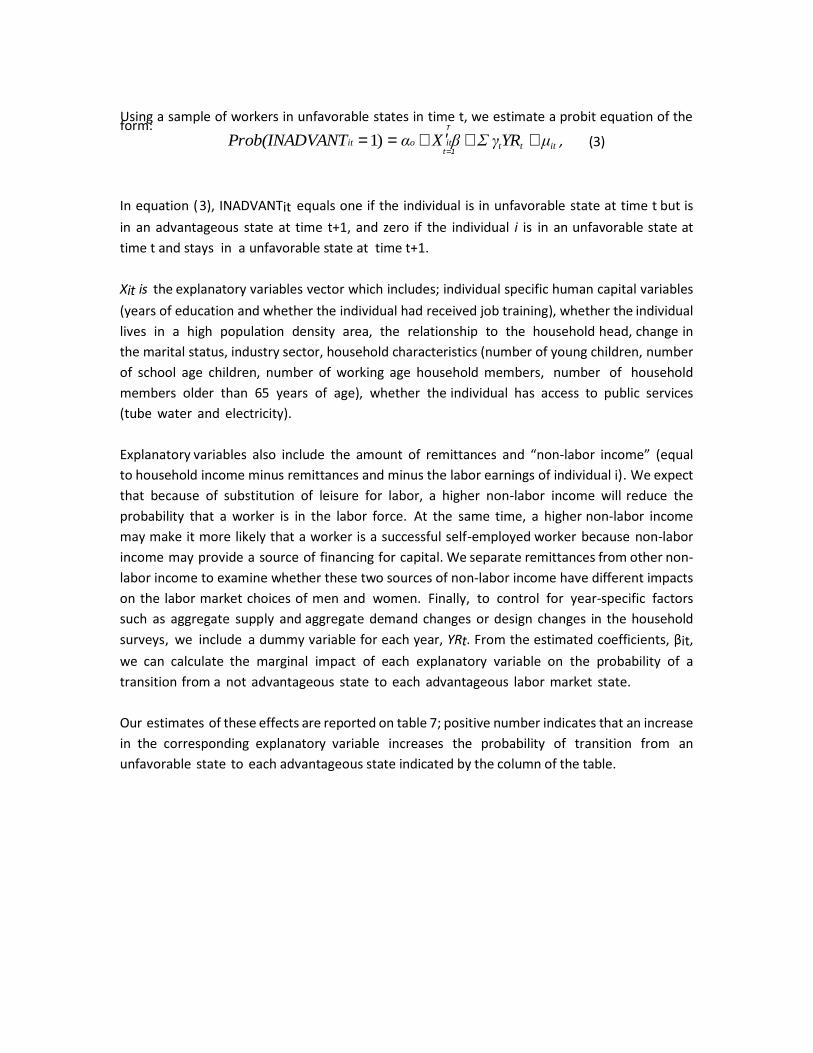
Using a sample of workers in unfavorable states in time t, we estimate a probit equation of the form: T
Prob(INADVANTit = 1) = αo + X ′itβ + Σ γtYRt + µit , (3) t=1
In equation (3), INADVANTit equals one if the individual is in unfavorable state at time t but is
in an advantageous state at time t+1, and zero if the individual i is in an unfavorable state at
time t and stays in a unfavorable state at time t+1.
Xit is the explanatory variables vector which includes; individual specific human capital variables
(years of education and whether the individual had received job training), whether the individual
lives in a high population density area, the relationship to the household head, change in
the marital status, industry sector, household characteristics (number of young children, number
of school age children, number of working age household members, number of household
members older than 65 years of age), whether the individual has access to public services
(tube water and electricity).
Explanatory variables also include the amount of remittances and “non-labor income” (equal
to household income minus remittances and minus the labor earnings of individual i). We expect
that because of substitution of leisure for labor, a higher non-labor income will reduce the
probability that a worker is in the labor force. At the same time, a higher non-labor income
may make it more likely that a worker is a successful self-employed worker because non-labor
income may provide a source of financing for capital. We separate remittances from other non-
labor income to examine whether these two sources of non-labor income have different impacts
on the labor market choices of men and women. Finally, to control for year-specific factors
such as aggregate supply and aggregate demand changes or design changes in the household
surveys, we include a dummy variable for each year, YRt. From the estimated coefficients, βit,
we can calculate the marginal impact of each explanatory variable on the probability of a
transition from a not advantageous state to each advantageous labor market state.
Our estimates of these effects are reported on table 7; positive number indicates that an increase
in the corresponding explanatory variable increases the probability of transition from an
unfavorable state to each advantageous state indicated by the column of the table.
5.1.a. Characteristics of those who transition from unfavorable states into advantageous non-
agricultural self-employment
• Older: For both men and women, the probability that someone moves up from an
unfavorable state to advantageous non-agricultural self-employed increases
with age, but at a decreasing rate. The probability of transitioning into advantageous
non-agricultural self-employment increases until men and women are about 48 years
old. After 48 years old, the probability of this transition decreases with age.
• More Education: For both men and women, a secondary education increases the
probability that someone moves up from an unfavorable state to advantageous non-
agricultural self-employed. For women, a completed primary education also helps. On
the other hand, obtaining additional tertiary (university) education
does not increase the probability of moving up into advantageous non- agricultural
self-employment beyond the benefit of a secondary education.
• Household heads: are more likely to transition into advantageous non- agricultural
self-employment; this is true for both men and women. Being a spouse of the
household head also increases the likelihood of a transition into non-agricultural self-
employment. This is also true for both men and women.
• Access to electricity: access to electricity increases the probability that both men and
women transition from an unfavorable state to advantageous non- agricultural self-
employed. Access to water or living in a high-density population area are not significant
determinants of transitioning into advantageous non- agricultural self-employment.
• Sector of employment: For both men and women, those who transition into
advantageous non-agricultural self-employment work in the industry sectors of
manufacturing and construction, commerce, and high complexity services. The
magnitude of the impacts of sector of employment are similar for men and
women except in high complexity services. The results presented in table 8 imply
that advantageous self-employed men are more likely than women to come from
high complexity services. This is consistent with Anna, et al. (1999), who presents
evidence that in developing economies, entrepreneurial women are less likely to operate
in high-technology activities.
Remittances and non-labor income: Higher non-labor income and remittances
increases the probability of a transition into advantageous non-agricultural self-
employment (although only the coefficient on non-labor income is statistically
significant). These results suggests that, in El Salvador, access to non-labor income to
finance capital for self-employment makes it more likely that for someone will become
an advantageous self-employed/employer.
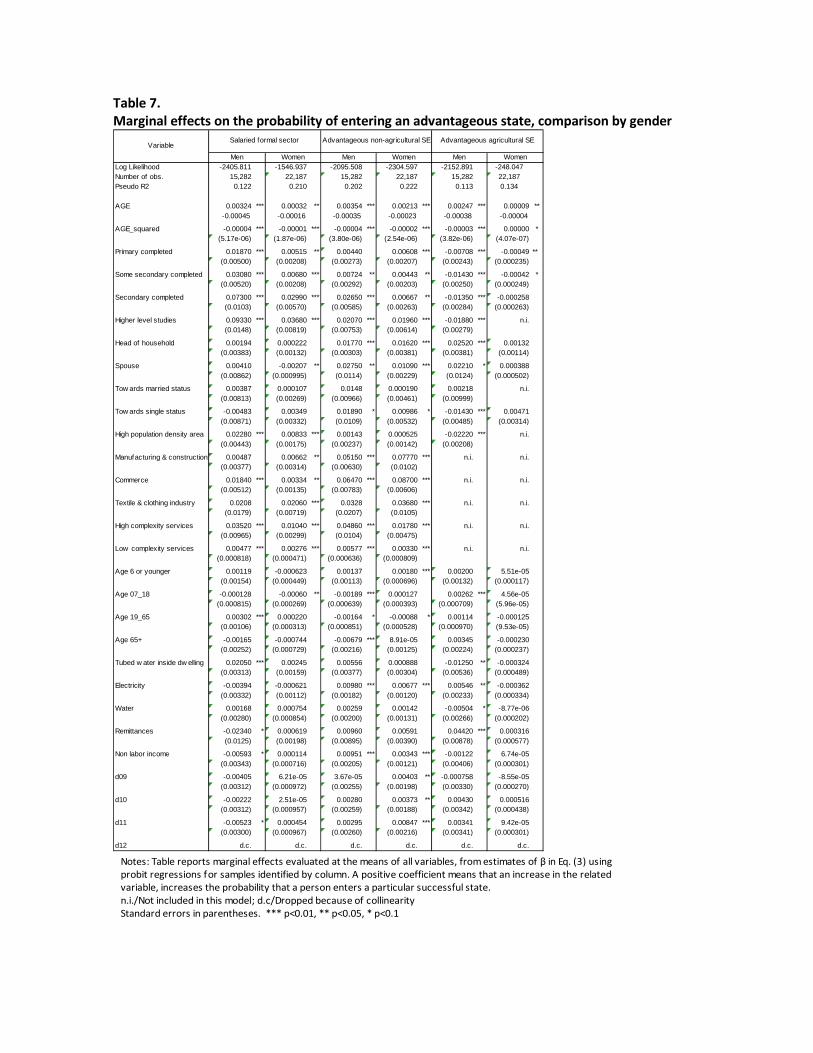
Table 7.
Marginal effects on the probability of entering an advantageous state, comparison by gender
Notes: Table reports marginal effects evaluated at the means of all variables, from estimates of β in Eq. (3) using
probit regressions f or samples identified by column. A positive coefficient means that an increase in the related
variable, increases the probability that a person enters a particular successful state.
n.i./Not included in this model; d.c/Dropped because of collinearity
Standard errors in parentheses. *** p<0.01, ** p<0.05, * p<0.1
Log Likelihood -2405.811 -1546.937 -2095.508 -2304.597 -2152.891 -248.047Number of obs. 15,282 22,187 15,282 22,187 15,282 22,187Pseudo R2 0.122 0.210 0.202 0.222 0.113 0.134
AGE 0.00324 *** 0.00032 ** 0.00354 *** 0.00213 *** 0.00247 *** 0.00009 **-0.00045 -0.00016 -0.00035 -0.00023 -0.00038 -0.00004
AGE_squared -0.00004 *** -0.00001 *** -0.00004 *** -0.00002 *** -0.00003 *** 0.00000 *(5.17e-06) (1.87e-06) (3.80e-06) (2.54e-06) (3.82e-06) (4.07e-07)
Primary completed 0.01870 *** 0.00515 ** 0.00440 0.00608 *** -0.00708 *** -0.00049 **(0.00500) (0.00208) (0.00273) (0.00207) (0.00243) (0.000235)
Some secondary completed 0.03080 *** 0.00680 *** 0.00724 ** 0.00443 ** -0.01430 *** -0.00042 *(0.00520) (0.00208) (0.00292) (0.00203) (0.00250) (0.000249)
Secondary completed 0.07300 *** 0.02990 *** 0.02650 *** 0.00667 ** -0.01350 *** -0.000258(0.0103) (0.00570) (0.00585) (0.00263) (0.00284) (0.000263)
Higher level studies 0.09330 *** 0.03680 *** 0.02070 *** 0.01960 *** -0.01880 *** n.i.(0.0148) (0.00819) (0.00753) (0.00614) (0.00279)
Head of household 0.00194 0.000222 0.01770 *** 0.01620 *** 0.02520 *** 0.00132(0.00383) (0.00132) (0.00303) (0.00381) (0.00381) (0.00114)
Spouse 0.00410 -0.00207 ** 0.02750 ** 0.01090 *** 0.02210 * 0.000388(0.00862) (0.000995) (0.0114) (0.00229) (0.0124) (0.000502)
Tow ards married status 0.00387 0.000107 0.0148 0.000190 0.00218 n.i.(0.00813) (0.00269) (0.00966) (0.00461) (0.00999)
Tow ards single status -0.00483 0.00349 0.01890 * 0.00986 * -0.01430 *** 0.00471(0.00871) (0.00332) (0.0109) (0.00532) (0.00485) (0.00314)
High population density area 0.02280 *** 0.00833 *** 0.00143 0.000525 -0.02220 *** n.i.(0.00443) (0.00175) (0.00237) (0.00142) (0.00208)
Manufacturing & construction 0.00487 0.00662 ** 0.05150 *** 0.07770 *** n.i. n.i.(0.00377) (0.00314) (0.00630) (0.0102)
Commerce 0.01840 *** 0.00334 ** 0.06470 *** 0.08700 *** n.i. n.i.(0.00512) (0.00135) (0.00783) (0.00606)
Textile & clothing industry 0.0208 0.02060 *** 0.0328 0.03680 *** n.i. n.i.(0.0179) (0.00719) (0.0207) (0.0105)
High complexity services 0.03520 *** 0.01040 *** 0.04860 *** 0.01780 *** n.i. n.i.(0.00965) (0.00299) (0.0104) (0.00475)
Low complexity services 0.00477 *** 0.00276 *** 0.00577 *** 0.00330 *** n.i. n.i.(0.000818) (0.000471) (0.000636) (0.000809)
Age 6 or younger 0.00119 -0.000623 0.00137 0.00180 *** 0.00200 5.51e-05(0.00154) (0.000449) (0.00113) (0.000696) (0.00132) (0.000117)
Age 07_18 -0.000128 -0.00060 ** -0.00189 *** 0.000127 0.00262 *** 4.56e-05(0.000815) (0.000269) (0.000639) (0.000393) (0.000709) (5.96e-05)
Age 19_65 0.00302 *** 0.000220 -0.00164 * -0.00088 * 0.00114 -0.000125(0.00106) (0.000313) (0.000851) (0.000528) (0.000970) (9.53e-05)
Age 65+ -0.00165 -0.000744 -0.00679 *** 8.91e-05 0.00345 -0.000230(0.00252) (0.000729) (0.00216) (0.00125) (0.00224) (0.000237)
Tubed w ater inside dw elling 0.02050 *** 0.00245 0.00556 0.000888 -0.01250 ** -0.000324(0.00313) (0.00159) (0.00377) (0.00304) (0.00536) (0.000489)
Electricity -0.00394 -0.000621 0.00980 *** 0.00677 *** 0.00546 ** -0.000362(0.00332) (0.00112) (0.00182) (0.00120) (0.00233) (0.000334)
Water 0.00168 0.000754 0.00259 0.00142 -0.00504 * -8.77e-06(0.00280) (0.000854) (0.00200) (0.00131) (0.00266) (0.000202)
Remittances -0.02340 * 0.000619 0.00960 0.00591 0.04420 *** 0.000316(0.0125) (0.00198) (0.00895) (0.00390) (0.00878) (0.000577)
Non labor income -0.00593 * 0.000114 0.00951 *** 0.00343 *** -0.00122 6.74e-05(0.00343) (0.000716) (0.00205) (0.00121) (0.00406) (0.000301)
d09 -0.00405 6.21e-05 3.67e-05 0.00403 ** -0.000758 -8.55e-05(0.00312) (0.000972) (0.00255) (0.00198) (0.00330) (0.000270)
d10 -0.00222 2.51e-05 0.00280 0.00373 ** 0.00430 0.000516(0.00312) (0.000957) (0.00259) (0.00188) (0.00342) (0.000438)
d11 -0.00523 * 0.000454 0.00295 0.00847 *** 0.00341 9.42e-05(0.00300) (0.000967) (0.00260) (0.00216) (0.00341) (0.000301)
d12 d.c. d.c. d.c. d.c. d.c. d.c.
Men Women Men Women Men Women
VariableSalaried formal sector Advantageous non-agricultural SE Advantageous agricultural SE
• Dependent family members: Surprisingly, table 8 presents no evidence that an increase
in the number of dependent family members reduces the probability that women
become advantageous self-employed workers or employers. On the other hand, there is
some evidence that an increase in the number of children 7-18 years and the number
of household members 65 years and older does significantly reduce the probability
that men transition into advantageous self- employment. This pattern may exist
because women with dependent family members are attracted by the flexibility of self-
employment, which can allow women to provide child care and other unpaid domestic
care while still earning an income. Consistent with this, an increase in the number of
children between 7 and 19 years old reduces the probability that women transition into
formal sector salaried employment, where there is little flexibility in terms of hours
worked. On the other hand, men in El Salvador are generally not expected to provide
unpaid domestic care, but are expected to financially support the family.
5.1.b. Characteristics of those who transition from unfavorable states into salaried
formal employment:
• Older: For both men and women, age increases the probability of transitioning into
salaried formal employment (although at a decreasing rate
with age). The probability of transitioning into salaried formal employment
increases with age until the late 30s for men and the 20s for women. After that,
the probability of transitioning into salaried formal employment decreases with
age.
• More education: For both men and women, more education increases the
probability of transitioning into salaried formal employment. The probability of
transitioning into salaried formal employment increases for each additional
education level. The magnitude of the coefficients on the education variables are
all higher for men than for women, suggesting that education is a more important
determinant promoting the transition into salaried formal employment for men
than women. This may be because educated women suffer a “penalty” compared to
men when searching for formal sector employment.
• Fewer school age children in households: For women, a larger number of
household members between 7 and 19 years old reduces the probability of
transitioning into salaried formal employment. As noted, this may reflect the
inflexibility of hours worked in salaried formal employment. Aside from this one
variable, the number of dependents in the household does not affect the probability
of transitioning into salaried formal employment.
• Remittances and other non-labor income: For men, but not women, remittances
and other non-labor income decreases the probability of transitioning into formal
salaried employment.
• Sector of Employment: Both men and women who transition into salaried formal
employment are very likely to have worked in high complexity services (compared
to agriculture, manufacturing and construction, commerce and low complexity
services). Women, but not men, who transition into salaried formal employment
are also more likely to have come from textile and clothing manufacture (possibly
because the large export and maquila sector in El Salvador disproportionately
employs women).
5.1.c. Characteristics of those who transition from unsuccessful states into
advantageous agricultural self-employment:
• Older: For both men and women, the probability that someone moves up from an
unsuccessful state to successful agricultural self-employed increases with age, but at a
decreasing rate .Fewer school-age children: For men only, an increase in the number of
school- age children makes the transition into successful agricultural self-employment less
likely. The number of dependent household members has no significant impact on the
probability that women transition into this sector
• Receiving remittances: increases the probability that men transition into
advantageous agricultural self-employment.
• Unlike transitions into other advantageous states, education does not promote the
transition into advantageous agricultural self-employment.
5.2 Leaving an advantageous state
Using a sample of workers in advantageous states in time t, we estimate a probit equation
of the form:
T
Prob(OUTADVANTit = 1) = αo + X ′itβ + Σ γtYRt + µit , (4) t =1
In equation 4, OUTADVANTit equals one if the individual i is in an advantageous state at time t
but is not in an advantageous state at time t+1, and zero if the individual i is in an advantageous
state at time t and stays in advantageous state at time t+1. Xit is the explanatory variables
vector which includes the same variables as equation 1. Also, to control for year-specific
factors such as aggregate supply and aggregate demand changes or design changes in the
household surveys, we include a dummy variable for each year, YRt. From the estimated
coefficients, βit, we can calculate the marginal impact of each explanatory variable on the
probability of a transition from each advantageous state to a not advantageous labor state.
Our estimates of these effects are reported on table 8.
A positive number in table 8 indicates that an increase in the corresponding explanatory variable,
increases the probability of transition from the advantageous states indicated in each column of
the table to a not advantageous state
5.2.a. Characteristics of those who transition out of advantageous non-agricultural self-
employment into an unfavorable state:
• Younger workers: especially the youngest workers are more likely to fall out of
advantageous non-agricultural self-employment.
• Less Education: for both men and women, having at least a secondary complete
education reduces the probability of transitioning out of advantageous non-
agricultural self-employment.
• More school-age children: for men, but not for women, an increase in the number of
young children (0-6 years old) makes it more likely to transition out of advantageous
non-agricultural self-employment. Surprisingly, the number of children or elderly
members of the household does not affect whether or not a women transitions out of
advantageous non-agricultural self-employment.
• Secondary family workers: Being a household head reduces the probability that an
advantageous non-agricultural self-employed worker will move out of that state,
although this is statistically significant only for men.
• Non-labor income: For both men and women, more non-labor income decreases the
probability that a worker transitions out of advantageous non-agricultural self-
employment. This suggests that non-labor income can help to finance the capital
necessary to maintain advantageous non-agricultural self-employment.
5.2.b. Characteristics of those who transition out of salaried formal employment into an
unfavorable state:
• Younger workers: especially the youngest workers are more likely to fall out of salaried
formal employment.
• Less Education: for both men and women a tertiary education reduces the probability of
a transition out of salaried formal employment. For men, but not women, having a
secondary education also significantly reduces the probability of transitioning out of
salaried formal employment.
• Household Head: Being a household head reduces the probability that male salaried
formal employee will move out of that sector. This variable is not
significant for women.
• Remittances and other non-labor income: For men, but not women, remittances and
other non-labor income increases the probability of transitioning out of formal
salaried employment. This suggests that higher remittances induce men to substitute
leisure for salaried formal employment.
• Sector of Employment: For both men and women, workers in low complexity services
and the textile and clothing industries are less likely to leave salaried formal
employment than are workers in agriculture.
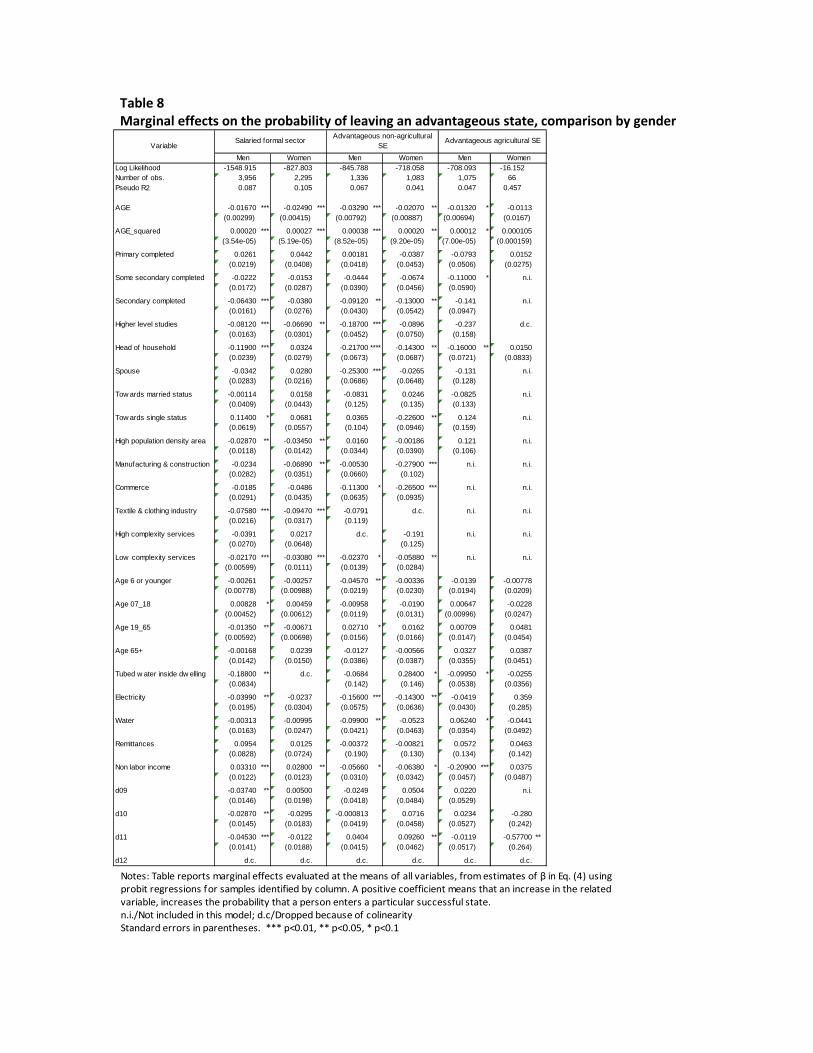
Table 8
Marginal effects on the probability of leaving an advantageous state, comparison by gender
Notes: Table reports marginal effects evaluated at the means of all variables, from estimates of β in Eq. (4) using
probit regressions f or samples identified by column. A positive coefficient means that an increase in the related
variable, increases the probability that a person enters a particular successful state.
n.i./Not included in this model; d.c/Dropped because of colinearity
Standard errors in parentheses. *** p<0.01, ** p<0.05, * p<0.1
Log Likelihood -1548.915 -827.803 -845.788 -718.058 -708.093 -16.152Number of obs. 3,956 2,295 1,336 1,083 1,075 66Pseudo R2 0.087 0.105 0.067 0.041 0.047 0.457
AGE -0.01670 *** -0.02490 *** -0.03290 *** -0.02070 ** -0.01320 * -0.0113(0.00299) (0.00415) (0.00792) (0.00887) (0.00694) (0.0167)
AGE_squared 0.00020 *** 0.00027 *** 0.00038 *** 0.00020 ** 0.00012 * 0.000105(3.54e-05) (5.19e-05) (8.52e-05) (9.20e-05) (7.00e-05) (0.000159)
Primary completed 0.0261 0.0442 0.00181 -0.0387 -0.0793 0.0152(0.0219) (0.0408) (0.0418) (0.0453) (0.0506) (0.0275)
Some secondary completed -0.0222 -0.0153 -0.0444 -0.0674 -0.11000 * n.i.(0.0172) (0.0287) (0.0390) (0.0456) (0.0590)
Secondary completed -0.06430 *** -0.0380 -0.09120 ** -0.13000 ** -0.141 n.i.(0.0161) (0.0276) (0.0430) (0.0542) (0.0947)
Higher level studies -0.08120 *** -0.06690 ** -0.18700 *** -0.0896 -0.237 d.c.(0.0163) (0.0301) (0.0452) (0.0750) (0.158)
Head of household -0.11900 *** 0.0324 -0.21700 **** -0.14300 ** -0.16000 ** 0.0150(0.0239) (0.0279) (0.0673) (0.0687) (0.0721) (0.0833)
Spouse -0.0342 0.0280 -0.25300 *** -0.0265 -0.131 n.i.(0.0283) (0.0216) (0.0686) (0.0648) (0.128)
Tow ards married status -0.00114 0.0158 -0.0831 0.0246 -0.0825 n.i.(0.0409) (0.0443) (0.125) (0.135) (0.133)
Tow ards single status 0.11400 * 0.0681 0.0365 -0.22600 ** 0.124 n.i.(0.0619) (0.0557) (0.104) (0.0946) (0.159)
High population density area -0.02870 ** -0.03450 ** 0.0160 -0.00186 0.121 n.i.(0.0118) (0.0142) (0.0344) (0.0390) (0.106)
Manufacturing & construction -0.0234 -0.06890 ** -0.00530 -0.27900 *** n.i. n.i.(0.0282) (0.0351) (0.0660) (0.102)
Commerce -0.0185 -0.0486 -0.11300 * -0.26500 *** n.i. n.i.(0.0291) (0.0435) (0.0635) (0.0935)
Textile & clothing industry -0.07580 *** -0.09470 *** -0.0791 d.c. n.i. n.i.(0.0216) (0.0317) (0.119)
High complexity services -0.0391 0.0217 d.c. -0.191 n.i. n.i.(0.0270) (0.0648) (0.125)
Low complexity services -0.02170 *** -0.03080 *** -0.02370 * -0.05880 ** n.i. n.i.(0.00599) (0.0111) (0.0139) (0.0284)
Age 6 or younger -0.00261 -0.00257 -0.04570 ** -0.00336 -0.0139 -0.00778(0.00778) (0.00988) (0.0219) (0.0230) (0.0194) (0.0209)
Age 07_18 0.00828 * 0.00459 -0.00958 -0.0190 0.00647 -0.0228(0.00452) (0.00612) (0.0119) (0.0131) (0.00996) (0.0247)
Age 19_65 -0.01350 ** -0.00671 0.02710 * 0.0162 0.00709 0.0481(0.00592) (0.00698) (0.0156) (0.0166) (0.0147) (0.0454)
Age 65+ -0.00168 0.0239 -0.0127 -0.00566 0.0327 0.0387(0.0142) (0.0150) (0.0386) (0.0387) (0.0355) (0.0451)
Tubed w ater inside dw elling -0.18800 ** d.c. -0.0684 0.28400 * -0.09950 * -0.0255(0.0834) (0.142) (0.146) (0.0538) (0.0356)
Electricity -0.03990 ** -0.0237 -0.15600 *** -0.14300 ** -0.0419 0.359(0.0195) (0.0304) (0.0575) (0.0636) (0.0430) (0.285)
Water -0.00313 -0.00995 -0.09900 ** -0.0523 0.06240 * -0.0441(0.0163) (0.0247) (0.0421) (0.0463) (0.0354) (0.0492)
Remittances 0.0954 0.0125 -0.00372 -0.00821 0.0572 0.0463(0.0828) (0.0724) (0.190) (0.130) (0.134) (0.142)
Non labor income 0.03310 *** 0.02800 ** -0.05660 * -0.06380 * -0.20900 *** 0.0375(0.0122) (0.0123) (0.0310) (0.0342) (0.0457) (0.0487)
d09 -0.03740 ** 0.00500 -0.0249 0.0504 0.0220 n.i.(0.0146) (0.0198) (0.0418) (0.0484) (0.0529)
d10 -0.02870 ** -0.0295 -0.000813 0.0716 0.0234 -0.280(0.0145) (0.0183) (0.0419) (0.0458) (0.0527) (0.242)
d11 -0.04530 *** -0.0122 0.0404 0.09260 ** -0.0119 -0.57700 **(0.0141) (0.0188) (0.0415) (0.0462) (0.0517) (0.264)
d12 d.c. d.c. d.c. d.c. d.c. d.c.
Men
Advantageous agricultural SE
Women
Salaried formal sectorAdvantageous non-agricultural
SE
Men Women Men Women
Variable

6. Conclusions and Policy Implications
Our work sheds light on the answers to two key questions: (1) what are the
characteristics of the men and women who move up to an advantageous labor market state from
an unfavorable one? and (2) what are the characteristics of the men and women who fall out
of advantageous labor market states into unfavorable ones? The answers to these questions can
contribute to the appropriate design and targeting of public policies interventions to promote
success in the labor market. Our work also sheds light on whether the characteristics correlated
with success in the labor market differ between women and men, and therefore whether the
appropriate design and targeting of policies is different for men and women
6.1 Summary of results
In general, in El Salvador men are more mobile than are women, over 22% of men change
states from one year to the next, compared to only 12% of women. There is substantial mobility
of both men and women into and out of advantageous non- agricultural self-employment. The
fact that it is possible to transition from a non-advantageous labor market state into advantageous
non-agricultural self-employment shows that there is a role for policies that promote the ability
of workers in non-advantageous states to transition into advantageous non-agricultural self-
employment.
On the other hand, there is very little mobility out of or into salaried formal sector employment;
85% of women and 83% of men stay in this sector from one year to the next. However, there is an
important number of women who move from formal salaried to unpaid domestic work.
What did the advantageous non-agricultural self-employed do before they became successful? For
men, those who transition into advantageous non-agricultural self- employment tend to come
from unfavorable non-agricultural self-employment and from informal salaried employment. For
women, those who transition into advantageous non-agricultural self-employment tend to come
from unpaid domestic work as well as from unfavorable non-agricultural self-employment and
informal salaried employment. Advantageous non-agricultural self-employed do not generally
come from the salaried formal sector.
What did formal sector salaried employees do before they became successful? Of the small
number of people who transition into formal salaried employment, most come from informal
salaried employment. For women there is also a flow from unpaid domestic care.
For both men and women, the most important characteristic promoting transitions into the two
non-agricultural advantageous labor market states sector is education. Any additional
education will increase the probability of transitioning into the salaried formal sector, although
tertiary education is the most advantageous for the salaried formal sector while a secondary
education is most advantageous for advantageous non-agricultural self-employment. Our results
suggest that, compared to women, education has a bigger impact on the ability of men to transition
into advantageous labor market states. This suggests that educated women may face a “penalty”
in searching for advantageous employment.
Both men and women who transition into formal salaried employment are likely to have worked
in high complexity services. It is likely that education is necessary for employment in high
complexity services, and that this is another indication of the importance of formal education in
obtain advantageous employment. Women, but not men, who transition into formal salaried
employment are also likely to come from textile and clothing manufacture, possibly because
the large export sector in El Salvador disproportionately hires women. Those who transition into
advantageous non-agricultural self-employment are also likely to work in the industry sectors of
manufacturing and construction, commerce and high complexity services. This is true for both
women and men, although men are more likely than women to come from high complexity
services
Very young workers are not likely to transition into advantageous non-agricultural self-
employment. It is most likely that a worker transitions into advantageous self-employment in their
30s or 40s. This suggests that workers who transition into advantageous self-employment obtain
experience before becoming successful as self-employed.
Remittances and other non-labor income promote advantageous non- agricultural self-
employment. Receiving more remittances and other non-labor income increases the probability
of transitioning into advantageous non-agricultural self- employment and decreases the
probability of transitioning out of this advantageous state. This is true for both men and women.
For men, receiving more remittances and other non-labor income decreases the probability of
transitioning into formal sector employment. In general, our results suggest that receiving more
remittances decreases the probability of transitioning into formal sector employment but
increases the probability of transitioning into advantageous self-employment. For women, an
increase in remittances and other non-labor income also increases the probability of leaving the
labor force for unpaid domestic care or other types of non-labor activity.
Access to electricity and other public services increases the probability that both men and women
transition from an unfavorable state into advantageous non-agricultural self-employment.
Female spouses are less likely to be in salaried formal employees, while male spouses are more
likely to be in salaried formal employment. A higher number of dependent members in the
household (i.e. too young or too old to work) make it less likely that women (but not men) are
found in the salaried formal sector. A higher number of dependent children (7-19 years old)
also reduce the probability that women (but not men) transition into formal salaried
employment. The difference between men and women is likely a consequence of the
traditional expectation that wives will provide unpaid domestic care to children and other
dependents, while husbands are expected to have full-time jobs outside of the home.
Surprisingly, the number of dependent family members does not have a significant influence
on the probability that women will transition into advantageous non- agricultural self-
employment. This may be because women are attracted to self-employment for the flexibility it
offers.
6.2 Policy implications of the results
This paper informs the debate on the question: What public policies would best support the ability
of women and men to become successful formal sector employees or successful small-scale
entrepreneurs? Our results suggest that these policies include the following:
1. The most advantageous labor market state is formal sector salaried employment. Those in this
state are the highest paid, have pensions and have access to Social Security medical care. Most
people enter this sector soon after graduating from school and remain in this sector for
a long time; very few older workers transition from non-advantageous labor market states into
formal salaried employment. Our results suggest that skills (i.e. formal education and job
training) are the most important factor promoting salaried formal employment. A post-secondary
education is particularly useful for obtaining formal salaried employment. Tertiary education
substantially increases the probability of a transition into salaried formal employment and
significantly reduces the probability of transitioning out of salaried formal employment.
2. Education is also important in promoting success for both men and women in other labor
market states (at least those outside of agriculture). For advantageous non-agricultural self-
employment, a secondary education is most important; a secondary education (but not a tertiary
education) significantly increases the probability of a successful transition into advantageous
non- agricultural self-employment. There should be clear efforts to reduce the school drop-out
rates, especially among girls, and to promote high-school completion through alternative
programs for those already outside the school system.
The focus of any policy to increase education levels will be on the young. Our results suggest that
it is not likely that older people who are in informal salaried employment, self-employed or are
in unpaid family care will transition into formal salaried employment, even if they obtain more
education. This suggests that most progress towards expanding “advantageous” employment,
especially formal salaried employment, will be intergenerational. That is, those currently self-
employed will not become formal sector employees, but their children may. We know that
education is the key to obtaining formal sector employment. This is especially true for girls, who
need to obtain education before they have children or get married. Once they are married or
have children, it becomes very difficult to complete education or to obtain advantageous
employment.
Adults, especially the currently self-employed, do receive short-term benefits from educating
children. For example, educated children can provide financial support for self-employment or in
non-labor market states. This suggests that a policy of promoting the education of children can
also be thought of as a policy of promoting the welfare of their parents (who might be currently
self-employed), not only as a policy of promoting the welfare of the children. This suggests that
allocating public funds to educating children, and especially to making sure that girls stay in
school, may be the most effective use of public funds if the goal is to expand the number of adults
in “advantageous” labor market states. For example, a policy promoting the education of poor
children may be more effective than policies to “entrepreneurship” skills to adults. This also
suggests that it is counterproductive to promote “entrepreneurship” training to children in
primary or secondary schools, especially if these programs encourage children to leave school
early in order to start their own businesses (which are not likely to succeed). In order to expand
advantageous employment, it is more important to keep children in school (especially to obtain
some post-secondary education) than to train them to leave school to start their own businesses.
3. Education does not matter in agricultural self-employment. That is, it does not promote
advantageous agricultural self-employment. However, education children in rural areas will make
it more likely that these children find better employment as formal salaried employees or non-
agricultural self-employment.
4. There is substantial year-to-year movement up from less successful labor market states
into advantageous non-agricultural self-employment. The fact that it is possible to transition from
a non-advantageous labor market state into advantageous non-agricultural self-employment
suggests that there is a role for policies that promote the ability of workers in non-advantageous
states to transition into advantageous non-agricultural self- employment.
Below we discuss some policies suggested by our results:
6. Both men and women are more likely to transition into advantageous non-agricultural self-
employment when they are older and have more working experience. Our results suggest
that older workers are most likely transition into advantageous self-employment; young
workers are not likely to transition into advantageous self-employment. Our results suggest that
policies to promote advantageous self- employment should be targeted towards older workers
who already have some relevant work experience.
7. While a tertiary education is an important prerequisite for success as a salaried formal
employee and secondary education is an important prerequisite for advantageous non-
agricultural self-employed/employer, our results suggest that policy interventions targeted to
current students that are designed to promote advantageous self-employment are not likely to
be effective. Very few students move directly from school to self-employment, and younger
workers are not likely to be advantageous self- employed workers. O ur results suggest that
programs designed specifically to teach the skills needed to be successful entrepreneurs are
better targeted to older workers currently working as informal sector employees, non-
advantageous self-employed workers or as unpaid family workers.
7. For both men and women, policies to promote advantageous non-agricultural self-
employment/employer should target those currently working as informal sector employees
or unfavorable non-agricultural self-employed and not salaried formal sector employees.
8. For women, there is also scope for policy intervention to promote the transition from unpaid
domestic work (not in the labor force) into advantageous self-employment. This suggests the
policy interventions should target women who are currently not in the labor force who are
engaged in unpaid domestic work. For example, providing quality childcare services, and
expanding access to initial and preschool education.
9. Since only around 30 percent of workers in El Salvador have a formal salaried work, and that 85
percent of women and 83 percent of men stay in this state from one year to the next, this implies
that to allow more individuals to move to this advantageous state, new jobs need to be created.
Therefore, policies to promote higher economic growth rates need to be implemented; this is
particularly important for women.
10. Providing access to public services (electricity, and education) promotes the transition into
successful non-agricultural self-employment/employer and salaried formal employment. This is
true for both men and women.
11. Our results suggest that remittances and other non-labor income can be a source of
financing that promotes advantageous self- employment. Those with access to remittances and
other non-labor income have a higher probability of transitioning from unfavorable states into
advantageous self- employment. Similarly, access to remittances and other non-labor income
make it less likely that advantageous self-employed leave this advantageous labor market state
and fall into an unfavorable state. These results suggest that policies that increase access to
capital for those who do not have access to remittances or non-labor income could help to
promote advantageous self-employment.
References
Allen, I. Elaine, et al. Global Entrepreneurship Monitor: 2007 Report on Women and
Entrepreneurship, Babson Park, MA: The Center for Women’s Leadership at Babson
College, 2007.
Bardasi, Elena, Shwetlena Sabarwal and Katherine Terrell, 2010, “How do Female Entrepreneurs
Perform? Evidence from Three Developing Regions,” World Bank mimeo, December.
Bennett, John and Saul Estrin (2007) “Entrepreneurial Entry in Developing Economies: Modeling
Interactions Between the Formal and Informal Sector,” working paper, London
School of Economics
Bosch, Mariano and William Maloney, 2010, “Comparative Analysis of Labor Market Dynamics
Using Markov Processes: An Application to Informality,” Labour Economics, 17(4), 621-
631.
Cunningham, Wendy and Javier Bustos Salvagno, “Youth Employment Transitions in Latin
America,” World Bank Policy Research Working Paper 5521, January 2011.
Decreto No. 645, Ley de Igualdad, Equidad y Erradicación de la Discriminación contra las Mujeres.
Diario Oficial No. 70, El Salvador, 2011.
Delmar, F. and P. Davidson (2000), Where do they come from? Prevalence and characteristics
of nascent entrepreneurs, Entrepreneurship and regional development 12, 1-23.
de Mel, Suresh, David McKenzie and Christopher Woodruff (2010), “Who are the Microenterprise
Owners? Evidence from Sri Lanka on Tokman v. de Soto,” in International Differences in
Entrepreneurship, Lerner and Schoar, eds, University of Chicago Press.
De Soto, Hernan, 1989, The Other Path: The Economic Answer to Terrorism, Basic Books, New York.
Duryea, Suzanne, Gustavo Marquez, Carmen Pages and Stefano Scarpetta, 2006, “For Better or
Worse? Job and Earnings Mobility in Nine Middle- and Low-Income Countries,” in Susan M.
Collins and Carol Graham, Brookings Trade Forum 2006: Global Labor Markets?, Brookings
Institution Press, Washington, 1878-209.
Fields, Gary S., 1975, “Rural-Urban Migration, Urban Unemployment and Underemployment, and
Job Search Activities in LDC’s,” Journal of Development Economics, Vol. 2, pp. 165-88.
Ghai, Dharam. 2003. “Decent work: Concept and indicators,” International Labour Review 142
(2), 113-145.
Gobierno de El Salvador, Plan quinquenal de desarrollo 2010-2014, Segunda edición, El Salvador,
2011
Hundley, G. 2001. Why women earn less than men in self-employment. Journal of Labor Research
22, 817-829.
Instituto Salvadoreño para el Desarrollo de la Mujer (ISDEMU), 2011. “Política nacional de
las mujeres: actualizada: medidas al 2014 Instituto Salvadoreño para el Desarrollo de
la Mujer (ISDEMU), 1ª edición, San Salvador, El Salvador, 2011.
Klapper, Leora and Simon Parker, 2010, “Gender and the Business Environment for New Firm
Creation,” The World Bank Research Observer (advance access February 25, 2010 at
http://wbro.oxfordjournals.org/content/early/2010/02/25/wbro.lkp032.short).
Ley No. 648, Ley de Igualdad de Derechos y Oportunidades. Gaceta Diario Oficial No. 51, Nicaragua,
2008.
Lohmann, H., and S. Luber, 2004. “Trends in Self-Employment in Germany: Different Types,
Different Outcomes?” In W. Muller and R. Arum ed. The Reemergence of Self-
Employment. Princeton University Press: Princeton, New Jersey, 36-74.
OECD (2011) Women’s economic empowerment. Issues paper Paris: OECD-DAC GENDERNET
Pagés, C., Piras, C. “El Dividendo de Género. Cómo Capitalizar el Trabajo de las Mujeres”. Banco
Interamericano de Desarrollo, 2010.
Tokman, Victor, 2007, “Modernizing the Informal Sector,” UN/DESA Working Paper No. 42.
World Bank (2012) “The effect of Women´s Economic Power in Latin America and The Caribbean”,
Document of the World Bank, August 2012.
APPENDIX A. Tables
Table A1: Number of households and individuals matched according to the criteria
Table A2: Evolution of labor force in El Salvador
Table A3: Women and men occupied, by category
Table A4: Why not seeking a job?
Table A5: Women and men occupied by economic sector
Table A6: Women and men occupied, by education
Table A7: Women and men occupied, by economic sector and education level.
Table A8: Women and men active contributors to Salvadoran Social Security Institute
Table A9: Women and men by categories.
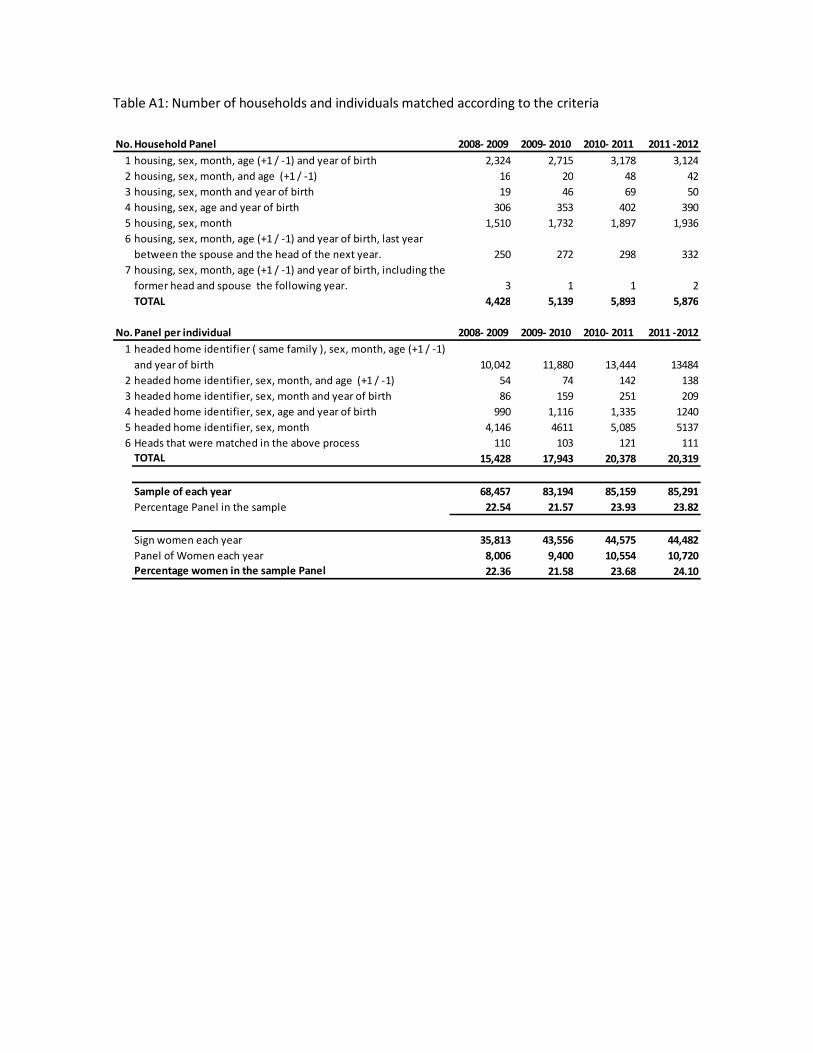
Table A1: Number of households and individuals matched according to the criteria
No. Household Panel 2008- 2009 2009- 2010 2010- 2011 2011 -2012
1 housing, sex, month, age (+1 / -1) and year of birth 2,324 2,715 3,178 3,124
2 housing, sex, month, and age (+1 / -1) 16 20 48 42
3 housing, sex, month and year of birth 19 46 69 50
4 housing, sex, age and year of birth 306 353 402 390
5 housing, sex, month 1,510 1,732 1,897 1,936
6 housing, sex, month, age (+1 / -1) and year of birth, last year
between the spouse and the head of the next year. 250 272 298 332
7 housing, sex, month, age (+1 / -1) and year of birth, including the
former head and spouse the following year. 3 1 1 2
TOTAL 4,428 5,139 5,893 5,876
No. Panel per individual 2008- 2009 2009- 2010 2010- 2011 2011 -2012
1 headed home identifier ( same family ), sex, month, age (+1 / -1)
and year of birth 10,042 11,880 13,444 13484
2 headed home identifier, sex, month, and age (+1 / -1) 54 74 142 138
3 headed home identifier, sex, month and year of birth 86 159 251 209
4 headed home identifier, sex, age and year of birth 990 1,116 1,335 1240
5 headed home identifier, sex, month 4,146 4611 5,085 5137
6 Heads that were matched in the above process 110 103 121 111
TOTAL 15,428 17,943 20,378 20,319
Sample of each year 68,457 83,194 85,159 85,291
Percentage Panel in the sample 22.54 21.57 23.93 23.82
Sign women each year 35,813 43,556 44,575 44,482
Panel of Women each year 8,006 9,400 10,554 10,720
Percentage women in the sample Panel 22.36 21.58 23.68 24.10
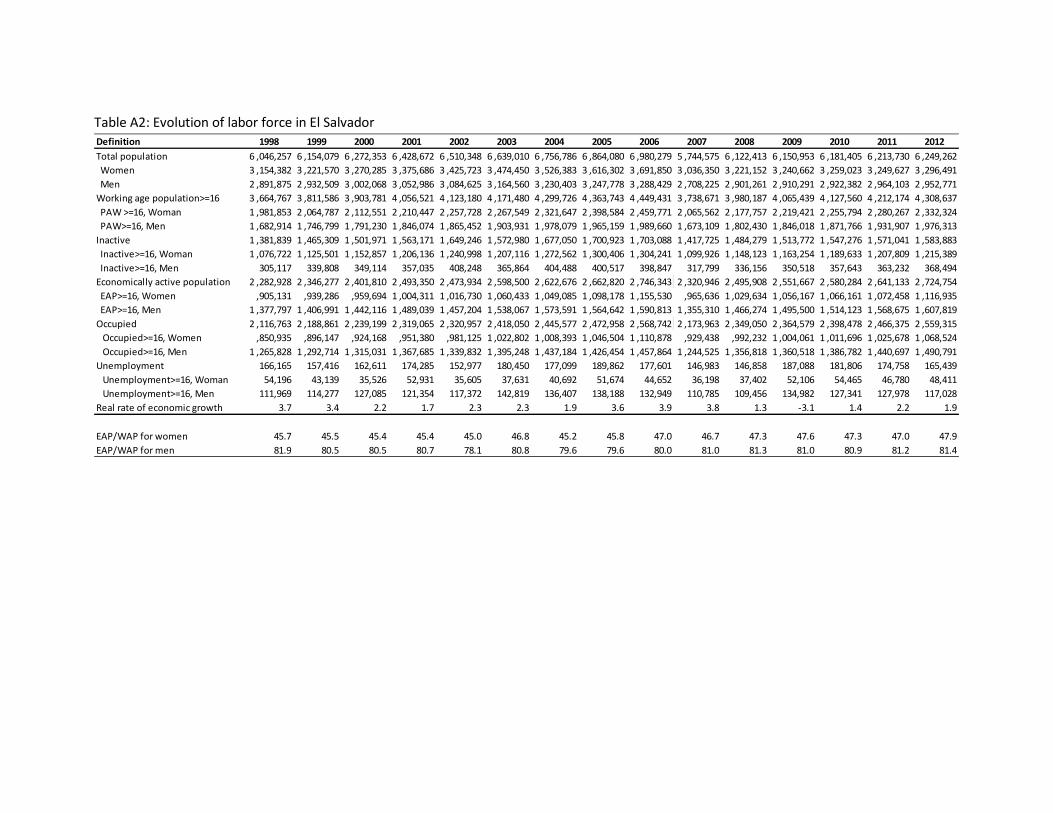
Table A2: Evolution of labor force in El Salvador
Definition 1998 1999 2000 2001 2002 2003 2004 2005 2006 2007 2008 2009 2010 2011 2012
Total population 6 ,046,257 6 ,154,079 6 ,272,353 6 ,428,672 6 ,510,348 6 ,639,010 6 ,756,786 6 ,864,080 6 ,980,279 5 ,744,575 6 ,122,413 6 ,150,953 6 ,181,405 6 ,213,730 6 ,249,262
Women 3 ,154,382 3 ,221,570 3 ,270,285 3 ,375,686 3 ,425,723 3 ,474,450 3 ,526,383 3 ,616,302 3 ,691,850 3 ,036,350 3 ,221,152 3 ,240,662 3 ,259,023 3 ,249,627 3 ,296,491
Men 2 ,891,875 2 ,932,509 3 ,002,068 3 ,052,986 3 ,084,625 3 ,164,560 3 ,230,403 3 ,247,778 3 ,288,429 2 ,708,225 2 ,901,261 2 ,910,291 2 ,922,382 2 ,964,103 2 ,952,771
Working age population>=16 3 ,664,767 3 ,811,586 3 ,903,781 4 ,056,521 4 ,123,180 4 ,171,480 4 ,299,726 4 ,363,743 4 ,449,431 3 ,738,671 3 ,980,187 4 ,065,439 4 ,127,560 4 ,212,174 4 ,308,637
PAW >=16, Woman 1 ,981,853 2 ,064,787 2 ,112,551 2 ,210,447 2 ,257,728 2 ,267,549 2 ,321,647 2 ,398,584 2 ,459,771 2 ,065,562 2 ,177,757 2 ,219,421 2 ,255,794 2 ,280,267 2 ,332,324
PAW>=16, Men 1 ,682,914 1 ,746,799 1 ,791,230 1 ,846,074 1 ,865,452 1 ,903,931 1 ,978,079 1 ,965,159 1 ,989,660 1 ,673,109 1 ,802,430 1 ,846,018 1 ,871,766 1 ,931,907 1 ,976,313
Inactive 1 ,381,839 1 ,465,309 1 ,501,971 1 ,563,171 1 ,649,246 1 ,572,980 1 ,677,050 1 ,700,923 1 ,703,088 1 ,417,725 1 ,484,279 1 ,513,772 1 ,547,276 1 ,571,041 1 ,583,883
Inactive>=16, Woman 1 ,076,722 1 ,125,501 1 ,152,857 1 ,206,136 1 ,240,998 1 ,207,116 1 ,272,562 1 ,300,406 1 ,304,241 1 ,099,926 1 ,148,123 1 ,163,254 1 ,189,633 1 ,207,809 1 ,215,389
Inactive>=16, Men 305,117 339,808 349,114 357,035 408,248 365,864 404,488 400,517 398,847 317,799 336,156 350,518 357,643 363,232 368,494
Economically active population 2 ,282,928 2 ,346,277 2 ,401,810 2 ,493,350 2 ,473,934 2 ,598,500 2 ,622,676 2 ,662,820 2 ,746,343 2 ,320,946 2 ,495,908 2 ,551,667 2 ,580,284 2 ,641,133 2 ,724,754
EAP>=16, Women ,905,131 ,939,286 ,959,694 1 ,004,311 1 ,016,730 1 ,060,433 1 ,049,085 1 ,098,178 1 ,155,530 ,965,636 1 ,029,634 1 ,056,167 1 ,066,161 1 ,072,458 1 ,116,935
EAP>=16, Men 1 ,377,797 1 ,406,991 1 ,442,116 1 ,489,039 1 ,457,204 1 ,538,067 1 ,573,591 1 ,564,642 1 ,590,813 1 ,355,310 1 ,466,274 1 ,495,500 1 ,514,123 1 ,568,675 1 ,607,819
Occupied 2 ,116,763 2 ,188,861 2 ,239,199 2 ,319,065 2 ,320,957 2 ,418,050 2 ,445,577 2 ,472,958 2 ,568,742 2 ,173,963 2 ,349,050 2 ,364,579 2 ,398,478 2 ,466,375 2 ,559,315
Occupied>=16, Women ,850,935 ,896,147 ,924,168 ,951,380 ,981,125 1 ,022,802 1 ,008,393 1 ,046,504 1 ,110,878 ,929,438 ,992,232 1 ,004,061 1 ,011,696 1 ,025,678 1 ,068,524
Occupied>=16, Men 1 ,265,828 1 ,292,714 1 ,315,031 1 ,367,685 1 ,339,832 1 ,395,248 1 ,437,184 1 ,426,454 1 ,457,864 1 ,244,525 1 ,356,818 1 ,360,518 1 ,386,782 1 ,440,697 1 ,490,791
Unemployment 166,165 157,416 162,611 174,285 152,977 180,450 177,099 189,862 177,601 146,983 146,858 187,088 181,806 174,758 165,439
Unemployment>=16, Woman 54,196 43,139 35,526 52,931 35,605 37,631 40,692 51,674 44,652 36,198 37,402 52,106 54,465 46,780 48,411
Unemployment>=16, Men 111,969 114,277 127,085 121,354 117,372 142,819 136,407 138,188 132,949 110,785 109,456 134,982 127,341 127,978 117,028
Real rate of economic growth 3.7 3.4 2.2 1.7 2.3 2.3 1.9 3.6 3.9 3.8 1.3 -3.1 1.4 2.2 1.9
EAP/WAP for women 45.7 45.5 45.4 45.4 45.0 46.8 45.2 45.8 47.0 46.7 47.3 47.6 47.3 47.0 47.9
EAP/WAP for men 81.9 80.5 80.5 80.7 78.1 80.8 79.6 79.6 80.0 81.0 81.3 81.0 80.9 81.2 81.4
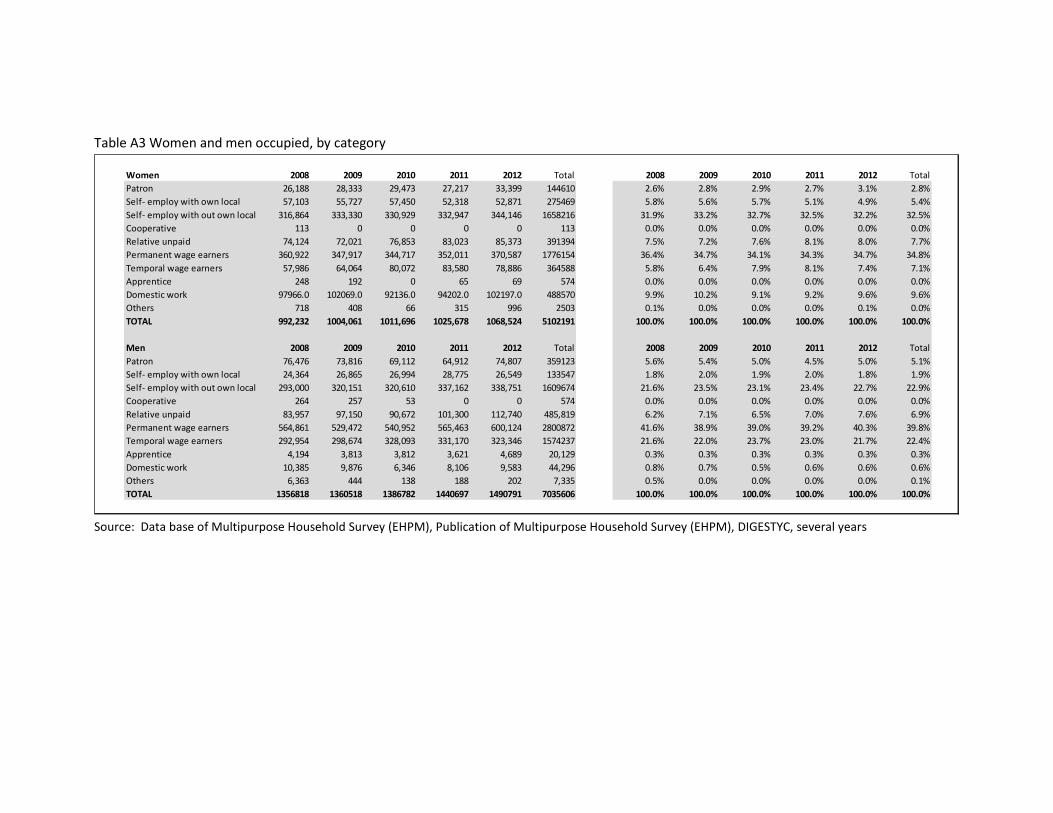
Table A3 Women and men occupied, by category
Source: Data base of Multipurpose Household Survey (EHPM), Publication of Multipurpose Household Survey (EHPM), DIGESTYC, several years
Women 2008 2009 2010 2011 2012 Total 2008 2009 2010 2011 2012 Total
Patron 26,188 28,333 29,473 27,217 33,399 144610 2.6% 2.8% 2.9% 2.7% 3.1% 2.8%
Self- employ with own local 57,103 55,727 57,450 52,318 52,871 275469 5.8% 5.6% 5.7% 5.1% 4.9% 5.4%
Self- employ with out own local 316,864 333,330 330,929 332,947 344,146 1658216 31.9% 33.2% 32.7% 32.5% 32.2% 32.5%
Cooperative 113 0 0 0 0 113 0.0% 0.0% 0.0% 0.0% 0.0% 0.0%
Relative unpaid 74,124 72,021 76,853 83,023 85,373 391394 7.5% 7.2% 7.6% 8.1% 8.0% 7.7%
Permanent wage earners 360,922 347,917 344,717 352,011 370,587 1776154 36.4% 34.7% 34.1% 34.3% 34.7% 34.8%
Temporal wage earners 57,986 64,064 80,072 83,580 78,886 364588 5.8% 6.4% 7.9% 8.1% 7.4% 7.1%
Apprentice 248 192 0 65 69 574 0.0% 0.0% 0.0% 0.0% 0.0% 0.0%
Domestic work 97966.0 102069.0 92136.0 94202.0 102197.0 488570 9.9% 10.2% 9.1% 9.2% 9.6% 9.6%
Others 718 408 66 315 996 2503 0.1% 0.0% 0.0% 0.0% 0.1% 0.0%
TOTAL 992,232 1004,061 1011,696 1025,678 1068,524 5102191 100.0% 100.0% 100.0% 100.0% 100.0% 100.0%
Men 2008 2009 2010 2011 2012 Total 2008 2009 2010 2011 2012 Total
Patron 76,476 73,816 69,112 64,912 74,807 359123 5.6% 5.4% 5.0% 4.5% 5.0% 5.1%
Self- employ with own local 24,364 26,865 26,994 28,775 26,549 133547 1.8% 2.0% 1.9% 2.0% 1.8% 1.9%
Self- employ with out own local 293,000 320,151 320,610 337,162 338,751 1609674 21.6% 23.5% 23.1% 23.4% 22.7% 22.9%
Cooperative 264 257 53 0 0 574 0.0% 0.0% 0.0% 0.0% 0.0% 0.0%
Relative unpaid 83,957 97,150 90,672 101,300 112,740 485,819 6.2% 7.1% 6.5% 7.0% 7.6% 6.9%
Permanent wage earners 564,861 529,472 540,952 565,463 600,124 2800872 41.6% 38.9% 39.0% 39.2% 40.3% 39.8%
Temporal wage earners 292,954 298,674 328,093 331,170 323,346 1574237 21.6% 22.0% 23.7% 23.0% 21.7% 22.4%
Apprentice 4,194 3,813 3,812 3,621 4,689 20,129 0.3% 0.3% 0.3% 0.3% 0.3% 0.3%
Domestic work 10,385 9,876 6,346 8,106 9,583 44,296 0.8% 0.7% 0.5% 0.6% 0.6% 0.6%
Others 6,363 444 138 188 202 7,335 0.5% 0.0% 0.0% 0.0% 0.0% 0.1%
TOTAL 1356818 1360518 1386782 1440697 1490791 7035606 100.0% 100.0% 100.0% 100.0% 100.0% 100.0%
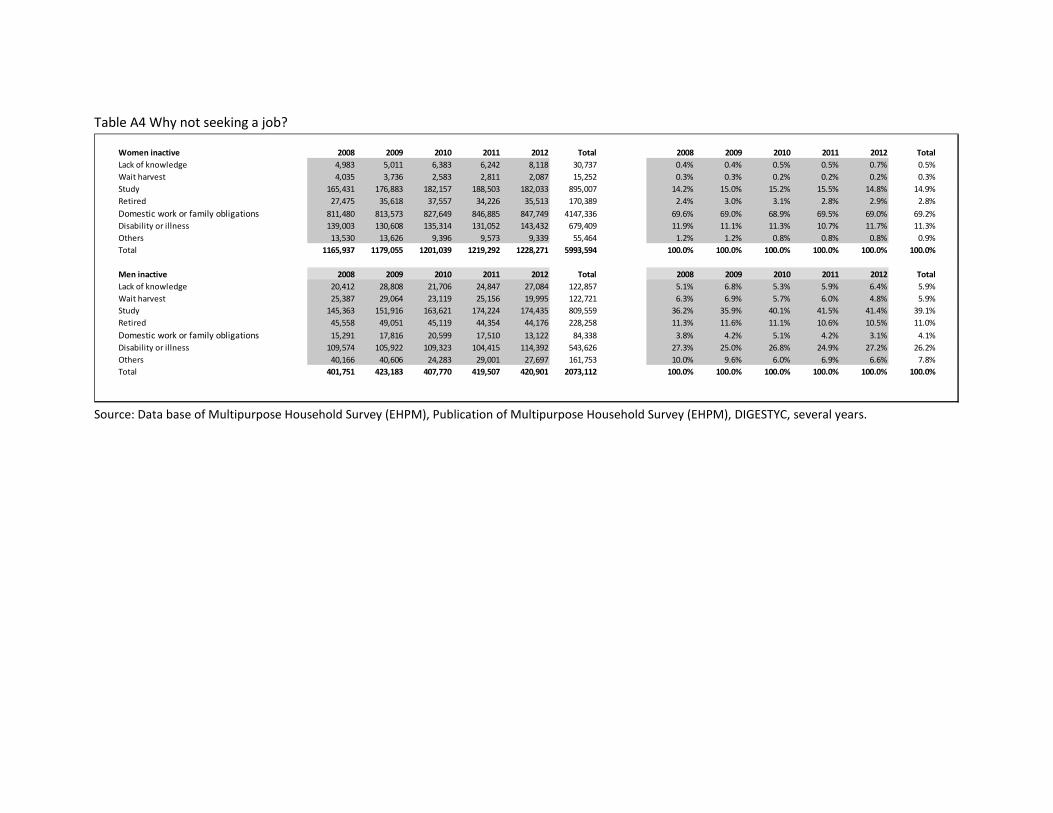
Table A4 Why not seeking a job?
Source: Data base of Multipurpose Household Survey (EHPM), Publication of Multipurpose Household Survey (EHPM), DIGESTYC, several years.
Women inactive 2008 2009 2010 2011 2012 Total 2008 2009 2010 2011 2012 Total
Lack of knowledge 4,983 5,011 6,383 6,242 8,118 30,737 0.4% 0.4% 0.5% 0.5% 0.7% 0.5%
Wait harvest 4,035 3,736 2,583 2,811 2,087 15,252 0.3% 0.3% 0.2% 0.2% 0.2% 0.3%
Study 165,431 176,883 182,157 188,503 182,033 895,007 14.2% 15.0% 15.2% 15.5% 14.8% 14.9%
Retired 27,475 35,618 37,557 34,226 35,513 170,389 2.4% 3.0% 3.1% 2.8% 2.9% 2.8%
Domestic work or family obligations 811,480 813,573 827,649 846,885 847,749 4147,336 69.6% 69.0% 68.9% 69.5% 69.0% 69.2%
Disability or illness 139,003 130,608 135,314 131,052 143,432 679,409 11.9% 11.1% 11.3% 10.7% 11.7% 11.3%
Others 13,530 13,626 9,396 9,573 9,339 55,464 1.2% 1.2% 0.8% 0.8% 0.8% 0.9%
Total 1165,937 1179,055 1201,039 1219,292 1228,271 5993,594 100.0% 100.0% 100.0% 100.0% 100.0% 100.0%
Men inactive 2008 2009 2010 2011 2012 Total 2008 2009 2010 2011 2012 Total
Lack of knowledge 20,412 28,808 21,706 24,847 27,084 122,857 5.1% 6.8% 5.3% 5.9% 6.4% 5.9%
Wait harvest 25,387 29,064 23,119 25,156 19,995 122,721 6.3% 6.9% 5.7% 6.0% 4.8% 5.9%
Study 145,363 151,916 163,621 174,224 174,435 809,559 36.2% 35.9% 40.1% 41.5% 41.4% 39.1%
Retired 45,558 49,051 45,119 44,354 44,176 228,258 11.3% 11.6% 11.1% 10.6% 10.5% 11.0%
Domestic work or family obligations 15,291 17,816 20,599 17,510 13,122 84,338 3.8% 4.2% 5.1% 4.2% 3.1% 4.1%
Disability or illness 109,574 105,922 109,323 104,415 114,392 543,626 27.3% 25.0% 26.8% 24.9% 27.2% 26.2%
Others 40,166 40,606 24,283 29,001 27,697 161,753 10.0% 9.6% 6.0% 6.9% 6.6% 7.8%
Total 401,751 423,183 407,770 419,507 420,901 2073,112 100.0% 100.0% 100.0% 100.0% 100.0% 100.0%
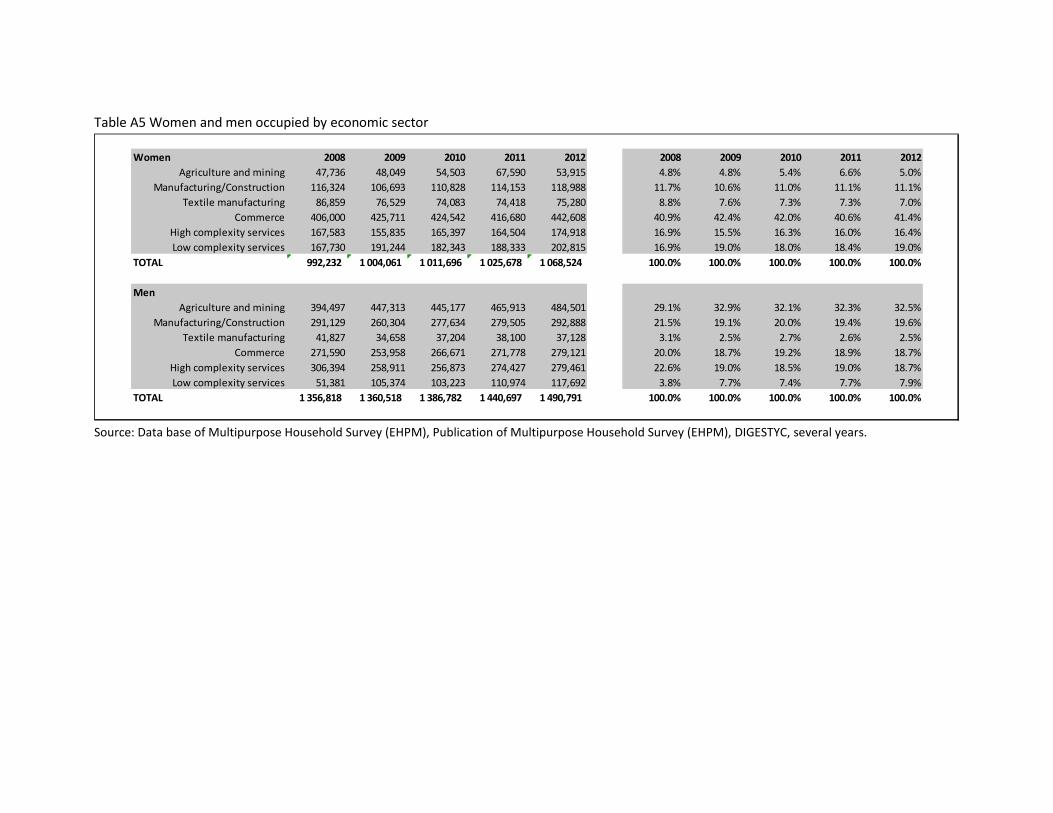
Table A5 Women and men occupied by economic sector
Source: Data base of Multipurpose Household Survey (EHPM), Publication of Multipurpose Household Survey (EHPM), DIGESTYC, several years.
Women 2008 2009 2010 2011 2012 2008 2009 2010 2011 2012
Agriculture and mining 47,736 48,049 54,503 67,590 53,915 4.8% 4.8% 5.4% 6.6% 5.0%
Manufacturing/Construction 116,324 106,693 110,828 114,153 118,988 11.7% 10.6% 11.0% 11.1% 11.1%
Textile manufacturing 86,859 76,529 74,083 74,418 75,280 8.8% 7.6% 7.3% 7.3% 7.0%
Commerce 406,000 425,711 424,542 416,680 442,608 40.9% 42.4% 42.0% 40.6% 41.4%
High complexity services 167,583 155,835 165,397 164,504 174,918 16.9% 15.5% 16.3% 16.0% 16.4%
Low complexity services 167,730 191,244 182,343 188,333 202,815 16.9% 19.0% 18.0% 18.4% 19.0%
TOTAL 992,232 1 004,061 1 011,696 1 025,678 1 068,524 100.0% 100.0% 100.0% 100.0% 100.0%
Men
Agriculture and mining 394,497 447,313 445,177 465,913 484,501 29.1% 32.9% 32.1% 32.3% 32.5%
Manufacturing/Construction 291,129 260,304 277,634 279,505 292,888 21.5% 19.1% 20.0% 19.4% 19.6%
Textile manufacturing 41,827 34,658 37,204 38,100 37,128 3.1% 2.5% 2.7% 2.6% 2.5%
Commerce 271,590 253,958 266,671 271,778 279,121 20.0% 18.7% 19.2% 18.9% 18.7%
High complexity services 306,394 258,911 256,873 274,427 279,461 22.6% 19.0% 18.5% 19.0% 18.7%
Low complexity services 51,381 105,374 103,223 110,974 117,692 3.8% 7.7% 7.4% 7.7% 7.9%
TOTAL 1 356,818 1 360,518 1 386,782 1 440,697 1 490,791 100.0% 100.0% 100.0% 100.0% 100.0%
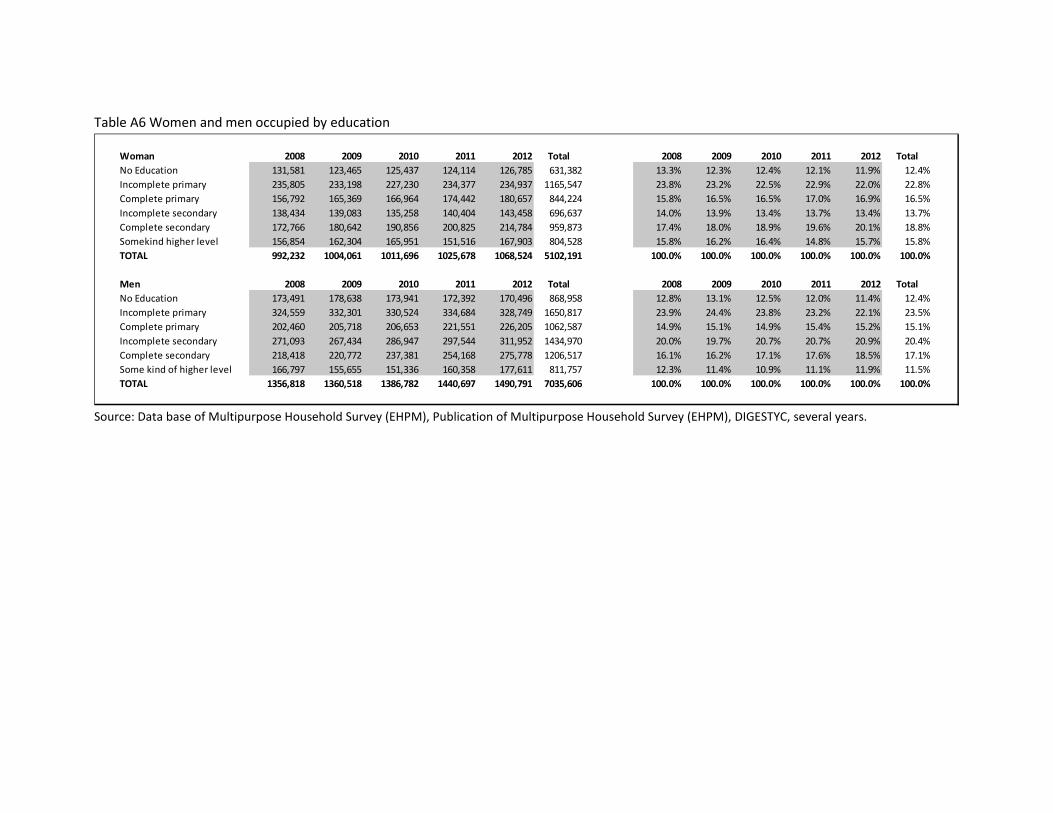
Table A6 Women and men occupied by education
Source: Data base of Multipurpose Household Survey (EHPM), Publication of Multipurpose Household Survey (EHPM), DIGESTYC, several years.
Woman 2008 2009 2010 2011 2012 Total 2008 2009 2010 2011 2012 Total
No Education 131,581 123,465 125,437 124,114 126,785 631,382 13.3% 12.3% 12.4% 12.1% 11.9% 12.4%
Incomplete primary 235,805 233,198 227,230 234,377 234,937 1165,547 23.8% 23.2% 22.5% 22.9% 22.0% 22.8%
Complete primary 156,792 165,369 166,964 174,442 180,657 844,224 15.8% 16.5% 16.5% 17.0% 16.9% 16.5%
Incomplete secondary 138,434 139,083 135,258 140,404 143,458 696,637 14.0% 13.9% 13.4% 13.7% 13.4% 13.7%
Complete secondary 172,766 180,642 190,856 200,825 214,784 959,873 17.4% 18.0% 18.9% 19.6% 20.1% 18.8%
Somekind higher level 156,854 162,304 165,951 151,516 167,903 804,528 15.8% 16.2% 16.4% 14.8% 15.7% 15.8%
TOTAL 992,232 1004,061 1011,696 1025,678 1068,524 5102,191 100.0% 100.0% 100.0% 100.0% 100.0% 100.0%
Men 2008 2009 2010 2011 2012 Total 2008 2009 2010 2011 2012 Total
No Education 173,491 178,638 173,941 172,392 170,496 868,958 12.8% 13.1% 12.5% 12.0% 11.4% 12.4%
Incomplete primary 324,559 332,301 330,524 334,684 328,749 1650,817 23.9% 24.4% 23.8% 23.2% 22.1% 23.5%
Complete primary 202,460 205,718 206,653 221,551 226,205 1062,587 14.9% 15.1% 14.9% 15.4% 15.2% 15.1%
Incomplete secondary 271,093 267,434 286,947 297,544 311,952 1434,970 20.0% 19.7% 20.7% 20.7% 20.9% 20.4%
Complete secondary 218,418 220,772 237,381 254,168 275,778 1206,517 16.1% 16.2% 17.1% 17.6% 18.5% 17.1%
Some kind of higher level 166,797 155,655 151,336 160,358 177,611 811,757 12.3% 11.4% 10.9% 11.1% 11.9% 11.5%
TOTAL 1356,818 1360,518 1386,782 1440,697 1490,791 7035,606 100.0% 100.0% 100.0% 100.0% 100.0% 100.0%
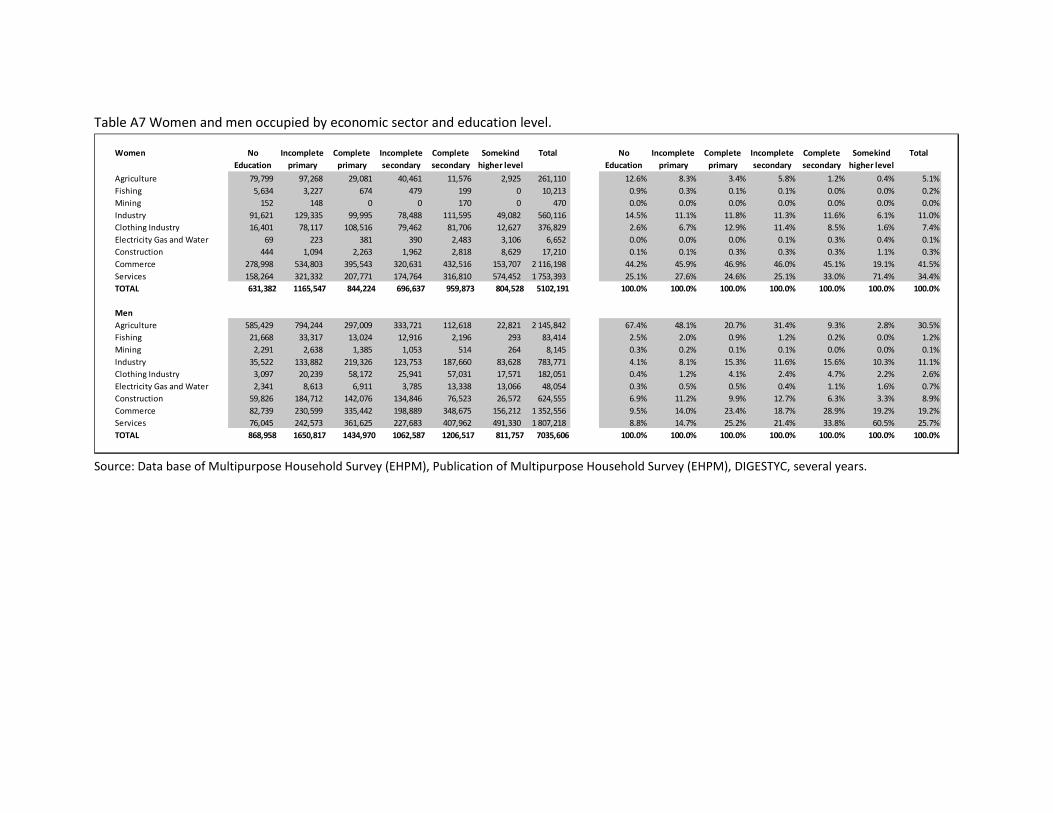
Table A7 Women and men occupied by economic sector and education level.
Source: Data base of Multipurpose Household Survey (EHPM), Publication of Multipurpose Household Survey (EHPM), DIGESTYC, several years.
Women No
Education
Incomplete
primary
Complete
primary
Incomplete
secondary
Complete
secondary
Somekind
higher level
Total No
Education
Incomplete
primary
Complete
primary
Incomplete
secondary
Complete
secondary
Somekind
higher level
Total
Agriculture 79,799 97,268 29,081 40,461 11,576 2,925 261,110 12.6% 8.3% 3.4% 5.8% 1.2% 0.4% 5.1%
Fishing 5,634 3,227 674 479 199 0 10,213 0.9% 0.3% 0.1% 0.1% 0.0% 0.0% 0.2%
Mining 152 148 0 0 170 0 470 0.0% 0.0% 0.0% 0.0% 0.0% 0.0% 0.0%
Industry 91,621 129,335 99,995 78,488 111,595 49,082 560,116 14.5% 11.1% 11.8% 11.3% 11.6% 6.1% 11.0%
Clothing Industry 16,401 78,117 108,516 79,462 81,706 12,627 376,829 2.6% 6.7% 12.9% 11.4% 8.5% 1.6% 7.4%
Electricity Gas and Water 69 223 381 390 2,483 3,106 6,652 0.0% 0.0% 0.0% 0.1% 0.3% 0.4% 0.1%
Construction 444 1,094 2,263 1,962 2,818 8,629 17,210 0.1% 0.1% 0.3% 0.3% 0.3% 1.1% 0.3%
Commerce 278,998 534,803 395,543 320,631 432,516 153,707 2 116,198 44.2% 45.9% 46.9% 46.0% 45.1% 19.1% 41.5%
Services 158,264 321,332 207,771 174,764 316,810 574,452 1 753,393 25.1% 27.6% 24.6% 25.1% 33.0% 71.4% 34.4%
TOTAL 631,382 1165,547 844,224 696,637 959,873 804,528 5102,191 100.0% 100.0% 100.0% 100.0% 100.0% 100.0% 100.0%
Men
Agriculture 585,429 794,244 297,009 333,721 112,618 22,821 2 145,842 67.4% 48.1% 20.7% 31.4% 9.3% 2.8% 30.5%
Fishing 21,668 33,317 13,024 12,916 2,196 293 83,414 2.5% 2.0% 0.9% 1.2% 0.2% 0.0% 1.2%
Mining 2,291 2,638 1,385 1,053 514 264 8,145 0.3% 0.2% 0.1% 0.1% 0.0% 0.0% 0.1%
Industry 35,522 133,882 219,326 123,753 187,660 83,628 783,771 4.1% 8.1% 15.3% 11.6% 15.6% 10.3% 11.1%
Clothing Industry 3,097 20,239 58,172 25,941 57,031 17,571 182,051 0.4% 1.2% 4.1% 2.4% 4.7% 2.2% 2.6%
Electricity Gas and Water 2,341 8,613 6,911 3,785 13,338 13,066 48,054 0.3% 0.5% 0.5% 0.4% 1.1% 1.6% 0.7%
Construction 59,826 184,712 142,076 134,846 76,523 26,572 624,555 6.9% 11.2% 9.9% 12.7% 6.3% 3.3% 8.9%
Commerce 82,739 230,599 335,442 198,889 348,675 156,212 1 352,556 9.5% 14.0% 23.4% 18.7% 28.9% 19.2% 19.2%
Services 76,045 242,573 361,625 227,683 407,962 491,330 1 807,218 8.8% 14.7% 25.2% 21.4% 33.8% 60.5% 25.7%
TOTAL 868,958 1650,817 1434,970 1062,587 1206,517 811,757 7035,606 100.0% 100.0% 100.0% 100.0% 100.0% 100.0% 100.0%
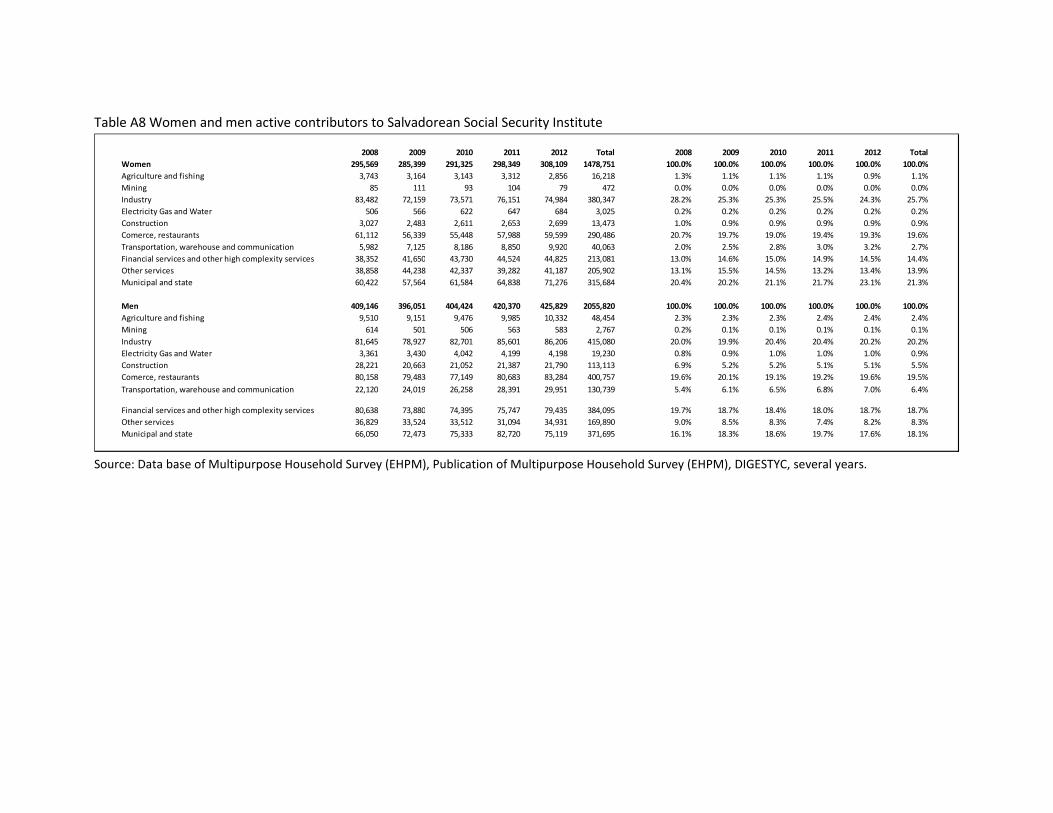
Table A8 Women and men active contributors to Salvadorean Social Security Institute
Source: Data base of Multipurpose Household Survey (EHPM), Publication of Multipurpose Household Survey (EHPM), DIGESTYC, several years.
2008 2009 2010 2011 2012 Total 2008 2009 2010 2011 2012 Total
Women 295,569 285,399 291,325 298,349 308,109 1478,751 100.0% 100.0% 100.0% 100.0% 100.0% 100.0%
Agriculture and fishing 3,743 3,164 3,143 3,312 2,856 16,218 1.3% 1.1% 1.1% 1.1% 0.9% 1.1%
Mining 85 111 93 104 79 472 0.0% 0.0% 0.0% 0.0% 0.0% 0.0%
Industry 83,482 72,159 73,571 76,151 74,984 380,347 28.2% 25.3% 25.3% 25.5% 24.3% 25.7%
Electricity Gas and Water 506 566 622 647 684 3,025 0.2% 0.2% 0.2% 0.2% 0.2% 0.2%
Construction 3,027 2,483 2,611 2,653 2,699 13,473 1.0% 0.9% 0.9% 0.9% 0.9% 0.9%
Comerce, restaurants 61,112 56,339 55,448 57,988 59,599 290,486 20.7% 19.7% 19.0% 19.4% 19.3% 19.6%
Transportation, warehouse and communication 5,982 7,125 8,186 8,850 9,920 40,063 2.0% 2.5% 2.8% 3.0% 3.2% 2.7%
Financial services and other high complexity services 38,352 41,650 43,730 44,524 44,825 213,081 13.0% 14.6% 15.0% 14.9% 14.5% 14.4%
Other services 38,858 44,238 42,337 39,282 41,187 205,902 13.1% 15.5% 14.5% 13.2% 13.4% 13.9%
Municipal and state 60,422 57,564 61,584 64,838 71,276 315,684 20.4% 20.2% 21.1% 21.7% 23.1% 21.3%
Men 409,146 396,051 404,424 420,370 425,829 2055,820 100.0% 100.0% 100.0% 100.0% 100.0% 100.0%
Agriculture and fishing 9,510 9,151 9,476 9,985 10,332 48,454 2.3% 2.3% 2.3% 2.4% 2.4% 2.4%
Mining 614 501 506 563 583 2,767 0.2% 0.1% 0.1% 0.1% 0.1% 0.1%
Industry 81,645 78,927 82,701 85,601 86,206 415,080 20.0% 19.9% 20.4% 20.4% 20.2% 20.2%
Electricity Gas and Water 3,361 3,430 4,042 4,199 4,198 19,230 0.8% 0.9% 1.0% 1.0% 1.0% 0.9%
Construction 28,221 20,663 21,052 21,387 21,790 113,113 6.9% 5.2% 5.2% 5.1% 5.1% 5.5%
Comerce, restaurants 80,158 79,483 77,149 80,683 83,284 400,757 19.6% 20.1% 19.1% 19.2% 19.6% 19.5%
Transportation, warehouse and communication 22,120 24,019 26,258 28,391 29,951 130,739 5.4% 6.1% 6.5% 6.8% 7.0% 6.4%
Financial services and other high complexity services 80,638 73,880 74,395 75,747 79,435 384,095 19.7% 18.7% 18.4% 18.0% 18.7% 18.7%
Other services 36,829 33,524 33,512 31,094 34,931 169,890 9.0% 8.5% 8.3% 7.4% 8.2% 8.3%
Municipal and state 66,050 72,473 75,333 82,720 75,119 371,695 16.1% 18.3% 18.6% 19.7% 17.6% 18.1%
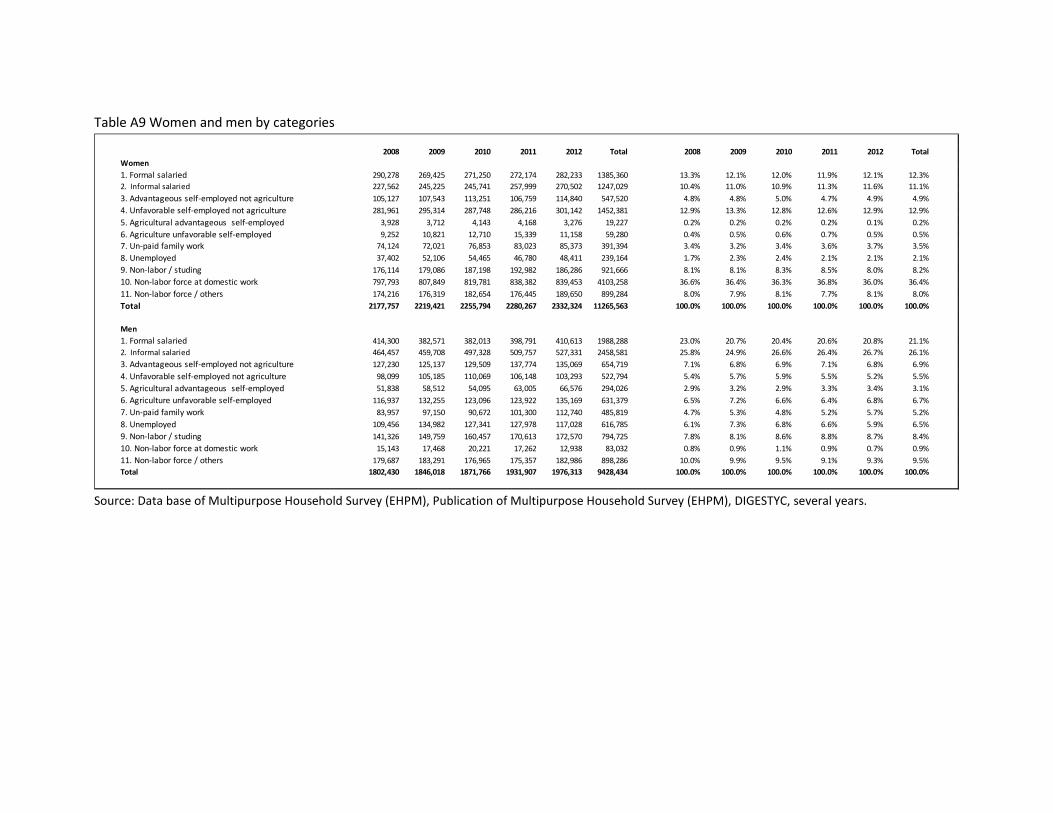
Table A9 Women and men by categories
Source: Data base of Multipurpose Household Survey (EHPM), Publication of Multipurpose Household Survey (EHPM), DIGESTYC, several years.
2008 2009 2010 2011 2012 Total 2008 2009 2010 2011 2012 Total
Women
1. Formal salaried 290,278 269,425 271,250 272,174 282,233 1385,360 13.3% 12.1% 12.0% 11.9% 12.1% 12.3%
2. Informal salaried 227,562 245,225 245,741 257,999 270,502 1247,029 10.4% 11.0% 10.9% 11.3% 11.6% 11.1%
3. Advantageous self-employed not agriculture 105,127 107,543 113,251 106,759 114,840 547,520 4.8% 4.8% 5.0% 4.7% 4.9% 4.9%
4. Unfavorable self-employed not agriculture 281,961 295,314 287,748 286,216 301,142 1452,381 12.9% 13.3% 12.8% 12.6% 12.9% 12.9%
5. Agricultural advantageous self-employed 3,928 3,712 4,143 4,168 3,276 19,227 0.2% 0.2% 0.2% 0.2% 0.1% 0.2%
6. Agriculture unfavorable self-employed 9,252 10,821 12,710 15,339 11,158 59,280 0.4% 0.5% 0.6% 0.7% 0.5% 0.5%
7. Un-paid family work 74,124 72,021 76,853 83,023 85,373 391,394 3.4% 3.2% 3.4% 3.6% 3.7% 3.5%
8. Unemployed 37,402 52,106 54,465 46,780 48,411 239,164 1.7% 2.3% 2.4% 2.1% 2.1% 2.1%
9. Non-labor / studing 176,114 179,086 187,198 192,982 186,286 921,666 8.1% 8.1% 8.3% 8.5% 8.0% 8.2%
10. Non-labor force at domestic work 797,793 807,849 819,781 838,382 839,453 4103,258 36.6% 36.4% 36.3% 36.8% 36.0% 36.4%
11. Non-labor force / others 174,216 176,319 182,654 176,445 189,650 899,284 8.0% 7.9% 8.1% 7.7% 8.1% 8.0%
Total 2177,757 2219,421 2255,794 2280,267 2332,324 11265,563 100.0% 100.0% 100.0% 100.0% 100.0% 100.0%
Men
1. Formal salaried 414,300 382,571 382,013 398,791 410,613 1988,288 23.0% 20.7% 20.4% 20.6% 20.8% 21.1%
2. Informal salaried 464,457 459,708 497,328 509,757 527,331 2458,581 25.8% 24.9% 26.6% 26.4% 26.7% 26.1%
3. Advantageous self-employed not agriculture 127,230 125,137 129,509 137,774 135,069 654,719 7.1% 6.8% 6.9% 7.1% 6.8% 6.9%
4. Unfavorable self-employed not agriculture 98,099 105,185 110,069 106,148 103,293 522,794 5.4% 5.7% 5.9% 5.5% 5.2% 5.5%
5. Agricultural advantageous self-employed 51,838 58,512 54,095 63,005 66,576 294,026 2.9% 3.2% 2.9% 3.3% 3.4% 3.1%
6. Agriculture unfavorable self-employed 116,937 132,255 123,096 123,922 135,169 631,379 6.5% 7.2% 6.6% 6.4% 6.8% 6.7%
7. Un-paid family work 83,957 97,150 90,672 101,300 112,740 485,819 4.7% 5.3% 4.8% 5.2% 5.7% 5.2%
8. Unemployed 109,456 134,982 127,341 127,978 117,028 616,785 6.1% 7.3% 6.8% 6.6% 5.9% 6.5%
9. Non-labor / studing 141,326 149,759 160,457 170,613 172,570 794,725 7.8% 8.1% 8.6% 8.8% 8.7% 8.4%
10. Non-labor force at domestic work 15,143 17,468 20,221 17,262 12,938 83,032 0.8% 0.9% 1.1% 0.9% 0.7% 0.9%
11. Non-labor force / others 179,687 183,291 176,965 175,357 182,986 898,286 10.0% 9.9% 9.5% 9.1% 9.3% 9.5%
Total 1802,430 1846,018 1871,766 1931,907 1976,313 9428,434 100.0% 100.0% 100.0% 100.0% 100.0% 100.0%

Table A3: Women and men occupied, by category
Table A4: Why not seeking a job?
Table A5: Women and men occupied by economic sector
Table A6: Women and men occupied, by education
Table A7: Women and men occupied, by economic sector and education level.
Table A8: Women and men active contributors to Salvadoran Social Security Institute
Table A9: Women and men by categories.
APPENDIX B- : ALTERNATIVE DEFINITION OF ADVANTAGEOUS SELF-EMPLOYMENT
In the body of the paper, the category "Advantageous Self-employed/Employer" consists of
self-employed workers whose labor earnings are greater than the legal minimum wage. In this
appendix we consider a different definition of "Advantageous Self-employed/Employer,"
consisting of self-employed workers who live in families where the per capita household income
is greater than the poverty line. We use the alternative to make comparisons with the results
presented in a companion paper using Nicaraguan data that uses this alternative definition.
Tables B1 and B2 present transition matrices between the 11 states using the alternative
definition of “advantageous self-employed/employer.” Tables B3 and B4 present the probit
estimates of the characteristics associated with transitions into and out of each advantageous
labor market state using the alternative definition of advantageous.
In general, the coefficients of the probit equations for the characteristics associated with
transitions into and out of advantageous labor market states using the alternative definition of
“advantageous” have the same signs and significance levels as in the body of the paper. This
suggests that our results are robust to these two different definitions of “advantageous.” This
also suggests that the results presented in the body of this paper can be compared to the
results in the companion paper using Nicaraguan data.
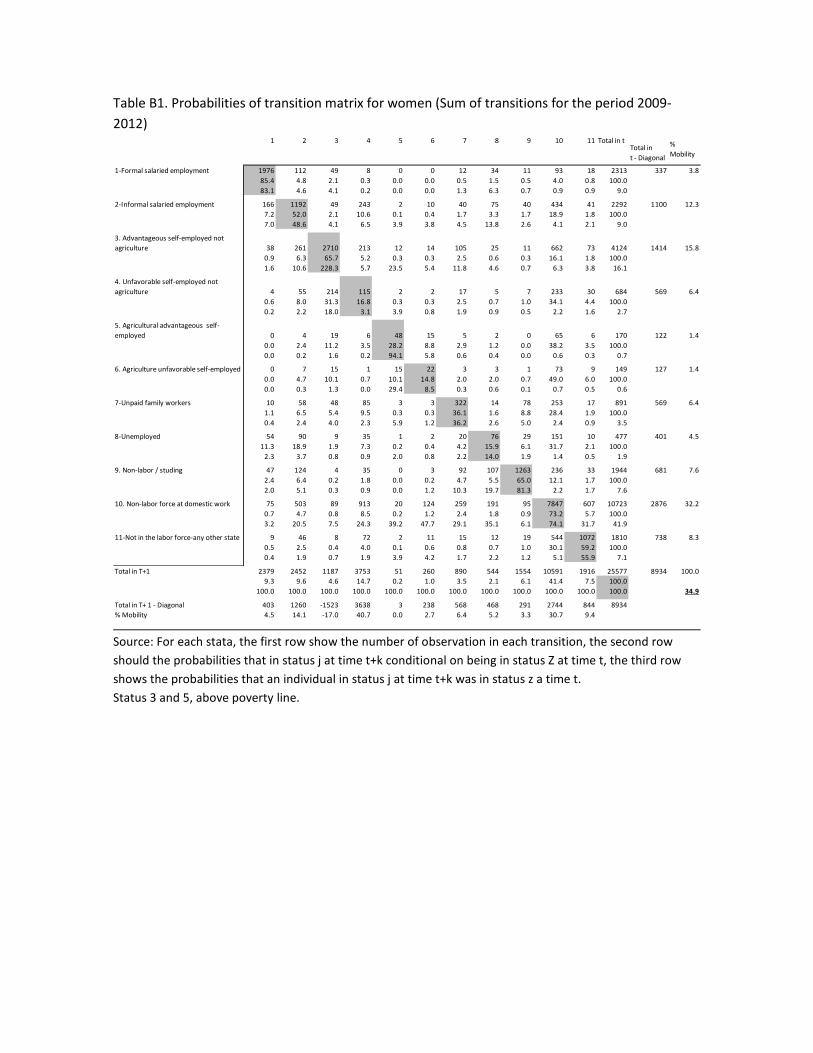
Table B1. Probabilities of transition matrix for women (Sum of transitions for the period 2009-
2012)
Source: For each stata, the first row show the number of observation in each transition, the second row
should the probabilities that in status j at time t+k conditional on being in status Z at time t, the third row
shows the probabilities that an individual in status j at time t+k was in status z a time t.
Status 3 and 5, above poverty line.
1 2 3 4 5 6 7 8 9 10 11 Total in tTotal in
t - Diagonal
%
Mobility
1-Formal salaried employment 1976 112 49 8 0 0 12 34 11 93 18 2313 337 3.8
85.4 4.8 2.1 0.3 0.0 0.0 0.5 1.5 0.5 4.0 0.8 100.0
83.1 4.6 4.1 0.2 0.0 0.0 1.3 6.3 0.7 0.9 0.9 9.0
2-Informal salaried employment 166 1192 49 243 2 10 40 75 40 434 41 2292 1100 12.3
7.2 52.0 2.1 10.6 0.1 0.4 1.7 3.3 1.7 18.9 1.8 100.0
7.0 48.6 4.1 6.5 3.9 3.8 4.5 13.8 2.6 4.1 2.1 9.0
3. Advantageous self-employed not
agriculture 38 261 2710 213 12 14 105 25 11 662 73 4124 1414 15.8
0.9 6.3 65.7 5.2 0.3 0.3 2.5 0.6 0.3 16.1 1.8 100.0
1.6 10.6 228.3 5.7 23.5 5.4 11.8 4.6 0.7 6.3 3.8 16.1
4. Unfavorable self-employed not
agriculture 4 55 214 115 2 2 17 5 7 233 30 684 569 6.4
0.6 8.0 31.3 16.8 0.3 0.3 2.5 0.7 1.0 34.1 4.4 100.0
0.2 2.2 18.0 3.1 3.9 0.8 1.9 0.9 0.5 2.2 1.6 2.7
0 4 19 6 48 15 5 2 0 65 6 170 122 1.4
0.0 2.4 11.2 3.5 28.2 8.8 2.9 1.2 0.0 38.2 3.5 100.0
0.0 0.2 1.6 0.2 94.1 5.8 0.6 0.4 0.0 0.6 0.3 0.7
0 7 15 1 15 22 3 3 1 73 9 149 127 1.4
0.0 4.7 10.1 0.7 10.1 14.8 2.0 2.0 0.7 49.0 6.0 100.0
0.0 0.3 1.3 0.0 29.4 8.5 0.3 0.6 0.1 0.7 0.5 0.6
7-Unpaid family workers 10 58 48 85 3 3 322 14 78 253 17 891 569 6.4
1.1 6.5 5.4 9.5 0.3 0.3 36.1 1.6 8.8 28.4 1.9 100.0
0.4 2.4 4.0 2.3 5.9 1.2 36.2 2.6 5.0 2.4 0.9 3.5
8-Unemployed 54 90 9 35 1 2 20 76 29 151 10 477 401 4.5
11.3 18.9 1.9 7.3 0.2 0.4 4.2 15.9 6.1 31.7 2.1 100.0
2.3 3.7 0.8 0.9 2.0 0.8 2.2 14.0 1.9 1.4 0.5 1.9
9. Non-labor / studing 47 124 4 35 0 3 92 107 1263 236 33 1944 681 7.6
2.4 6.4 0.2 1.8 0.0 0.2 4.7 5.5 65.0 12.1 1.7 100.0
2.0 5.1 0.3 0.9 0.0 1.2 10.3 19.7 81.3 2.2 1.7 7.6
10. Non-labor force at domestic work 75 503 89 913 20 124 259 191 95 7847 607 10723 2876 32.2
0.7 4.7 0.8 8.5 0.2 1.2 2.4 1.8 0.9 73.2 5.7 100.0
3.2 20.5 7.5 24.3 39.2 47.7 29.1 35.1 6.1 74.1 31.7 41.9
9 46 8 72 2 11 15 12 19 544 1072 1810 738 8.3
0.5 2.5 0.4 4.0 0.1 0.6 0.8 0.7 1.0 30.1 59.2 100.0
0.4 1.9 0.7 1.9 3.9 4.2 1.7 2.2 1.2 5.1 55.9 7.1
Total in T+1 2379 2452 1187 3753 51 260 890 544 1554 10591 1916 25577 8934 100.0
9.3 9.6 4.6 14.7 0.2 1.0 3.5 2.1 6.1 41.4 7.5 100.0
100.0 100.0 100.0 100.0 100.0 100.0 100.0 100.0 100.0 100.0 100.0 100.0 34.9
Total in T+ 1 - Diagonal 403 1260 -1523 3638 3 238 568 468 291 2744 844 8934
% Mobility 4.5 14.1 -17.0 40.7 0.0 2.7 6.4 5.2 3.3 30.7 9.4
5. Agricultural advantageous self-
employed
6. Agriculture unfavorable self-employed
11-Not in the labor force-any other state
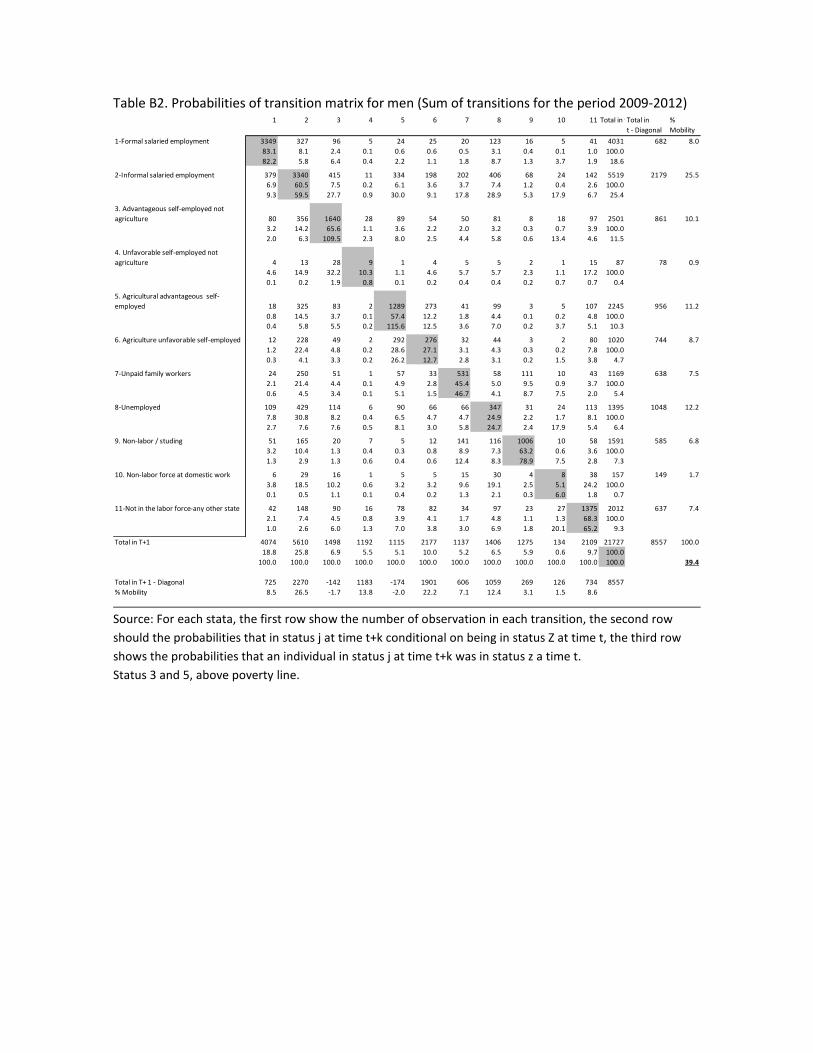
Table B2. Probabilities of transition matrix for men (Sum of transitions for the period 2009-2012)
Source: For each stata, the first row show the number of observation in each transition, the second row
should the probabilities that in status j at time t+k conditional on being in status Z at time t, the third row
shows the probabilities that an individual in status j at time t+k was in status z a time t.
Status 3 and 5, above poverty line.
1 2 3 4 5 6 7 8 9 10 11 Total in tTotal in
t - Diagonal
%
Mobility
1-Formal salaried employment 3349 327 96 5 24 25 20 123 16 5 41 4031 682 8.0
83.1 8.1 2.4 0.1 0.6 0.6 0.5 3.1 0.4 0.1 1.0 100.0
82.2 5.8 6.4 0.4 2.2 1.1 1.8 8.7 1.3 3.7 1.9 18.6
2-Informal salaried employment 379 3340 415 11 334 198 202 406 68 24 142 5519 2179 25.5
6.9 60.5 7.5 0.2 6.1 3.6 3.7 7.4 1.2 0.4 2.6 100.0
9.3 59.5 27.7 0.9 30.0 9.1 17.8 28.9 5.3 17.9 6.7 25.4
3. Advantageous self-employed not
agriculture 80 356 1640 28 89 54 50 81 8 18 97 2501 861 10.1
3.2 14.2 65.6 1.1 3.6 2.2 2.0 3.2 0.3 0.7 3.9 100.0
2.0 6.3 109.5 2.3 8.0 2.5 4.4 5.8 0.6 13.4 4.6 11.5
4. Unfavorable self-employed not
agriculture 4 13 28 9 1 4 5 5 2 1 15 87 78 0.9
4.6 14.9 32.2 10.3 1.1 4.6 5.7 5.7 2.3 1.1 17.2 100.0
0.1 0.2 1.9 0.8 0.1 0.2 0.4 0.4 0.2 0.7 0.7 0.4
18 325 83 2 1289 273 41 99 3 5 107 2245 956 11.2
0.8 14.5 3.7 0.1 57.4 12.2 1.8 4.4 0.1 0.2 4.8 100.0
0.4 5.8 5.5 0.2 115.6 12.5 3.6 7.0 0.2 3.7 5.1 10.3
12 228 49 2 292 276 32 44 3 2 80 1020 744 8.7
1.2 22.4 4.8 0.2 28.6 27.1 3.1 4.3 0.3 0.2 7.8 100.0
0.3 4.1 3.3 0.2 26.2 12.7 2.8 3.1 0.2 1.5 3.8 4.7
7-Unpaid family workers 24 250 51 1 57 33 531 58 111 10 43 1169 638 7.5
2.1 21.4 4.4 0.1 4.9 2.8 45.4 5.0 9.5 0.9 3.7 100.0
0.6 4.5 3.4 0.1 5.1 1.5 46.7 4.1 8.7 7.5 2.0 5.4
8-Unemployed 109 429 114 6 90 66 66 347 31 24 113 1395 1048 12.2
7.8 30.8 8.2 0.4 6.5 4.7 4.7 24.9 2.2 1.7 8.1 100.0
2.7 7.6 7.6 0.5 8.1 3.0 5.8 24.7 2.4 17.9 5.4 6.4
9. Non-labor / studing 51 165 20 7 5 12 141 116 1006 10 58 1591 585 6.8
3.2 10.4 1.3 0.4 0.3 0.8 8.9 7.3 63.2 0.6 3.6 100.0
1.3 2.9 1.3 0.6 0.4 0.6 12.4 8.3 78.9 7.5 2.8 7.3
10. Non-labor force at domestic work 6 29 16 1 5 5 15 30 4 8 38 157 149 1.7
3.8 18.5 10.2 0.6 3.2 3.2 9.6 19.1 2.5 5.1 24.2 100.0
0.1 0.5 1.1 0.1 0.4 0.2 1.3 2.1 0.3 6.0 1.8 0.7
42 148 90 16 78 82 34 97 23 27 1375 2012 637 7.4
2.1 7.4 4.5 0.8 3.9 4.1 1.7 4.8 1.1 1.3 68.3 100.0
1.0 2.6 6.0 1.3 7.0 3.8 3.0 6.9 1.8 20.1 65.2 9.3
Total in T+1 4074 5610 1498 1192 1115 2177 1137 1406 1275 134 2109 21727 8557 100.0
18.8 25.8 6.9 5.5 5.1 10.0 5.2 6.5 5.9 0.6 9.7 100.0
100.0 100.0 100.0 100.0 100.0 100.0 100.0 100.0 100.0 100.0 100.0 100.0 39.4
Total in T+ 1 - Diagonal 725 2270 -142 1183 -174 1901 606 1059 269 126 734 8557
% Mobility 8.5 26.5 -1.7 13.8 -2.0 22.2 7.1 12.4 3.1 1.5 8.6
5. Agricultural advantageous self-
employed
6. Agriculture unfavorable self-employed
11-Not in the labor force-any other state
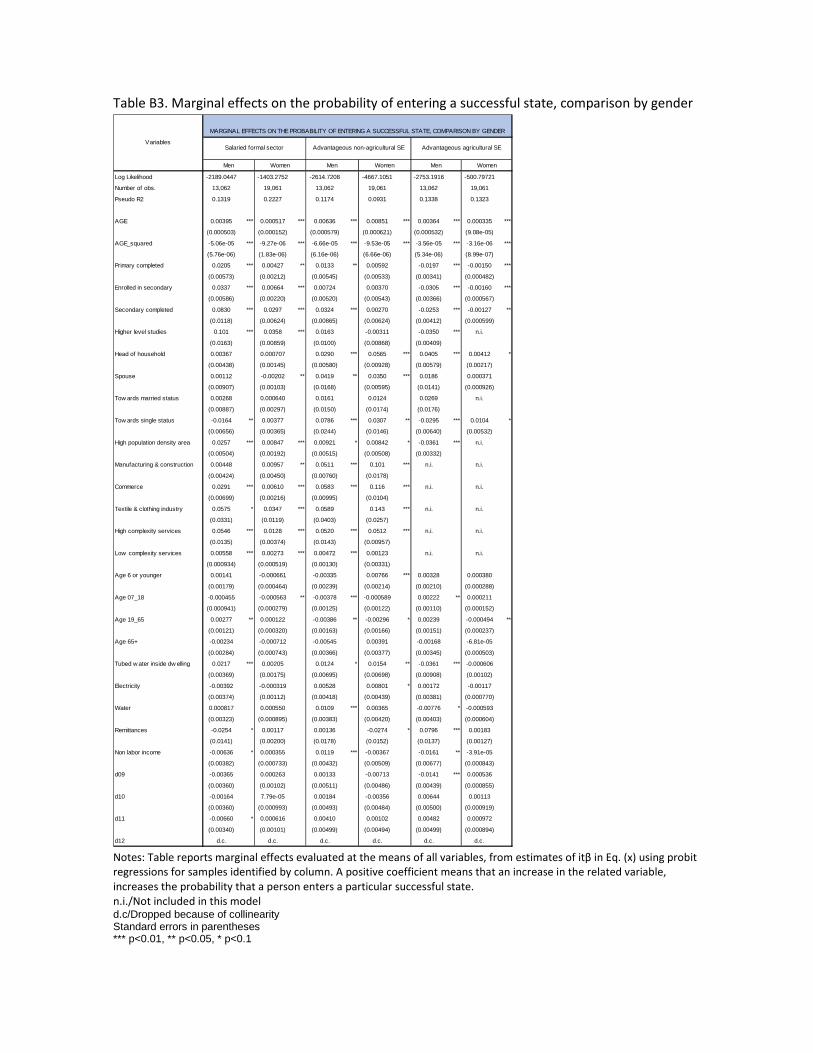
Table B3. Marginal effects on the probability of entering a successful state, comparison by gender
Notes: Table reports marginal effects evaluated at the means of all variables, from estimates of itβ in Eq. (x) using probit
regressions for samples identified by column. A positive coefficient means that an increase in the related variable,
increases the probability that a person enters a particular successful state.
n.i./Not included in this model d.c/Dropped because of collinearity Standard errors in parentheses *** p<0.01, ** p<0.05, * p<0.1
Log Likelihood -2189.0447 -1403.2752 -2614.7208 -4667.1051 -2753.1916 -500.79721
Number of obs. 13,062 19,061 13,062 19,061 13,062 19,061
Pseudo R2 0.1319 0.2227 0.1174 0.0931 0.1338 0.1323
AGE 0.00395 *** 0.000517 *** 0.00636 *** 0.00851 *** 0.00364 *** 0.000335 ***
(0.000503) (0.000152) (0.000579) (0.000621) (0.000532) (9.08e-05)
AGE_squared -5.06e-05 *** -9.27e-06 *** -6.66e-05 *** -9.53e-05 *** -3.56e-05 *** -3.16e-06 ***
(5.76e-06) (1.83e-06) (6.16e-06) (6.66e-06) (5.34e-06) (8.99e-07)
Primary completed 0.0205 *** 0.00427 ** 0.0133 ** 0.00592 -0.0197 *** -0.00150 ***
(0.00573) (0.00212) (0.00545) (0.00533) (0.00341) (0.000482)
Enrolled in secondary 0.0337 *** 0.00664 *** 0.00724 0.00370 -0.0305 *** -0.00160 ***
(0.00586) (0.00220) (0.00520) (0.00543) (0.00366) (0.000567)
Secondary completed 0.0830 *** 0.0297 *** 0.0324 *** 0.00270 -0.0253 *** -0.00127 **
(0.0118) (0.00624) (0.00865) (0.00624) (0.00412) (0.000599)
Higher level studies 0.101 *** 0.0358 *** 0.0163 -0.00311 -0.0350 *** n.i.
(0.0163) (0.00859) (0.0100) (0.00868) (0.00409)
Head of household 0.00367 0.000707 0.0290 *** 0.0565 *** 0.0405 *** 0.00412 *
(0.00438) (0.00145) (0.00580) (0.00928) (0.00579) (0.00217)
Spouse 0.00112 -0.00202 ** 0.0419 ** 0.0350 *** 0.0186 0.000371
(0.00907) (0.00103) (0.0168) (0.00595) (0.0141) (0.000926)
Tow ards married status 0.00268 0.000640 0.0161 0.0124 0.0269 n.i.
(0.00887) (0.00297) (0.0150) (0.0174) (0.0176)
Tow ards single status -0.0164 ** 0.00377 0.0786 *** 0.0307 ** -0.0295 *** 0.0104 *
(0.00656) (0.00365) (0.0244) (0.0146) (0.00640) (0.00532)
High population density area 0.0257 *** 0.00847 *** 0.00921 * 0.00842 * -0.0361 *** n.i.
(0.00504) (0.00192) (0.00515) (0.00508) (0.00332)
Manufacturing & construction 0.00448 0.00957 ** 0.0511 *** 0.101 *** n.i. n.i.
(0.00424) (0.00450) (0.00760) (0.0178)
Commerce 0.0291 *** 0.00610 *** 0.0583 *** 0.116 *** n.i. n.i.
(0.00699) (0.00216) (0.00995) (0.0104)
Textile & clothing industry 0.0575 * 0.0347 *** 0.0589 0.143 *** n.i. n.i.
(0.0331) (0.0119) (0.0403) (0.0257)
High complexity services 0.0546 *** 0.0128 *** 0.0520 *** 0.0512 *** n.i. n.i.
(0.0135) (0.00374) (0.0143) (0.00957)
Low complexity services 0.00558 *** 0.00273 *** 0.00472 *** 0.00123 n.i. n.i.
(0.000934) (0.000519) (0.00130) (0.00331)
Age 6 or younger 0.00141 -0.000661 -0.00335 0.00766 *** 0.00328 0.000380
(0.00179) (0.000464) (0.00239) (0.00214) (0.00210) (0.000288)
Age 07_18 -0.000455 -0.000563 ** -0.00378 *** -0.000589 0.00222 ** 0.000211
(0.000941) (0.000279) (0.00125) (0.00122) (0.00110) (0.000152)
Age 19_65 0.00277 ** 0.000122 -0.00386 ** -0.00296 * 0.00239 -0.000494 **
(0.00121) (0.000320) (0.00163) (0.00166) (0.00151) (0.000237)
Age 65+ -0.00234 -0.000712 -0.00545 0.00391 -0.00168 -6.81e-05
(0.00284) (0.000743) (0.00366) (0.00377) (0.00345) (0.000503)
Tubed w ater inside dw elling 0.0217 *** 0.00205 0.0124 * 0.0154 ** -0.0361 *** -0.000606
(0.00369) (0.00175) (0.00695) (0.00698) (0.00908) (0.00102)
Electricity -0.00392 -0.000319 0.00528 0.00801 * 0.00172 -0.00117
(0.00374) (0.00112) (0.00418) (0.00439) (0.00381) (0.000770)
Water 0.000817 0.000550 0.0109 *** 0.00365 -0.00776 * -0.000593
(0.00323) (0.000895) (0.00383) (0.00420) (0.00403) (0.000604)
Remittances -0.0254 * 0.00117 0.00136 -0.0274 * 0.0796 *** 0.00183
(0.0141) (0.00200) (0.0178) (0.0152) (0.0137) (0.00127)
Non labor income -0.00636 * 0.000355 0.0119 *** -0.00367 -0.0161 ** -3.91e-05
(0.00382) (0.000733) (0.00432) (0.00509) (0.00677) (0.000843)
d09 -0.00365 0.000263 0.00133 -0.00713 -0.0141 *** 0.000536
(0.00360) (0.00102) (0.00511) (0.00486) (0.00439) (0.000855)
d10 -0.00164 7.79e-05 0.00184 -0.00356 0.00644 0.00113
(0.00360) (0.000993) (0.00493) (0.00484) (0.00500) (0.000919)
d11 -0.00660 * 0.000616 0.00410 0.00102 0.00482 0.000972
(0.00340) (0.00101) (0.00499) (0.00494) (0.00499) (0.000894)
d12 d.c. d.c. d.c. d.c. d.c. d.c.
Women
MARGINAL EFFECTS ON THE PROBABILITY OF ENTERING A SUCCESSFUL STATE, COMPARISON BY GENDER
Men Women
Salaried formal sector Advantageous non-agricultural SE
Men Women Men
Advantageous agricultural SEVariables

Table B4. Marginal effects on the probability of leaving a successful state, comparison by gender
Notes: Table reports marginal effects evaluated at the means of all variables, from estimates of itβ in Eq. (x) using probit
regressions for samples identified by column. A positive coefficient means that an increase in the related variable,
increases the probability that a person leaves a particular successful state.
n.i./Not included in this model d.c/Dropped because of collinearity Standard errors in parentheses *** p<0.01, ** p<0.05, * p<0.1
Log Likelihood -1461.3613 -769.9571 -1323.0416 -2429.9628 -1391.472 -80.237314
Number of obs. 3,911 2,264 2,332 4,074 2,145 151
Pseudo R2 0.0922 0.1075 0.067 0.0644 0.0356 0.1502
AGE -0.0169 *** -0.0240 *** -0.0188 *** -0.0259 *** -0.0234 *** -0.0185
(0.00288) (0.00396) (0.00450) (0.00371) (0.00451) (0.0263)
AGE_squared 0.000200 *** 0.000262 *** 0.000196 *** 0.000268 *** 0.000235 *** 0.000205
(3.41e-05) (4.96e-05) (4.73e-05) (3.89e-05) (4.54e-05) (0.000253)
Primary completed 0.0337 0.0537 0.00641 -0.00470 0.0299 0.0476
(0.0218) (0.0423) (0.0274) (0.0215) (0.0356) (0.144)
Enrolled in secondary -0.0233 -0.0117 -0.0486 * -0.00818 -0.0734 * n.i.
(0.0166) (0.0284) (0.0258) (0.0229) (0.0416)
Secondary completed -0.0635 *** -0.0250 -0.0715 ** -0.00657 -0.0435 n.i.
(0.0154) (0.0275) (0.0291) (0.0279) (0.0674)
Higher level studies -0.0767 *** -0.0451 -0.0871 ** 0.0523 -0.235 ** n.i.
(0.0157) (0.0299) (0.0352) (0.0490) (0.119)
Head of household -0.113 *** 0.0267 -0.212 *** -0.0839 *** -0.171 *** -0.278 **
(0.0234) (0.0267) (0.0444) (0.0309) (0.0486) (0.116)
Spouse -0.0273 0.0211 -0.181 *** 0.0155 -0.101 0.155
(0.0279) (0.0205) (0.0393) (0.0284) (0.0772) (0.219)
Tow ards married status 0.00564 -0.0130 -0.0247 0.0951 -0.0276 0.136
(0.0402) (0.0380) (0.0794) (0.0722) (0.0918) (0.148)
Tow ards single status 0.104 * 0.0526 0.108 -0.0383 0.135 n.i.
(0.0603) (0.0531) (0.0797) (0.0479) (0.112)
High population density area -0.0233 ** -0.0360 *** -0.0229 -0.0113 -0.0346 n.i.
(0.0115) (0.0134) (0.0236) (0.0202) (0.0820)
Manufacturing & construction -0.00476 -0.0668 ** -0.0123 -0.238 *** n.i. n.i.
(0.0299) (0.0317) (0.0341) (0.0195)
Commerce 0.00261 -0.0458 -0.101 *** -0.292 *** n.i. n.i.
(0.0315) (0.0411) (0.0321) (0.0238)
Textile & clothing industry -0.0642 *** -0.0902 *** -0.124 ** -0.145 *** n.i. n.i.
(0.0225) (0.0290) (0.0521) (0.0291)
High complexity services -0.0208 0.0219 d.c. d.c. n.i. n.i.
(0.0294) (0.0630)
Low complexity services -0.0170 *** -0.0293 *** -0.0190 ** -0.0500 *** n.i. n.i.
(0.00601) (0.0107) (0.00785) (0.0141)
Age 6 or younger -0.00758 -0.000326 -0.000406 0.00605 -0.00248 -0.0709
(0.00763) (0.00941) (0.0139) (0.0109) (0.0133) (0.0550)
Age 07_18 0.00709 0.00257 0.00525 -0.00751 -0.00275 0.0247
(0.00439) (0.00584) (0.00782) (0.00605) (0.00710) (0.0267)
Age 19_65 -0.00999 * -0.00666 0.0276 *** 0.0152 * 0.00668 0.101 **
(0.00571) (0.00669) (0.0104) (0.00807) (0.0101) (0.0400)
Age 65+ -0.00600 0.0250 * 0.0125 0.0245 -0.0137 0.00964
(0.0138) (0.0142) (0.0246) (0.0181) (0.0234) (0.100)
Tubed w ater inside dw elling -0.150 * d.c. -0.0767 -0.145 *** 0.00689 0.0829
(0.0823) (0.0804) (0.0527) (0.0359) (0.123)
Electricity -0.0375 ** -0.0133 -0.144 *** -0.0547 ** -0.0247 0.0465
(0.0190) (0.0283) (0.0353) (0.0252) (0.0278) (0.115)
Water -0.00213 -0.0153 -0.0517 * -0.0442 ** 0.0205 -0.0369
(0.0158) (0.0242) (0.0276) (0.0209) (0.0247) (0.0960)
Remittances 0.0768 -0.0135 0.0983 0.116 -0.0490 0.390
(0.0800) (0.0707) (0.130) (0.0712) (0.0943) (0.300)
Non labor income 0.0319 *** 0.0274 ** -0.0243 -0.0498 ** -0.159 *** -0.135
(0.0116) (0.0116) (0.0254) (0.0224) (0.0412) (0.119)
d09 -0.0308 ** 0.00270 -0.0427 0.00332 0.0183 0.0517
(0.0142) (0.0188) (0.0285) (0.0233) (0.0356) (0.128)
d10 -0.0263 * -0.0243 -0.0269 -0.0297 0.0513 -0.0753
(0.0141) (0.0176) (0.0284) (0.0224) (0.0354) (0.135)
d11 -0.0442 *** -0.0159 0.0302 -0.0129 0.00898 -0.0191
(0.0136) (0.0178) (0.0288) (0.0225) (0.0352) (0.130)
d12 d.c. d.c. d.c. d.c. d.c. d.c.
Men Women Men Women Men Women
Variables
MARGINAL EFFECTS ON THE PROBABILITY OF LEAVING A SUCCESSFUL STATE, COMPARISON BY GENDER
Salaried formal sector Advantageous non-agricultural SE Advantageous agricultural SE