your global quality partner - amazon web services · toys, games & hardlines our global spread...
TRANSCRIPT

Annual Report 2011
Your Global Quality Partner

ContentsOverview 01 Financial Highlights 02 Intertek at a Glance 04 Chairman’s Statement
Directors’ Report – Business Review 06 Chief Executive Officer’s Review 12 Intertek Operations Committee 14 Operating Review 24 Financial Review 30 Sustainability and CSR Report
Directors’ Report – Governance 36 Board of Directors 38 Corporate Governance Report 45 Principal Risks and Uncertainties 48 Remuneration Report 57 Other Statutory Information 59 Statement of Directors’ Responsibilities
60 Independent Auditor’s Report
Financial Statements 62 Consolidated Income Statement 63 Consolidated Statement of
Comprehensive Income 64 Consolidated Statement of
Financial Position 65 Consolidated Statement of Changes in Equity 66 Consolidated Statement of Cash Flows 67 Notes to the financial statements 107 Intertek Group plc Company Balance
Sheet and Notes
Other 111 Shareholder and Corporate Information 112 Global Reporting Initiative Index
Cautionary statement
This Annual Report contains certain forward-looking statements with respect to the financial condition, results,
operations and business of Intertek Group plc. These statements and forecasts involve risk and uncertainty because
they relate to events and depend upon circumstances that will occur in the future. There are a number of factors that
could cause actual results or developments to differ materially from those expressed or implied by these forward-
looking statements and forecasts. Nothing in this Annual Report should be construed as a profit forecast.
About IntertekIntertek (www.intertek.com) is a leading provider of quality and safety solutions serving a wide range of industries around the world. From auditing and inspection, to testing, quality assurance and certification, Intertek people are dedicated to adding value to customers’ products and processes, supporting their success in the global marketplace. With a network of more than 1,000 laboratories and offices and over 30,000 people in more than 100 countries, Intertek helps its clients to meet end users’ expectations across increasingly diverse quality, health, environmental, safety and social accountability aspects in virtually any market around the world.
About IntertekIntertek (www.intertek.com) is a leading provider of quality and safety solutions serving a wide range of industries around the world. From auditing and inspection, to testing, quality assurance and certification, Intertek people are dedicated to addddiinngg value to customers’ products and processes, supportingg tthheir success in the global marketplace. WWiitthh aa network ooff mmore than 1,000 laboratories and officeess aand over 300,00000 people in more than 1100 countries, Intteerrttek helps ittss cclliients to meet endd uusseers’ expectations aaccrross increassiinngglyy diverse quality, healltthh,, environmentall, ssaaffety and socciiaall accountability aspeeccttss in virtually any mmaarket aarroound the world.

79.385.3
2010 2011
89.4
107.2
2010 2011
227
281
2010 2011
1,374
1,749
2010 2011
25.528.1
33.7
2009 2010 2011
20.818.0
2007 2008
81.589.4
107.2
2009 2010 2011
67.1
48.8
2007 2008
2007
122
165
209227
281
2008 2009 2010 2011
2007
775
1,004
1,2371,374
1,749
2008 2009 2010 2011
1. Adjusted operating profit, adjusted operating margin and adjusted diluted earnings per share (‘EPS’) are stated before Separately Disclosed Items, which are described in note 3 to the financial statements.
2. Dividend per share for 2011 is based on the interim dividend paid of 10.7p (2010: 9.3p) plus the proposed final dividend of 23.0p (2010: 18.8p).3. CAGR represents the five year compound annual growth rate. 4. Growth at constant exchange rates compares both 2011 and 2010 at the average exchange rates for 2011.
Strong revenue and profit performance in 2011
> Revenue up 27%
> Organic revenue4 up 8.3%
> Adjusted operating profit1 up 24%
> Adjusted operating margin1 16.1%
2011
Strong five year growth record
> Revenue up 23%
> Adjusted operating profit1 up 23%
> Adjusted diluted EPS1 up 22%
> Dividend per share2 up 17%
Five Year TrendRevenue £m
+27%Organic revenue +8.3% at constant exchange rates4
Adjusted operating profit1 £m
+24%
Adjusted diluted EPS1 (pence)
+20%
Statutory diluted EPS (pence)
+8%
Revenue £m
+23%CAGR3
Adjusted operating profit1 £m
+23%CAGR3
Adjusted diluted EPS1 (pence)
+22%CAGR3
Dividend per share2 (pence)
+17%CAGR3
Intertek Annual Report 2011 | 01
Financial Highlights
We are a market leading provider of services to the textiles, toys, footwear, hardlines, food and retail industries. As partner to retailers, manufacturers and distributors, we offer expertise on issues ranging from restricted hazardous substance and sustainability to supply chain security and legislation relating to environmental, ethical and trade security issues. Services include testing, inspection, auditing, advisory services, quality assurance and hazardous substance testing.
Consumer Goods
Intertek is a leading provider of quality and safety solutions. From auditing and inspection to testing, quality assurance and certification, we work in partnership with our clients to help them succeed in the global marketplace.
Our Industries
Aerospace & Automotive
Building Products
Chemicals
Consumer Goods & Retail
Electrical & Electronic
Energy
Food & Agriculture
Government & Trade
Industrial & Manufacturing
IT & Telecoms
Medical & Pharmaceutical
Minerals
Petroleum
Textiles, Apparel & Footwear
Toys, Games & Hardlines
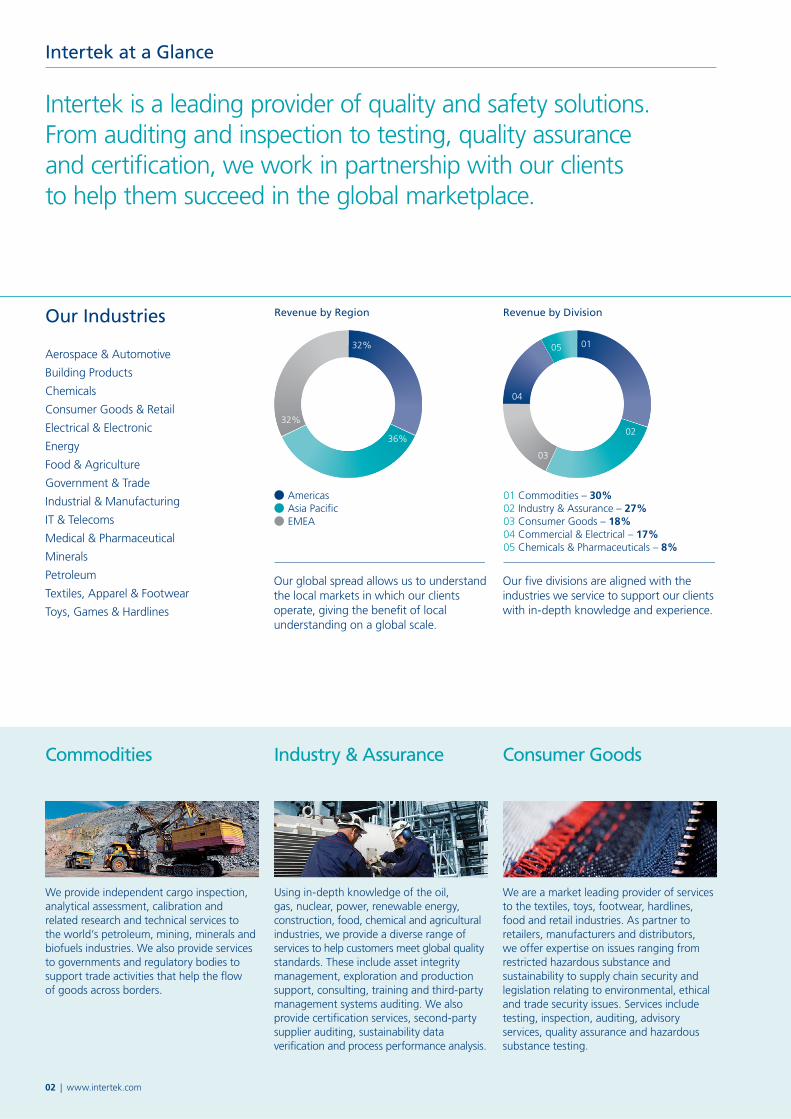
Our global spread allows us to understand the local markets in which our clients operate, giving the benefit of local understanding on a global scale.
Our five divisions are aligned with the industries we service to support our clients with in-depth knowledge and experience.
Commodities
We provide independent cargo inspection, analytical assessment, calibration and related research and technical services to the world’s petroleum, mining, minerals and biofuels industries. We also provide services to governments and regulatory bodies to support trade activities that help the flow of goods across borders.
Using in-depth knowledge of the oil, gas, nuclear, power, renewable energy, construction, food, chemical and agricultural industries, we provide a diverse range of services to help customers meet global quality standards. These include asset integrity management, exploration and production support, consulting, training and third-party management systems auditing. We also provide certification services, second-party supplier auditing, sustainability data verification and process performance analysis.
Industry & Assurance
32%
36%
32%
Americas Asia Pacific EMEA
Revenue by Region
01
02
04
03
05
01 Commodities – 30% 02 Industry & Assurance – 27% 03 Consumer Goods – 18% 04 Commercial & Electrical – 17% 05 Chemicals & Pharmaceuticals – 8%
Revenue by Division
02 | www.intertek.com
Intertek at a Glance
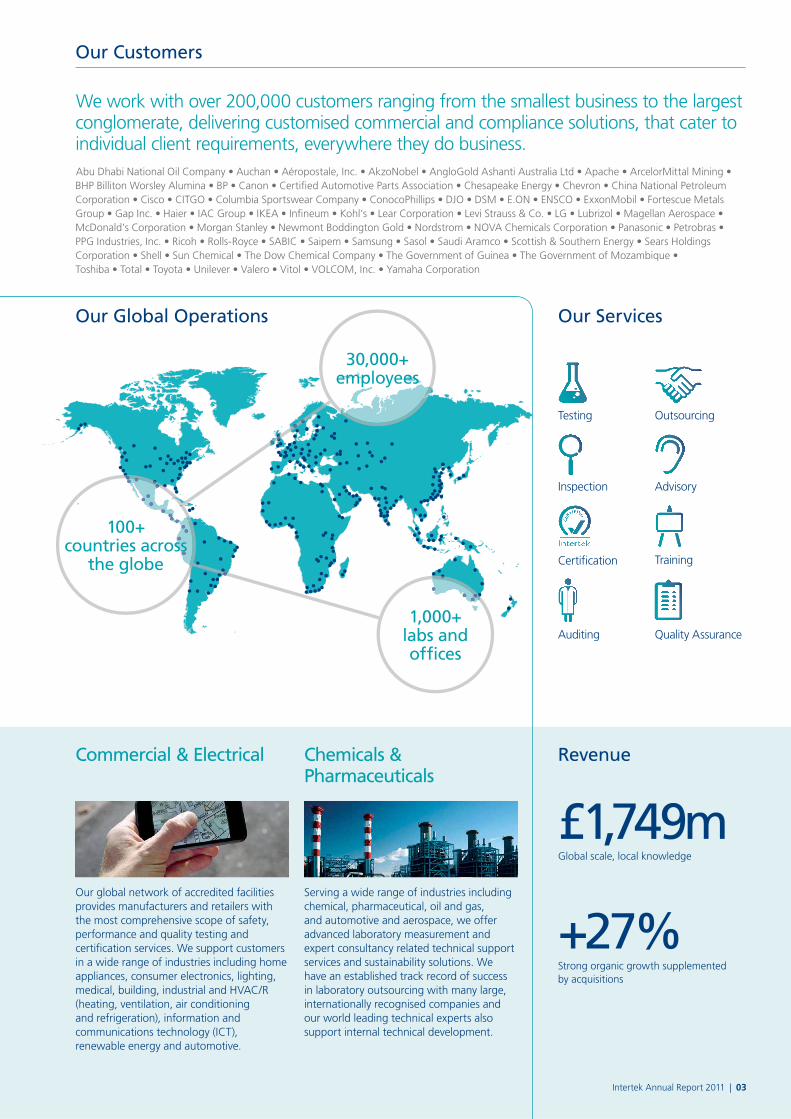
Our Global Operations
Chemicals & Pharmaceuticals
Serving a wide range of industries including chemical, pharmaceutical, oil and gas, and automotive and aerospace, we offer advanced laboratory measurement and expert consultancy related technical support services and sustainability solutions. We have an established track record of success in laboratory outsourcing with many large, internationally recognised companies and our world leading technical experts also support internal technical development.
Commercial & Electrical
Our global network of accredited facilities provides manufacturers and retailers with the most comprehensive scope of safety, performance and quality testing and certification services. We support customers in a wide range of industries including home appliances, consumer electronics, lighting, medical, building, industrial and HVAC/R (heating, ventilation, air conditioning and refrigeration), information and communications technology (ICT), renewable energy and automotive.
We work with over 200,000 customers ranging from the smallest business to the largest conglomerate, delivering customised commercial and compliance solutions, that cater to individual client requirements, everywhere they do business.
£1,749mGlobal scale, local knowledge
+27%Strong organic growth supplemented by acquisitions
Outsourcing
Advisory
Training
Quality Assurance
Inspection
Certification
Auditing
Testing
Our Services
Revenue
1,000+ labs and offices
30,000+ employees
100+ countries across
the globe
Intertek Annual Report 2011 | 03
Our Customers

Sir David ReidChairman
ResultsIt was my great pleasure to join Intertek at the end of 2011 and I am delighted to announce strong full year growth. The Group generated revenue of £1,749m, an increase of 27% over the prior year. Excluding acquisitions, revenue growth was 8%.
Operating profit was £234m, up 13% over the prior year. Adjusted operating profit increased to £281m, up 24% and our adjusted operating margin was 16.1%. Excluding acquisitions, adjusted operating profit grew by 9%.
Earnings per shareBasic earnings per share were 86.8p, up 8% over the prior year and adjusted diluted earnings per share were 107.2p, up 20%.
DividendsAn interim dividend of 10.7p per share (2010: 9.3p) was paid to shareholders on 18 November 2011. The Directors will propose a final dividend of 23.0p per share at the Annual General Meeting
will make a full year dividend of 33.7p per share (2010: 28.1p), an increase of 20%.
AcquisitionsWe continue to make targeted acquisitions and in 2011 we completed the significant purchase of Moody International (‘Moody’), along with four smaller but strategically important acquisitions for a cash consideration of £460m (2010: £42m). Further details of these acquisitions are given in the Operating Review by division and in note 10 to the financial statements. Our strong financial position will allow us to continue to make advantageous bolt-on acquisitions in key industry sectors and to evaluate strategic acquisition opportunities to increase shareholder value.
Moody InternationalWhen we presented our 2010 results in March 2011, we announced the £450m acquisition of Moody, a leading provider of technical services to the global energy industry and a provider of systems certification services. This acquisition has positioned Intertek at the forefront of the global energy market and has provided a platform for the provision of infrastructure services whilst extending the depth of our service portfolio for energy assets, processes and products. We have integrated Moody into our Industry & Assurance business and we are delighted to welcome the company and its 2,500 employees into the Intertek family.
It was my great pleasure to join Intertek at the end of 2011 and I am delighted to announce strong full year growth.
04 | www.intertek.com
Chairman’s Statement

The BoardIt was my great pleasure to join Intertek at the end of last year and I am looking forward to chairing the Board and continuing its successful track record. Since joining the Board I have been impressed by the members’ mix of skills and business experience and their commitment to the highest standards of corporate governance.
During the year we welcomed Michael Wareing and Alan Brown to the Board as Non-Executive Directors on 15 April 2011. Further details of their business experience can be found in their biographies on page 37.
Vanni Treves retired as Chairman and from the Board on 31 December 2011. As Chairman of the Board over a period of ten years he made a major contribution to Intertek’s development and growth. The Board expresses their gratitude for his work and wishes him every enjoyment for the future.
On 31 December 2011, David Allvey and Debra Rade stepped down from the Board after serving ten and six years respectively. They leave with our thanks for the invaluable role that they have played in positioning Intertek for continued strong growth. Gavin Darby chose not to seek re-election to the Board at the Annual General Meeting, effectively stepping down from the Board on 20 May 2011.
Into 2012 the Board continues to have the strength and experience required to perform its duties effectively.
SustainabilityIn 2011 Intertek reviewed and reaffirmed its commitment to sustainability. Whilst being a service provider means that Intertek’s operations have a lower impact on the environment than other business sectors, we are mindful of the impact that our operations may have on our communities, employees, customers and the environment.
Intertek is a global and local business with operations that span more than 1,000 laboratories and offices. The Group’s approach to sustainability reflects this diversity. Intertek has a global sustainability policy framework with programmes for implementation down to the local level. This enables local management to adapt these global policies and implement them appropriately in their respective areas and local environment.
Since joining the Group I have been impressed by the many ways in which Intertek’s services are helping to protect human health and the environment. Intertek is helping companies to develop safer, greener products and to run safer operations with better integrity and a lower social and environmental impact. It plays an important role in helping companies achieve compliance with safety, quality and environmental regulations and helping them to adapt their products and processes to meet future regulations.
Given the commitment of our people and their spirit of good corporate citizenship, our sustainability efforts will help underpin
in this area in the Sustainability and CSR report which starts on page 30.
IntegrityAs an enterprise where integrity, independent judgement and fair assessment are critical components of the services we provide, it is essential that we are committed to having good business ethics. The Group has robust ethical policies and control procedures against corruption and bribery. These policies and procedures are well developed and are continually reviewed to align with best practice and ensure that they remain in step with the values and evolution of our business.
Our peopleOur people and their dedication to adding value to customers’ products and processes, are central to our success in the global marketplace. We strive to attract, develop and retain the best people who share in the mission, values and success of the Group and can help us to provide our customers with deep insight and understanding of quality issues in their industries from a local and global perspective. It is this network of skills and experience among our people that helps to set us apart from our competitors, providing valuable business support to our customers which, in turn, strengthens our partnership with them.
Through acquisitions and organic growth we added over 4,500 new employees in 2011 and I would like to welcome them to the Group. More than 30,000 Intertek people now work to support our customers in over 100 countries every day. The dedication of our employees to customer service helped us to gain new business and strengthen our relationships with our customers in 2011.
The Board extends its thanks to all of our employees around the world for their continuing commitment and work which has made 2011 another successful year.
OutlookOur strong growth drivers combined with our strategic focus on supporting global quality needs give us confidence that we will report another year of strong results in 2012 and extend our track record of growth delivery into the future.
Intertek Annual Report 2011 | 05
Chairman’s Statement
Our mission Intertek’s mission is to provide solutions to our customers that allow them to improve the quality of their products, operations and processes. The world’s leading companies, their suppliers and partners trust us to add value to their brands by providing solutions that enable them to increase their competitive advantage and support their global trade.
Whether we are looking at the largest piece of energy infrastructure or the smallest molecule or fibre, more than 30,000 Intertek people are working in partnership with our customers across the length of their supply chains each day. Our customers rely on us to be with them at every step from product development to point of sale, wherever in the world that may be. Our mission requires us to understand the diverse local markets and supply chains and industries they operate in, whilst also giving them the benefit of global perspective.
We deliver our services across a wide range of industries as shown in the ‘Intertek at a Glance’ section of this Report.
The market for quality Intertek’s marketplace is the drive for quality. As organisations develop and pursue success, the quality of their products and processes becomes an increasingly important differentiator. Quality encompasses many dimensions; all of which Intertek sets out to serve. It may include establishing the safety of a new prototype or the performance of a new technological innovation. We may measure the technical accuracy of a piece of infrastructure or verify the sustainability of a supply chain. Intertek’s strategic focus is on meeting our customers’ need for quality wherever it arises in their organisations and processes.
The demand drivers for our services come from within our customers’ organisations and from external commercial, regulatory and macro-economic forces. Drivers of the quality market include the development of new technologies, the trend towards outsourcing non-core activities and the demands of consumers across a range of quality, safety and environmental criteria. Our clients are also under pressure to increase efficiency, speed up time-to-market and reduce costs, to increase their competitive edge. Global trade and the continual flux in sourcing patterns and supply chains, as well as end-user demand for higher quality and more sustainable products are also increasing the demand for our services.
These drivers have shown resilience in times of global economic uncertainty, although like all companies we are also impacted by developments in the global economy.
Wolfhart HauserChief Executive Officer
Our strategy is well-established. It positions us to capture enduring drivers of growth for our business and to increase our value to shareholders and to our customers as their global quality partner.
06 | www.intertek.com
Chief Executive Officer’s Review
DifferentiationIntertek’s focus on quality and our service delivery to customers differentiates us in the marketplace. We aim to create a trusted partnership with our customers, providing solutions that can improve their competitive advantage. Our goal is to create added value to their business above and beyond the immediate services provided.
As a customer-focused organisation, we recognise that the way we deliver our services is as important as what we deliver. Our customers want to get their products to market today more quickly than they did yesterday. They want their cargoes transferred faster and their infrastructure projects completed ahead of schedule; and they want all of this with more reassurance and less risk than before. We continually develop our services to meet customer needs for more efficiency, lower cost, and greater assurance.
Expanding capabilitiesIntertek focuses on providing a range of complementary services to meet the needs of our clients along the entire supply chain. We continue to deepen our presence in each of our industries through a combination of organic investment, acquisitions and launching new products and services to meet customers’ present and future needs.
In 2011 we opened over 20 new facilities in regions where our clients are increasing their activities in sourcing new goods, producing new technologies or extracting and developing new resources. We extended our capabilities and expertise at over 40 of our global locations in 2011, where our clients’ innovations continue to lead us to invest in new testing technologies, capabilities and knowledge.
Our acquisition of the global energy infrastructure and business assurance services company, Moody International in 2011 has significantly expanded our capabilities in the energy infrastructure market. We are now a leading provider of global technical inspection, consulting and safety services, supporting our energy-sector customers on their new and existing infrastructure projects. We also completed four further acquisitions in 2011, bringing us additional capabilities and geographic presence in the food, chemical, agriculture, oil and retail sectors.
Intertek launched a number of new services in 2011. These included a dynamic online portal for our retail clients that enables them to better collect and collate data on the sustainability and quality of their suppliers’ factories, allowing continuous monitoring of operational performance inside their facilities. For our commodities clients, we launched new retail fuel quality management programmes in emerging markets, and extended our combined fuel additive and cargo transfer solutions into Central and South America. We doubled our testing capability for renewable energy testing technologies in North America and opened new energy storage and electrical vehicle battery testing laboratories in China, Europe and North America. We launched new expert analytical capabilities in the biologics pharmaceutical market.
Our organisationIntertek is connected by specialist divisions and by geography. Our customers benefit from global knowledge combined with local support and in-depth understanding of local market conditions. Our internal Intertek as One programme is enabling us to better combine and bundle services to our clients to meet a wider range of quality needs across their organisation. This programme is also allowing us to improve our operational efficiency with better operating platforms and connectivity between our people and business services. We continue to invest in our people and processes to provide our customers with even better delivery of quality.
Going forwardOur strategy is well-established and continues to allow us to grow our business and to increase our value to shareholders.
the increasing demand for our services, and to maintain differentiation which positions us as a sought-after and trusted partner to our clients.
Our broad portfolio of industry services and geographic diversity provides the platform to invest in fast growing sectors and markets and positions us well for future growth.
Intertek Annual Report 2011 | 07
Chief Executive Officer’s Review

Market drivers in our industriesAs our customers develop new products, build new infrastructure and get their products and projects to market more quickly, we help them ensure that their business isn’t compromised by poor quality. Companies seek quality solutions for a wide variety of reasons. Some common ones are listed here.
Our market
Global quality servicesThe global marketplace for quality solutions is dynamic and diverse. As organisations in developed and developing economies pursue success, the need to develop and maintain the right quality in their products and processes arises. Below are some of the dynamics that create Intertek’s chosen marketplace: Quality.
End-user expectationsConsumers in developed economies trust companies that deliver products, or perform, with consistent quality. This requires investment in quality solutions to maintain or increase their reputation for ‘quality’. Consumers in emerging markets are also demanding higher levels of quality across a diverse range of criteria, creating new markets for quality services from local and international brands.
New technologies Companies create new products and technologies to create new markets, increase sales and to respond to diverse end-user demands. Quality services are needed from the concept stage through to delivery to the end market.
Regulations Quality, safety and environmental regulations and industry standards continue to expand and change across companies and cultures. Companies utilise quality services to maintain compliance and navigate regulatory change.
Supply chain dynamics Our customers create products and infrastructure using suppliers and components across multiple countries. They seek assurances on quality along the supply chain to reduce the risk of product, brand and operational failures, and to increase visibility and efficiency along the supply chain.
Energy growth and development Global demand for energy is driving increased development and trading of energy resources and infrastructure. Our customers are requiring more quality, safety and environmental assurance support in their expanding resource production and trading activities.
SafetyReducing the risk of injuries and danger to life and health from products, materials, components and operations.
SustainabilityHelping companies to improve the social, health and environmental impact of their products and processes.
PerformanceEnabling organisations to optimise the technical output of their products or processes.
IntegrityEvaluating the composition or reliability infrastructure, materials, commodities, components and systems.
DesirabilityIncreasing the appeal of products, materials and new innovations to the varying preferences of end-users in different markets.
What is quality?The need for quality arises at many separate and interrelated points across a customer’s organisation. Quality is diverse and may reflect one or many of the following dimensions – all of which Intertek serves.
08 | www.intertek.com
Chief Executive Officer’s Review

Our growth opportunitiesMacro-economic trends and opportunities in our sector create growth in the demand for quality services and add resilience to our business model. We see continuing opportunities to expand our business and increase value to shareholders due to the following enduring drivers of growth in our marketplace.
Intertek is positioned to capture the additional market created through growth and increasing interconnectedness in global trade as well as expanding regional trade among fast-growth nations. In creating, buying and selling products each day, our customers seek independent assurance on the quality of materials received from their trading partners.
Global trade and emerging market trade growth
Our customers’ efforts to innovate, meet consumer demand for quality, develop energy resources, maintain efficient supply chains and comply with regulations create demand for quality services. Their ongoing development of new technologies, energy resources and quality in their products is increasing the demand for our solutions.
Market drivers in our industries
Network and service expansion
Expanding our services into new markets and developing new services in existing markets will enable us to capture new business. We continue to invest in new services and capabilities to support our customers’ current and future needs and to expand in growing markets.
Outsourcing and consulting services
By creating quality solutions that enhance our customers’ business, we can increase the outsourcing of quality services and related consultancy by companies to Intertek. Today, many companies address quality needs internally but at a higher cost with less flexibility and dedicated knowledge.
Industry consolidation By making value-adding acquisitions, we are consolidating our position in key industries. These also allow us to add complementary capabilities to our service portfolio and grow our business through a full-service offering for each customer in each industry.
Intertek Annual Report 2011 | 09
Chief Executive Officer’s Review
Global
Quality
Partner
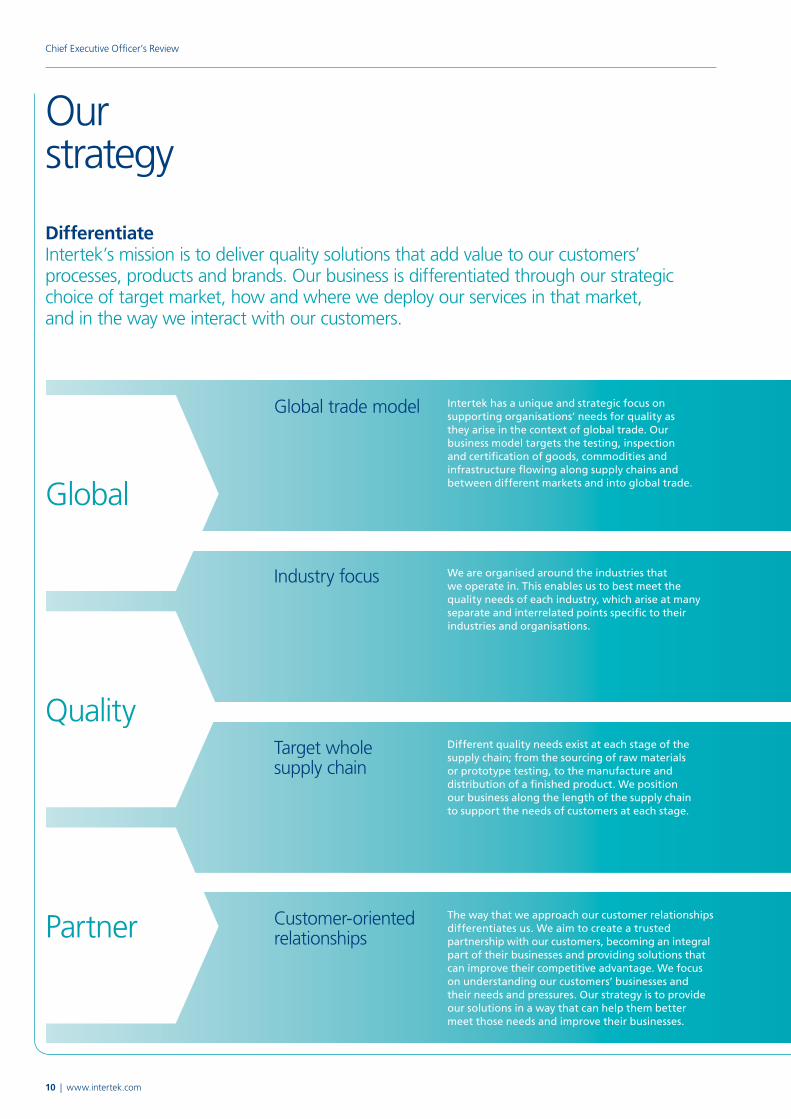
Differentiate Intertek’s mission is to deliver quality solutions that add value to our customers’ processes, products and brands. Our business is differentiated through our strategic choice of target market, how and where we deploy our services in that market, and in the way we interact with our customers.
Global trade model Intertek has a unique and strategic focus on supporting organisations’ needs for quality as they arise in the context of global trade. Our business model targets the testing, inspection and certification of goods, commodities and infrastructure flowing along supply chains and between different markets and into global trade.
Industry focus We are organised around the industries that we operate in. This enables us to best meet the quality needs of each industry, which arise at many separate and interrelated points specific to their industries and organisations.
Target whole supply chain
Different quality needs exist at each stage of the supply chain; from the sourcing of raw materials or prototype testing, to the manufacture and distribution of a finished product. We position our business along the length of the supply chain to support the needs of customers at each stage.
Customer-oriented relationships
The way that we approach our customer relationships differentiates us. We aim to create a trusted partnership with our customers, becoming an integral part of their businesses and providing solutions that can improve their competitive advantage. We focus on understanding our customers’ businesses and their needs and pressures. Our strategy is to provide our solutions in a way that can help them better meet those needs and improve their businesses.
Our strategy
Chief Executive Officer’s Review
10 | www.intertek.com

Network expansion
in key industries
New services for the present and future
Investing in our people
We continue to expand and deepen our network and knowledge in new regions and in new and existing industries to capture opportunities for growth. This enables us to meet demand from changes in global, interregional and local trade and deepen our position in established and growing markets.
We develop our service lines to support quality needs along the length of the supply chain through organic investment and acquisition. We concentrate on industry sectors where we have the critical size to hold leading positions and provide our customers with world-class services.
We create new services and innovations for our customers to help their businesses succeed. We develop capabilities along the frontier of science and innovation which drives market demand for quality services in the future. We develop new tools and interfaces in areas where we can support customers in new, smarter ways.
Our people are our core assets and we invest continually in them. They are chosen for their technical expertise, values and their understanding of local culture. Our people are experts and leaders in their fields, including engineers, chemists, biologists, consultants and geologists. Many are holders of research doctorates, are graduates or advisors to global institutions. Our talented and dedicated people provide our customers with the expertise they need to succeed.
Deliver Our strategy is to be the premier service provider in our chosen markets. We continue to invest in and develop our business delivery model in order to be our customers’ partner of choice.
Chief Executive Officer’s Review
Intertek Annual Report 2011 | 11

The day-to-day management of the Group is undertaken by the Intertek Operations Committee (‘IOC’).
The IOC currently comprises the two Executive Directors, the five Executive Vice Presidents who head up the operating divisions, the Vice President of Human Resources and the Chief Information Officer.
Wolfhart Hauser Chief Executive Officer
the Board as Chief Executive Officer in March 2005 after serving as a Non-Executive Director since November 2002. Wolfhart Hauser was previously Chief Executive Officer and President of TÜV Süddeutschland AG for four years and Chief Executive Officer of TÜV Product Services for 10 years. Starting his career with various research activities he went on to establish and lead a broad range of successful international service industry businesses. He has held several non-executive board director and chairman roles in a variety of technology companies. He is currently a Non-Executive
Andrew SwiftDivision Executive Vice President Chemicals & Pharmaceuticals
was Vice President of Global Outsourcing within Intertek’s Oil, Chemical & Agri division, having originally started as Business Development Manager and then Director of Global Outsourcing. Andrew began
he became Managing Director in 1993.
Lloyd Pitchford Chief Financial Officer
Board as Chief Financial Officer in April 2010.
with BG Group plc in various operational
Middle East; including five years as Group Financial Controller. He previously worked for Mobil Oil Corporation in various financial,
is a Fellow of the Chartered Institute of Management Accountants and holds an MBA from Heriot-Watt University.
Gregg TiemannDivision Executive Vice PresidentCommercial & Electrical
was President of Intertek’s Commercial & Electrical division in Europe and the Americas since 2004, having started as General
laboratories in 1993. Before joining Intertek, Gregg worked in sales and marketing for the software industry.
12 | www.intertek.com
Intertek Operations Committee

Paul YaoGroup Executive Vice PresidentConsumer Goods
appointed a member of the Executive
Vice President with responsibility for Consumer Goods in China and Taiwan. Before joining Intertek, Paul worked in Regional Sales & Marketing for companies such as Hitachi Chemical, Brent Plc and SISIR Singapore.
Ann-Michele BowlinChief Information Officer
was appointed Chief Information Officer of Intertek Group in September 2010 and
is responsible for driving the Group’s IT strategy and its alignment with the wider organisation. Ann-Michele joined as Group Vice President, Shared Services, to work with business and finance leaders to develop the Group shared services strategy. Prior to joining Intertek, Ann-Michele held multiple leadership and operational positions in a variety of industries including manufacturing, technology, travel and professional services. Ann-Michele holds a BA from Wellesley College MA, USA.
Jay GutierrezDivision Executive Vice PresidentCommodities
Previously, he was Vice President for the Oil, Chemical and Agri division in the Americas.
inspection and testing industry. He began his career with Intertek with a focus to develop the Chemical business stream, later assuming responsibility for International Coordination and Sales & Marketing. Prior to joining Intertek he spent eight years as General
Jonathan LawrenceGroup Executive Vice PresidentHuman Resources
has many years experience as an international human resources director in the testing and inspection business and has been
the USA. In addition to human resources,
communications across the Intertek Group. Before moving to Intertek, he was Group Senior Vice President of Human Resources at Bureau Veritas and prior to this he was Group Director Management Development at Valeo Automotive.
Stefan ButzGroup Executive Vice PresidentIndustry & Assurance
to Industry & Assurance, Stefan Butz has responsibility for the Group functions of Strategy, Corporate Development and Marketing. Stefan has held this role since
from TÜV SÜD, where he held the position of CEO Americas, with an earlier role as Head of Corporate Development. Prior to this he was a Strategy Consultant with Accenture Germany.
Intertek Annual Report 2011 | 13
Intertek Operations Committee
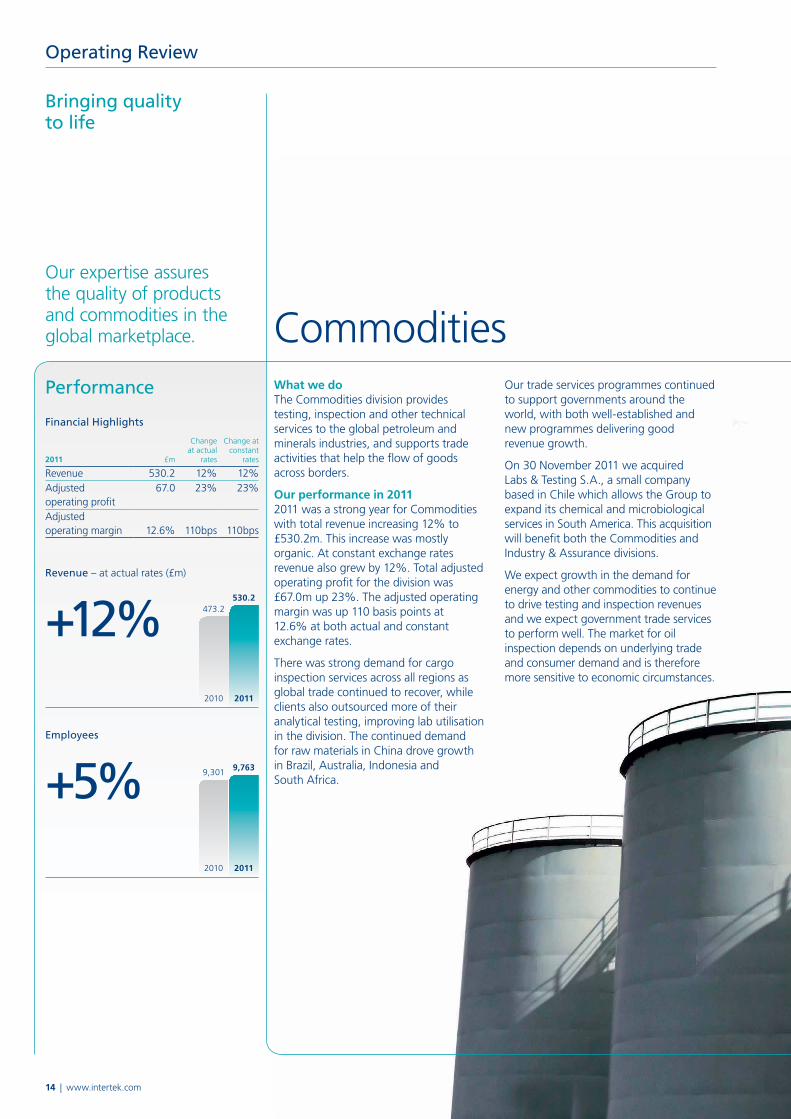
Our expertise assures the quality of products and commodities in the global marketplace.
Bringing quality to life
What we do The Commodities division provides testing, inspection and other technical services to the global petroleum and minerals industries, and supports trade activities that help the flow of goods across borders.
Our performance in 2011 2011 was a strong year for Commodities with total revenue increasing 12% to £530.2m. This increase was mostly organic. At constant exchange rates revenue also grew by 12%. Total adjusted operating profit for the division was £67.0m up 23%. The adjusted operating margin was up 110 basis points at 12.6% at both actual and constant exchange rates.
There was strong demand for cargo inspection services across all regions as global trade continued to recover, while clients also outsourced more of their analytical testing, improving lab utilisation in the division. The continued demand for raw materials in China drove growth in Brazil, Australia, Indonesia and South Africa.
Our trade services programmes continued to support governments around the world, with both well-established and new programmes delivering good revenue growth.
On 30 November 2011 we acquired
based in Chile which allows the Group to expand its chemical and microbiological services in South America. This acquisition will benefit both the Commodities and Industry & Assurance divisions.
We expect growth in the demand for energy and other commodities to continue to drive testing and inspection revenues and we expect government trade services to perform well. The market for oil inspection depends on underlying trade and consumer demand and is therefore more sensitive to economic circumstances.
Operating Review
473.2530.2
2010 2011
Revenue – at actual rates (£m)
+12%
9,301 9,763
2010 2011
Employees
+5%
Financial Highlights
2011 £m
Changeat actual
rates
Change at constant
rates
Revenue 530.2 12% 12%Adjusted operating profit
67.0 23% 23%
Adjusted operating margin 12.6% 110bps 110bps
Performance
Commodities
14 | www.intertek.com
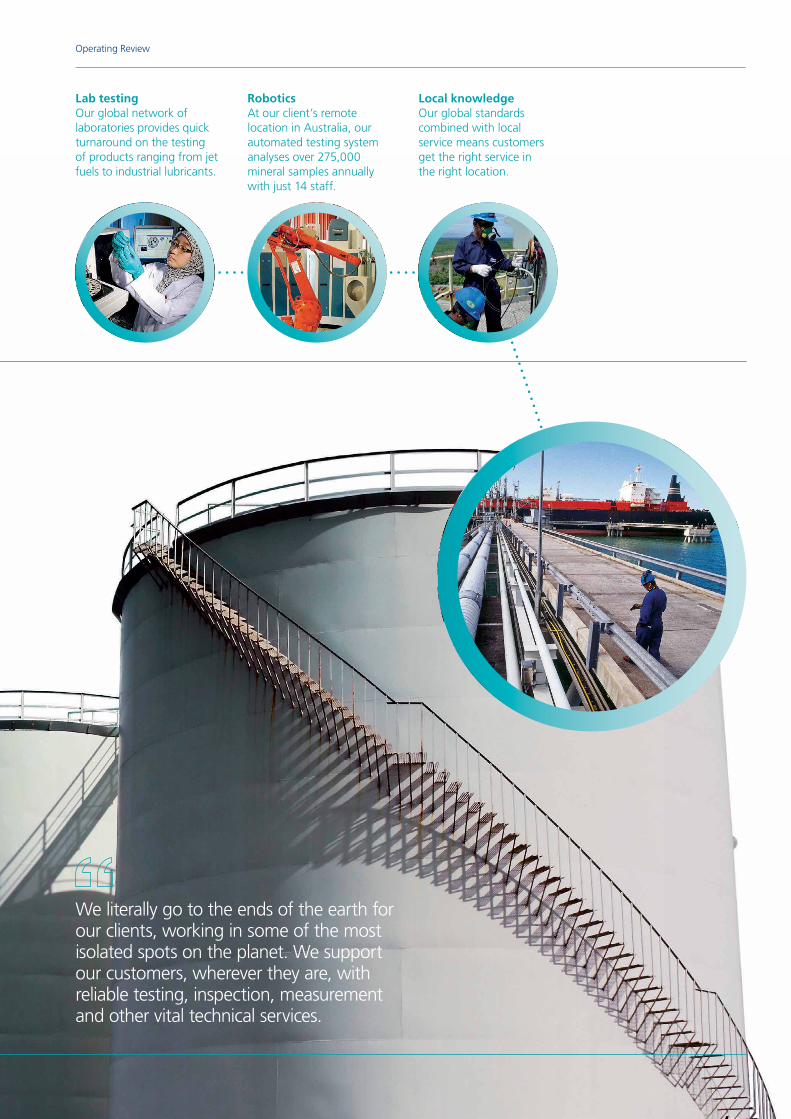
Local knowledge Our global standards combined with local service means customers get the right service in the right location.
RoboticsAt our client’s remote location in Australia, our automated testing system analyses over 275,000 mineral samples annually with just 14 staff.
Lab testingOur global network of laboratories provides quick turnaround on the testing of products ranging from jet fuels to industrial lubricants.
Operating Review
We literally go to the ends of the earth for our clients, working in some of the most isolated spots on the planet. We support our customers, wherever they are, with reliable testing, inspection, measurement and other vital technical services.

191.2
468.6
2010 2011
Bringing quality to life
Industry & Assurance
Performance
Financial Highlights
2011 £m
Changeat actual
rates
Change at constant
rates
Revenue 468.6 145% 145%Adjusted operating profit
50.9 207% 208%
Adjusted operating margin 10.9% 220bps 230bps
Revenue – at actual rates (£m)
+145%
Employees
+118%
portfolio of services for energy assets, processes and products, creating a new leading technical services platform for the global energy market and bringing global scale to the Group’s systems certification business. Approximately 2,500 people in over 80 offices and 60 countries have brought their experience and expertise into the Intertek Group and the integration has progressed smoothly. Moody benefitted from the structural recovery of the energy market and performed ahead of expectations in the period since acquisition.
and microbiological services for food
Testing S.A. as described in Commodities on page 14.
Revenue growth in the division is driven by continued demand for energy, complexity in the supply chain and our clients’ need for high quality independent advice. The combined strength of the integrated division will enable it to compete in the global energy industry and systems certification market, providing a broader more comprehensive range of services to customers. Cost synergies from the integration of operations, support services and facilities will benefit future operating profit.
What we doThe Industry & Assurance division provides a wide range of services including asset integrity management, engineering, inspection, auditing, certification, consulting, training, staffing, and testing services. We serve a wide variety of industries including oil, gas, petrochemical, power, renewable energy, and civil and infrastructure. We also provide services to customers in the food and agricultural sectors.
Our performance in 2011 2011 has been a transformational year for the Industry & Assurance division following the acquisition of Moody on 27 April. Total revenue was £468.6m, up 145% at both actual and constant exchange rates. Excluding acquisitions revenue growth was 7%. Total adjusted operating profit was £50.9m up 207%. Excluding acquisitions adjusted operating profit reported a marginal decline. The total adjusted operating margin increased 220 basis points from 8.7% to 10.9% in 2011. The organic operating margin at constant exchange rates declined 60 basis points to 7.9%, mainly due to difficult trading conditions in the agri sector.
Moody is a leading provider of quality and safety services to the energy industry. It also provides systems certification services to the manufacturing, construction and service markets. The acquisition, which was completed for a cash consideration of £450m, extends the depth of the division’s
2,772
6,053
2010 2011
16 | www.intertek.com
Operating Review

Our client was constructing an oil
site construction support and technical inspection services we helped increase efficiency and quality control while reducing risk.
Intertek Annual Report 2011 | 17
Operating Review
Powering safer futuresOur engineers and specialists work with clients to ensure the highest quality, safety and reliability in the production and manufacture of goods and services across the entire supply chain.

303.9 315.7
2010 2011
Financial Highlights
2011 £m
Changeat actual
rates
Change at constant
rates
Revenue 315.7 4% 5%Adjusted operating profit 106.3 – 1%Adjusted operating margin 33.7% (120)bps (130)bps
Zero injuries have been reported following the implementation of our meticulous quality and safety programme for toys marketed by one of our leading global clients.
8,842 9,177
2010 2011
Bringing quality to life
Consumer Goods
Our expertise helps our customers gain faster, more efficient entry to virtually any market in the world through our global network of accredited laboratories.
What we do The Consumer Goods division partners with global retailers, manufacturers and distributors to enhance clients’ products, processes, and brands. We provide services to the textiles, toys, footwear, hardlines and retail industries amongst others. Our services include testing, inspection, auditing, advisory services, quality assurance, and hazardous substance testing.
Our performance in 2011The Consumer Goods division continued to deliver growth, with total revenue of £315.7m, an increase of 4% (5% at constant exchange rates). The majority of the growth was organic. Total adjusted operating profit of £106.3m was flat year-on-year at actual exchange rates but up 1% at constant exchange rates. The adjusted operating margin decreased 120 basis points to 33.7%, mainly due to difficult trading conditions at the start of 2011. Both revenue growth and the operating margin improved significantly in the second half.
Growth in the Consumer Goods division was driven by the demand for testing of textiles and toys, which continued to increase despite concerns around global economic growth. While cost pressures saw some changes in manufacturers’ sourcing patterns away from China towards South East Asia and Eastern Europe, our global network of testing laboratories ensured we maintained close links with our customers and achieved good growth, notably in Vietnam, Bangladesh, Turkey and Guatemala.
Developpement & Consulting – Bruxelles SA a company based in Belgium which will enhance our environmental service offering in Europe and support our strategic focus on sustainable business practices across our client base.
The growth drivers in Consumer Goods remain strong, with increased consumer demand for quality and safety, product sourcing from lower cost manufacturers and legislative changes all creating a market for our services. The development of innovative solutions and delivery models for clients will also help to grow revenues.
Performance
Revenue – at actual rates (£m)
+4%
Employees
+4%
18 | www.intertek.com
Operating Review
18 | www.intertek.com

Inspiring confidence As products compete in an ever more crowded marketplace, testing by Intertek represents a mark of quality that customers can trust.
Integrating safety and quality Our extensive range of testing procedures ensures that products meet or exceed legislative requirements, providing safe products for families around the world.
Intertek Annual Report 2011 | 19
Operating Review
Intertek Annual Report 2011 | 19
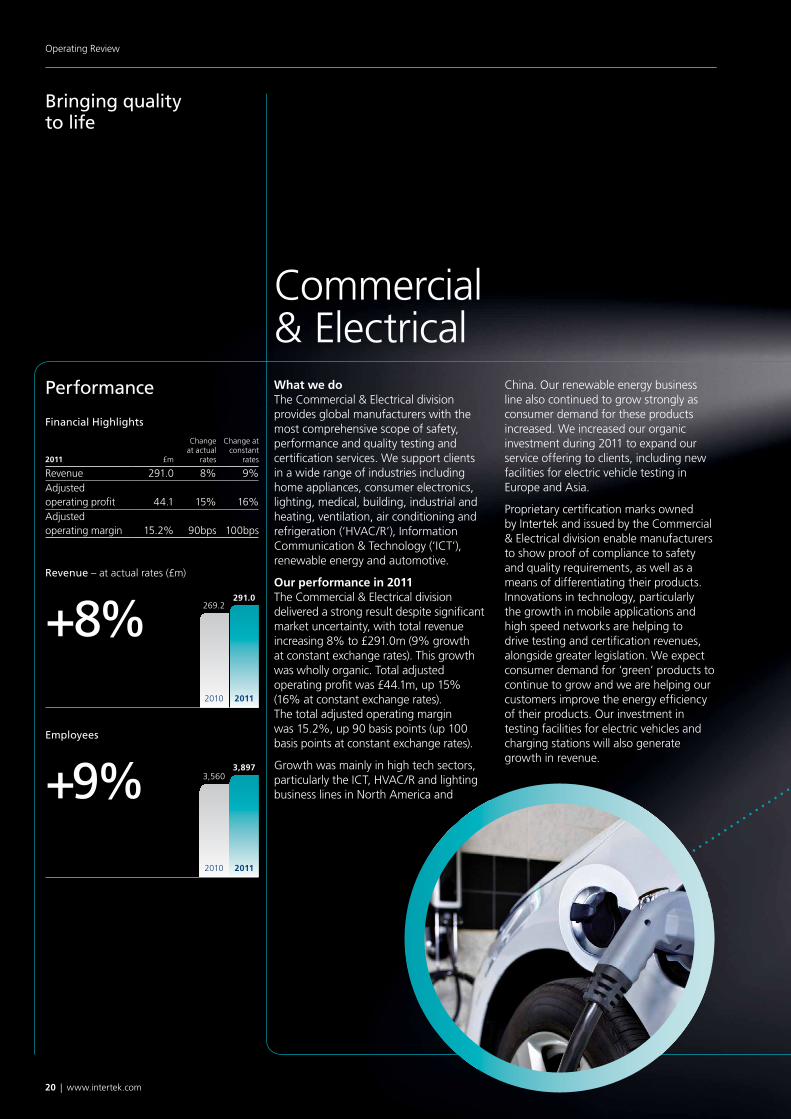
Revenue – at actual rates (£m)
+8%
Employees
+9%
269.2291.0
2010 2011
3,5603,897
2010 2011
Bringing quality to life
Performance
Commercial & ElectricalWhat we do The Commercial & Electrical division provides global manufacturers with the most comprehensive scope of safety, performance and quality testing and certification services. We support clients in a wide range of industries including home appliances, consumer electronics, lighting, medical, building, industrial and heating, ventilation, air conditioning and refrigeration (‘HVAC/R’), Information Communication & Technology (‘ICT’), renewable energy and automotive.
Our performance in 2011The Commercial & Electrical division delivered a strong result despite significant market uncertainty, with total revenue increasing 8% to £291.0m (9% growth at constant exchange rates). This growth was wholly organic. Total adjusted operating profit was £44.1m, up 15% (16% at constant exchange rates). The total adjusted operating margin was 15.2%, up 90 basis points (up 100 basis points at constant exchange rates).
Growth was mainly in high tech sectors, particularly the ICT, HVAC/R and lighting business lines in North America and
China. Our renewable energy business line also continued to grow strongly as consumer demand for these products increased. We increased our organic investment during 2011 to expand our service offering to clients, including new facilities for electric vehicle testing in Europe and Asia.
Proprietary certification marks owned by Intertek and issued by the Commercial & Electrical division enable manufacturers to show proof of compliance to safety and quality requirements, as well as a means of differentiating their products. Innovations in technology, particularly the growth in mobile applications and high speed networks are helping to drive testing and certification revenues, alongside greater legislation. We expect consumer demand for ‘green’ products to continue to grow and we are helping our customers improve the energy efficiency of their products. Our investment in testing facilities for electric vehicles and charging stations will also generate growth in revenue.
Financial Highlights
2011 £m
Changeat actual
rates
Change at constant
rates
Revenue 291.0 8% 9%Adjusted operating profit 44.1 15% 16%Adjusted operating margin 15.2% 90bps 100bps
20 | www.intertek.com
Operating Review

Intertek Annual Report 2011 | 21
Operating Review
Our safety, performance and quality testing ensures that clients get to market first – with innovation rather than imitation.
Adding value to manufacturers’ products and shortening time-to-market is at the core of our business. Our expertise accelerates product development and makes our clients more competitive in global markets.

Our innovative outsourcing business models enable our clients to benefit from a better standard of service and higher quality laboratory support at a lower cost.
1,3611,461
2010 2011
136.7143.9
2010 2011
Performance
Financial Highlights
2011 £m
Changeat actual
rates
Change atconstant
rates
Revenue 143.9 5% 6%Adjusted operating profit 12.8 8% 9%Adjusted operating margin 8.9% 30bps 30bps
Revenue – at actual rates (£m)
+5%
Employees
+7%
What we doThe Chemicals & Pharmaceuticals division helps global industries to sharpen their competitive edge with expert measurement and consulting services that support core business processes, ranging from new drug development through to the development of new materials, polymers composites and packaging. Our expertise helps clients in industries as diverse as aerospace, automotive and pharmaceuticals to accelerate and de-risk new product research, improve efficiency and safety in manufacturing and to ensure regulatory compliance with the appropriate authorities.
Our performance in 2011The division achieved good growth in a market that was challenging for parts of the business, with total revenue increasing 5% (6% at constant exchange rates) to £143.9m. Excluding acquisitions, organic revenue growth was 3% (4% at constant exchange rates). Total adjusted operating profit for the division was £12.8m, up 8% (9% at constant exchange rates). Excluding acquisitions, organic adjusted operating profit growth was 16% (17% at constant exchange rates).
The total adjusted operating margin was 8.9%, up 30 basis points and the organic operating margin at constant exchange rates was 10.7%, up 120 basis points. Growth in operating profit and the operating margin was reduced by high costs in a business acquired in 2010. The cost base of this business was restructured as planned at the end of 2011.
The chemicals and materials business drove organic growth in the year notably in the Netherlands and the USA. Whilst both the pharmaceutical and regulatory
services businesses faced challenging economic conditions, automotive, polymer testing and pilot plant services performed strongly.
outsourced the operations and assets of its
to Intertek. This is an expert analysis and consulting business enhancing Intertek’s capabilities in energy and transport.
The market for pharmaceutical services is expected to remain challenging, however, the chemicals and materials sector is expected to continue growing well, and the demand for health and environmental services should increase as the 2013 deadline for the EU REACH regulations begins to impact our customers. We will continue to support our customers through outsourcing opportunities.
Bringing quality to life
Chemicals & Pharmaceuticals
Operating Review
22 | www.intertek.com

Medical integrity Using our expert services, we help our clients to identify counterfeit medicines on sale to the public.
Specialist knowledge Our experts help clients reduce the time-to-market for products such as; new drugs, medical devices, cosmetics, biocides and agrochemicals, by helping clients navigate through complex regulatory requirements.
Clinical quality In pharmaceuticals and healthcare we adhere to the strictest codes of good clinical, good laboratory and good manufacturing practice
other fields we operate to the highest standards of laboratory quality.
Our product failure investigations can save clients time and money by determining the root cause of problems and validating quality control methods to meet the requirements of regulators.
Our expertise provides critical support at key stages of drug development, saving our clients substantial time and cost as well as helping to accelerate the introduction of new and safer medicines.
Operating Review
Intertek Annual Report 2011 | 23
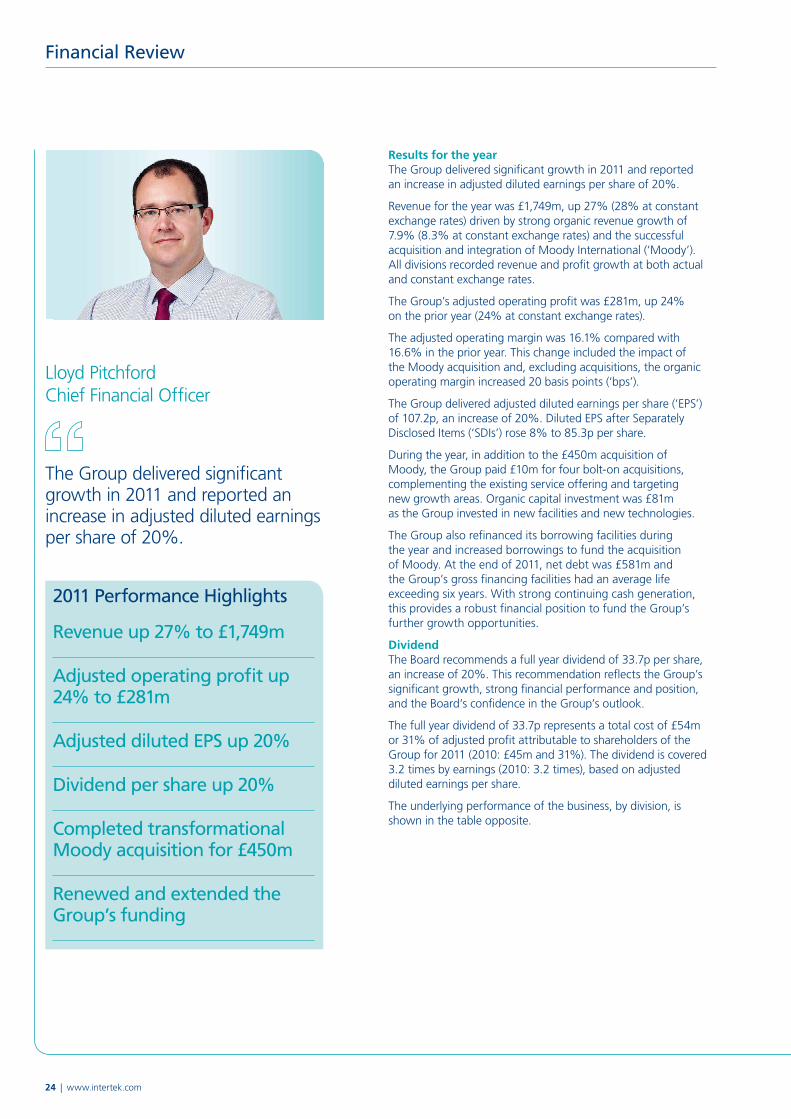
Results for the yearThe Group delivered significant growth in 2011 and reported an increase in adjusted diluted earnings per share of 20%.
Revenue for the year was £1,749m, up 27% (28% at constant exchange rates) driven by strong organic revenue growth of 7.9% (8.3% at constant exchange rates) and the successful acquisition and integration of Moody International (‘Moody’). All divisions recorded revenue and profit growth at both actual and constant exchange rates.
The Group’s adjusted operating profit was £281m, up 24% on the prior year (24% at constant exchange rates).
The adjusted operating margin was 16.1% compared with 16.6% in the prior year. This change included the impact of the Moody acquisition and, excluding acquisitions, the organic operating margin increased 20 basis points (‘bps’).
The Group delivered adjusted diluted earnings per share (‘EPS’) of 107.2p, an increase of 20%. Diluted EPS after Separately Disclosed Items (‘SDIs’) rose 8% to 85.3p per share.
During the year, in addition to the £450m acquisition of Moody, the Group paid £10m for four bolt-on acquisitions, complementing the existing service offering and targeting new growth areas. Organic capital investment was £81m as the Group invested in new facilities and new technologies.
The Group also refinanced its borrowing facilities during the year and increased borrowings to fund the acquisition of Moody. At the end of 2011, net debt was £581m and the Group’s gross financing facilities had an average life exceeding six years. With strong continuing cash generation, this provides a robust financial position to fund the Group’s further growth opportunities.
DividendThe Board recommends a full year dividend of 33.7p per share, an increase of 20%. This recommendation reflects the Group’s significant growth, strong financial performance and position, and the Board’s confidence in the Group’s outlook.
The full year dividend of 33.7p represents a total cost of £54m or 31% of adjusted profit attributable to shareholders of the Group for 2011 (2010: £45m and 31%). The dividend is covered 3.2 times by earnings (2010: 3.2 times), based on adjusted diluted earnings per share.
The underlying performance of the business, by division, is shown in the table opposite.
2011 Performance Highlights
Revenue up 27% to £1,749m
Adjusted operating profit up 24% to £281m
Adjusted diluted EPS up 20%
Dividend per share up 20%
Completed transformational Moody acquisition for £450m
Renewed and extended the Group’s funding
The Group delivered significant growth in 2011 and reported an increase in adjusted diluted earnings per share of 20%.
Chief Financial Officer
24 | www.intertek.com
Financial Review

2007
48.8
67.1
81.589.4
107.2
2008 2009 2010 2011
Adjusted diluted EPS (pence)1
107.2Five year compound growth of 22%
Adjusted operating profit1
+24%+24% at constant exchange rates+10% organic2 at constant exchange rates
227
281
2010 2011
Revenue
+27%+28% at constant exchange rates+8.3% organic2 at constant exchange rates
2007
18.020.8
25.528.1
33.7
2008 2009 2010 2011
Dividend per share (pence)
33.7Five year compound growth of 17%
1,374
1,749
2010 2011
Dividend per share (pence)
+20% 28.1
33.7
2010 2011
Adjusted diluted EPS1
+20% 89.4
107.2
2010 2011
Divisional and group financial results – adjusted Revenue Adjusted operating profit1
Notes2011
£mChange at
actual ratesChange at
constant rates2011
£mChange at
actual ratesChange at
constant rates
Commodities 2 530.2 12% 12% 67.0 23% 23%Industry & Assurance 2 468.6 145% 145% 50.9 207% 208%Consumer Goods 2 315.7 4% 5% 106.3 – 1%Commercial & Electrical 2 291.0 8% 9% 44.1 15% 16%Chemicals & Pharmaceuticals 2 143.9 5% 6% 12.8 8% 9%
1,749.4 27% 28% 281.1 24% 24%Net financing costs 14 (21.0) 35%Adjusted profit before income tax 260.1 23%Income tax expense 6 (73.3) 30%Adjusted profit for the year 186.8 20%Adjusted diluted EPS 7 107.2 20%
Current year performance
Five year performance
1. Presentation of results To provide readers with a clear and consistent presentation of the underlying operating performance of the Group’s business, the figures discussed in this review
are presented before Separately Disclosed Items (see note 3). A reconciliation between Adjusted operating profit and Profit for the year is set out in note 2 to the financial statements.
2. Organic growth excludes the results of acquisitions made in 2011 and 2010.
Intertek Annual Report 2011 | 25
Financial Review

Key financial performance indicators
Revenue
Up 27%Organic revenue at constant exchange rates
Up 8.3%Adjusted operating profit
Up 24%Organic adjusted operating profit at constant exchange rates
Up 10%Adjusted operating margin
16.1%Adjusted cash flow from operations
£315mAdjusted diluted earnings per share
Up 20%Dividend per share
Up 20%Return on invested capital
17%
to monitor the financial performance of the Group and operating divisions. These metrics are adjusted to exclude the SDIs (see page 29), to enable a better understanding of the underlying trading performance of the Group.
and are used to assess past performance and set targets for the future, including for management incentive schemes. Further information on management incentives is given in the Remuneration Report which starts on page 48.
A critical performance indicator for the Group is the continuing expansion of the revenue base. Revenue grew 27%, with strong organic growth of 8.3% at constant exchange rates. This organic growth was supplemented by acquisitions made in 2010 and 2011, of which Moody was the most significant.
This material increase in revenue drove a 24% increase in adjusted operating profit (24% at constant exchange rates) with organic growth of 9% (10% at constant exchange rates).
For 2011 the adjusted operating margin was 16.1% (2010: 16.6%) and reflects the impact of the Moody acquisition. The underlying operating margin (excluding the effects of acquisitions) was up 20 basis points over the prior year.
The Group has a strong record of converting profits into cash to fund future growth and returns to shareholders. In 2011 this trend continued, with £315m of adjusted cash flow from operations, an increase of 14%. This performance demonstrates the Group’s ability to generate strong cash flows across the economic cycle.
Adjusted diluted earnings per share is a key measure of value creation used by the Board and is a component of the incentive targets for management. It is calculated as Adjusted operating profit divided by the weighted average number of ordinary shares, including potentially dilutive share awards, in issue during the year. Adjusted diluted EPS increased 20% over the prior year, to 107.2p, reflecting the strong return delivered for our shareholders.
The rate of return on invested capital (‘ROIC’) measures the efficiency of Group investments. This is a key measure to assess the efficiency of investment decisions and is also an important criteria in the decision making process when projects are competing for limited funds. ROIC in 2011 was 17%, (2010: 25%) with the year-on-year change primarily due to the goodwill and intangibles recognised on the acquisition of Moody.
26 | www.intertek.com
Financial Review

Acquisitions and investmentThe Group’s strategy is to invest both organically and by acquiring complementary businesses; enabling it to continually offer the latest technologies and services in the locations demanded by clients. In 2011 the Group made a significant investment in the acquisition of Moody, providing a platform for future growth, whilst also targeting organic investment in growth sectors. The chart below shows the extent of the Group’s investment in 2011:
2007
44
68
53
66
81
2008 2009 2010 2011
Organic capital investment(£m)
81
2007
86 85
34 51
464
2008 2009 2010 2011
Cash spent on acquisitions(£m)
464
Acquisitions The Group made five acquisitions in the year:
Moody International, on 27 April 2011 for £450m on a cash and debt free basis. This strategic acquisition strengthened the Group’s global client offering in the Industry & Assurance division (see details below);
Recherche, Developpement & Consulting – Bruxelles SA,
impact consulting in the Consumer Goods division;
adding to the Group’s food testing service line in the Industry & Assurance division;
on 1 August 2011 which enhanced the Group’s capabilities in the energy and transport sector in the Chemicals & Pharmaceuticals division; and
a microbiological and environmental services business based in Chile, which broadens the geographic footprint of the Commodities and Industry & Assurance divisions.
These acquisitions provide valuable additional service lines and new geographic locations for the Group, and will help drive profitable revenue growth.
Moody InternationalThe acquisition of Moody was a significant strategic step for the Group, being the largest acquisition in the Group’s history. Moody is a leading provider of technical services to the global energy industry and a provider of systems certification services.
people in over 80 offices and 60 countries and the operations and employees have been integrated into the Industry & Assurance division. The acquisition of Moody extends the depth of the Group’s portfolio of services for energy assets, processes and products, creating a new leading technical services platform for the global energy market and bringing global scale to the Group’s systems certification business.
Including the pre-acquisition results of Moody for 2011, revenue for the combined Group would have been £1,854m and adjusted operating profit would have been £292m.
Organic investment The Group also invested £81m (2010: £66m) organically on the latest technology in new laboratories, capital equipment and other facilities. This investment represented 4.6% of revenue (2010: 4.8%) which was down slightly on the prior year due to the less capital intensive nature of the Moody business.
Intertek as One Finance and IT restructuringThe Group continues to focus on delivery of overall margin improvement under its Intertek as One programme. Margin improvement is targeted through a combination of economies of scale, high value service growth, revenue synergies and streamlining and improving the efficiency of operations and back-office support functions through organic investment.
In 2010 the Group implemented its first integrated shared service centre across North America. In 2011 the Group started the next step in transforming its business services support which is to implement a phased outsourcing of global IT applications and accounting back-office support. Working with Accenture, the programme will create a global shared services centre in Delhi, India for countries where English is the predominant business language, currently over 40% of revenue. The programme will be implemented in phases over the next two years.
This move will provide a more scalable and efficient platform to support the Group’s strong growth at a lower cost and allow more efficient integration of acquisitions. The phased programme is expected to generate annual cost savings rising to approximately £10m per annum from 2014. As the change programme will involve significant staff and organisational changes, the Group has reported restructuring charges of £8m as a separately disclosed item in 2011 and will incur a further charge of approximately £3m in 2012.
Intertek Annual Report 2011 | 27
Financial Review
28 | www.intertek.com
Financial Review
Cash flow and net debtThe Group relies on a combination of debt and internal cash resources to fund its investment plans. One of the key metrics for measuring the ability of the business to generate cash is cash flow from operations. Due to the cash payments associated with the SDIs, and to provide a complete picture of the underlying performance of the Group, Adjusted cash flow from operations is shown below to measure the cash generated by the Group:
Cash conversion2011
£m2010
£m Change
Cash flow from operations 289 271 7%Add back: cash flow relating to SDIs 26 5Adjusted cash flow from operations 315 276 14%
Net debtNet debt has increased from £170m at 31 December 2010, to £581m at 31 December 2011, principally as a result of the acquisition of Moody. The acquisition was partly funded through the Group’s US$600m multicurrency revolving credit facility, and a new US$300m bridge facility signed in March 2011.
adjusted for the Group’s ratio of net debt:EBITDA.
In October 2011 the Group secured additional funding of US$265m by way of a senior note issue, which was drawn
with US$20m repayable in 2019, US$140m repayable in 2022 and US$105m repayable in 2024. These funds were used to repay the US$300m bridge facility, which was cancelled in February 2012.
Under existing facilities the Group has available debt headroom of £149m at 31 December 2011.
The components of net debt at 31 December 2011 are outlined below:
1 January 2011£m
Cash flow£m
Exchangeadjustments
£m
31 December2011
£m
Cash 217 (36) 1 182Borrowings (387) (357) (19) (763)Total net debt (170) (393) (18) (581)
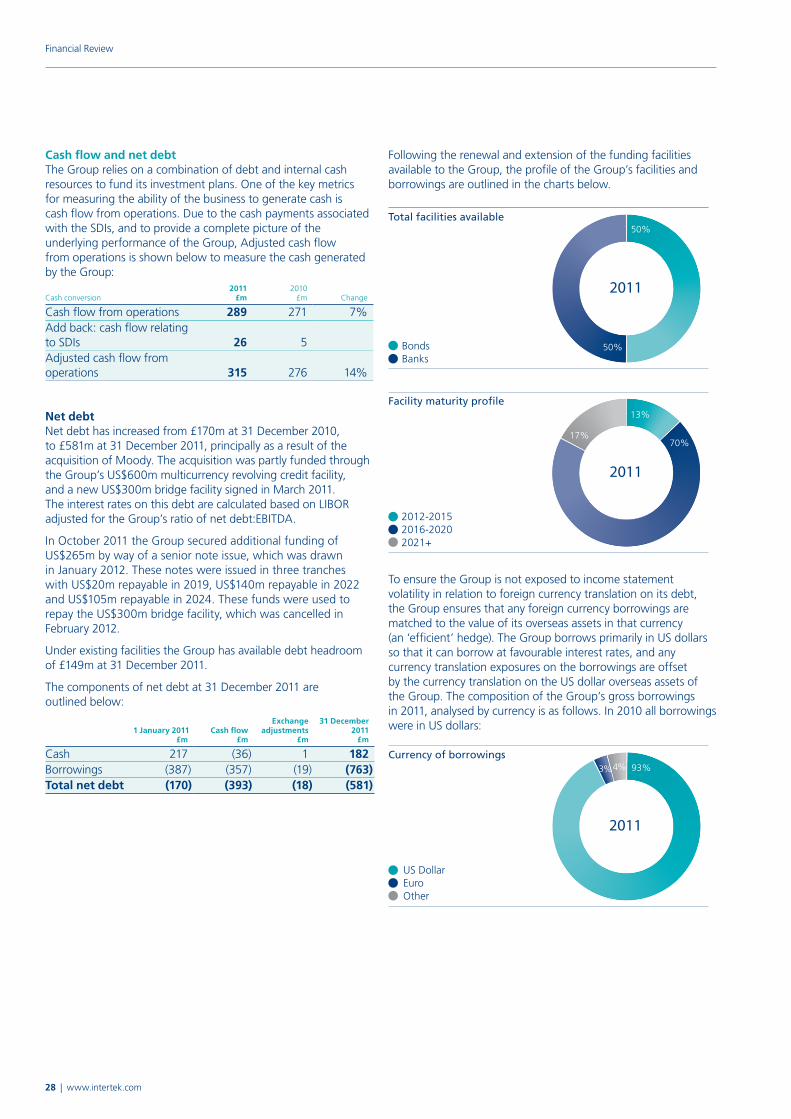
Following the renewal and extension of the funding facilities available to the Group, the profile of the Group’s facilities and borrowings are outlined in the charts below.
2011
50%
50%Bonds Banks
Total facilities available
2011
13%
70%17%
2012-2015 2016-20202021+
Facility maturity profile
To ensure the Group is not exposed to income statement volatility in relation to foreign currency translation on its debt, the Group ensures that any foreign currency borrowings are matched to the value of its overseas assets in that currency (an ‘efficient’ hedge). The Group borrows primarily in US dollars so that it can borrow at favourable interest rates, and any currency translation exposures on the borrowings are offset by the currency translation on the US dollar overseas assets of the Group. The composition of the Group’s gross borrowings in 2011, analysed by currency is as follows. In 2010 all borrowings were in US dollars:
2011
93%3%4%
US Dollar EuroOther
Currency of borrowings

Intertek Annual Report 2011 | 29
Financial Review
Net interest chargeThe Group had a net interest charge of £21m (2010: £16m) in the year. This comprised £8m (2010: £7m) of finance income, primarily pension asset returns and interest income on bank accounts, and £29m (2010: £23m) of finance expense, including £22m (2010: £15m) of interest on the Group’s debt facilities, £5m (2010: £5m) of pension liability interest expense and £1m (2010: £2m) due to foreign exchange differences. The net interest charge for 2012 will increase due to the higher average level of borrowings in place following the Moody acquisition and higher rates following the extension of the debt maturities.
TaxThe global nature of the Group means that the Group’s exposure to income tax needs to be managed across a large number of fiscal regimes. The Group’s goal is to efficiently manage its tax affairs whilst fulfilling its responsibilities to the countries in which it operates. During 2011 the effective tax rate on adjusted operating profit was 28.2% (2010: 26.7%), resulting in an adjusted tax charge of £73m (2010: £57m), and a statutory tax charge, including the impact of SDIs, of £62m (2010: £51m).
Separately disclosed items (‘SDIs’)A number of items are separately disclosed in the financial statements as exclusion of these items provides readers with a clear and consistent presentation of the underlying operating performance of the Group’s business.
When applicable, these separately disclosed items include amortisation of acquisition intangibles, impairment of goodwill and other assets, the profit or loss on disposals of businesses or other significant fixed assets, costs of acquiring and integrating acquisitions, the cost of any fundamental restructuring of a business, material claims and settlements, significant recycling of amounts from equity to the income statement and unrealised market gains/losses on financial assets/liabilities.
In 2011 there were significant intangible assets recognised on the acquisition of Moody, which increased amortisation to £25m (2010: £13m). The cost associated with the acquisition and integration of Moody totalled £13m (2010: £nil). There were also costs relating to other acquisitions of £1m (2010: £5m). The ongoing initiative to restructure and outsource the Group’s back-office support functions cost £8m (2010: £nil). In the prior year there was also a £3m charge in relation to claims.
Currency movementsThe Group transacts in over 80 currencies, and revenue and profit are impacted by currency fluctuations, which have been significant during the year. However, the diversification of the Group’s revenue base mitigates this exposure.
At constant exchange rates, revenue grew 28% (actual exchange rates 27%) and adjusted operating profit grew 24% (actual exchange rates 24%).
The cumulative average exchange rates used to translate the income statement into sterling for the four most material currencies are shown below:
Value of £12011
£m2010
£m
US dollar 1.60 1.55Euro 1.15 1.17Chinese renminbi 10.35 10.47
12.47 12.00
Significant accounting policies The consolidated financial statements are prepared in accordance with IFRS as adopted by the EU. Details of the Group’s significant accounting policies are shown in note 1 to the financial statements.
Introduction from the Chief Executive OfficerBy focusing on quality in everything we do, we help our clients to meet end users’ expectations across increasingly diverse quality, health, environmental, safety and social accountability aspects in virtually any market around the world. In fact the work that we do for our clients has a major positive impact on the planet, people and business that far outweighs our own use of resources.
As a world leader in sustainability services, Intertek is committed to operating in a socially responsible manner and believes it is essential that our own standards are as high as those we provide to our customers. During 2011 we reviewed our approach to sustainability and corporate social responsibility to ensure that we focus on the environmental and social challenges which matter most to our key stakeholders. We implemented a common framework which enables us to record and monitor our performance in areas such as health and safety, energy consumption and emissions more effectively and consistently throughout the Intertek Group.
This report describes some of the work we are doing for our clients and the performance of our own operations in these areas during the year.
Through the integrity and dedicated work of our 30,000 people around the world, Intertek ensures the quality and safety of the goods and services we all use – providing us with a better quality of life today and a more socially responsible and environmentally friendly world tomorrow.
Wolfhart Hauser Chief Executive Officer
Contents 30 Introduction from the Chief Executive Officer
31 Our business
32 Intertek people
34 Our environment
35 Our communities
…providing a better quality of life today and a more socially responsible and environmentally friendly world tomorrow.
30 | www.intertek.com
Sustainability and CSR Report

Our businessIn a world that is becoming increasingly complex, Intertek is well placed to help our clients adapt to the changes in global trade patterns. Our customers are constantly innovating in their industries, from creating safer and more environmentally friendly products, to groundbreaking technological advancements. As the environment in which they operate evolves, we help our clients to adapt their strategies, business models and supply chains to meet the challenges of increased diversity of consumer expectations and products. Intertek is changing with them, as we continue to execute our customer-focused Intertek as One strategy.
Consumers, governments and communities alike are rightly concerned with how services and the manufacturing, use and disposal of products impact the lives of workers, their communities and the environment. They expect goods to not only meet quality and safety requirements, but to be sourced and manufactured using sustainable practices. As a result, non-compliance within supply chains represents a huge reputational risk and concern for brand integrity. As retailers and brands work to demonstrate good corporate governance across their supply chains, their suppliers are concurrently being asked to continuously showcase their capabilities, capacity and performance in these areas.
Intertek’s Industry Community Programmes offer a full range of services for companies and facilities seeking to improve compliance in accordance with widely accepted industry standards and best practices. These standards have been extensively researched and developed in collaboration with the world’s largest consumer brands and retailers. Our services include Supplier Identity & Profile (‘iSupplier Intelligence’), Social Compliance (‘Workplace Conditions Assessment’), Environmental Sustainability (‘Think Green Initiative’), Quality Assurance (‘Supplier Qualification Program’), Security Compliance (‘Global Security Verification’), Fabric Quality (‘Mill Qualification Program’) and a range of other environmental impact assessment solutions covering products, packaging and supply chains. For example, we undertook a ‘life cycle analysis’ of carrier bags for one of the world’s largest retailers, resulting in a shift in policy to offering bags with a higher recyclable content.
In 2011, Intertek hosted the 10th annual Ethical Sourcing Forum in North America. The forum brings together manufacturers and retailers to explore how they can work together to achieve measurable ethical sourcing and sustainable business practices that are currently transforming global supply chains. We are also establishing fair trade relations in Brazilian cotton exporters’ supply chains through providing guidance on compliance to local labour legislation.
In 2011, Intertek acquired Recherche, Developpement & Consulting – Bruxelles SA (‘RDC’). Based in Belgium and France, RDC helps companies to improve their product packaging, organisation and the overall environmental impact of their supply chain. Services include lifecycle analysis, carbon foot printing, eco-labelling, greenhouse gas analysis and energy auditing, as well as a unique software tool to enable clients to calculate product environmental impacts instantly.
Intertek has introduced many training programmes to elevate and reinforce product safety in the consumer goods industry. In 2011, Intertek Consumer Goods was certified as the first training provider for international personnel and training certification body RABQSA Inc’s new Safe Design Professional (‘Saf-D-Pro’) Certification Scheme. Saf-D-Pro certifies qualified individuals in the discipline of design appraisal of consumer products based upon state-of-the-art design hazard analysis and risk assessment techniques and practices.
Through our network of global safety experts, Intertek also conducts safety awareness seminars for those working in the chemical manufacturing industry, such as pharmaceutical, specialty chemicals, and agrochemicals. Our experts analyse a wide range of chemical processes and have recognised expertise in characterising fire and explosion properties of powders and dusts.
We are supporting the move to hybrid domestic and commercial transportation through the testing of batteries and charging systems for electric vehicles. Furthermore, in 2011 we contributed to the first ever commercial flight using sustainable jet bio fuel. As well as testing and certifying the fuel, Intertek provided consultancy services on the testing and certification process to customers in the aviation industry.
In the Food and Agri sector, Intertek is an internationally recognised certification body for food safety programmes, including Global Food Safety Initiative (‘GFSI’) endorsed schemes, such as the Food Safety System Certification (‘FS22000’), British Retail Consortium Food Standard (‘BRC’), International Food Standard (‘IFS’), and Safe Quality Food (‘SQF’).
With the global population estimated to reach nine billion by 2050, the world will need to produce more safe, nutritious and affordable food which can be supplied and distributed to meet the needs of consumers in different economic, social and cultural contexts, while maintaining the ecosystem on which food production depends. Our comprehensive evaluations of food production, quality management systems, testing programs, factory environment, product and process controls, positions us to certify the entire supply chain.
In 2011 we extended our Food and Agri testing capabilities by
Testing S.A. based in Santiago, Chile, which provides a wide range of chemical and microbiology services for the fishing industry and the large supermarket chains. We also opened our second food testing lab in Turkey which has been authorised by the Turkish Ministry of Food, Agriculture and Breeding to operate as an official control laboratory and as a private laboratory for imported/exported food and feed control services in Turkey.
Intertek is playing a key role in helping the Global Alliance for Improved Nutrition (‘GAIN’) with their Premix Facility programme. As GAIN’s primary certification agent, Intertek tests and certifies the premix, which is a commercially prepared blend of essential micronutrients used in food fortification. More than 100 million people in developing countries are benefiting from improved nutrition as a result.
Intertek Annual Report 2011 | 31
Sustainability and CSR Report

Stewardship and GovernanceIntertek’s strategic direction and performance is overseen by the Board (see pages 36 and 37). With a mix of Executive and Non-Executive directors on the Board, Intertek has a wide range of experience and skills, bringing independent judgement to bear on issues of strategy, performance, resources and standards of conduct. The Board has overall responsibility for the establishment and oversight of Intertek’s risk management framework, details of which can be found on pages 43 to 44.
Intertek’s global operations are managed by the Group’s executive management team – the Intertek Operations Committee, as shown on pages 12 and 13, which includes the Divisional Executive Vice Presidents (‘EVPs’).
Part of Intertek’s global strategy is to align our organisation with the many industries in which our customers trade, so that we can provide them with the support and expertise specific to their needs. We do this from five global divisions operating across more than 100 countries: Commodities, Industry & Assurance, Consumer Goods, Commercial & Electrical and Chemicals & Pharmaceuticals. Intertek’s EVPs also have formal responsibility for regional business development.
Each of our major operating countries has a Country Manager, who is responsible for the cross-divisional development of Intertek’s overall operations and business in that country, including local sustainability actions.
Intertek Operations
Committee: 9
Senior Leadership Group: 300
Intertek: 30,000 people
Intertek Group plc Board
Governance structure
compared with 83% and 17% respectively in 2010.
Intertek peopleIntertek is a diverse company of more than 30,000 employees, operating in over 100 countries. It is this diversity in all we do and embrace as a company – our industries, services, geographies, people and cultures – that ensures our status as an economically sustainable business.
The Group is supportive of all the communities in which we are active and is committed to giving local, talented people the opportunity of employment and further development. It is Intertek’s policy that everyone should have an equal opportunity for employment, fair pay and career advancement on the basis of ability, necessary qualifications and attitude to work.
Intertek has framework policies in place which cover all issues of fair recruitment, performance management, remuneration and training and development. These policies enable respect and fair treatment of employees across the Group, while still giving local managers the authority and flexibility to adopt what is right for their local area.
We provide continuous learning opportunities and training for personal growth so that we remain up to date and highly expert in the services we deliver for our customers. Our management development initiatives focus on leadership workshops to develop our existing teams as well as identify and grow talent for the future.
The American Society for Quality (‘ASQ’) created its first
Responsibility Medal, in honour of Intertek’s former Senior Vice President for Risk Assessment and Management. In receiving the Award, Spencer Hutchens said: “I am proud and humbled to have this medal named in my honour. My hopes are that the development of this medal will provide continued inspiration for individuals and organisations to build their work on values of social responsibility – principles I’ve supported throughout my life and career at Intertek.” Sadly, ten months later, Spencer Hutchens passed away, but his legacy continues.
In December 2011, Intertek Consumer Goods North America President, Gene Rider was awarded the prestigious Chairman’s Commendation Circle Award by the U.S. Consumer Product Safety Commission. The Award recognises people and groups who have contributed in an important way to the benefit of consumers by directly and significantly reducing deaths, preventing injuries, and improving consumer product safety.
32 | www.intertek.com
Sustainability and CSR Report

Professional conductOur integrity is at the heart of our business. One of Intertek’s primary business objectives is to ensure compliance with local, national and international laws and the accuracy and validity of reports and certificates that it provides to customers. All Intertek employees receive training on the Intertek Compliance Code as part of their induction. Compliance training is available on our Group intranet in multiple languages. The objective of this code is to demonstrate how we approach compliance within our organisation to assure ethical behaviour and the integrity of our services. We also have a summary Code of Ethics, which employees are asked to sign as part of their terms of employment with the Company, confirming acceptance of the high standards expected of them in all business dealings.
The Code of Ethics is supported by regular in-service training, advice on ethical issues and an internally publicised telephone hotline, allowing protected reporting of concerns regarding non-compliance. Intertek has a strict policy of Zero Tolerance regarding breaches of compliance policy.
During 2011 we received 24 reports of non-compliance which proved to be substantiated claims requiring remedial action. We continue to monitor these figures each year. Our Audit and Risk Committee regularly reviews the outcomes from hotlines and compliance reports on behalf of the Board.
Compliance hotline incidents 2011Number of incidents reported
Number of incidents further investigated
Number of substantiated incidents
118 118 24
Health & SafetyIntertek considers the health, safety and welfare of its employees, clients and third parties connected with its business to be of paramount importance. We aim to provide a safe working environment and ensure that our employees have the information and resources to perform their duties safely. We are committed to maintaining high standards and complying with relevant local legislation and guidelines in any area in which we operate. We continually seek to minimise risk to our employees, clients and others who may be affected by our operations and our procedures are regularly monitored by our compliance team to ensure that they are being properly applied in practice.
We are very saddened to report however that during 2011 three employee fatalities occurred; two whilst travelling to work and one during business travel. While these incidents were not directly attributable to our operations we are taking steps to increase our safety awareness programmes for employees when travelling to their workplace.
accidents requiring medical treatment and injuries resulting in lost working time.
Although we operate across many different industries, one of our key values is to act as one united company through promoting a co-operative working culture under our Intertek as One programme. By working together and integrating our knowledge and resources across our business lines, we are able to provide a complete package of services seamlessly to our customers under a single brand ethos of ‘Valued Quality. Delivered.’
At 31 December 2011 we employed 31,712 people, an increase of 17% over the prior year. The largest contributor to this growth in headcount over the past 12 months was our acquisition of Moody International, which increased our headcount by approximately 2,500.
Intertek’s gender diversity is reflective of the general industries and qualification profiles of employment in our operating countries and business lines.
The increase in total number of Intertek employees over the last five years.
EMEA
FemaleMale Americas Asia
Male : FemaleRatio by regions
18,000
16,000
14,000
12,000
10,000
8,000
6,000
4,000
2,000
0
Female Male
Total workforce36%
64%
0.0
222.22
444.44
666.66
888.88
1111.1
1333.3
1555.5
1777.777778
2000.0
2007 2008 2009 2010 20110
5,000
10,000
15,000
20,000
25,000
30,000
35,000 2,000
1,800
1,600
1,400
1,200
1,000
800
600
400
200
0
HeadcountRevenue (£m)
Revenue andheadcount
Headcount Revenue
Intertek Annual Report 2011 | 33
Sustainability and CSR Report
Using 2011 as our base year, we will continue to monitor and record our emissions and energy consumption levels in our subsequent external reporting.
In order to reduce our travel emissions, we have continued where possible, to minimise business mileage by increasing the use of video and web technology for meetings.
In our Automotive Research business, we use regenerative engine dynamometers when testing our client’s engines. Through these test programmes we offset our consumption by producing enough electricity to power 750 homes. Moreover, the emissions work we perform for major engine manufacturers means that the next generation truck engines will produce 90% less particulate emissions than engines currently in use on public highways.
Environmental initiatives continue throughout Intertek offices to reduce energy consumption, which include minimising electricity usage by switching off lights and other electrical appliances when not in use. Our businesses continue with their efforts to reduce paper usage and recycle all waste materials where possible.
In 2011 Intertek’s Exploration & Production Services businesses relocated to a new state-of-the-art ‘green’ building in the Aberdeen Innovation Park in Bridge of Don, Scotland, where heating and hot water is provided from a biomass boiler and wind turbine. Intertek’s Centre of Excellence will support the energy sector, including renewable energy initiatives and will provide local employment to engineers, chemists and technical experts.
All Intertek employees are made aware of our environmental ‘green’ initiatives and guidelines, as well as their responsibilities towards the environment as an employee for Intertek. Environment related activities are continuously increasing, with our employees actively participating, alongside their communities, in causes to help the environment. For example, in Mumbai, India, a team of Intertek volunteers spent their leisure time planting tree saplings in their local community to counter deforestation from building development. On China’s Arbor Day in March, Intertek adopted 25 trees for a tree planting event at Baiyun Shan Park in Ghangzhou, which saw the participation of over 70 employees, and in October more than 60 Intertek employees took part in an organised clean up of Rose Coast Beach in Shenzhen.
The health and safety of our people and activities is the responsibility of line management and employees themselves. All incidents are recorded and reported to the designated Country Health and Safety Representative who in turn reports
Intertek Group.
We are committed to the continuous review and improvement of our health and safety performance and our aim is to achieve zero lost time accidents.
Our environmentWe believe that, through the services we provide for our clients, the positive influences that we have on the world are far greater than any negative effect from our operations. However, we continually work to reduce energy consumption and other effects that our operations may have on the environment. For example, we have introduced electronic payslips for employees and e-certificates for many of our customers, both to improve operations and reduce our consumption of resources.
Our corporate Environmental Policy is implemented at a national level by Country Managers in compliance with local regulations and guidelines. The policy serves to ensure that employees at all levels in the organisation are aware of the environmental impact of their activities. It also outlines our objectives as a company to minimise any adverse environmental influences.
For 2011 we have calculated our carbon emissions and energy consumption levels for the 20 largest Intertek countries by headcount, which together represent approximately 80% of Intertek’s total population.
Electricity and gas consumption levels throughout the year were measured in order to monitor our energy consumption. Electricity consumption was reported to be 174,200 MWh (6.85 MWh per employee) and gas consumption was reported to be 47,051 MWh (1.85 MWh per employee).
The levels of greenhouse gas emissions were calculated using the guidelines of the GHG protocol. The calculated emissions include:
Scope 1 emissions – Direct emissions which are a result of our testing and inspection services for clients as well as our business operations that occur at sources owned or controlled by Intertek;
Scope 2 emissions – Indirect emissions which are a result of our testing and inspection services for clients as well as our business operations that occur at sources not owned or controlled by Intertek.
CO2 emissions for top 20 Intertek countries by headcount Emission (tonnes CO2e ) 2011
Scope 1 9,399Scope 2 108,169Total 117,568Per employee 4.62(CO2e – Carbon Dioxide Equivalent)
34 | www.intertek.com
Sustainability and CSR Report

Our communitiesWhile the very nature of the work that Intertek people do every day helps to minimise the health, social and environmental impact of thousands of products and processes around the world, many also give their personal time and energy to voluntary programmes in their local communities.
Our employees’ cultural values and relationships within the communities in which they live and work is important to them, as well as to our business and our clients. At Intertek we encourage our employees’ involvement in charitable and community activities. Volunteering not only helps them develop new skills and experiences but strengthens their relationships with colleagues through the teamwork involved.
These are just some of the good causes our people took part in during 2011:
projects for Habitat for Humanity, a charity which strives to energise neighbourhoods and communities by repairing and building environmentally ‘green’ homes for those in need.
for WaterAid, an international non-governmental organisation that aims to transform lives by improving access to safe water, hygiene and sanitation in the world’s poorest communities.
In celebration of Singapore’s 46th year of independence, Intertek employees paid tribute to the elderly who have contributed selflessly to the early years of building their nation. Four care homes for the elderly were asked for a ‘wish list’ of items needed by their residents. In just 10 days, over 900 different items of daily necessities were collected from 500 Intertek employees.
In India, Intertek employees celebrated Diwali (‘Festival of
giving sweets to the children and providing 200 blankets and sheets for the Institution.
As an organisation, Intertek also helps the communities in which we operate.
Following the devastating earthquake in Eastern Turkey in October 2011, Intertek in Istanbul sent much needed clothing to people in the affected areas and Intertek employees also contributed by personally donating articles of clothing and blankets.
In China, Intertek donated over 1,000 dictionaries and stationery to children in Guangdong. Our employees travelled
In Thailand, with the agreement of our customers, we organise the charitable distribution of rice samples that are no longer required following quality testing, so nothing goes to waste.
In 2011, Intertek in Australia, supported ‘Bicycles for Humanity’, to help establish a Bicycle Empowerment Centre in a village near Walvis Bay, Namibia.
scheme to help local graduates understand the role of an approvals engineer, not just in Intertek but also in the global marketplace. The programme covers all areas within the Commercial & Electrical industry, including hazardous locations testing, life safety, fire and security systems and medical equipment. Graduates are continually assessed and provided with professional support throughout the programme.
Intertek’s Sustainability and CSR report was developed according to the Global Reporting Initiative (GRI) G3.1 guidelines, which provide a recommended framework and indicators for reporting. A table outlining the GRI standard disclosures is provided at the end of this document. All data used for performance indicators is representative of the Group, unless stated otherwise.
Intertek Annual Report 2011 | 35
Sustainability and CSR Report
01
04
07
05 06
0302
36 | www.intertek.com
Board of Directors

01 Sir David Reid (65) ChairmanAppointed to the Board in December 2011
Sir David Reid retired as Non-Executive
after serving in that role since April 2004. Prior to that he was Deputy Chairman of
Board since 1985. David is the Senior Independent Director of Reed Elsevier Group
Greenalls Group plc (now De Vere Group),
plc. In November 2010 David was appointed one of Prime Minister David Cameron’s Business Ambassadors.
02 Wolfhart Hauser (62)Chief Executive Officer Appointed to the Board as Chief Executive Officer in March 2005 after serving as a Non-Executive Director since November 2002. Wolfhart Hauser was previously Chief Executive Officer and President of TÜV Süddeutschland AG for four years and Chief Executive Officer of TÜV Product Services for 10 years. Starting his career with various research activities he went on to establish and lead a broad range of successful international service industry businesses. He has held several non-executive board director and chairman roles in a variety of technology companies. He is currently
03 Lloyd Pitchford (40)Chief Financial Officer Appointed to the Board as Chief Financial
previously spent 10 years with BG Group plc in various operational and corporate
including five years as Group Financial Controller. He previously worked for Mobil Oil Corporation in various financial, commercial and management roles.
of Management Accountants and holds an MBA from Heriot-Watt University.
04 Christopher Knight (65)Non-Executive DirectorAppointed to the Board as a Non-Executive Director in March 2006. He was an investment banker for nearly 30 years, for much of that time with Morgan Grenfell and Deutsche Bank, of which he was a managing director until 2001. He is a Chartered Accountant and has extensive corporate finance experience gained during his banking career in
He is Chairman of Brooks Macdonald Group plc.
05 Edward Astle (58)Non-Executive DirectorAppointed to the Board as a Non-Executive Director in September 2009. He is currently Pro Rector Enterprise
oversees the university’s relationships with industry, and leads business
and internationally. Edward was Executive Director of National Grid plc from 2001 to 2008, a Managing Director at the BICC Group from 1997 to 1999 and an Executive and Regional Director at Cable & Wireless plc from 1989 to 1997. Previously he held senior business strategy
06 Alan Brown (55)Non-Executive DirectorAppointed to the Board as a Non-Executive Director in April 2011. He is currently Chief Executive Officer of Rentokil Initial plc, a position he has held since April 2008. Alan spent 25 years at
Europe and then general management in Taiwan and China. His last four years were as Executive Chairman of Unilever China. Following this, Alan returned to the
role in the divestment of the company.
07 Michael Wareing (58)Senior Independent Non-Executive DirectorAppointed to the Board as a Non-Executive Director in April 2011. He has major international and board level knowledge gained during an extensive global career up to senior partner level
as International Chief Executive Officer, a position he occupied for four years. He is currently a Non-Executive Director and Audit Committee Chairman at Wolseley plc and at Cobham plc and is Chairman of the Iraq Advisory Board for G4S plc. He was appointed as the Economic Development Adviser to the Government of Afghanistan in August 2011.
Intertek Annual Report 2011 | 37
Board of Directors

Chairman’s forewordHaving been Chairman only since the beginning of 2012, I have to thank Vanni Treves, the former Chairman, for his stewardship of Intertek’s corporate governance. I have conducted a review of our governance structures and am pleased to say that the Board of Intertek Group plc recognises and is committed to the highest standards of corporate governance. The Board believes that good governance is key to the long-term success of the Group and we shall continue to pursue the ‘comply or explain’ approach. This report gives more information on how we comply with the UK Corporate Governance Code (the ‘Code’) and explains where we do not.
Last year this report explained how the Board had reviewed the impending changes to the Code, now fully effective, and considered the application of the Code to Intertek. At the Annual General Meeting in 2011 all continuing directors stood for re-election and were re-elected with healthy majorities.
Since last year the diversity of the membership of boards has become an important issue which is on its way to inclusion in the Code. In making any Board appointments, in addition to reviewing factors such as skill sets, breadth of experience and personality fit, the Nominations Committee is careful to ensure that it is presented with, and considers, a broad range of candidates. Steps are currently being taken to recruit an additional Non-Executive Director following the departure of Debra Rade from the Board. The nature of our business and the geographical spread of our operations mean that we employ a culturally and otherwise diverse group of people. More information on diversity, including the gender of employees within Intertek is provided on pages 32 to 33 of the Sustainability and CSR Report.
I am greatly looking forward to my service with the Board and am committed to ensuring the continuance of the high standards already set.
Sir David ReidChairman
Contents38 Chairman’s foreword
39 Governance framework
39 Board attendance
39 Role of the Chairman, Chief Executive Officer and Senior Independent Director
40 Board balance and independence
40 Professional development
40 Performance evaluation
41 Procedures to deal with Directors’ conflicts of interests
41 Consideration of the diversity of the Board
41 The Board and its Committees
41 The Remuneration Committee
42 The Nominations Committee
42 The Audit and Risk Committee
43 Internal control
44 Shareholders
44 Going concern
38 | www.intertek.com
Corporate Governance Report

Governance frameworkThis report describes our compliance with the provisions of the Code. The Code is available at www.frc.org.uk. Throughout 2011 the Group complied with all provisions of the Code, save that from May 2011 the Remuneration Committee comprised two rather than three independent Directors in addition to the Chairman.
The Board is responsible and accountable to shareholders for ensuring that the Company is appropriately managed and that it achieves its objectives. The Board’s main role is to understand and meet its obligations to the Company’s shareholders and others; to lead the Group within a framework of prudent and effective controls which enable risk to be assessed and managed; to approve the Group’s strategic objectives; and to ensure that sufficient resources are available to enable it to meet those objectives. The Board also ensures that plans are in place for orderly succession for appointments to the Board and to senior management.
Alan Brown and Michael Wareing joined the Board in April 2011 and Sir David Reid was appointed in December 2011. Gavin Darby resigned in May 2011 and David Allvey, Debra Rade and Vanni Treves retired at the end of December 2011. Currently the Board consists of a Non-Executive Chairman, two Executive Directors and four independent Non-Executive Directors. On 1 January 2012 Sir David Reid took over the Chairmanship from Vanni Treves. All Directors who served during 2011 had a wide range of experience and skills, bringing independent judgement to bear on a wide range of issues including strategy, performance, resources and standards of conduct. The current Directors’ biographies appear on page 37.
During the year, the Board formally met eight times, but there was also frequent ad hoc contact between Directors to discuss the Group’s affairs and development of its business. Directors’ attendance at Board meetings is shown in the table on the right. On several occasions during 2011 the Chairman met with the Non-Executive Directors without the Executive Directors being present. The Non-Executive Directors have also had discussions without the Chairman being present.
If a Director has any concerns about the Group or a proposed action, then such concerns are recorded in the Board minutes as a matter of course. To enable the Board to discharge its duties, all Directors have full and timely access to all relevant information. Papers are circulated well before the Board and Committee meetings to ensure that Directors have the necessary time to read and review them. The Non-Executive Directors receive monthly Business Performance Reports and information which enables them to scrutinise the performance of the Group and management against agreed strategy and objectives and prior performance.
Board attendance during 2011
Name/Position Attendance*
Vanni Treves Chairman
8 (8)
Wolfhart Hauser Chief Executive Officer
8 (8)
Lloyd Pitchford Chief Financial Officer
8 (8)
David Allvey Senior Independent Non-Executive Director
8 (8)
Edward Astle Independent Non-Executive Director
8 (8)
Alan Brown (appointed 15 April 2011) Independent Non-Executive Director
4 (5)
Gavin Darby (resigned 20 May 2011) 4 (4)Independent Non-Executive DirectorChristopher Knight Independent Non-Executive Director
8 (8)
Debra Rade Independent Non-Executive Director
8 (8)
Sir David Reid (appointed 1 December 2011) Independent Non-Executive Director
1 (1)
Michael Wareing (appointed 15 April 2011) Independent Non-Executive Director
5 (5)
* Actual attendance (maximum number) of meetings a Director could attend as a Board member.
Role of the Chairman, Chief Executive Officer and Senior Independent DirectorIn order to avoid any one individual having unfettered powers, there is a clear division of responsibilities between the Chairman and the Chief Executive Officer. These have been set out in writing and approved by the Board.
Vanni Treves, the previous Chairman, became Chairman of the Board in May 2002, at which time he met the independence criteria as set out in the Code. Sir David Reid, upon his appointment as Chairman on 1 January 2012, also met the independence criteria set out in the Code. His responsibilities as Chairman include the leadership of the Board, ensuring its effectiveness and setting its agenda; ensuring that the Directors receive accurate, timely and clear information; ensuring effective communication with shareholders; facilitating the effective contribution to the Board of the Non-Executive Directors in particular; and ensuring constructive relationships between the Executive and Non-Executive Directors. The Chairman’s other main commitments are detailed in his biography on page 37.
Wolfhart Hauser, the Chief Executive Officer, has direct charge of the Group on a day-to-day basis and is accountable to the Board for the financial and operational performance of the Group.
Intertek Annual Report 2011 | 39
Corporate Governance Report
All Directors are entitled to obtain independent professional advice, at the Group’s expense, in the performance of their duties as Directors. No such advice was sought during the year. The Company has granted an indemnity, to the extent permitted by law, to each of the Directors and the Group Company Secretary. Directors’ and officers’ liability insurance is in place.
The Board believes that strong corporate governance improves the performance of the business and enhances shareholder value. During its meetings in 2011 the Board received and discussed reports from the Chief Executive Officer and Chief Financial Officer on strategy, debt financing, market reports, share trading reports, analysts’ forecasts, potential acquisitions, litigation reports, final and interim dividend recommendations, potential contract bids, road show and investor feedback, budgets, tax policy, treasury policy, Annual Report, Half Year Results, interim management statements, announcements and a wide range of other issues.
Performance evaluationOnce again, the Board engaged in a performance evaluation process led by the Chairman comprising a series of detailed questionnaires which provide a framework for the evaluation process. This provides a source of information not just on the Board’s performance but also on that of the Chief Executive Officer, individual Directors and the Chairman. There are questionnaires for each of the following: the Board; each individual Director; and the Audit and Risk, Nominations and Remuneration Committees. In 2011 no external facilitated evaluation was carried out as it was considered that an internal evaluation continued to be appropriate. The performance evaluation process will continue to be under review and it is currently proposed that an external evaluation will be undertaken in 2012.
This annual evaluation of the effectiveness of the Board and its Committees ensures that the performance of each individual Director and the functioning and constitution of the Board and each Committee are properly measured and debated.
The Chairman assessed the individual performance of each Director. During 2011 the Senior Independent Director did not have discussions with the other Directors to appraise the Chairman’s performance during the year as Vanni Treves retired at the end of the year. An appraisal of the new Chairman, Sir David Reid, will be held in 2012 in accordance with the Code. Following feedback from the Board evaluation process, which was discussed by the Board in January 2011, presentations from senior management to the Board have continued throughout 2011 and meetings have been held on regional strategy to increase the understanding of operations and opportunities. Each of the presentations made to the Board also includes a section on risk to ensure that all Directors are fully briefed in this area. The performance of the Board and each Director was, and is, effective, and all Directors demonstrate full commitment in their respective roles in the Company evidenced, inter alia, by the Board and Committee attendance records set out in this report. Following the recent changes to the Board membership the evaluations further demonstrate that the Board continues to maintain an appropriate set of skills, that all the Directors add value to the overall effectiveness and success of the Group, and that no significant issues have arisen out of the evaluation process.
David Allvey was Senior Independent Director from May 2002 until his retirement in December 2011. His responsibilities included leading the Non-Executive Directors’ annual consideration of the Chairman’s performance and holding discussions with the Non-Executive Directors without management present. Following David Allvey’s retirement, Michael Wareing was appointed Senior Independent Director. He is readily available to shareholders if they have concerns that remain unresolved after contacting the Group through the usual channels of the Chairman or the Executive Directors, or where such contact is inappropriate.
Board balance and independenceThe Nominations Committee has reviewed the independence of all the Non-Executive Directors taking into account the criteria outlined in B.1.1 of the Code. As a result, there was no change to the independent status of the current Non-Executive Directors. The Board considers that all the Non-Executive Directors have and continue to demonstrate the necessary characteristics of independence expected by the Board and it has been determined that none of the Non-Executive Directors have any relationships or links to the business which would compromise or interfere with the exercise of their independent judgement.
The Non-Executive Directors have a particular responsibility to ensure that the strategies proposed by the Executive Directors are fully discussed and critically examined, not only in the best long-term interests of shareholders, but also to ensure that they take proper account of the interests of customers, employees and other stakeholders. The Non-Executive Directors are all experienced individuals and through their mix of skills and business experience they contribute significantly to the effective functioning of the Board and its committees, ensuring that matters are fully debated and that no one individual or group dominates the decision-making process.
Professional developmentUpon appointment to the Board, new Non-Executive Directors receive a formal induction programme, co-ordinated by the Group Company Secretary, tailored to suit the individual’s previous experience. The formal induction also includes visiting laboratories and having meetings with employees and advisors. Ongoing training is provided to Directors as necessary, for example, on best practice and changes in legislation, developments in the economic and regulatory environment and on the Company’s businesses. In addition, visits to operational sites are arranged at least once a year and one Board meeting is held outside the UK which provides an opportunity for the Board to meet more senior managers across the Group and to further their knowledge of the Group’s operations. In November 2011 meetings were held in Shanghai which focused on the markets in China and involved meetings with major customers. During the visit the Board met with members of the Intertek Operations Committee and other senior managers within the Group. The Non-Executive Directors also attend various seminars during the year on topics relevant to a publicly listed company.
All Directors have access to the advice and services of the Group Company Secretary, who will assist in arranging any additional training and information as required. The appointment and removal of the Group Company Secretary is a matter for the Board as a whole.
Corporate Governance Report
40 | www.intertek.com
In order to operate effectively and to give appropriate attention and consideration to matters, the Board has established three Committees, each with clearly defined terms of reference, procedures and powers. These terms of reference are available on request from the Group Company Secretary at the registered office or can be downloaded from www.intertek.com. These Committees comprise the Remuneration Committee, the Nominations Committee and the Audit and Risk Committee. The Board is kept informed by the Committee chairmen through the provision of a summary of the issues discussed and decisions taken by each Committee.
The following sections explain the responsibilities of each Board Committee and the areas that they covered during the year.
The Remuneration CommitteeDuring 2011 this Committee comprised independent Non-Executive Directors David Allvey (Chairman), Gavin Darby (resigned May 2011) and Christopher Knight, together with Vanni Treves. With effect from 1 January 2012, the Committee now comprises Christopher Knight (Chairman), Alan Brown and Sir David Reid. The Code requires the Remuneration Committee to have at least three independent Non-Executive Directors whilst allowing the Chairman of the Board of Directors of the Company, if considered independent on appointment, to be a member. Whilst mindful of its non compliance with the Code, the Board has considered and still believes that the Committee has the necessary skills and expertise required. However, this will be kept under review and steps taken to look at appointing an additional Non-Executive Director during the year.
The Committee has responsibility for determining and agreeing with the Board the framework or Board policy for the remuneration of the Chairman, the Executive Directors and senior executives and for the determination, within agreed terms of reference, of additional benefits for each of the Executive Directors, including pension rights and any compensation for loss of office. The Committee is also responsible for the implementation and operation of employee share incentive arrangements. Details of the matters discussed and actions taken by the Remuneration Committee, including the Group’s remuneration for Executive Directors, and details of benefits, share based payments, pension entitlements, service contracts and compensation payments are given in the Remuneration Report which starts on page 48.
Membership and attendance at meetings during the year was as follows:
Name Attendance*
David Allvey (Chairman) 7 (7)Gavin Darby (resigned 20 May 2011) 4 (4)Christopher Knight 7 (7)Vanni Treves 6 (7)* Actual attendance (maximum number) of meetings a Director could attend as a
Committee member.
The Audit and Risk, Nominations and Remuneration Committees also each held an evaluation of their work and effectiveness during the year, the results of which were reported to the Board by the Group Company Secretary. The reviews concluded that each Committee was operating in an efficient and effective manner. The Board will continue to develop the evaluation process in order to ensure that it can properly review, on an annual basis, its performance and that of its individual members and Committees.
Procedures to deal with Directors’ conflicts of interestsThe Board has a formal system to deal with conflicts of Directors’ interests. Each year all Directors complete a questionnaire in order to identify any conflicts or potential conflicts of interests. The decision to authorise a conflict of interest can only be made by non-conflicted Directors, meaning those who have no interest in the matter being considered. The authorised decisions are reviewed on an annual basis or, where appropriate, authorisation is sought prior to the appointment of any new directors or if a new conflict arises. During 2011 this procedure operated effectively.
Consideration of the diversity of the BoardThe Board has given consideration to the content of Lord Davies’ recommendations for achieving greater diversity on Boards. Gender is one component of diversity and although no formal target for female representation on the Board was agreed, the Board is supportive of the recommendations’ aims, and continues to seek to ensure that in considering appointments to the Board a diverse range of candidates are presented. More information on diversity can be found in our Sustainability and CSR Report which starts on page 30.
The Board and its CommitteesIn order to review and monitor the performance of management the Group provides the Board with regular reports on a number of key areas. The Board also requests one-off reports on specific issues when necessary. A Board Approval Matrix is in place which formally outlines the matters specifically requiring the consent of the full Board. These matters include:
Group strategy; Annual budget; Annual Report, Half Year Results and related announcements; Capital expenditure; Acquisitions, disposals and other transactions outside
delegated limits; Changes in directors; Material contracts; Dividend policy; and Approval of tax, treasury and risk management policies.
The Board Approval Matrix also identifies areas where the Board has delegated authority to executive management, subject to certain financial limits. Where any of the activities involve amounts greater than those limits they are referred to the Board.
Intertek Annual Report 2011 | 41
Corporate Governance Report
The Nominations Committee membership and attendance at meetings was as follows during the year:
Name Attendance*
Vanni Treves (Chairman) 4 (5)David Allvey 5 (5)Christopher Knight 5 (5)Sir David Reid (Appointed 1 December 2011) 1 (1)* Actual attendance (maximum number) of meetings a Director could attend as a
Committee member.
The Audit and Risk CommitteeThroughout the year the composition of the Committee was in compliance with the Code. During 2011 the Committee comprised four Non-Executive Directors, David Allvey (Chairman), Edward Astle, Christopher Knight and Michael Wareing (appointed April 2011). Committee members have recent and relevant financial and business experience as detailed in their biographies on page 37. With effect from 1 January 2012, the Committee now comprises Michael Wareing (Chairman), Edward Astle and Christopher Knight.
The key functions of the Audit and Risk Committee are to monitor the integrity of the Group’s financial statements, review any formal announcements relating to the Group’s performance and review the effectiveness of the Group’s systems of internal control and risk management. In accordance with its terms of reference, the Committee is responsible for:
monitoring the effectiveness of the external audit process and making recommendations to the Board in relation to the appointment, reappointment and remuneration of the external auditors, and for ensuring that an appropriate relationship is maintained between the Group and its external auditors;
reviewing annually the effectiveness of the Group’s systems of internal control, risk management, the processes for monitoring and evaluating the risks facing the Group and the efficacy of the internal audit function;
monitoring the progress of internal audit activity against the annual plan, and reviewing the strategy, scope and approach of the internal audit and risk management teams;
reviewing the corrective action taken by management to address any control issues identified by the internal audit and risk management function; and
approving the appointment and termination of the Vice President Risk Management and Internal Audit and meeting with him at least once a year without management present.
Committee meetings are usually attended by the Group’s external auditors, Chief Executive Officer, Chief Financial Officer, Vice President Financial Control and the Vice President Risk Management, Internal Audit and the Chairman. The Group’s external auditors meet with the members of the Audit and Risk Committee at least once a year without management present.
The Nominations Committee Throughout the year the composition of the Committee was in compliance with the Code. During 2011 the Committee comprised Vanni Treves (Chairman), David Allvey and Christopher Knight. During 2011 this Committee was evaluated and the Board agreed that membership of the Committee was appropriate and effective. With effect from 1 January 2012, the Committee now comprises Sir David Reid (Chairman), Christopher Knight and Michael Wareing.
The main purpose of the Committee is to nominate candidates to fill Board vacancies, review talent mapping and succession planning for the Board and senior management and make recommendations on the balance and composition of the Board. In the event of any perceived conflict of interest, a sub committee comprising non-conflicted Directors is appointed.
Bearing in mind the balance of existing skills, knowledge and experience of the Board, a job description is prepared for any new Board position and when a Non-Executive Director is appointed, the Committee requires confirmation that he or she can devote sufficient time to fulfil the commitments of the role. The Committee ensures that the search for any Board candidate is conducted, on merit, against objective criteria and with due regard for the benefits of diversity on the Board, including gender. The terms and conditions of appointment of Non-Executive Directors are available for inspection by any person at the Company’s registered office during normal business hours and at the AGM. All Directors are subject to election by shareholders each year.
Organisation and succession planning are important components in ensuring the continued success of the Group. As part of the strategy processes, our operations plan the future organisation needed and address the consequent talent pipelines for all key roles across the Group. Linked with the other HR frameworks in place across the Group, this delivers a pragmatic approach to talent management in a global and geographically dispersed business.
Organisation and talent reviews are conducted by committees of the appropriate executives. The principal actions resulting from these reviews relate to development of executive capacity across Intertek. The Nominations Committee annually reviews the overall process and global priorities, as well as detailed plans at the most senior levels. In May 2011, due to the importance of this issue, there was a presentation to the Board on succession. During the year, a new Chairman and two new Non-Executive Directors were recruited to the Board as part of the process of succession to the Board and the need for continued refreshing of ideas, skills and experience on the Board.
Corporate Governance Report
42 | www.intertek.com
There are a number of controls in place to ensure that the Group has robust procedures for preparing consolidated accounts and for financial reporting. Intertek has a clear set of Accounting Policies and Procedures available to all finance staff. This gives instructions and guidance on all aspects of accounting and reporting that are relevant to the Group. There are ongoing reviews of adherence to these policies by Group Internal Audit and by Finance Management. The Group’s external auditors are KPMG Audit Plc.
The Board confirms that in addition to internal audits, there is an ongoing process for identifying, evaluating and managing any significant risks to the Group’s short and long-term value, including those arising from social, environmental and ethical matters. This process, which is regularly reviewed by the Board, has been in place for the year under review and up to the date of approval of the Annual Report. Any material breaches of the Group’s systems of internal and risk management controls identified by the Group’s control review procedures are reported to the Audit and Risk Committee and corrective action taken. In carrying out the risk review, the Board is satisfied that it received adequate information from the operations around the world. Training is provided to Directors on these matters where appropriate.
The Audit and Risk Committee has reviewed the effectiveness of the systems of financial and non-financial internal control and risk management during the year. In particular, it has reviewed and continues to seek to improve the process for identifying and evaluating all significant risks affecting the business and the policies and procedures by which these risks are managed.
The Group maintains a robust stance in regard to breaches of ethics and this is reinforced by the Intertek Compliance Code and Code of Ethics, which provide practical guidance and instruction for employees. The Codes are available at www.intertek.com. All employees are required to sign a certificate confirming their understanding that any breaches of the Group’s Code of Ethics will result in disciplinary action that may include summary dismissal of the employee concerned. To support Group policies and to facilitate the raising of concerns about possible improprieties in matters of financial reporting or any other matters, the Group provides and publicises email, web and telephone hotlines so that staff or third parties may report anonymously any perceived inaccurate or unethical working practices. All complaints are investigated thoroughly with action taken as appropriate. The number of complaints received, together with the corrective actions taken, is reported to the Audit and Risk Committee. More information on hotline incidents is provided on page 33 of the Sustainability and CSR Report. The Group continues to publicise the existence of hotlines to internal and external parties, and sees hotlines as an important tool in eradicating isolated cases of poor behaviour. In 2011 most investigations concluded that the complaint was unfounded, but corrective action was taken where appropriate.
The Audit and Risk Committee seeks to ensure the continued independence and objectivity of the Group’s external auditors. The policy on the provision of non-audit work by the external auditors, which seeks to ensure that auditors’ objectivity and independence are safeguarded, was revised in February 2011. The policy highlights those areas where the external auditor cannot provide services to the Group, including inter alia, the provision of Group management functions, internal audit outsourcing or co-sourcing services, provision of legal advice and appraisal or valuation services. The external auditors confirm by way of a letter to the Board that processes to ensure compliance with this policy are in place, and that these processes are monitored regularly. A breakdown of the audit and non-audit fees paid to the Group’s auditors during the year is set out in note 4 to the financial statements.
The Committee has recommended to the Board that KPMG Audit Plc be reappointed the Group’s external auditor at the forthcoming AGM.
At its meetings during 2011 the Committee reviewed and endorsed, prior to submission to the Board, the Group’s 2010 Annual Report and 2011 Half Year Results. The Chairman and other Committee members also attend meetings with the external auditors and management to discuss any accounting issues associated with the annual audit. The Committee also reviewed the Group’s arrangements for the avoidance and detection of fraud, bribery and related matters, whistle-blowing and hotlines, compliance, training, quality assurance systems and potential claims affecting the Group.
The ultimate responsibility for reviewing and approving the Annual Report and the Half Year Results announcement remains with the Board.
Membership and attendance at meetings was as follows during the year: Name Attendance*
David Allvey (Chairman) 5 (5)Edward Astle 5 (5)Christopher Knight 5 (5)Michael Wareing (Appointed 15 April 2011) 3 (3)* Actual attendance (maximum number) of meetings a Director could attend as a
Committee member.
Internal controlThe Group’s primary business objectives require adherence to local, national and international laws and require the Group’s employees to show integrity and honesty in all business dealings. Risk management and internal controls are therefore embedded in the running of each division and support function, assuring the accuracy and validity of reports and certificates that the Group provides to customers. The Board is responsible for establishing and maintaining the Group’s system of internal control and risk management and for reviewing its effectiveness. Such a system can realistically only manage, rather than eliminate, the risk of failure to achieve business objectives and can only provide reasonable assurance against material misstatement or loss.
Intertek Annual Report 2011 | 43
Corporate Governance Report
The Chief Executive Officer also reports to the Board on significant changes in the business and the external environment which could impact on risk. The Chief Financial Officer provides the Board with monthly financial information, which includes the comparison of key performance figures against budgets and forecasts. Information is also provided with regard to risk indicators. The Board approves the treasury policy and the Treasury department’s activities are also subject to internal audits.
ShareholdersThe Board recognises the importance of maintaining an effective investor relations and communication programme as part of its ongoing relationship with the Company’s shareholders. The Group produces an Annual Report which is available to shareholders and also publishes Interim Management Statements and Half Year Results. The Group website www.intertek.com contains up-to-date information on its activities and published financial results. Shareholders can subscribe via the Investors’ section of www.intertek.com to receive email alerts of important announcements made by the Group. Communications with shareholders are available using electronic means, via the Group website or by email. The Group’s Annual Report, notices of meetings and proxy forms can be provided electronically. However, shareholders are also able to request paper copies of documents if they so choose.
Any significant comments received from institutional shareholders are communicated directly to the Board.
The Company’s AGM provides all shareholders with the opportunity to further develop their understanding of the Company and to ask questions of the full Board on the matters put to the meeting, including the Annual Report. All Board members attend the AGM and in particular, the Chairmen of the Audit and Risk, Nominations and Remuneration Committees are available to answer questions. At General Meetings a schedule of the proxy votes cast is made available to all shareholders and is also available on the Group website. The Company proposes a resolution on each substantially separate issue and does not combine resolutions inappropriately. At this year’s AGM we shall be adopting a poll procedure in respect of all resolutions, as recommended by a number of shareholder groups.
Going concernAfter making diligent enquiries, the Directors have a reasonable expectation that the Group has adequate resources to continue in operation for the foreseeable future. Accordingly, they continue to adopt the going concern basis in preparing the Group’s financial statements.
In carrying out its review, the Audit and Risk Committee endeavours to ensure that the Group has in place the most appropriate and effective controls, checks, systems and risk management techniques so as to be in line with best practice on such matters. The control environment within the Group is strengthened by two internal committees. The Risk Control and Assurance Committee (‘RCA’) has the remit of overseeing the development of the internal control framework, reviewing risk matrices and risk management procedures, monitoring issues and providing a conduit of information to senior management. The Committee comprises the Chief Financial Officer, Group Company Secretary, Chief Information Officer, Group Executive Vice President of Human Resources, Vice President Financial Control, Chief Financial Officer Asia and Vice President Risk Management and Internal Audit and meets approximately every three months. An Investment Committee has also been established with the remit of reviewing and approving requests for material expenditure and other key actions throughout the business within certain limits as outlined in the Board Approval Matrix. In 2011, this Committee comprised the Chief Executive Officer and the Chief Financial Officer.
Each operating division and support function is responsible for the identification and evaluation of significant risks applicable to that area of business, together with the design and operation of suitable internal controls. These risks are assessed on a continual basis and are reviewed by the RCA, and may be associated with a variety of internal or external factors including control breakdowns, disruption of information systems, litigation, loss of key facilities, retention of key staff, competition, natural catastrophe and regulatory requirements. Operation of the controls is designed to minimise the occurrence of risk or its consequences. A separate review of the key financial controls is undertaken by the finance function. One of the Audit and Risk Committee’s main roles is to review, on behalf of the Board, the key risks inherent in the business and the system of controls necessary to ensure such risks are properly managed.
A process of control using self-assessment and hierarchical reporting has been established which provides a documented trail of accountability. These procedures are applied across Group operations and provide for continuing assurances to be given at increasingly higher levels of management and finally, to the Board. This process is facilitated by Internal Audit which also provides assurance as to the operation and validity of the system of internal control and risk management. Planned corrective actions are monitored for timely completion.
Quality assurance audits are carried out by the divisions, and the findings reported to divisional management. Each division has at least one compliance officer who undertakes investigations of issues that arise either from quality assurance audits or from other sources, such as the hotline. Reports of significant findings are presented to the Audit and Risk Committee.
Sites are reviewed regularly on a schedule based on materiality and perceived risk. Reports of significant findings are presented to the Audit and Risk Committee which monitors and reviews the effectiveness of the internal audit function. The internal audit department was awarded ISO 9001 accreditation in 2003 which was successfully renewed for a further three years in 2009. An external accreditation body conducts surveillance audits of the internal audit department every year, and conducts a more detailed review every three years.
Corporate Governance Report
44 | www.intertek.com

Principal Risks and Uncertainties
internal audit and risk strategy. In addition to the risk register, all senior executives and their direct reports are required to complete an annual return to confirm that management controls have been effectively applied during the year. The return covers operations, compliance, risk management and finance.
The Risk Control and Assurance Committee (‘RCA’), comprising senior Intertek executives, complements the work of the Audit and Risk Committee. The RCA oversees the development of the internal control framework, reviews the risk matrices and risk management procedures, monitors issues and provides guidance to management. The RCA makes recommendations to the Intertek Operations Committee where Group-wide policies are identified and develops the Group’s integrated responses to changes in the regulatory environment.
Principal risksThe Group is affected by a number of risk factors, some of which, including macroeconomic risks, are outside the Group’s control. Some risks are particular to Intertek’s operations and the principal risks of which we are aware are detailed below including a commentary on how the Group mitigates these risks. These risks and uncertainties do not appear in any particular order of potential materiality or probability of occurrence.
There may be other risks that are currently unknown or regarded as immaterial which could turn out to be material. Any of these risks could have the potential to impact the performance of the Group, its assets, liquidity, capital resources and its reputation.
This section sets out a description of the principal risks and uncertainties that could have a material adverse effect on the Intertek Group’s strategy, performance, results, financial condition and reputation.
Risk frameworkThe Board has overall responsibility for the establishment and oversight of the Group’s risk management framework which is described in the Corporate Governance Report on pages 43 and 44.
The Vice President of Risk Management and Internal Audit, who reports to the Chief Financial Officer and the Audit and Risk Committee, has accountability for reporting the key risks that the Group faces, the controls over these risks and any mitigating actions or controls in place. He attends the meetings of the Audit and Risk Committee, and meets with the members of that committee alone at least once a year.
Risks are formally identified and recorded in a risk register for each operating division and support function. The risk register is updated at least twice each year and is used to plan the Group’s
Operational
Risk description
Loss of reputationThe risk that there is a breakdown in the Group’s quality standards which leads to a loss of confidence in the Group’s standards and reputation for quality and safety service excellence.
The risk that unethical behaviour by employees or representatives could have an adverse impact on the Group’s reputation.
Mitigation
The Group has in place a comprehensive suite of detailed Quality Management Systems. Adherence to these is regularly audited and reviewed by external parties, including accreditation bodies.
The Group has a well defined Code of Ethics which is communicated to all staff, who undergo regular training. The Group has a ‘whistle blowing’ programme, monitored by the Audit and Risk Committee where staff are encouraged to report, without risk, any fraudulent or other activity likely to adversely affect the reputation of the Group. There is a zero tolerance policy with regard to any inappropriate behaviour by any individual employed by the Group. Media comments with regard to Group activities are centrally reviewed so that senior management can, where necessary, take appropriate action on a timely basis.
Dependence on accreditation The Group relies on being awarded and retaining appropriate accreditations and affiliations around the world in order to provide its certification services. Failure to obtain or retain a particular accreditation could lead to a loss of business in the relevant industry and could damage the Group’s reputation.
The Group has extensive quality assurance procedures and controls embedded in its operations to ensure that it holds and maintains the necessary accreditations and that the required operational standards are applied. Operations are regularly subjected to audit and review by external parties including accreditation bodies, governments, trade affiliations, retailers, manufacturers and clients.
Intertek Annual Report 2011 | 45

Principal Risks and Uncertainties
Operational risks continued
Risk description
Management expertiseThe Group operates in specialised sectors and needs to attract and retain employees with relevant experience and knowledge. Failure to do so could impact our ability to compete effectively.
Mitigation
The Group operates a thorough development and reward program to identify future senior managers and to retain key staff.
Political actionThe Group operates in over 100 countries including some where there is political instability which can result in disruption to operations and the change or termination of contracts at short notice.
In addition, changes to local tax legislation can impact the Group’s effective tax rate.
The Group closely monitors any incidents of political or social unrest and where possible, takes mitigating action to prevent loss to the Group, including exiting the country if the risk is considered unacceptable.
The Group maintains close relationships with government representatives but the risk of adverse government action cannot be entirely mitigated.
Legal and regulatory
Risk description
LitigationFrom time-to-time, the Group is involved in claims and lawsuits, incidental to its normal business, including claims for damages, negligence and commercial disputes and disputes with current and former employees. There is a risk that a legal dispute could adversely affect the reputation of the Group and result in significant financial loss.
Mitigation
To reduce the likelihood of claims arising, the Group has extensive quality assurance procedures and controls in place. All incidents that could potentially result in a claim against the Group are immediately reported to compliance officers and logged in an incident database so that they can be properly managed. The Company Secretary reports any risk of significant claims to the Audit and Risk Committee. Legal counsel is appointed if appropriate.
The Group mitigates the risk of financial loss arising from litigation by maintaining insurance cover covering potential claims although there is no certainty that this will be sufficient to cover any ultimate loss.
Regulatory complianceThe Group is subject to local laws and regulations in each of the countries and jurisdictions in which it operates. These cover all aspects of the Group’s operations and functions including employment legislation and taxation.
The Group employs local people in each country who are aware of local legal and regulatory compliance. There are also extensive internal compliance and audit systems to facilitate compliance. Expert advice is taken in areas where regulations are uncertain.
46 | www.intertek.com

Principal Risks and Uncertainties
Financial
Risk description
Foreign currency risks The Group reports its financial results in sterling but a significant majority of the Group’s revenue and operating costs are incurred in currencies other than sterling. Accordingly, the Group’s profit is exposed to exchange rate fluctuations. Two types of risk arise as a result:
(i) Translation riskThe risk that the sterling value of net assets held in overseas subsidiaries is reduced due to exchange rate fluctuations.
(ii) Transaction riskThe risk of adverse exchange rate fluctuations affecting the sterling value of cash flows.
Mitigation
The Group’s Treasury function has responsibility for managing the Group’s cash, debt facilities and foreign currency exposures. The Group has established procedures for managing foreign currency risk including monitoring foreign currency cash balances on a daily basis and hedging foreign currency exposures on a monthly basis. The Group’s policy is to match the currency of external borrowings to the currency of expected cash flows and the currency of net investments. All overseas subsidiaries are required to hedge all significant foreign exchange transaction exposures with Group Treasury.
Liquidity riskThe Group might be unable to meet its growth plans or financial obligations if it could not raise sufficient funding.
The Group manages its cash and borrowing facilities, ensuring sufficient liquidity through daily cash forecasting and by maintaining sufficient committed borrowing facilities from a range of investors.
The Group is in regular contact with the banks and capital debt markets, as well as other potential providers of debt to ensure a proper and timely understanding of the availability and pricing of debt funding. The Group’s facilities are managed to ensure that borrowing facilities are of a mixed duration, mitigating the amount of borrowings that mature within a single period.
The Group regularly reviews its interest rate exposures and has a policy to ensure that over one third of its borrowings are on a fixed rate basis.
Risk of financial irregularitiesThe Group could suffer financial loss either through misappropriation of assets or the misrepresentation of financial results.
The Group has established financial and management controls in place to ensure that the Group’s assets are protected from major financial risks.
A detailed system of financial reporting is in place to ensure that monthly financial results are thoroughly reviewed. The Group also operates a rigorous programme of internal audits and management reviews. Independent external auditors review the Group’s half year results and audit the Group’s annual financial statements.
Integration riskThe Group may acquire entities that do not achieve the anticipated return on capital, resulting in financial loss to the Group. There is also a risk that acquired assets are overstated.
On 27 April 2011 the Group acquired Moody International for £450m, which is the largest and most complex acquisition completed to date. Apart from the risks noted above, there is a risk that the business is not effectively integrated.
The Group applies a rigorous independent financial and legal due diligence process to all acquisitions to identify material issues during the negotiation period prior to completion.
The Group has a dedicated integration team and appointed external advisors to help management ensure that the integration process is managed effectively.
During 2011 we have successfully integrated Moody into our Industry & Assurance division.
Intertek Annual Report 2011 | 47

Commentary from the Chairman of the Remuneration Committee (‘Committee’)The challenges for a Remuneration Committee include balancing prudence against appropriate reward for good performance, particularly so in the current economic environment. However, I am pleased to say that the Group’s results for 2011 as set out in the financial pages of this Annual Report have been such that we have been able to recommend good rewards for the exceptional performance achieved. Intertek’s successful growth strategy has been achieved by the continuing excellent performance of management and we believe that the agreed remuneration appropriately rewards that effort.
As previously explained, in 2011 we altered the performance criteria for future performance-related long term share awards for our forty or so most senior executives. These awards are based half on relative Total Shareholder Return (‘TSR’) and half on absolute Earnings Per Share growth (‘EPS’). Following the acquisition of Moody International (‘Moody’) we subsequently increased the previously declared EPS targets to take into account the expected earnings enhancement arising from that significant acquisition.
We continue to focus on ensuring that our remuneration policy is appropriate for the size and complexity of the Group, encourages our employees in the development of their careers and is directed to deliver the continued growth of the Group.
The CommitteeOn behalf of the Board, the Committee:
determines the Company’s policy on the remuneration of the Chairman, and the remuneration and incentives for Executive Directors and other senior executives (mainly the Intertek Operations Committee (the ’IOC’) which comprises the Group and Executive Vice-Presidents as listed on pages 12 and 13);
determines the remuneration packages of the above, including any compensation on termination of office;
reviews the remuneration arrangements for the wider employee population and considers issues relating to remuneration packages that may have a significant impact on the Group;
provides advice to, and consults with, the Chief Executive Officer on major policy issues affecting the remuneration of other executives; and
keeps remuneration policy under review in the light of regulatory and best practice developments and shareholder expectations. Due regard is given to the interests of shareholders and the requirements of the Listing Rules and associated guidance.
The Committee met seven times during 2011. Attendance statistics appear in the Corporate Governance Report on page 41; the Committee’s terms of reference are available on the Group’s website at www.intertek.com.
Contents48 This Report
48 Chairman’s commentary
48 The Committee
49 Policy on Remuneration
49 Advisors
50 Executive Directors’ and other executives’ remuneration
50 Salaries
51 Other benefits
51 Pensions
51 Cash bonuses
52 Share Plan awards
53 Policy on share retention
53 Service contracts and appointment arrangements
53 Policy on external appointments
54 Non-Executive Directors
54 TSR performance graph
55 Information required to be audited
This ReportThis Report sets out the Group’s policy and disclosures in relation to Directors’ remuneration for the year ended 31 December 2011. It will be subject to a separate shareholder vote at the forthcoming Annual General Meeting (‘AGM’).
The Report has been prepared on behalf of the Board and complies fully with the requirements of the Companies Act 2006 and Schedule 8 of the Large and Medium-sized Companies and Groups (Accounts and Reports) Regulations 2008 (the ‘Regulations’) and the UK Corporate Governance Code (the ’Code’) as applicable for the financial year and the elements specifically stated as having been audited, have been audited by KPMG Audit Plc in compliance with the requirements of the Regulations.
The Group has applied the Principles of Good Corporate Governance relating to the remuneration of its Directors and this Report outlines how the Group has already complied with the provisions of the Code as well as the latest guidelines issued or proposed by institutional shareholder bodies.
Remuneration Report
48 | www.intertek.com

The following Non-Executive Directors of the Company served on the Committee in 2011; David Allvey (Chairman), Gavin Darby, until his resignation in May 2011, Christopher Knight and Vanni Treves. Following David Allvey and Vanni Treves’ retirements, the Committee comprises Christopher Knight, now Chairman, Alan Brown and Sir David Reid.
David Allvey was independent in accordance with the Code and Vanni Treves was independent at the time of his appointment as Chairman of the Board. In the current Committee, Alan Brown and Christopher Knight are independent in accordance with the Code and Sir David Reid was independent at the time of his appointment as Chairman of the Board.
None of the Committee members have had any personal financial interest, except as shareholders, in the matters decided. Where executives are in attendance in an advisory capacity at a Committee meeting, they will absent themselves for matters relating to their own remuneration.
The remuneration of the Committee members is shown on page 55.
Policy on remunerationOur remuneration strategy is to: align and recognise the individual’s contribution to success
in our strategy and long-term business goals; attract, engage, motivate and retain the best available people
by positioning total pay and benefits to be competitive in the relevant market and in line with the ability of the business to pay;
reward people equitably for the size of their responsibilities and performance; and
engage motivated high performers and, through variable bonus schemes and long-term incentive plans, share the Group’s success with those who build and lead Intertek as a world class business and encourage them to increase shareholder value.
Each year the Committee approves the overall reward strategy for the Group and considers the individual remuneration packages of the Executive Directors and certain senior executives. There are no executives whose remuneration exceeds that of the Executive Directors.
The Committee reviews the balance between base salary and performance-related remuneration against the key objectives and targets so as to ensure performance is appropriately rewarded. It also ensures outcomes are a fair reflection of the underlying performance of the Group.
As a global service business, success is critically dependent on the performance and retention of our key people. Employment costs represent the major element of Group operating costs. As a global group our pay arrangements take into account both local and international markets. We operate a global Remuneration Policy Framework to achieve our reward strategy, with each operation retaining the freedom to navigate within that framework to find the best local solution.
When determining salaries for our executives we take account of pay and employment conditions elsewhere in the Group, as well as the relevant general market. This is achieved by reviewing detailed information for the four areas (mainland China, USA, UK and Hong Kong) in which the Group employs the greatest number of employees.
Our peer groups for the majority of our employees consist of international industrial or business service organisations and similar-sized businesses. In respect of our more senior executives we base our pay comparisons on a blend of factors, including sector, job complexity, location, responsibilities and performance, whilst recognising the Company is listed in the UK.
We believe that a significant proportion of remuneration for senior executives should be related to performance, with part of that remuneration being deferred in the form of shares and subject to continued employment. We also believe that share-based remuneration should form a significant element of senior executives’ compensation so there is a strong link to the sustained future success of the Group.
Advisors To ensure that the Group’s remuneration practices drive and support achievement of strategies and are market competitive, we obtain advice from various independent sources. The Committee has appointed and taken independent advice on ensuring that remuneration is ‘fit for purpose’, on share incentive arrangements and remuneration benchmarking from Kepler Associates (‘KA’), on remuneration matters from AON Hewitt New Bridge Street (‘AON’), and on UK pension matters from Premier Pensions Management Limited (‘PPM’). During 2011, PPM’s associate company provided additional FSA-regulated services in respect of UK pension and employee matters. PPM, KA and AON have no other connection with the Company or its senior officers.
Remuneration Report
Intertek Annual Report 2011 | 49

The separate elements of remuneration are shown below:
1. SalariesSalaries are reviewed annually, in accordance with the Group’s Remuneration Policy Framework. The policy is for salaries to reflect: the growth in size, reach and complexity of the business; demonstrable and sustained contribution of the executive
to the development of Intertek’s strategy, and to driving increased synergy and efficiency;
retention; and market movement.
Where a decision is made to increase a senior executive’s base salary we will require the individual, taking into account levels of experience and scale of responsibilities, to have demonstrated strong leadership combined with a results-orientated approach. Whilst the Committee takes benchmarking information into account, its discussions are based primarily on the performance of the individual concerned against the above factors to ensure that there is no unintended or unjustified upward ratchet in base remuneration.
Executive Directors’ and other executives’ remuneration
The following table sets out the elements that make up the remuneration of the two Executive Directors and other senior executives:
1 Fixed Base salary The base salary takes account of the size of the job in the appropriate market and the competence and contribution of the job holder.
2 Fixed Other benefits These include car allowances, life and private medical insurance and annual medicals.
3 Fixed Pension Pension arrangements reflect the appropriate market. 4 Performance:
short-termAnnual cash performance bonus The cash bonus serves to drive and recognise short-term
performance against targets which are a mix of shareholder, business and personal objectives, both numeric and non-numeric. The criteria and targets are reviewed each year for strategic alignment and to fit changing business objectives and the economic environment.
5 Performance: long term
Share Plan awards For the purposes of retention, and to link reward clearly to shareholders’ interests in the long-term success of the Company, a significant element of reward is determined by business performance, and has a value dependent on our share price at the end of the deferral period. In addition there are holding requirements for the duration of employment.
In 2011 the total remuneration for our Executive Directors and the balance between the above elements was:
Wolfhart Hauser (£2,875k)
Lloyd Pitchford (£1,413k)
23% 28% 23% 18%6%2%
27% 2% 6% 23% 19%23%
Base salary Benefits Pensions Cash bonus Share Awards Performance Awards
The base salary, benefits, pensions, cash bonus and Share Awards are shown in the table on page 55. The Performance Award is half the fair value of the maximum potential number of Performance Shares that may vest subject to performance. Details of how the fair values of the share plan awards have been calculated are set out in note 17 to the financial statements. The remuneration for Lloyd Pitchford excludes the mirror share awards described on page 53.
Remuneration Report
Salaries for the Executive Directors were increased in 2011 and in 2012 (see the table below). Applying the above criteria, we considered that the performance of the individuals, taken in conjunction with the continuing growth and financial success of the Group, justified the increases. In the case of Wolfhart Hauser, the Board regards his leadership of the Group as exemplary. Lloyd Pitchford joined the Group in 2010 and his salary increase reflects the strong performance he is delivering in the role.
The Executive Directors salaries are:
Base salary from 1 April
2011£000
Base salary from 1 April
2012£000
Base salary % increase
over 2011 salary
Wolfhart Hauser 667 694 4%Lloyd Pitchford 400 436 9%
Elsewhere in the Group, salary increases were also awarded where justified by the growth and performance of the relevant businesses, not just by market conditions.
50 | www.intertek.com

process and annual budgets for the Group, which form the cornerstone of the Group’s results-focused culture. The divisional elements of bonus are based upon financial performance indicators appropriate to that division. The effect of exchange rate movements on earnings is one of the elements we consider before finalising bonus outcomes.
The proportions of bonus elements in 2011 were:
Executive Directors
Divisional EVPs
Group Function EVPs
Group performance Divisional performance/job-specific objectives General contribution to strategy and synergies
80% 20%
40% 40% 20%
50% 30% 20%
The weightings and outcomes for the Group financial bonus criteria for 2011 were:
Businessoutcome % of bonus
Adjusted diluted earnings per share growth1
21% 50%
Adjusted operating profit growth1 24% 25%Operating cash flow % of adjusted operating profit1
87% 15%
Return on invested capital 17% 10%
1 Calculated using constant 2010 exchange rates.
The non-financial general contribution element of up to 20% of total bonus has been determined by taking into account the overall personal contribution of the executive to the goals and results of the Group for the year, the development of the medium-term strategy of the Group, the achievement over the year of strategic objectives and demonstrable efforts and results in team-building and leadership.
The Committee can award additional discretionary payments to recognise very exceptional performance or to recognise that circumstances have occurred which were beyond the direct responsibility of the executive and the executive has managed and mitigated the impact of any loss, or to address key retention issues. The Committee has the ability to reduce bonus payments if it believes that short-term performance has been achieved at the expense of the Group’s long-term future success and it also retains the discretion to reclaim payments if the performance achievements are subsequently found to have been significantly misstated; no discretion was exercised in respect of the bonuses paid in 2011.
2. Other benefitsOther benefits include annual medicals, life assurance cover of four times base salary, allowances in lieu of a company car or other benefits and private medical insurance.
3. PensionsThe pension arrangements for Executive Directors are as follows:
Group Company
Pension Member
% Base salary
Contribution2011£000
Contribution2010£000
Wolfhart Hauser No 25% 163 143Lloyd Pitchford No 20% 78 48
Intertek also operates a number of pension arrangements around the world for other executives and employees. Material schemes are disclosed in note 16 to the financial statements.
4. Cash bonusesThe Executive Directors and senior executives are eligible for annual cash incentive payments for performance against financial and strategic goals set for the Group and its businesses. These bonuses are not pensionable. They are based on a blend of financial and non-financial measures and are reviewed each year.
The annual cash bonus potential set for 2011 and 2012 is:
Percentage of base salary 2011 2012
Wolfhart Hauser 130% 130%Lloyd Pitchford 90% 100%Executive Vice Presidents 75% 75%
The award of the bonus in respect of 2011, to be paid in March 2012, is as follows:
Percentage of base salary
2011 Award
£000 Max % % of salary
Wolfhart Hauser 798 130% 120%Lloyd Pitchford 331 90% 83%
Group and divisional bonus targets are established and reviewed by the Committee each year. They are set to ensure they are linked to strategic and immediate current business goals, and are sufficiently demanding, taking full account of economic conditions and risk factors. Achievement of business targets typically delivers half of the bonus opportunity so as to encourage and reward performance above expectations. The stretch targets, when met, reward exceptional achievement and contribution well beyond expectations.
Executive Directors’ bonus criteria for 2011 comprised the following: (i) Group performance elements; and (ii) non-financial elements. Senior executives’ bonus criteria for 2011 comprised the following: (i) Group performance elements; (ii) divisional performance elements, where the executive is responsible for divisional results, or function-specific objectives; and (iii) non-financial elements. The goals derive from the three-year planning
Remuneration Report
Intertek Annual Report 2011 | 51
The Committee considers that EPS is an appropriate measure of Intertek’s long-term performance as it is a well recognised and well understood indicator of the Company’s financial performance.
EPS is fully diluted and adjusted for separately disclosed items. It will be calculated on the basis of foreign exchange rates adopted at the start of the cycle for internal budgeting purposes. This is an appropriate basis given the wide spread of operating currencies across the Group’s global activities.
Awards will vest as follows in respect of the EPS condition: EPS growth outturn
% of Performance Award that vests
Below threshold NoneThreshold EPS 25%Between threshold and upper target
Pro-rata on a straight line between 25% and 100%
Upper target 100%
The TSR condition in 2011 was based on the Company’s TSR ranking relative to a peer group of companies in the FTSE Index. For grants made in 2011 the peer group of FTSE Index members 51 to 150 (excluding investment trusts and banks) was used. For the grant in 2012 the peer group of FTSE index members 31 to 130 (excluding investment trusts and banks) will be used.
The Committee considers that relative TSR is an appropriate measure of long-term performance as it is an indicator of earnings growth, the quality of earnings and dividends relative to Intertek’s FTSE comparators, and it aligns the interests of executives with those of Intertek shareholders.
For the TSR element to vest, the Committee will also need to be satisfied that the resulting outcome is a true reflection of underlying performance (which in general, we expect to be determined by reference to EPS growth).
Awards vest as follows in respect of the TSR condition:
TSR Ranking% of Performance Award that vests
Below median NoneMedian 25%Between median and upper quartile
Pro-rata on a straight line between 25% and 100%
Upper quartile 100%
The Committee can set different performance conditions from those described above for future awards. Any such new targets will not, in the reasonable opinion of the Committee, be materially less challenging in the circumstances than those described above.
ii) Deferred Bonus Plan 2005Awards were granted under this plan between 2006 and 2010. Both Deferred Awards and Matching Awards (which were performance related) were granted. Vesting takes place three years after grant.
5. Share plan awardsExecutive Directors and other executives are awarded shares in the Intertek 2011 Long Term Incentive Plan (the ‘Plan’) and are subject to share holding requirements.
Intertek share plansExecutive Directors and other key employees are eligible to participate in our share plans. Non-Executive Directors are not. In 2011 we replaced our Deferred Bonus Plan (’DBP’) with the Plan. The purpose and design of the Plan is similar to the DBP but it includes more flexible rules. We also changed the basis of the performance requirements to include a significant EPS element as described below.
i) Intertek 2011 Long Term Incentive PlanThe purposes of this Plan are the reward and retention of senior executives and key specialists and the alignment of their interests with shareholders by linking rewards to Intertek’s long term performance.
The Plan has two elements: Share Awards are made to executives based on their annual
performance. For the Executive Directors and the members of the IOC, who form the senior management of Intertek, the value of Share Awards will normally be equal to their cash bonus. We believe that this provides a simple and well-targeted form of reward. The awards normally vest three years after grant, on the condition that the participant is still employed in the Group.
Performance Awards, which are subject to long-term performance requirements, are, at the discretion of the Committee, awarded to the most senior executives. Performance Awards for the Executive Directors and IOC are granted at the maximum ratio of two Performance Shares for every Share Award. For members of the Intertek Council Performance Awards are granted at the maximum ratio of one Performance Share for every Share Award. Performance Awards vest after three years, once the Committee has determined the extent to which the applicable performance conditions have been satisfied and on the condition that the participant is still employed in the Group.
At the Group’s discretion, awards may be satisfied by the issue of new shares, by purchasing shares in the market, or in cash.
In respect of Share Awards and Performance Awards granted in 2012, further amounts, equivalent to dividends paid and payable during the vesting period, will be paid in cash or shares at vesting.
The vesting of half of each Performance Award is conditional on achieving an EPS target and half is conditional on achieving a TSR target.
The EPS performance condition is set as a compound annual percentage growth over three years, measured against the base year, which is the year prior to the start of the measurement period. For each three-year cycle the Committee will determine a threshold level and an upper vesting target for EPS growth. For the 2011-2013 performance period, exceptionally, as a result of the mid year acquisition of Moody, the threshold level was set at 11% per annum and the upper target at 20% per annum. For the 2012-2014 performance period, the threshold level will be set at 6% per annum and the upper target at 16% per annum.
Remuneration Report
52 | www.intertek.com
Service contracts and appointment arrangementsWolfhart Hauser has an executive service contract, effective from 1 March 2005, which is subject to 12 months’ notice on either side. It contains provisions by way of compensation for loss of office, limited to payment of salary over a 12-month period in lieu of notice. The contract permits payments in lieu of notice to be made, at the Company’s election, either (i) in full on termination or (ii) on a monthly basis, but only for so long as he receives no remuneration from any other business. If he does receive any such remuneration, the monthly amount payable will be reduced by that remuneration, determined on a monthly basis. The service contract contains no provisions regarding a change of control.
Lloyd Pitchford has an executive service contract, effective from 26 April 2010, which is subject to 12 months’ notice on either side. It contains provisions by way of compensation for loss of office, limited to payment of salary and pension contributions over a 12-month period in lieu of notice. The contract permits payments in lieu of notice to be made, at the Company’s election, either (i) in full on termination or (ii) in the amounts and at the times it would have been paid if he had continued to work throughout the period of notice but only for so long as he receives no remuneration from any other business. If he does receive any such remuneration, the monthly amount payable will be reduced by that remuneration, determined on a monthly basis. The service contract contains no provisions regarding a change of control and permits bonus payments to be reclaimed in the event that performance achievements are found to have been significantly misstated.
Policy on external appointmentsThe Company recognises that, during their employment with the Company, Executive Directors may be invited to become Non-Executive Directors of other companies and that such duties can broaden their experience and knowledge. Executive Directors may, with the written consent of the Company, accept such appointments outside the Company, and the policy is that any fees may be retained by the Director. Wolfhart Hauser is a Non-Executive Director of Logica plc. His earnings for this appointment in 2011, which he retained, were £52,000.
The performance condition for these earlier Matching Awards comprises only TSR ranking relative to a peer group of FTSE Index companies. The peer groups selected have varied from year to year to reflect the rise in Intertek’s ranking in the FTSE index. No Matching Award will vest unless an EPS underpin of 2% in excess of average growth per annum of UK Retail Prices Index is met.
Awards vest as follows in respect of the TSR condition:
TSR Ranking % of Matching Award that vests
Below median NoneMedian 25%Between median and upper quartile
Pro-rata on a straight line between 25% and 100%
Upper quartile 100%
The Company has undertaken to limit to 5% of the Company’s issued share capital the number of awards satisfied by newly issued shares under the Plan and the DBP in each ten-year period, from the time the DBP was adopted. As at 31 December 2011, outstanding awards represented 1.66% of the Company’s issued share capital and 0.81% of issued share capital has been issued in satisfaction of awards.
iii) Mirror share awardsAs part of the arrangements made in respect of the hiring of Lloyd Pitchford, the Company agreed to compensate him for the loss of share incentive awards made to him by his previous employer by replacing each of his outstanding awards with an award (a ‘mirror share award’) over an appropriately adjusted number of Intertek Group plc shares. Details of these awards, and their performance criteria, were explained in detail in the 2010 Annual Report. A summary appears on page 56.
Policy on share retentionA shareholding retention requirement continues to be operated by the Committee. Executive Directors and the members of the IOC, who form the senior management of Intertek, are required to build up a shareholding in the Company worth at least 100% of base salary within five years. To assist in the building of this holding, we require that, after allowing for tax and similar liabilities, all the shares subject to each vested award under the Intertek Share Plans will be retained by the executive until the ownership target is attained.
Executive Director Number of shares held
Shareholding retention requirement met?
Wolfhart Hauser 87,677 �
Lloyd Pitchford 22,197 �
Remuneration Report
Intertek Annual Report 2011 | 53

Non-Executive Directors
Current Non-Executive Directors’ appointment and fees
Original appointment
Expiry of appointment
Annualbasic fee
from 1 April 2011 or date of
appointment £
Remuneration Committee
Audit and Risk
CommitteeNominations
Committee
Additionalcommittee/
SID fee*£
Total annual fees from
1 January 2012£
Amount of basic fee used
to purchase shares
each year £
Edward Astle 1 September 2009
31 August 2012
55,000 – � – 7,500 62,500 10,000
Alan Brown 15 April 2011
14 April 2014
55,000 � – – 5,000 60,000 10,000
Christopher Knight 30 March 2006
29 March 2015
55,000 � � � 20,000 75,000 10,000
Sir David Reid 1 December 2011
30 November 2014
300,000 � – � – 300,000 30,000
Michael Wareing(Senior Independent Director)
15 April 2011
14 April 2014
55,000 – � � 29,500 84,500 10,000
* SID – Senior Independent Director
Pursuant to the policy of aligning directors’ interests with those of shareholders, a proportion of the fees due to the Non-Executive Directors is used each year to purchase shares in the Company. A summary of the Non-Executive Directors’ fees and the pre-tax amounts of those fees used to purchase shares in the Company each year is shown in the table above.
With effect from 1 April 2011 the base fee for Non-Executive Directors was £55,000. Other than Sir David Reid, who receives a car allowance of £25,000 per annum, no other benefits are provided.
The Non-Executive Directors do not have service contracts with the Company. The letter of engagement for each Non-Executive Director states that they are appointed for an initial period of three years and all appointments are terminable by one month’s notice on either side. At the end of the initial period the appointment may be renewed for a further period, usually three years, if the Company and the Director agree and subject to annual reappointment at the AGM. Each letter of engagement states that if the Group were to terminate the appointment, the Non-Executive Director would not be entitled to any compensation for loss of office.
TSR performance graph TSR, comprising the changes in value of a share and dividends distributed, can be represented by the value of a notional £100 invested at the beginning of a period and its change over that period.
The graph below shows the TSR in respect of the Company over five years. The TSR for the Company is compared with the TSR for the FTSE 100 Index. The Company joined the FTSE 100 in March 2009.
2007 2008 2009 2010 2011
Intertek Group v FTSE 100
Intertek Group
Source: Thomas Reuters Datastream
FTSE 100
50
100
150
200
250
300
350
Information provided by J.P. Morgan Cazenove and calculated according to methodology that is compliant with the requirements of the Companies Act 2006. The performance of the Company, as indicated by the graph, is not indicative of vesting levels under Intertek’s Share Plans.
Remuneration Report
54 | www.intertek.com

Information required to be auditedThe auditors are required to report on the information contained in the following section of the Report.
The table below summarises Directors’ remuneration and pension contributions for 2011 and the prior year for comparison.
Directors’ remuneration summary
Base salary and fees
2011£000
Cash bonuses
2011£000
Other benefits
2011£000
Pension contributions
2011£000
Total emoluments
2011£000
Total emoluments
2010£000
ShareAwards1
2011£000
ShareAwards1
2010£000
Executive DirectorsWolfhart Hauser 652 798 69 163 1,682 1,575 667 606Lloyd Pitchford 388 331 24 78 821 606 331 304Non-Executive DirectorsDavid Allvey5 94 – – – 94 93 – –Edward Astle 62 – – – 62 61 – –Alan Brown3 39 – – – 39 – – –Gavin Darby2,6 27 – – – 27 58 – –
Christopher Knight 70 – – – 70 68 – –Debra Rade5,6 57 – – – 57 53 – –Sir David Reid4 25 – 2 – 27 – – –Vanni Treves5 198 – 14 – 212 203 – –Michael Wareing3 44 – – – 44 – – –Total 1,656 1,129 109 241 3,135 2,717 998 910
1. The Share Awards normally vest three years after the date of grant, on condition that the participant is still employed in the Group. These figures exclude amounts relating to Performance Awards granted under the Plan. Details of those awards and their performance criteria are given on pages 52 and 53.
2. Resigned 20 May 2011.3. Appointed 15 April 2011.4. Appointed 1 December 2011.5. Retired 31 December 2011.6. Debra Rade and Gavin Darby each received an extra payment of £2,500 in recognition of work undertaken in connection with the Chairman’s succession planning.
Directors’ interests in ordinary sharesThe interests of the Directors in the shares of the Company as at the year-end are set out below. Save as stated in this report, during the course of the year, no Director nor any member of his or her immediate family had any other interest in the ordinary share capital of the Company or any of its subsidiaries.
Number of ordinary shares of 1p
31 December 2010 or on
appointment Acquired Disposed
31 December 2011 or on
leaving
David Allvey1 6,966 297 – 7,263Edward Astle 392 292 – 684Alan Brown2 – – – –Gavin Darby3 3,753 292 – 4,045Wolfhart Hauser 87,677 79,344 79,344 87,677Christopher Knight 6,696 292 – 6,988Lloyd Pitchford 19,166 14,852 11,821 22,197Debra Rade1 2,532 297 – 2,829Sir David Reid4 – – – –Vanni Treves1 53,452 596 34,048 20,000Michael Wareing2 3,000 – – 3,000
1. Retired 31 December 2011.2. Appointed 15 April 2011.3. Resigned 20 May 2011.4. Appointed 1 December 2011.
No changes in the above Directors’ interests have taken place between 31 December 2011 and the date of this report.
Remuneration Report
Intertek Annual Report 2011 | 55

Directors’ interests in Intertek Share Plans
31 December 2010 Number
of shares
Granted in 2011
Number of shares
Award price1
£
Vestedin 2011
Number of shares2
Lapsedin 2011
Number of shares
31 December 2011
Number of shares Date of vesting3
Wolfhart Hauser 2008 Deferred 26,448 – 9.150 (26,448) – – March 2011
Matching 52,896 – 9.150 (52,896) – –2009 Deferred 46,152 – 8.342 – – 46,152 March 2012
Matching 92,304 – 8.342 – – 92,3042010 Deferred 43,316 – 13.332 – – 43,316 March 2013
Matching 86,632 – 13.332 – – 86,6322011 Share – 31,938 18.986 – – 31,938 March 2014
Performance – 63,876 18.986 – – 63,876Total 347,748 95,814 (79,344)4 – 364,218Lloyd Pitchford2010 Deferred 8,313 – 14.434 – – 8,313 May 2013
Matching 16,626 – 14.434 – – 16,6262011 Share – 16,034 18.986 – – 16,034 March 2014
Performance – 32,068 18.986 – – 32,068Total 24,939 48,102 – – 73,041
1. Awards made are based on a share price obtained by averaging the closing share prices for the five dealing days before the date of grant. On the grant date 8 March 2011 the share price was £19.55. No payment is made by participants in the Plan or the DBP.
2. Awards vested on 11 March 2011, on which date the closing market price of shares was £19.13 having been granted on 11 March 2008 on which date the closing market price was £9.595.
3. Awards normally vest three years after grant. The vesting of Matching and Performance Awards is subject to additional performance conditions described on page 52 and 53.
4. The aggregate gain made by Directors on the vesting of awards was £1,511,503.
Mirror share awardsOn 14 May 2010 Lloyd Pitchford was granted conditional rights to acquire 49,039 1p shares in Intertek Group plc under a one-off arrangement as a condition of his recruitment as Chief Financial Officer of the Company. The principal terms of the awards are summarised below. The award comprised eight parts (tranches A to H). Tranche A vested in 2010. The number of Intertek Group plc shares within each tranche is noted in the table below together with details of each tranche’s normal vesting date:
31 December 2010Number of shares
Vested in 2011Number of shares
Lapsed in 2011Number of shares
31 December 2011Number of shares
Vesting date of award
Tranche B 8,497 (6,315) (2,182) – March 2011Tranche C 1,378 (1,378) – – September 2011Tranche D 4,429 (4,429) – – September 2011Tranche E 2,730 (2,730) – – September 2011Tranche F 1,723 – – 1,723 September 2012Tranche G 5,170 – – 5,170 September 2012Tranche H 3,006 – – 3,006 September 2012Total 26,933 (14,852) (2,182) 9,899
Each tranche will ordinarily vest on its normal vesting date subject to Lloyd Pitchford’s continued employment with Intertek. In addition, in the case of tranche G the extent to which such tranche may vest is also contingent on the satisfaction of performance criteria. The awards may only be satisfied with market purchased shares or cash. No newly issued shares or treasury shares will be used in connection with the awards. The gain made on vesting during 2011 was £297,048.
Share informationOn 30 December 2011 (the last working day of the year) the closing market price of Intertek Group plc’s ordinary shares was £20.35. The highest and lowest prices of the shares during the year were £21.48 and £17.15 respectively.
Approval of the Remuneration ReportThe Remuneration Report was approved by the Board on 2 March 2012.
Christopher KnightChairman, Remuneration Committee
Remuneration Report
56 | www.intertek.com

In accordance with the requirements of the Companies Act 2006 (the ‘Act’) and UK Listing Authority Disclosure and Transparency Rules, the following section describes the matters that are required for inclusion in the Directors’ Report and were approved by the Board. Further details of matters required to be included in the Directors’ Report that are incorporated by reference into this report are set out below.
DirectorsThe Directors who held office during the year are set out below.
Vanni Treves Chairman (retired 31 December 2011)Wolfhart Hauser Chief Executive OfficerLloyd Pitchford Chief Financial Officer David Allvey Senior Independent Director
(retired 31 December 2011)Edward Astle Non-Executive Director Alan Brown Non-Executive Director
(appointed 15 April 2011)Gavin Darby Non-Executive Director
(resigned 20 May 2011)Christopher Knight Non-Executive DirectorDebra Rade Non-Executive Director
(retired 31 December 2011)Sir David Reid* Non-Executive Director
(appointed 1 December 2011)Michael Wareing**Non-Executive Director
(appointed 15 April 2011)
* Appointed Chairman from 1 January 2012.** Appointed Senior Independent Director from 1 January 2012.
The biographies of the Directors at the date of this report are set out on page 37.
The Company’s Articles of Association contain provisions relating to the retirement, election and re-election of Directors but, in accordance with best practice, all directors will stand for re-election at the Annual General Meeting (‘AGM’).
Directors’ powers and Articles of AssociationThe Directors are responsible for the management of the Company and their powers to do so are determined by the provisions of the Act and the Company’s Articles of Association. The Articles of Association set out the internal regulation of the Company and cover such matters as the rights of shareholders, the appointment or removal of Directors and the conduct of the Board and general meetings. Copies are available upon request from the Group Company Secretary and are available at the Company’s AGM. Further powers are granted by members in general meeting and those currently in place are set out in detail within the appropriate section of this report.
Directors’ interests Other than employment contracts, none of the Directors of the Company had a personal interest in any business transactions of the Company or its subsidiaries. The terms of the Directors’ service contracts and the Directors’ interests in the shares and share awards of the Company, in respect of which transactions are notifiable to the Company under the UK Listing Authority Disclosure and Transparency Rule 3.1.2 are disclosed in the Remuneration Report on pages 48 to 56.
Directors’ indemnitiesThe Board believes that it is in the best interests of the Group to attract and retain the services of the most able and experienced directors by offering competitive terms of engagement, including the granting of indemnities on terms consistent with the applicable statutory provisions. Qualifying third-party indemnity provisions (as defined by section 234 of the Act), were accordingly in force during the course of the financial year ended 31 December 2011, for the benefit of the Directors and, at the date of this report, are in force in relation to certain losses and liabilities which they may incur (or have incurred) in connection with their duties, powers or office.
Principal activities and business reviewThe Group’s principal activities, business and principal risks and uncertainties are contained in the Business Review, on pages 6 to 35 and the Corporate Governance section, on pages 38 to 44 which are incorporated by reference into this report.
DividendThe Directors are recommending a final dividend of 23.0p per ordinary share (2010: 18.8p) making a full year dividend of 33.7p per ordinary share (2010: 28.1p) which will, if approved at the AGM, be paid on 22 June 2012 to shareholders on the register at close of business on 8 June 2012.
Share capitalThe issued share capital of the Company, and details of the movements in the Company’s share capital during the year, are shown in note 15 to the financial statements.
The holders of ordinary shares are entitled to receive dividends when declared, to receive the Company’s report and accounts, to attend and speak at general meetings of the Company, to appoint proxies and exercise voting rights. A waiver of dividend exists in respect of 414,770 shares held by the Intertek Group Employee Share Ownership Trust at 31 December 2011. There are no restrictions on the transfer of ordinary shares in the Company.
The rights attached to shares in the Company are provided by the Articles of Association, which may be amended or replaced by means of a special resolution of the Company in a General Meeting. The Directors’ powers are conferred on them by UK legislation and by the Company’s Articles of Association.
No ordinary shares carry any special rights with regard to control of the Company and there are no restrictions on voting rights except that a shareholder has no right to vote in respect of a share unless all sums due in respect of that share are fully paid. There are no arrangements known to the Company by which financial rights carried by any shares in the Company are held by a person other than the holders of the shares, nor are there any arrangements between holders of securities that may result in restrictions on the transfer of securities or on voting rights known to the Company. All issued shares are fully paid.
Shares are admitted to trading on the London Stock Exchange and may be traded through the CREST system.
Intertek Annual Report 2011 | 57
Other Statutory Information

Allotment of sharesAt the AGM held in 2011 the shareholders generally and unconditionally authorised the Directors to allot relevant securities up to approximately two-thirds of the nominal amount of issued share capital. It is the Directors intention to renew this authority in line with guidance issued by the Association of British Insurers. The resolution will be set out in the Notice of AGM.
Also at the AGM in 2011 the Directors were empowered by the shareholders to allot equity securities, up to 5% of the Company’s issued share capital, for cash under section 570 of the Act. It is intended that this authority be renewed, up to 5%, at the forthcoming AGM.
Purchase of own sharesShareholders also approved the authority for the Company to buy back up to 10% of its own ordinary shares by market purchase until the conclusion of the AGM to be held this year. The Directors will seek to renew this authority for up to 10% of the Company’s issued share capital at the forthcoming AGM. This power will only be exercised if the Directors are satisfied that any purchase will increase the earnings per share of the ordinary share capital in issue after the purchase and accordingly, that the purchase is in the interests of shareholders. The Directors will also give careful consideration to gearing levels of the Company and its general financial position. Any shares purchased in this way may be held in treasury which, the Directors believe, will provide the Company with flexibility in the management of its share capital. Where treasury shares are used to satisfy share options or awards, they will be classed as new issue shares for the purpose of the 10% limit on the number of shares that may be issued over a ten-year period under our relevant share plan rules.
Policy and practice on payment of suppliers The Group does not follow a single standard on payment practice but has a variety of payment terms with its suppliers. Payment terms are agreed at the commencement of business with each supplier and it is the policy of the Group that payment is made accordingly, subject to the terms and conditions being met. The holding company, Intertek Group plc, does not trade and therefore has no trade payables.
Significant relationshipsThe Group does not have any contractual or other relationships with any single party which are essential to the business of the Group and therefore no such relationships have been disclosed.
Social and community issuesWe encourage our local managers to foster community links appropriate to the businesses they manage. Further details are given in our Sustainability and CSR Report on page 35.
Material interests in sharesThe following disclosures of major holdings of voting rights have been made (and have not been amended or withdrawn) to the Company pursuant to the requirements of the UK Listing Authority Disclosure and Transparency Rule 5:
BlackRock Inc. gave notice on 2 December 2010 that they had an indirect interest on 30 November 2010 in 7,965,320 ordinary shares, representing 4.99% of the ordinary shares in issue at that date.
Capital Research and Management Company gave notice on 1 November 2010 that they had an indirect interest on 29 October 2010 in 8,064,491 ordinary shares, representing 5.06% of the ordinary shares in issue at that date.
Legal and General Group plc gave notice on 18 November 2009 that they had a direct interest on 17 November 2009 in 6,340,736 ordinary shares, representing 3.99% of the ordinary shares in issue on that date.
Charitable and political donations During 2011 the Group made charitable donations of £117,000 (2010: £103,000) to a wide variety of charities.
At the AGM in 2011 shareholders passed a resolution, on a precautionary basis, to authorise the Company to make donations to EU political organisations and to incur EU political expenditure (as such terms are defined in the Act) not exceeding £90,000. During the year the Group did not make any political donations (2010: £nil). It is the Company’s policy not, directly or through any subsidiary, to make what are commonly regarded as donations to any political party. However, at the forthcoming AGM of the Company, shareholders’ approval will again be sought to authorise the Group to make political donations and/or incur political expenditure (as such terms are defined in Sections 362 to 379 of the Act). Further details of this will be contained in the Notice of AGM.
AuditorsThe auditors, KPMG Audit Plc, have indicated their willingness to continue in office and a resolution that they be reappointed will be proposed at the forthcoming AGM in accordance with Section 489 of the Act.
Annual General MeetingThe Notice convening the AGM, to be held on 17 May 2012, will be available for download from the Company’s corporate website at www.intertek.com/investors. The Notice will detail the business to be conducted at the meeting and include information concerning the deadlines for submitting proxy forms and in relation to voting rights.
Statement of Disclosure of information to auditorsThe Directors who held office at the date of approval of this Directors’ Report confirm that, so far as they are aware, there is no relevant audit information of which the Company’s auditors are unaware and each Director has taken all the steps that he or she ought to have taken as a Director to make himself or herself aware of any relevant audit information and to establish that the Company’s auditors are aware of that information.
Other Statutory Information
58 | www.intertek.com
The Directors are responsible for the maintenance and integrity of the corporate and financial information included on the Company’s website. Legislation in the UK governing the preparation and dissemination of financial statements may differ from legislation in other jurisdictions.
Responsibility statement of the Directors in respect of the annual financial reportEach of the Directors, whose name and functions are listed on page 37, confirm that to the best of their knowledge:
the financial statements, prepared in accordance with the applicable set of accounting standards, give a true and fair view of the assets, liabilities, financial position and profit or loss of the Company and the undertakings included in the consolidation taken as a whole; and
the Directors’ Report includes a fair review of the development and performance of the business and the position of the Company and the undertakings included in the consolidation taken as a whole, together with a description of the principal risks and uncertainties that they face.
This Directors’ Report comprising pages 6 to 59 has been approved by the Board and signed on its behalf by:
Wolfhart HauserChief Executive Officer
2 March 2012Registered Office25 Savile RowLondonW1S 2ESRegistered Number: 4267576
Statement of Directors’ Responsibilities in respect of the Annual Report and the financial statements The Directors are responsible for preparing the Annual Report and the Group and Parent Company financial statements in accordance with applicable law and regulations.
Company law requires the Directors to prepare Group and Parent Company financial statements for each financial year. Under that law they are required to prepare the Group financial statements in accordance with International Financial Reporting Standards (IFRSs) as adopted by the EU and applicable law and have elected to prepare the Parent Company financial statements in accordance with UK Accounting Standards and applicable law (UK Generally Accepted Accounting Practice).
Under company law the Directors must not approve the financial statements unless they are satisfied that they give a true and fair view of the state of affairs of the Group and Parent Company and of their profit or loss for that period. In preparing each of the Group and Parent Company financial statements, the Directors are required to:
select suitable accounting policies and then apply them consistently;
make judgements and estimates that are reasonable and prudent;
for the Group financial statements, state whether they have been prepared in accordance with IFRSs as adopted by the EU;
for the Parent Company financial statements, state whether applicable UK Accounting Standards have been followed, subject to any material departures disclosed and explained in the Parent Company financial statements; and
prepare the financial statements on the going concern basis unless it is inappropriate to presume that the Group and the Parent Company will continue in business.
The Directors are responsible for keeping adequate accounting records that are sufficient to show and explain the Parent Company’s transactions and disclose with reasonable accuracy at any time the financial position of the Parent Company and enable them to ensure that its financial statements comply with the Act. They have general responsibility for taking such steps as are reasonably open to them to safeguard the assets of the Group and to prevent and detect fraud and other irregularities.
Under applicable law and regulations, the directors are also responsible for preparing a Directors’ Report, Directors’ Remuneration Report and Corporate Governance Statement that complies with that law and those regulations.
Intertek Annual Report 2011 | 59
Statement of Directors’ Responsibilities
We have audited the financial statements of Intertek Group plc for the year ended 31 December 2011 set out on pages 62 to 110. The financial reporting framework that has been applied in the preparation of the Group financial statements is applicable law and International Financial Reporting Standards (IFRSs) as adopted by the EU. The financial reporting framework that has been applied in the preparation of the Parent Company financial statements is applicable law and UK Accounting Standards (UK Generally Accepted Accounting Practice).
This report is made solely to the Company’s members, as a body, in accordance with Chapter 3 of Part 16 of the Companies Act 2006. Our audit work has been undertaken so that we might state to the Company’s members those matters we are required to state to them in an auditor’s report and for no other purpose. To the fullest extent permitted by law, we do not accept or assume responsibility to anyone other than the Company and the Company’s members, as a body, for our audit work, for this report, or for the opinions we have formed.
Respective responsibilities of directors and auditorAs explained more fully in the Statement of Directors’ Responsibilities set out on page 59, the Directors are responsible for the preparation of the financial statements and for being satisfied that they give a true and fair view. Our responsibility is to audit, and express an opinion on, the financial statements in accordance with applicable law and International Standards on Auditing (UK and Ireland). Those standards require us to comply with the Auditing Practices Board’s (APB’s) Ethical Standards for Auditors.
Scope of the audit of the financial statementsA description of the scope of an audit of financial statements is provided on the APB’s website at www.frc.org.uk/apb/scope/private.cfm
Opinion on financial statementsIn our opinion: the financial statements give a true and fair view of the state
of the Group’s and of the Parent Company’s affairs as at 31 December 2011 and of the Group’s profit for the year then ended;
the Group financial statements have been properly prepared in accordance with IFRSs as adopted by the EU;
the Parent Company financial statements have been properly prepared in accordance with UK Generally Accepted Accounting Practice;
the financial statements have been prepared in accordance with the requirements of the Companies Act 2006; and, as regards the Group financial statements, Article 4 of the IAS Regulation.
Opinion on other matters prescribed by the Companies Act 2006In our opinion: the part of the Directors’ Remuneration Report to be
audited has been properly prepared in accordance with the Companies Act 2006; and
the information given in the Directors’ Report for the financial year for which the financial statements are prepared is consistent with the group financial statements.
Matters on which we are required to report by exceptionWe have nothing to report in respect of the following:
Under the Companies Act 2006 we are required to report to you if, in our opinion:
adequate accounting records have not been kept by the Parent Company, or returns adequate for our audit have not been received from branches not visited by us; or
the Parent Company financial statements and the part of the Directors’ Remuneration Report to be audited are not in agreement with the accounting records and returns; or
certain disclosures of directors’ remuneration specified by law are not made; or
we have not received all the information and explanations we require for our audit.
Under the Listing Rules we are required to review: the directors’ statement, set out on page 44, in relation
to going concern; the part of the Corporate Governance Statement in the
Directors’ Report relating to the Company’s compliance with the nine provisions of the UK Corporate Governance Code specified for our review; and
certain elements of the report to shareholders by the Board on directors’ remuneration.
P Korolkiewicz (Senior Statutory Auditor) for and on behalf of KPMG Audit Plc, Statutory AuditorChartered Accountants15 Canada SquareLondon E14 5GL2 March 2012
60 | www.intertek.com
Independent Auditor’s Report to the members of Intertek Group plc

Financial Statements
Contents
62 Consolidated Income Statement
63 Consolidated Statement of Comprehensive Income
64 Consolidated Statement of Financial Position
65 Consolidated Statement of Changes in Equity
66 Consolidated Statement of Cash Flows
67 Notes to the financial statements
107 Intertek Group plc Company Balance Sheet
Notes to the financial statements
Page Note
67 1 Significant accounting policies
69 2 Operating segments and presentation of results
72 3 Separately disclosed items
73 4 Expenses and auditor’s remuneration
73 5 Employees
74 6 Taxation
77 7 Earnings per ordinary share
78 8 Property, plant and equipment
80 9 Goodwill and other intangible assets
84 10 Acquisitions
87 11 Trade and other receivables
88 12 Trade and other payables
88 13 Provisions
89 14 Borrowings and financial instruments
96 15 Capital and reserves
97 16 Employee benefits
102 17 Share schemes
104 18 Subsequent events
104 19 Capital management
104 20 Non-controlling interest
105 21 Related parties
105 22 Contingent liabilities
106 23 Principal subsidiary undertakings

Notes
Adjusted results
£m
Separately disclosed
items* £m
Total2011
£m
Adjusted results
£m
Separately disclosed
items* £m
Total2010
£m
Revenue 2 1,749.4 – 1,749.4 1,374.2 – 1,374.2Operating costs (1,468.3) (47.1) (1,515.4) (1,146.7) (21.0) (1,167.7)Group operating profit 2 281.1 (47.1) 234.0 227.5 (21.0) 206.5
Finance income 14 8.2 – 8.2 7.2 – 7.2Finance expense 14 (29.2) – (29.2) (22.8) (1.0) (23.8)Net financing costs (21.0) – (21.0) (15.6) (1.0) (16.6)
Profit before income tax 260.1 (47.1) 213.0 211.9 (22.0) 189.9Income tax expense 6 (73.3) 11.4 (61.9) (56.6) 5.7 (50.9)Profit for the year 2 186.8 (35.7) 151.1 155.3 (16.3) 139.0
Attributable to: Equity holders of the Company 174.5 (35.7) 138.8 144.9 (16.3) 128.6 Non-controlling interest 20 12.3 – 12.3 10.4 – 10.4
Profit for the year 186.8 (35.7) 151.1 155.3 (16.3) 139.0
Earnings per share**Basic 7 86.8p 80.7pDiluted 7 85.3p 79.3p
* See note 3.** Earnings per share on the adjusted results is disclosed in note 7.
Consolidated Income StatementFor the year ended 31 December 2011
62 | www.intertek.com
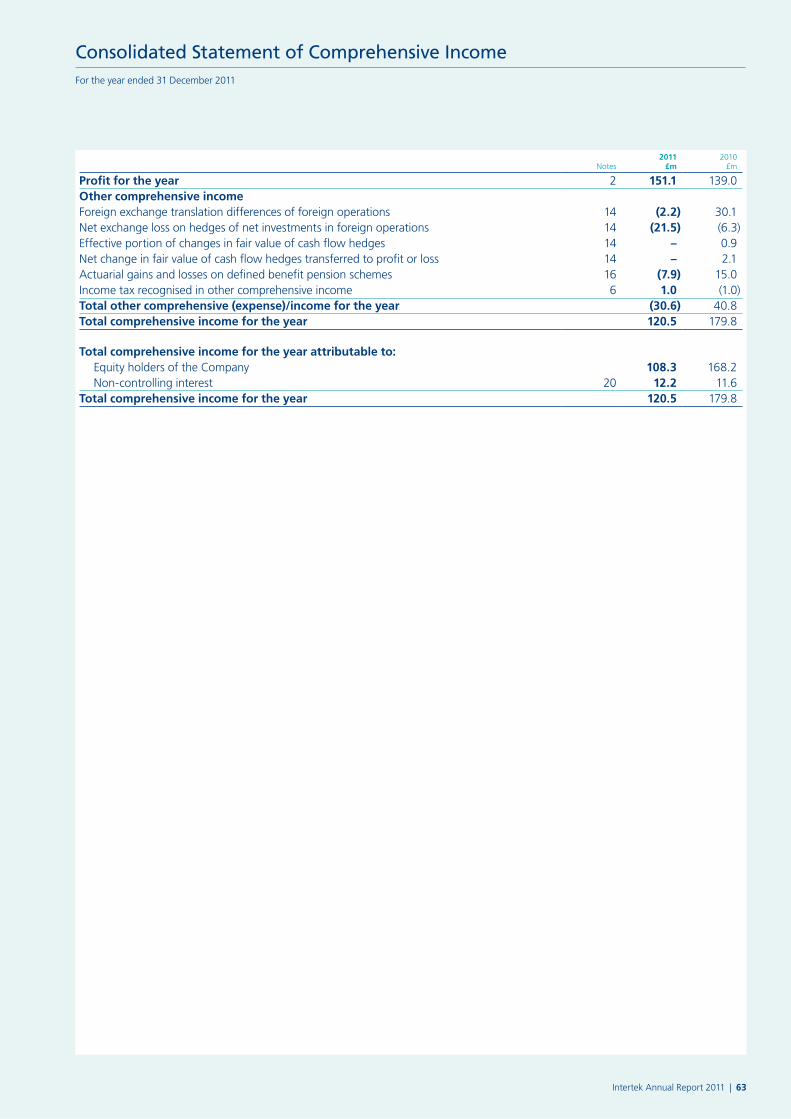
Notes2011
£m2010
£m
Profit for the year 2 151.1 139.0Other comprehensive incomeForeign exchange translation differences of foreign operations 14 (2.2) 30.1Net exchange loss on hedges of net investments in foreign operations 14 (21.5) (6.3)Effective portion of changes in fair value of cash flow hedges 14 – 0.9Net change in fair value of cash flow hedges transferred to profit or loss 14 – 2.1Actuarial gains and losses on defined benefit pension schemes 16 (7.9) 15.0Income tax recognised in other comprehensive income 6 1.0 (1.0)Total other comprehensive (expense)/income for the year (30.6) 40.8Total comprehensive income for the year 120.5 179.8
Total comprehensive income for the year attributable to: Equity holders of the Company 108.3 168.2 Non-controlling interest 20 12.2 11.6
Total comprehensive income for the year 120.5 179.8
Consolidated Statement of Comprehensive Income For the year ended 31 December 2011
Intertek Annual Report 2011 | 63

Consolidated Statement of Financial PositionAs at 31 December 2011
Notes2011
£m2010
£m
AssetsProperty, plant and equipment 8 265.0 243.1Goodwill 9 637.0 301.5Other intangible assets 9 169.5 44.1Investments in associates 0.7 –Deferred tax assets 6 27.6 26.4Total non–current assets 1,099.8 615.1Inventories 12.3 9.9Trade and other receivables 11 442.6 315.2Cash and cash equivalents 14 181.9 217.0Total current assets 636.8 542.1
Total assets 1,736.6 1,157.2
LiabilitiesInterest bearing loans and borrowings 14 (38.7) (93.6)Derivative financial instruments 14 – (1.0)Current taxes payable (44.1) (22.5)Trade and other payables 12 (295.5) (220.3)Provisions 13 (17.1) (23.5)Total current liabilities (395.4) (360.9)Interest bearing loans and borrowings 14 (723.9) (293.1)Deferred tax liabilities 6 (49.2) (7.6)Net pension liabilities 16 (11.3) (5.5)Other payables 12 (9.0) (7.3)Provisions 13 (1.3) (0.8)Total non-current liabilities (794.7) (314.3)
Total liabilities (1,190.1) (675.2)
Net assets 546.5 482.0
EquityShare capital 15 1.6 1.6Share premium 256.7 256.3Other reserves 27.9 51.5Retained earnings 236.3 149.5Total equity attributable to equity holders of the Company 522.5 458.9Non-controlling interest 20 24.0 23.1
Total equity 546.5 482.0
The financial statements on pages 62 to 106 were approved by the Board on 2 March 2012 and were signed on its behalf by:
Wolfhart Hauser Lloyd Pitchford Director Director
64 | www.intertek.com
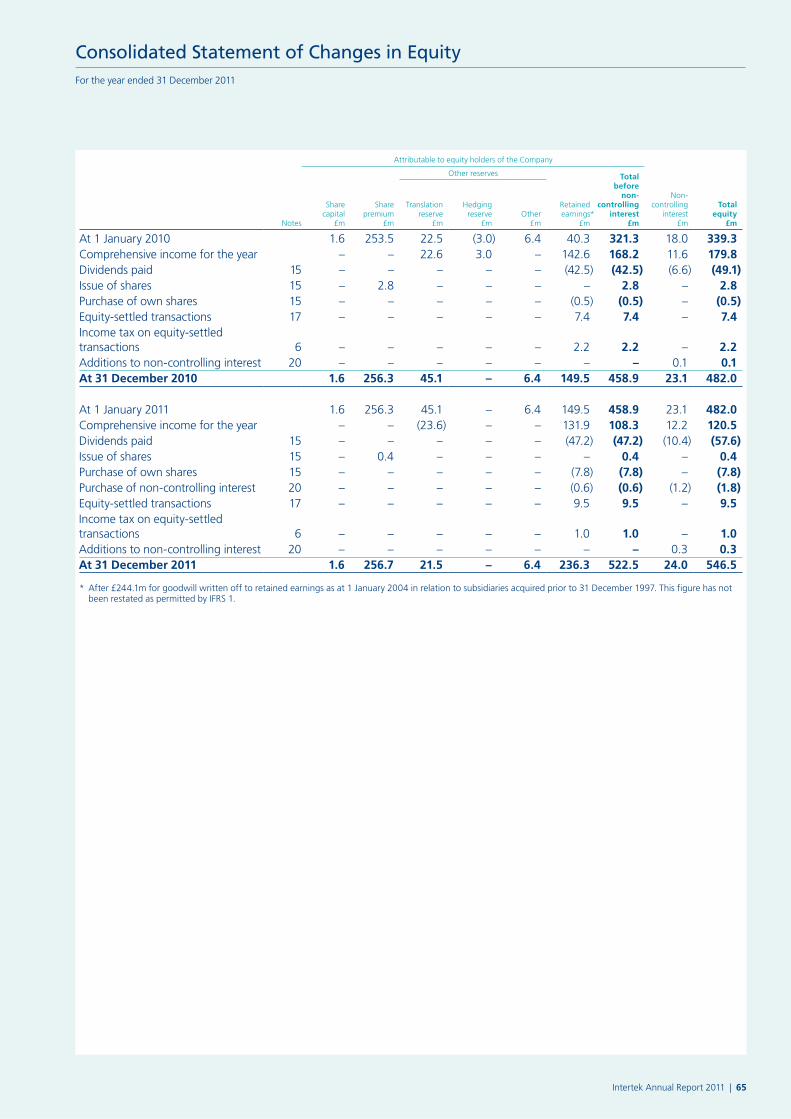
Consolidated Statement of Changes in EquityFor the year ended 31 December 2011
Attributable to equity holders of the Company
Notes
Share capital
£m
Share premium
£m
Other reserves
Retained earnings*
£m
Total before
non-controlling
interest £m
Non-controlling
interest£m
Total equity
£m
Translation reserve
£m
Hedging reserve
£mOther
£m
At 1 January 2010 1.6 253.5 22.5 (3.0) 6.4 40.3 321.3 18.0 339.3Comprehensive income for the year – – 22.6 3.0 – 142.6 168.2 11.6 179.8Dividends paid 15 – – – – – (42.5) (42.5) (6.6) (49.1)Issue of shares 15 – 2.8 – – – – 2.8 – 2.8Purchase of own shares 15 – – – – – (0.5) (0.5) – (0.5)Equity-settled transactions 17 – – – – – 7.4 7.4 – 7.4Income tax on equity-settled transactions 6 – – – – – 2.2 2.2 – 2.2Additions to non-controlling interest 20 – – – – – – – 0.1 0.1At 31 December 2010 1.6 256.3 45.1 – 6.4 149.5 458.9 23.1 482.0
At 1 January 2011 1.6 256.3 45.1 – 6.4 149.5 458.9 23.1 482.0Comprehensive income for the year – – (23.6) – – 131.9 108.3 12.2 120.5Dividends paid 15 – – – – – (47.2) (47.2) (10.4) (57.6)Issue of shares 15 – 0.4 – – – – 0.4 – 0.4Purchase of own shares 15 – – – – – (7.8) (7.8) – (7.8)Purchase of non-controlling interest 20 – – – – – (0.6) (0.6) (1.2) (1.8)Equity-settled transactions 17 – – – – – 9.5 9.5 – 9.5Income tax on equity-settled transactions 6 – – – – – 1.0 1.0 – 1.0Additions to non-controlling interest 20 – – – – – – – 0.3 0.3At 31 December 2011 1.6 256.7 21.5 – 6.4 236.3 522.5 24.0 546.5
* After £244.1m for goodwill written off to retained earnings as at 1 January 2004 in relation to subsidiaries acquired prior to 31 December 1997. This figure has not been restated as permitted by IFRS 1.
Intertek Annual Report 2011 | 65

Consolidated Statement of Cash Flows For the year ended 31 December 2011
Notes2011
£m2010
£m
Cash flows from operating activitiesProfit for the year 2 151.1 139.0Adjustments for:Depreciation charge 8 56.4 51.1Amortisation of software 9 3.8 4.2Amortisation of acquisition intangibles 9 25.3 12.9Equity-settled transactions 17 9.5 7.4Net financing costs 14 21.0 16.6Income tax expense 6 61.9 50.9Loss on disposal of property, plant, equipment and software 0.1 0.2Operating profit before changes in working capital and operating provisions 329.1 282.3Change in inventories (2.1) (1.3)Change in trade and other receivables (34.8) (32.5)Change in trade and other payables 3.8 22.7Change in provisions (6.1) 1.4Special contributions into pension schemes 16 (1.2) (1.2)Cash generated from operations 288.7 271.4Interest and other finance expense paid (22.3) (15.4)Income taxes paid (53.4) (61.7)Net cash flows generated from operating activities 213.0 194.3
Cash flows from investing activitiesProceeds from sale of property, plant, equipment and software 1.6 0.8Interest received 2.0 0.9Acquisition of subsidiaries, net of cash acquired 10 (459.7) (41.9)Consideration paid in respect of prior year acquisitions 13 (2.6) (9.3)Purchase of non-controlling interest 20 (1.8) –Acquisition of property, plant, equipment and software 8,9 (80.6) (65.9)Net cash flows used in investing activities (541.1) (115.4)
Cash flows from financing activitiesProceeds from the issue of share capital 0.4 2.8Purchase of own shares 15 (7.8) (0.5)Drawdown of borrowings 692.8 355.2Repayment of borrowings (335.5) (310.8)Dividends paid to non-controlling interest 20 (10.4) (6.6)Equity dividends paid 15 (47.2) (42.5)Net cash flows used in financing activities 292.3 (2.4)
Net (decrease)/increase in cash and cash equivalents 14 (35.8) 76.5Cash and cash equivalents at 1 January 14 217.0 134.2Effect of exchange rate fluctuations on cash held 14 0.7 6.3Cash and cash equivalents at 31 December 14 181.9 217.0
The notes on pages 67 to 106 are an integral part of these consolidated financial statements.
Cash outflow relating to separately disclosed items was £26.1m for year ended 31 December 2011 (2010: £5.3m).
66 | www.intertek.com

Notes to the financial statements
1 Significant accounting policiesBasis of preparationAccounting policies applicable to more than one section of the financial statements are shown below. Where accounting policies relate to a specific note in the financial statements, they are set out within that note, to provide readers of the financial statements with a more useful layout to the financial information presented.
Statement of complianceIntertek Group plc is a company incorporated and domiciled in the UK.
The Group financial statements as at and for the year ended 31 December 2011 consolidate those of the Company and its subsidiaries (together referred to as the Group) and include the Group’s interest in associates. The Group financial statements have been prepared and approved by the Directors in accordance with International Financial Reporting Standards as adopted by the EU (IFRSs). The Parent Company financial statements present information about the Company as a separate entity and not about its Group. The Company has elected to prepare its Parent Company financial statements in accordance with UK GAAP; these are presented on pages 107 to 110.
Measurement conventionThe financial statements are prepared on the historical cost basis except as discussed in the relevant accounting policies.
Functional and presentation currencyThese consolidated financial statements are presented in sterling, which is the Company’s functional currency. All information presented in sterling has been rounded to the nearest £0.1m.
Changes in accounting policies The accounting policies set out in these financial statements have been applied consistently to all years presented.
A number of new standards, amendments to standards and interpretations are effective for annual periods beginning on or after 1 January 2011 but do not have a significant effect on the consolidated financial statements of the Group.
Going concernThe Board has reviewed forecasts, including forecasts adjusted for significantly worse economic conditions. The Board has also reviewed the Group’s funding requirements and has taken into consideration the issuance of US$265m notes in January 2012 and the available debt facilities. As a result of these reviews the Board remains satisfied with the Group’s funding and liquidity position and believe that the Group is well placed to manage its business risks successfully. In addition, on the basis of its forecasts, both base case and stressed, and available facilities, which are described in note 14, the Board has concluded that the going concern basis of preparation continues to be appropriate.
Basis of consolidationSubsidiariesSubsidiaries are those entities controlled by the Group. Control exists when the Group has the power, directly or indirectly, to govern the financial and operating policies of an entity so as to obtain benefits from its activities. In assessing control, potential voting rights that presently are exercisable or convertible are taken into account. The financial statements of subsidiaries are included in the consolidated financial statements from the date that control commences until the date that control ceases. The accounting policies of subsidiaries have been changed where necessary to align them with the policies adopted by the Group.
For purchases of non-controlling interest in subsidiaries, the difference between the cost of the additional interest in the subsidiary and the non-controlling interest’s share of the assets and liabilities reflected in the consolidated statement of financial position at the date of acquisition, is reflected directly in shareholders’ equity.
Transactions eliminated on consolidationIntra-group balances and transactions, and any unrealised gains and losses or income and expenses arising from intra-group transactions, are eliminated in preparing the consolidated financial statements. Unrealised losses are eliminated in the same way as unrealised gains, but only to the extent that there is no evidence of impairment.
Foreign currency Foreign currency transactionsTransactions in foreign currencies are translated to the respective functional currencies of Group entities at the foreign exchange rate ruling at the date of the transaction. Monetary assets and liabilities (for example cash, trade receivables, trade payables) denominated in foreign currencies at the reporting date are translated at the foreign exchange rate ruling at that date. Foreign exchange differences arising on translation are generally recognised in the income statement. Non-monetary assets and liabilities that are measured in terms of historical cost in a foreign currency are translated using the exchange rate at the date of the transaction.
For the policy on hedging of foreign currency transactions see note 14.
Intertek Annual Report 2011 | 67

Notes to the financial statements
1 Significant accounting policies (continued)Foreign operationsThe assets and liabilities of foreign operations, including goodwill and fair value adjustments arising on acquisition, are translated to sterling at foreign exchange rates ruling at the reporting date.
The income and expenses of foreign operations are translated into sterling at cumulative average rates of exchange during the year.
Exchange differences arising from the translation of foreign operations are taken directly to equity in the translation reserve. They are released to the income statement upon disposal. For the policy on net investment hedging see note 14.
The Group has taken advantage of relief available in IFRS 1, to deem the cumulative translation differences for all foreign operations to be zero at the date of transition to IFRSs on 1 January 2004.
The most significant currencies for the Group were translated at the following exchange rates:
Value of £1
Assets and liabilitiesActual rates
Income and expensesCumulative average rates
31 Dec 2011 31 Dec 2010 2011 2010
US dollar 1.55 1.55 1.60 1.55Euro 1.20 1.17 1.15 1.17Chinese renminbi 9.77 10.26 10.35 10.47Hong Kong dollar 12.04 12.05 12.47 12.00
Use of judgements and estimatesThe preparation of financial statements in conformity with IFRSs requires management to make judgements and estimates that affect the application of accounting policies and the reported amounts of assets, liabilities, income and expenses. Actual results may differ from these estimates. Estimates and underlying assumptions are reviewed on an ongoing basis. Revisions to accounting estimates are recognised in the year in which the estimates are revised and in any future years affected.
JudgementsIn applying the Group’s accounting policies, management has applied judgement in the following areas that have a significant impact on the amounts recognised in the financial statements.
Basis of consolidation Judgement is applied when determining if the Group ‘controls’ a subsidiary or associate. In assessing control, the Group considers whether it has the ability to control on a legal or contractual basis rather than whether that control is actually exercised; see note 1 above.
Intangible assets When the Group makes an acquisition, management determine whether any intangible assets should be recognised separately from goodwill; see note 9.
Income TaxThe tax on profits is determined according to complex tax laws and regulations. Where the effect of these laws and regulations is unclear, judgements are used in determining the liability for the tax to be paid; see note 6.
Deferred tax Deferred tax assets and liabilities require management judgement in determining the amounts to be recognised, with consideration given to the timing and level of future taxable income; see note 6.
EstimatesDiscussed below are key assumptions concerning the future, and other key sources of estimation at the reporting date, that have a risk of causing a material adjustment to the carrying amount of assets and liabilities within the next financial year.
Impairment of goodwill The Group determines on an annual basis whether goodwill is impaired. This requires an estimation of the future cash flows of the cash generating units to which the goodwill is allocated; see note 9.
ClaimsIn making provision for claims, management bases its estimate on the circumstances relating to each specific event, internal and external legal advice, knowledge of the industries and markets, prevailing commercial terms and legal precedents; see note 13.
Contingent considerationWhen the Group acquires businesses, the total consideration may consist of an amount paid on completion plus further amounts payable on agreed post completion dates. These further amounts are contingent on the acquired business meeting agreed performance targets. At the date of acquisition, the Group reviews the profit and cash forecasts for the acquired business and estimates the amount of contingent consideration that is likely to be due; see note 13.
68 | www.intertek.com
Notes to the financial statements
1 Significant accounting policies (continued)Employee post-retirement benefit obligations For material defined benefit plans, the actuarial valuation includes assumptions such as discount rates, return on assets, salary progression and mortality rates; see note 16.
Recoverability of trade receivables Trade receivables are reflected net of an estimated provision for impairment losses. This provision considers the past payment history and creditworthiness of each account and the length of time that the debt has remained unpaid; see note 11.
Accounting policies relating to a specific note in the financial statements are set out within that note as follows:
NoteRevenue 2Separately disclosed items 3Taxation 6Property, plant and equipment 8Goodwill and other intangible assets 9Trade and other receivables 11Trade and other payables 12Provisions 13Borrowings and financial instruments 14Capital and reserves 15Employee benefits 16Share schemes 17Non-controlling interest 20
2 Operating segments and presentation of resultsAccounting policyRevenueRevenue represents the total amount receivable for services rendered, excluding sales related taxes and intra group transactions.
Revenue from services rendered is recognised in the income statement when the relevant service is completed, usually when the report of findings is issued.
The Group records transactions as sales on the basis of value of work done, with the corresponding amount being included in trade debtors if the customer has been invoiced or in accrued income if billing has yet to be completed. Expenses are recharged to clients where permitted by the contract.
Operating segmentsThe Group is organised into five divisions, each of which offer services to different industries and are managed separately: Commodities; Industry & Assurance; Consumer Goods; Commercial & Electrical and Chemicals & Pharmaceuticals. The costs of the corporate head office and other costs which are not controlled by the operating divisions are allocated to these divisions.
The divisions noted above are the operating segments that are reported to the Board of Directors, the chief operating decision maker, and are the Group’s reportable segments. Inter-segment pricing is determined on an arm’s length basis. There is no significant seasonality in the Group’s operations.
Segment results include items directly attributable to a segment as well as those that can be allocated on a reasonable basis. The performance of the segments is assessed based on adjusted operating profit which is before separately disclosed items. Unallocated items include group-wide projects that do not sit in any one division. A reconciliation to operating profit by division, and Group profit for the year is included overleaf.
Principal activities are as follows:
Commodities – provides independent cargo inspection, analytical assessment, calibration and related research and technical services to the world’s petroleum, mining, minerals and biofuels industries. The division also provides services to governments and regulatory bodies to support trade activities that help the flow of goods across borders.
Industry & Assurance – using in-depth knowledge of the oil, gas, nuclear, power, renewable energy, construction, food, chemical and agricultural industries, the division provides a diverse range of services to help customers meet global quality standards. These include asset integrity management, exploration and production support, consulting, training and third-party management systems auditing. The division also provides certification services, second-party supplier auditing, sustainability data verification and process performance analysis.
Intertek Annual Report 2011 | 69

Notes to the financial statements
2 Operating segments and presentation of results (continued)Consumer Goods – the division is a market leading provider of services to the textiles, toys, footwear, hardlines, food and retail industries. As partner to retailers, manufacturers and distributors it offers expertise on issues ranging from restricted hazardous substance and sustainability, to supply chain security and legislation relating to environmental, ethical and trade security issues. Services include testing, inspection, auditing, advisory services, quality assurance and hazardous substance testing.
Commercial & Electrical – the global network of accredited facilities provides manufacturers and retailers with the most comprehensive scope of safety, performance and quality testing and certification services. The division supports customers in a wide range of industries including home appliances, consumer electronics, lighting, medical, building, industrial and HVAC/R (heating, ventilation, air conditioning and refrigeration), ICT, renewable energy and automotive.
Chemicals & Pharmaceuticals – serving a wide range of industries including chemical, pharmaceutical, oil and gas, and automotive and aerospace, the division offers advanced laboratory measurement and expert consultancy related technical support services and sustainability solutions. It has an established track record of success in laboratory outsourcing with many large, internationally recognised companies and the division’s world leading technical experts also support internal technical development.
As described in the Annual Report for 2010, from 1 January 2011 the Group’s operational structure was reorganised to improve the alignment of business lines with those of the Group’s customers. Certain divisions were also renamed to describe better their core activities. The results for the 12 months to 31 December 2011 are reported in the new structure and all prior period comparative figures have been restated to show a like-for-like comparison.
The results of these divisions for the year ending 31 December 2011 are shown below:
Year ended 31 December 2011 Revenue
from external customers
£m
Inter-segment revenue
£m
Total revenue
£m
Depreciation and software amortisation*
£m
Adjusted operating
profit£m
Separately disclosed
items £m
Operating profit
£m
Commodities 530.2 2.7 532.9 (22.0) 67.0 (2.7) 64.3Industry & Assurance 468.6 2.0 470.6 (5.4) 50.9 (28.9) 22.0Consumer Goods 315.7 1.2 316.9 (11.7) 106.3 (0.9) 105.4Commercial & Electrical 291.0 4.5 295.5 (12.6) 44.1 (2.7) 41.4Chemicals & Pharmaceuticals 143.9 1.9 145.8 (5.6) 12.8 (3.6) 9.2Eliminations – (12.3) (12.3) – – – –Total 1,749.4 – 1,749.4 (57.3) 281.1 (38.8) 242.3Unallocated separately disclosed items – (8.3) (8.3)Group operating profit 281.1 (47.1) 234.0Net financing costs (21.0) – (21.0)Profit before income tax 260.1 (47.1) 213.0Income tax expense (73.3) 11.4 (61.9)Profit for the year 186.8 (35.7) 151.1
* Depreciation and software amortisation of £60.2m (2010: £55.3m) includes unallocated charges of £2.9m (2010: £1.7m).
Year ended 31 December 2010 (as restated)Revenue
from external customers
£m
Inter-segment revenue
£m
Total revenue
£m
Depreciation and software amortisation
£m
Adjusted operating
profit£m
Separately disclosed
items £m
Operating profit
£m
Commodities 473.2 3.0 476.2 (21.9) 54.5 (5.6) 48.9Industry & Assurance 191.2 0.8 192.0 (1.8) 16.6 (3.2) 13.4Consumer Goods 303.9 1.3 305.2 (13.2) 106.2 (0.4) 105.8Commercial & Electrical 269.2 3.4 272.6 (11.3) 38.4 (3.0) 35.4Chemicals & Pharmaceuticals 136.7 1.7 138.4 (5.4) 11.8 (5.2) 6.6Eliminations – (10.2) (10.2) – – – –Total 1,374.2 – 1,374.2 (53.6) 227.5 (17.4) 210.1Unallocated separately disclosed items – (3.6) (3.6)Group operating profit 227.5 (21.0) 206.5Net financing costs (15.6) (1.0) (16.6)Profit before income tax 211.9 (22.0) 189.9Income tax expense (56.6) 5.7 (50.9)Profit for the year 155.3 (16.3) 139.0
70 | www.intertek.com

Notes to the financial statements
2 Operating segments and presentation of results (continued)Year ended 31 December 2010 (as previously reported)
Revenue from external
customers£m
Inter-segment revenue
£m
Total revenue
£m
Depreciation and software amortisation
£m
Adjusted operating
profit£m
Separately disclosed
items £m
Operating profit
£m
Consumer Goods 341.5 1.3 342.8 (13.3) 109.2 (0.7) 108.5Commercial & Electrical 269.2 3.4 272.6 (11.3) 38.2 (3.0) 35.2Oil, Chemical & Agri 452.7 2.8 455.5 (16.1) 51.0 (3.9) 47.1Analytical Services 151.5 1.7 153.2 (6.1) 14.5 (5.1) 9.4Industrial Services 93.8 0.8 94.6 (0.8) 7.3 (3.3) 4.0Minerals 65.5 0.2 65.7 (6.0) 7.3 (1.4) 5.9Eliminations – (10.2) (10.2) – – – –Total 1,374.2 – 1,374.2 (53.6) 227.5 (17.4) 210.1Unallocated separately disclosed items – (3.6) (3.6)Group operating profit 227.5 (21.0) 206.5Net financing costs (15.6) (1.0) (16.6)Profit before income tax 211.9 (22.0) 189.9Income tax expense (56.6) 5.7 (50.9)Profit for the year 155.3 (16.3) 139.0
Geographic segments Although the Group is managed through a divisional structure, which operates on a global basis, under the requirements of IFRS 8 the Group must disclose any specific countries that are important to the Group’s performance. The Group considers the following to be the material countries in which it operates; Australia, China (including Hong Kong), the United Kingdom and the United States.
In presenting information on the basis of geographic segments, segment revenue is based on the location of the entity generating that revenue. Segment assets are based on the geographical location of the assets.
Revenue from external customers Non-current assets
2011£m
2010£m
2011£m
2010£m
China (including Hong Kong) 317.3 293.6 51.0 37.3Australia 85.3 60.3 60.1 63.2Other 223.9 166.2 25.6 44.9Total Asia Pacific 626.5 520.1 136.7 145.4United States 438.8 358.0 398.4 220.5Other 130.8 99.5 12.4 21.4Total Americas 569.6 457.5 410.8 241.9United Kingdom 153.0 122.0 325.8 104.1Other 400.3 274.6 198.9 97.3Total Europe, Middle East and Africa 553.3 396.6 524.7 201.4Unallocated – – 27.6 26.4Total 1,749.4 1,374.2 1,099.8 615.1
Major customersNo revenue from any individual customer exceeded 10% of total Group revenue in 2010 or 2011.
Intertek Annual Report 2011 | 71

Notes to the financial statements
3 Separately disclosed itemsAccounting policyAdjusted resultsIn order to present the performance of the Group in a clear, consistent and comparable format, certain items are disclosed separately on the face of the income statement.
Separately disclosed items are items which by their nature or size, in the opinion of the Directors, should be excluded from the adjusted result to provide readers with a clear and consistent view of the business performance of the Group and its operating divisions.
When applicable, these items include amortisation of acquisition intangibles, impairment of goodwill and other assets, the profit or loss on disposals of businesses or other significant fixed assets, costs of acquiring and integrating acquisitions, the cost of any fundamental restructuring of a business, material claims and settlements, significant recycling of amounts from equity to the income statement and unrealised gains/losses on financial assets/liabilities.
Separately disclosed itemsThe separately disclosed items are described in the table below:
2011£m
2010£m
Operating costs:Amortisation of acquisition intangibles (a) (25.3) (12.9)Acquisition and integration costs (b) (14.1) (5.3)Project costs (c) (7.7) –Claims and settlements (d) – (2.8)Total operating costs (47.1) (21.0)
Fair value of interest rate swaps recycled from equity (note 14) – (1.0)Total costs (47.1) (22.0)
Income tax credit on separately disclosed items 11.4 5.7Total (35.7) (16.3)
(a) Of the amortisation of acquired intangibles in the current year, £13.2m relates to the customer contracts and customer relationships acquired with the purchase of Moody International Limited (‘Moody’).
(b) Acquisition and integration costs comprise £9.0m (2010: £4.8m) for costs in respect of acquisitions and £5.1m (2010: £0.5m) in respect of integration costs.
(c) Project costs relate to the Group’s Business Process Outsourcing initiative.
(d) In 2010 the £2.8m settlement related to a claim from a group of employees in the USA in the Commodities division.
72 | www.intertek.com
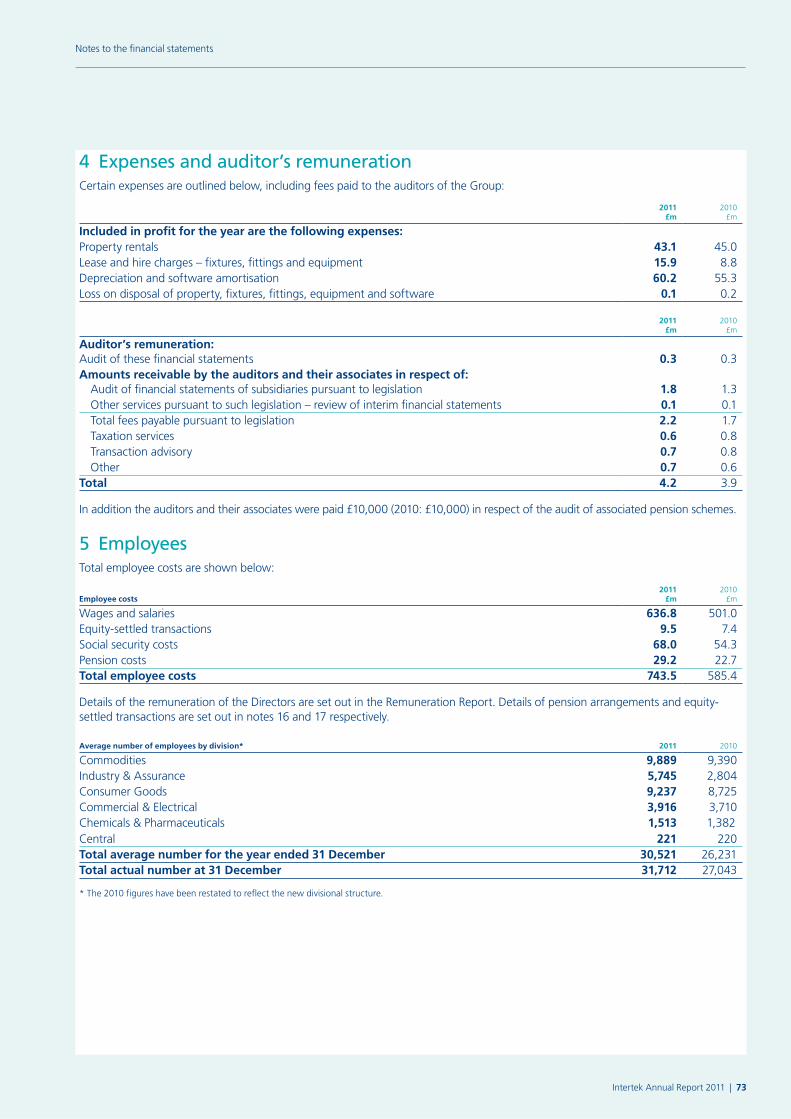
4 Expenses and auditor’s remunerationCertain expenses are outlined below, including fees paid to the auditors of the Group:
2011£m
2010£m
Included in profit for the year are the following expenses:Property rentals 43.1 45.0Lease and hire charges – fixtures, fittings and equipment 15.9 8.8Depreciation and software amortisation 60.2 55.3Loss on disposal of property, fixtures, fittings, equipment and software 0.1 0.2
2011£m
2010£m
Auditor’s remuneration: Audit of these financial statements 0.3 0.3Amounts receivable by the auditors and their associates in respect of:
Audit of financial statements of subsidiaries pursuant to legislation 1.8 1.3Other services pursuant to such legislation – review of interim financial statements 0.1 0.1Total fees payable pursuant to legislation 2.2 1.7Taxation services 0.6 0.8Transaction advisory 0.7 0.8Other 0.7 0.6
Total 4.2 3.9
In addition the auditors and their associates were paid £10,000 (2010: £10,000) in respect of the audit of associated pension schemes.
5 Employees Total employee costs are shown below:
Employee costs 2011
£m2010
£m
Wages and salaries 636.8 501.0Equity-settled transactions 9.5 7.4Social security costs 68.0 54.3Pension costs 29.2 22.7Total employee costs 743.5 585.4
Details of the remuneration of the Directors are set out in the Remuneration Report. Details of pension arrangements and equity-settled transactions are set out in notes 16 and 17 respectively.
Average number of employees by division* 2011 2010
Commodities 9,889 9,390Industry & Assurance 5,745 2,804Consumer Goods 9,237 8,725Commercial & Electrical 3,916 3,710Chemicals & Pharmaceuticals 1,513 1,382Central 221 220Total average number for the year ended 31 December 30,521 26,231Total actual number at 31 December 31,712 27,043
* The 2010 figures have been restated to reflect the new divisional structure.
Intertek Annual Report 2011 | 73
Notes to the financial statements

Notes to the financial statements
6 Taxation Accounting policyIncome tax for the year comprises current and deferred tax. Income tax is recognised in the same primary statement as the accounting transaction to which it relates.
Current taxCurrent tax is the expected tax payable on the taxable income for the year, using tax rates enacted or substantively enacted at the reporting date, and any adjustment to tax payable in respect of previous years.
The Group recognises liabilities for anticipated tax issues based on estimates of the additional taxes that are likely to become due. Amounts are accrued based on management’s interpretation of specific tax law and the likelihood of settlement. Where the outcome of discussions with tax authorities is different from the amount initially recorded, this difference will impact the tax provisions in the period the determination is made.
Deferred taxDeferred tax is provided using the balance sheet liability method, providing for temporary differences between the carrying amount of assets and liabilities for financial reporting purposes and the amounts used for taxation purposes, except for:
initial recognition of goodwill; the initial recognition of assets or liabilities in a transaction that is not a business combination and that affects neither accounting
nor taxable profit; and differences relating to investments in subsidiaries, branches, associates and interest in joint ventures, the reversal of which is under
the control of the Group and where it is probable that the difference will not reverse in the foreseeable future.
The amount of deferred tax provided is based on the expected manner of realisation or settlement of the carrying amount of assets and liabilities, using tax rates that have been enacted or substantively enacted at the balance sheet date when the asset is realised or the liability is settled. Deferred tax assets and liabilities are offset if there is a legally enforceable right to offset current tax liabilities and assets and they relate to income taxes levied by the same tax authority on the same taxable entity, or on different taxable entities which intend to settle current tax liabilities and assets on a net basis or their tax assets and liabilities will be realised simultaneously.
A deferred tax asset is recognised only to the extent that it is probable that future taxable profits will be available against which the temporary difference can be utilised. The carrying amount of deferred tax assets is reviewed at each balance sheet date and reduced to the extent that it is no longer probable that sufficient taxable profits will be available to allow all or part of the deferred tax asset to be utilised.
Any additional income taxes that arise from the distribution of dividends are recognised at the same time as the liability to pay the related dividend.
Tax expenseIntertek is a global business and operates across many different tax jurisdictions. Income and profits are earned and taxed in the individual countries in which they occur.
The income tax expense for the total profit before tax for the year end 31 December 2011 is £61.9m (2010: £50.9m). The Group’s consolidated effective tax rate for the year ended 31 December 2011 is 29.1% (2010: 26.8%).
The income tax expense for the adjusted profit before tax for the year ended 31 December 2011 is £73.3m (2010: £56.6m). The Group’s adjusted consolidated effective tax rate for the 12 months ended 31 December 2011 is 28.2% (2010: 26.7%).
Differences between the consolidated effective tax rate of 29.1% and the notional statutory UK rate of 26.5% include, but are not limited to; the mix of profits, the effect of tax rates in foreign jurisdictions, non deductible expenses, the effect of utilised tax losses and under/over provisions in previous periods.
74 | www.intertek.com
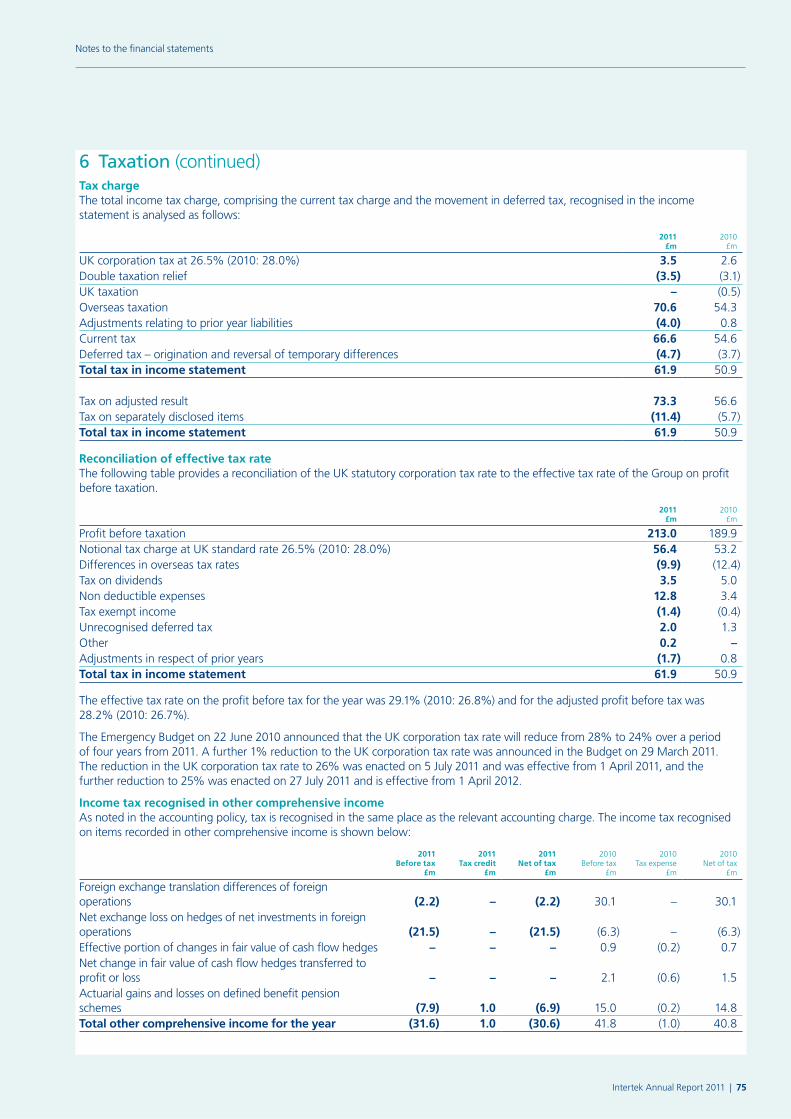
6 Taxation (continued)Tax chargeThe total income tax charge, comprising the current tax charge and the movement in deferred tax, recognised in the income statement is analysed as follows:
2011£m
2010£m
UK corporation tax at 26.5% (2010: 28.0%) 3.5 2.6Double taxation relief (3.5) (3.1)UK taxation – (0.5)Overseas taxation 70.6 54.3Adjustments relating to prior year liabilities (4.0) 0.8Current tax 66.6 54.6Deferred tax – origination and reversal of temporary differences (4.7) (3.7)Total tax in income statement 61.9 50.9
Tax on adjusted result 73.3 56.6Tax on separately disclosed items (11.4) (5.7)Total tax in income statement 61.9 50.9
Reconciliation of effective tax rateThe following table provides a reconciliation of the UK statutory corporation tax rate to the effective tax rate of the Group on profit before taxation.
2011£m
2010£m
Profit before taxation 213.0 189.9Notional tax charge at UK standard rate 26.5% (2010: 28.0%) 56.4 53.2Differences in overseas tax rates (9.9) (12.4)Tax on dividends 3.5 5.0Non deductible expenses 12.8 3.4Tax exempt income (1.4) (0.4)Unrecognised deferred tax 2.0 1.3Other 0.2 –Adjustments in respect of prior years (1.7) 0.8Total tax in income statement 61.9 50.9
The effective tax rate on the profit before tax for the year was 29.1% (2010: 26.8%) and for the adjusted profit before tax was 28.2% (2010: 26.7%).
The Emergency Budget on 22 June 2010 announced that the UK corporation tax rate will reduce from 28% to 24% over a period of four years from 2011. A further 1% reduction to the UK corporation tax rate was announced in the Budget on 29 March 2011. The reduction in the UK corporation tax rate to 26% was enacted on 5 July 2011 and was effective from 1 April 2011, and the further reduction to 25% was enacted on 27 July 2011 and is effective from 1 April 2012.
Income tax recognised in other comprehensive incomeAs noted in the accounting policy, tax is recognised in the same place as the relevant accounting charge. The income tax recognised on items recorded in other comprehensive income is shown below:
2011Before tax
£m
2011Tax credit
£m
2011Net of tax
£m
2010Before tax
£m
2010Tax expense
£m
2010Net of tax
£m
Foreign exchange translation differences of foreign operations (2.2) – (2.2) 30.1 – 30.1Net exchange loss on hedges of net investments in foreign operations (21.5) – (21.5) (6.3) – (6.3)Effective portion of changes in fair value of cash flow hedges – – – 0.9 (0.2) 0.7Net change in fair value of cash flow hedges transferred to profit or loss – – – 2.1 (0.6) 1.5Actuarial gains and losses on defined benefit pension schemes (7.9) 1.0 (6.9) 15.0 (0.2) 14.8Total other comprehensive income for the year (31.6) 1.0 (30.6) 41.8 (1.0) 40.8
Intertek Annual Report 2011 | 75
Notes to the financial statements
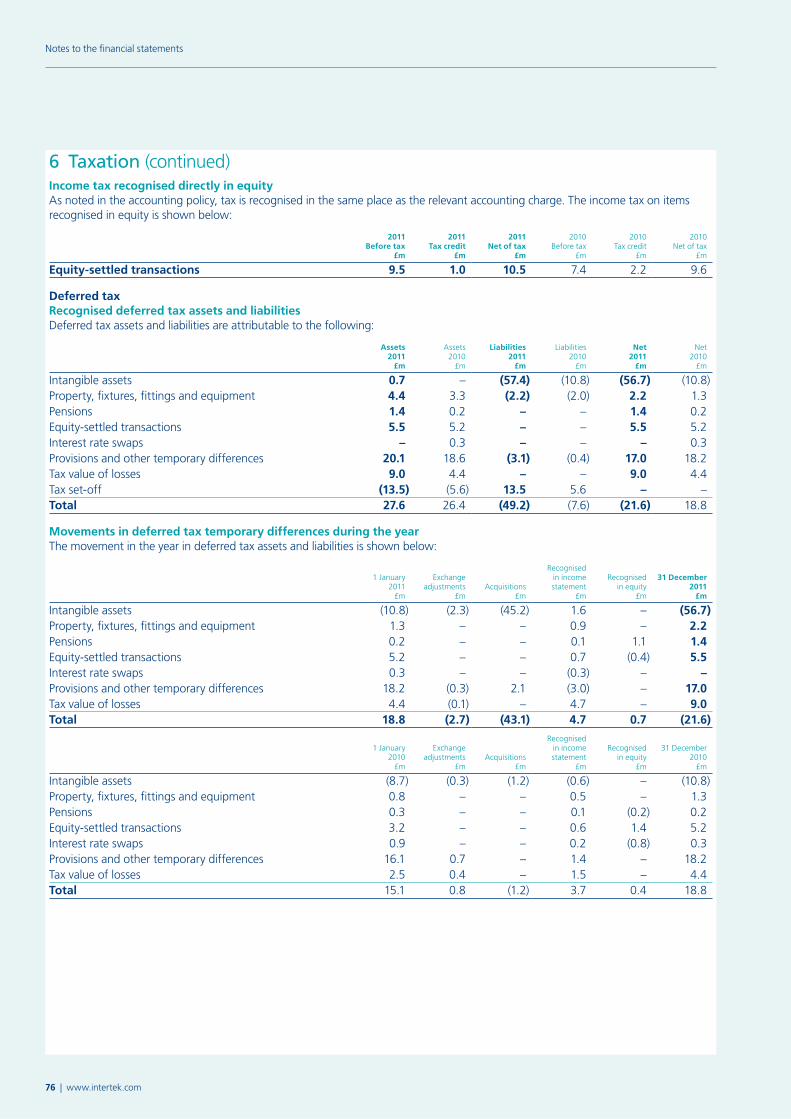
Notes to the financial statements
6 Taxation (continued)Income tax recognised directly in equityAs noted in the accounting policy, tax is recognised in the same place as the relevant accounting charge. The income tax on items recognised in equity is shown below:
2011Before tax
£m
2011Tax credit
£m
2011Net of tax
£m
2010Before tax
£m
2010Tax credit
£m
2010Net of tax
£m
Equity-settled transactions 9.5 1.0 10.5 7.4 2.2 9.6
Deferred taxRecognised deferred tax assets and liabilitiesDeferred tax assets and liabilities are attributable to the following:
Assets2011
£m
Assets2010
£m
Liabilities 2011
£m
Liabilities2010
£m
Net2011
£m
Net2010
£m
Intangible assets 0.7 – (57.4) (10.8) (56.7) (10.8)Property, fixtures, fittings and equipment 4.4 3.3 (2.2) (2.0) 2.2 1.3Pensions 1.4 0.2 – – 1.4 0.2Equity-settled transactions 5.5 5.2 – – 5.5 5.2Interest rate swaps – 0.3 – – – 0.3Provisions and other temporary differences 20.1 18.6 (3.1) (0.4) 17.0 18.2Tax value of losses 9.0 4.4 – – 9.0 4.4Tax set-off (13.5) (5.6) 13.5 5.6 – –Total 27.6 26.4 (49.2) (7.6) (21.6) 18.8
Movements in deferred tax temporary differences during the yearThe movement in the year in deferred tax assets and liabilities is shown below:
1 January 2011
£m
Exchange adjustments
£mAcquisitions
£m
Recognised in income
statement£m
Recognised in equity
£m
31 December 2011
£m
Intangible assets (10.8) (2.3) (45.2) 1.6 – (56.7)Property, fixtures, fittings and equipment 1.3 – – 0.9 – 2.2Pensions 0.2 – – 0.1 1.1 1.4Equity-settled transactions 5.2 – – 0.7 (0.4) 5.5Interest rate swaps 0.3 – – (0.3) – –Provisions and other temporary differences 18.2 (0.3) 2.1 (3.0) – 17.0Tax value of losses 4.4 (0.1) – 4.7 – 9.0Total 18.8 (2.7) (43.1) 4.7 0.7 (21.6)
1 January 2010
£m
Exchange adjustments
£mAcquisitions
£m
Recognised in income
statement£m
Recognised in equity
£m
31 December 2010
£m
Intangible assets (8.7) (0.3) (1.2) (0.6) – (10.8)Property, fixtures, fittings and equipment 0.8 – – 0.5 – 1.3Pensions 0.3 – – 0.1 (0.2) 0.2Equity-settled transactions 3.2 – – 0.6 1.4 5.2Interest rate swaps 0.9 – – 0.2 (0.8) 0.3Provisions and other temporary differences 16.1 0.7 – 1.4 – 18.2Tax value of losses 2.5 0.4 – 1.5 – 4.4Total 15.1 0.8 (1.2) 3.7 0.4 18.8
76 | www.intertek.com
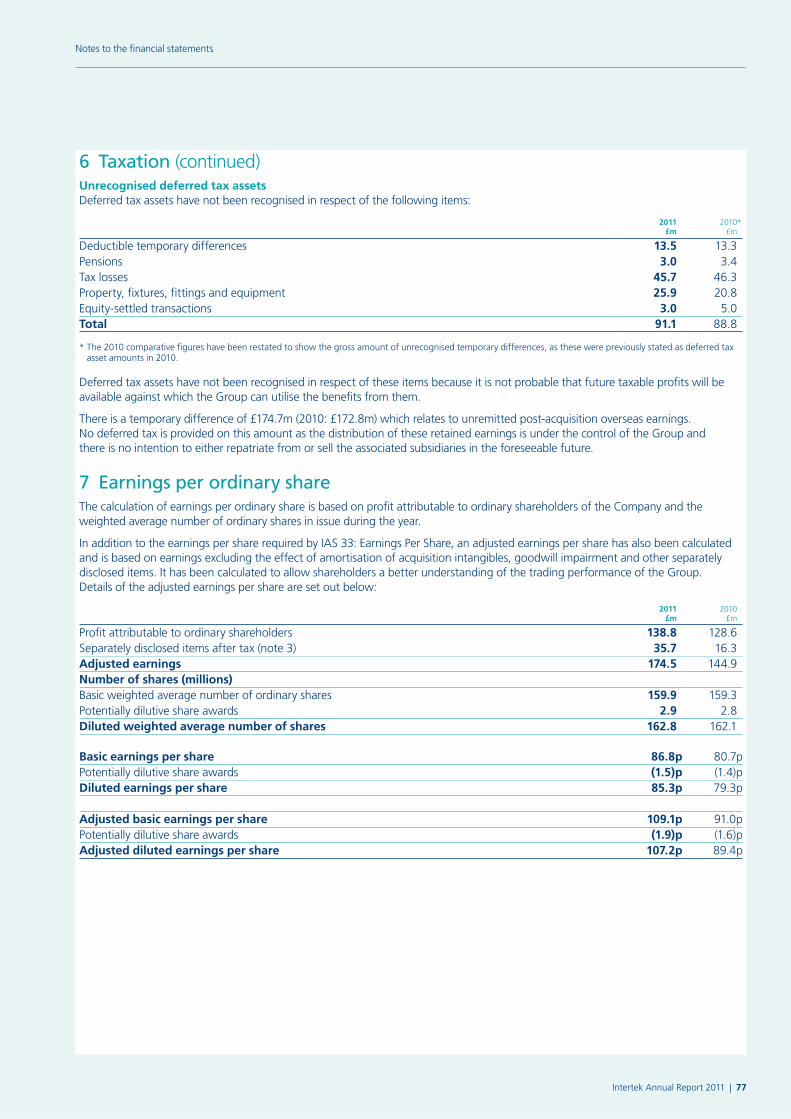
6 Taxation (continued)Unrecognised deferred tax assets Deferred tax assets have not been recognised in respect of the following items:
2011£m
2010*£m
Deductible temporary differences 13.5 13.3Pensions 3.0 3.4Tax losses 45.7 46.3Property, fixtures, fittings and equipment 25.9 20.8Equity-settled transactions 3.0 5.0Total 91.1 88.8
* The 2010 comparative figures have been restated to show the gross amount of unrecognised temporary differences, as these were previously stated as deferred tax asset amounts in 2010.
Deferred tax assets have not been recognised in respect of these items because it is not probable that future taxable profits will be available against which the Group can utilise the benefits from them.
There is a temporary difference of £174.7m (2010: £172.8m) which relates to unremitted post-acquisition overseas earnings. No deferred tax is provided on this amount as the distribution of these retained earnings is under the control of the Group and there is no intention to either repatriate from or sell the associated subsidiaries in the foreseeable future.
7 Earnings per ordinary shareThe calculation of earnings per ordinary share is based on profit attributable to ordinary shareholders of the Company and the weighted average number of ordinary shares in issue during the year.
In addition to the earnings per share required by IAS 33: Earnings Per Share, an adjusted earnings per share has also been calculated and is based on earnings excluding the effect of amortisation of acquisition intangibles, goodwill impairment and other separately disclosed items. It has been calculated to allow shareholders a better understanding of the trading performance of the Group. Details of the adjusted earnings per share are set out below:
2011£m
2010£m
Profit attributable to ordinary shareholders 138.8 128.6Separately disclosed items after tax (note 3) 35.7 16.3Adjusted earnings 174.5 144.9Number of shares (millions)Basic weighted average number of ordinary shares 159.9 159.3Potentially dilutive share awards 2.9 2.8Diluted weighted average number of shares 162.8 162.1
Basic earnings per share 86.8p 80.7pPotentially dilutive share awards (1.5)p (1.4)pDiluted earnings per share 85.3p 79.3p
Adjusted basic earnings per share 109.1p 91.0pPotentially dilutive share awards (1.9)p (1.6)pAdjusted diluted earnings per share 107.2p 89.4p
Intertek Annual Report 2011 | 77
Notes to the financial statements

Notes to the financial statements
8 Property, plant and equipmentAccounting policyProperty, plant and equipmentOwned assetsItems of property, plant and equipment are measured at cost less accumulated depreciation and accumulated impairment losses.
Cost includes expenditure that is directly attributable to the acquisition of the asset.
Gains and losses on disposal of items of property, plant and equipment are determined by comparing the proceeds from disposal with the carrying amount of property, plant and equipment and are recognised in the income statement.
Leased assetsLeases in which the Group assumes substantially all the risks and rewards of ownership are classified as finance leases. Where land and buildings are held under finance leases, the accounting treatment of the land is considered separately from that of the buildings. Leased assets acquired by way of finance leases are stated at an amount equal to the lower of their fair value and the present value of the minimum lease payments at inception of the lease, less accumulated depreciation and impairment losses.
Other leases are operating leases. These leased assets are not recognised in the Group’s statement of financial position.
DepreciationDepreciation is charged to the income statement on a straight-line basis over the estimated useful lives of items of property, plant and equipment. Leased assets are depreciated over the shorter of the lease term and their useful lives. Land is not depreciated.
The estimated useful lives are as follows:Freehold buildings and long leasehold buildings 50 yearsShort leasehold buildings Term of lease Fixtures, fittings and equipment 3 – 10 years
Depreciation methods, residual values and the useful lives of all assets are re-assessed at each reporting date.
ImpairmentNon-financial assetsThe carrying amounts of the Group’s non-financial assets, other than inventories and deferred tax assets are reviewed at each reporting date to determine whether there is any indication of impairment. If any such indication exists, then the asset’s recoverable amount is estimated to determine the level of any impairment.
78 | www.intertek.com

8 Property, plant and equipment (continued)Property, plant & equipmentThe property, plant and equipment employed by the business is analysed below:
Land andbuildings
£m
Fixtures,fittings
andequipment
£mTotal
£m
CostAt 1 January 2010 48.3 407.4 455.7Exchange adjustments 2.5 20.9 23.4Additions 3.6 56.6 60.2Disposals (0.4) (10.3) (10.7)Businesses acquired (note 10) 1.2 2.5 3.7At 31 December 2010 55.2 477.1 532.3DepreciationAt 1 January 2010 7.4 227.4 234.8Exchange adjustments 0.4 12.6 13.0Charge for the year 1.7 49.4 51.1Disposals (0.4) (9.3) (9.7)At 31 December 2010 9.1 280.1 289.2Net book value at 31 December 2010 46.1 197.0 243.1
CostAt 1 January 2011 55.2 477.1 532.3Exchange adjustments (0.3) (3.7) (4.0)Additions 1.5 73.6 75.1Disposals – (7.8) (7.8)Businesses acquired (note 10) 1.3 4.6 5.9At 31 December 2011 57.7 543.8 601.5DepreciationAt 1 January 2011 9.1 280.1 289.2Exchange adjustments (0.1) (2.9) (3.0)Charge for the year 2.1 54.3 56.4Disposals – (6.1) (6.1)At 31 December 2011 11.1 325.4 336.5Net book value at 31 December 2011 46.6 218.4 265.0
Fixtures, fittings and equipment include assets in the course of construction of £10.7m at 31 December 2011, (2010: £5.6m), mainly comprising of laboratories under construction. These assets will not be depreciated until they are available for use.
The net book value of land and buildings comprised:
2011£m
2010£m
Freehold 43.3 42.7Long leasehold 0.6 0.6Short leasehold 2.7 2.8Total 46.6 46.1
Intertek Annual Report 2011 | 79
Notes to the financial statements

Notes to the financial statements
8 Property, plant and equipment (continued)CommitmentsOperating lease paymentsPayments made under operating leases are recognised in the income statement on a straight-line basis over the term of the lease. Lease incentives received are recognised in the income statement as an integral part of the total lease expense over the term of the lease.
At 31 December, the Group had future unprovided commitments under non-cancellable operating leases due as follows:
2011Land and
buildings£m
2011Other
£m
2011Total
£m
2010Land and buildings
£m
2010Other
£m
2010Total
£m
Within one year 42.1 6.0 48.1 37.9 6.3 44.2In the second to fifth years inclusive 78.5 6.3 84.8 59.1 4.4 63.5Over five years 40.1 – 40.1 41.2 0.5 41.7Total 160.7 12.3 173.0 138.2 11.2 149.4
The Group leases various laboratories, testing and inspection sites, administrative offices and equipment under lease agreements which have varying terms, escalation clauses and renewal rights.
Contracts for capital expenditure which are not provided in the financial statements amounted to £11.2m (2010: £5.6m).
9 Goodwill and other intangible assetsAccounting policyGoodwillGoodwill arises on the acquisition of businesses. Goodwill represents the difference between the cost of acquisition and the Group’s interest in the fair value of the identifiable assets, liabilities and contingent liabilities acquired. All business combinations are accounted for by applying the acquisition method.
Goodwill is stated at cost less any accumulated impairment losses. Goodwill is allocated to cash generating units (CGUs) and is not amortised but is tested annually for impairment.
Acquisitions on or after 1 January 2010From 1 January 2010, the Group has applied IFRS 3 ‘Business Combinations (revised 2008)’. The change in accounting policy has been applied prospectively.
Business combinations are accounted for using the acquisition method at the acquisition date, which is the date on which control is obtained.
For acquisitions on or after 1 January 2010, the Group measures goodwill as the fair value of the consideration transferred (including the fair value of any previously-held equity interest in the acquiree) and the recognised amount of any non-controlling interest in the acquiree, less the net recognised amount (generally fair value) of the identifiable assets acquired and liabilities assumed, all measured as of the acquisition date.
Costs related to the acquisition, other than those associated with the issue of debt or equity securities, are expensed as incurred. Costs relating to acquisitions are shown in separately disclosed items.
Any contingent consideration payable is recognised at fair value at the acquisition date with subsequent changes recognised in profit or loss.
If at the reporting date the fair values of the acquiree’s identifiable assets, liabilities and contingent liabilities can only be established provisionally, then these values are used. Adjustments to the fair values can be made within 12 months of the acquisition date and are taken as adjustments to goodwill.
Acquisitions between 1 January 2004 and 31 December 2009For acquisitions between 1 January 2004 and 31 December 2009, goodwill represents the excess of the cost of the acquisition over the Group’s interest in the recognised amount (generally fair value) of the identifiable assets, liabilities and contingent liabilities of the acquiree. When the excess was negative, a bargain purchase gain was recognised immediately in profit or loss.
Transaction costs, other than those associated with the issue of debt or equity securities, that the Group incurred in connection with business combinations were capitalised as part of the cost of the acquisition.
The Group has taken advantage of the exemption permitted by IFRS 1 and has not restated goodwill on acquisitions prior to 1 January 2004, the date of transition to IFRS. In respect of acquisitions prior to 1 January 2004, goodwill represents the amount recognised under the Group’s previous accounting framework.
80 | www.intertek.com

9 Goodwill and other intangible assets (continued)Other intangible assetsWhen the Group makes an acquisition, management review the business and assets acquired to determine whether any intangible assets should be recognised separately from goodwill. If, based on management’s judgement, such an asset is identified, then it is valued by discounting the probable future cash flows expected to be generated by the asset, over the estimated life of the asset. Where there is uncertainty over the amount of economic benefit and the useful life, this is factored into the calculation.
Intangible assets arising on acquisitions and computer software are stated at cost less accumulated amortisation and accumulated impairment losses. Identifiable intangibles are those which can be sold separately or which arise from legal rights regardless of whether those rights are separable, and which have finite useful lives.
Amortisation is charged to the income statement on a straight-line basis over the estimated useful lives. The estimated useful lives are as follows:
Computer software Up to 7 yearsCustomer relationships Up to 10 yearsKnow-how Up to 5 yearsLicences Contractual lifeCovenants not to compete Contractual life
ImpairmentGoodwill is not subject to amortisation and is tested annually for impairment and when circumstances indicate that the carrying value may be impaired.
Other intangible assets are subject to amortisation and are reviewed for impairment whenever events or changes in circumstances indicate that the amount carried in the statement of financial position is less than its recoverable amount.
Any impairment is recognised in the income statement. Impairment is determined for goodwill by assessing the recoverable amount of each asset or cash generating unit (or group of cash generating units) to which the goodwill relates. Assets are grouped at the lowest levels for which there are separately identifiable cash flows (a ‘cash generating unit’ or ‘CGU’).
The recoverable amount of an asset or a cash generating unit is the greater of its fair value less costs to sell and value in use. In assessing value in use, the estimated future cash flows are discounted to their present value using a pre-tax discount rate that reflects current market assessments of the time value of money and the risks specific to the asset. The estimation process is complex due to the inherent risks and uncertainties and if different estimates were used this could materially change the projected value of the cash flows.
An impairment loss in respect of goodwill is not reversed. An impairment loss in respect of other assets is reversed if there has been a change in the estimates used to determine the recoverable amount. An impairment loss is reversed only to the extent that the asset’s carrying amount does not exceed the carrying amount that would have been determined, net of depreciation or amortisation, if no impairment loss had been recognised.
Intertek Annual Report 2011 | 81
Notes to the financial statements

Notes to the financial statements
9 Goodwill and other intangible assets (continued)IntangiblesThe intangibles employed by the business are analysed below:
Other intangible assets
Goodwill£m
Customer
relationships£m
Licences£m
Other acquisition intangibles
£m
Computer software
£mTotal
£m
CostAt 1 January 2010 272.4 50.1 8.2 14.7 24.8 97.8Exchange adjustments 9.9 1.8 0.3 0.4 0.9 3.4Additions – – – – 5.7 5.7Disposals – – – – (0.1) (0.1)Businesses acquired (note 10) 33.5 5.0 – 2.1 – 7.1At 31 December 2010 315.8 56.9 8.5 17.2 31.3 113.9Amortisation and impairment lossesAt 1 January 2010 14.6 23.4 4.2 10.5 12.8 50.9Exchange adjustments (0.3) 1.0 0.2 0.3 0.4 1.9Charge for the year – 9.6 1.4 1.9 4.2 17.1Disposals – – – – (0.1) (0.1)At 31 December 2010 14.3 34.0 5.8 12.7 17.3 69.8Net book value at 31 December 2010 301.5 22.9 2.7 4.5 14.0 44.1
CostAt 1 January 2011 315.8 56.9 8.5 17.2 31.3 113.9Exchange adjustments 6.9 1.5 (0.2) (0.1) – 1.2Additions – – – – 5.5 5.5Disposals – – – – (0.2) (0.2)Businesses acquired (note 10) 328.3 147.1 – – 0.4 147.5At 31 December 2011 651.0 205.5 8.3 17.1 37.0 267.9Amortisation and impairment lossesAt 1 January 2011 14.3 34.0 5.8 12.7 17.3 69.8Exchange adjustments (0.3) (0.1) (0.3) (0.1) 0.2 (0.3)Charge for the year – 22.7 0.8 1.8 3.8 29.1Disposals – – – – (0.2) (0.2)At 31 December 2011 14.0 56.6 6.3 14.4 21.1 98.4Net book value at 31 December 2011 637.0 148.9 2.0 2.7 15.9 169.5
The other acquisition intangibles of £2.7m (2010: £4.5m) consist of covenants not to compete, know-how and guaranteed income. The average remaining amortisation period for customer relationships is nine years (2010: three years).
Computer software net book value of £15.9m at 31 December 2011 (2010: £14.0m) includes software in construction of £4.8m (2010: £3.2m).
82 | www.intertek.com

9 Goodwill and other intangible assets (continued)Goodwill arising from acquisitions in the current and prior year (2010 restated for changes in organisational structure in 2011) has been allocated to operating segments as follows:
2011£m
2010£m
Commodities 0.1 4.6Industry & Assurance 325.3 11.2Consumer Goods 3.2 0.4Commercial & Electrical (0.4) –Chemicals & Pharmaceuticals 0.1 17.3At 31 December 328.3 33.5
The total carrying amount of goodwill by operating segment (2010 restated for changes in organisational structure in 2011) is as follows:
2011£m
2010£m
Commodities 68.5 68.8Industry & Assurance 406.7 73.8Consumer Goods 9.7 6.7Commercial & Electrical 59.6 59.7Chemicals & Pharmaceuticals 92.5 92.5Net book value at 31 December* 637.0 301.5
* All goodwill is recorded in local currency. Additions during the year are converted at the exchange rate on the date of the transaction and the goodwill at the end of the year is stated at closing exchange rates.
Impairment reviewThe following table analyses the total Group goodwill of £637.0m (2010 restated for changes in organisational structure in 2011) between eight identified cash generating units (CGUs).
2011£m
2010£m
Commodities – Minerals 43.3 43.4Commodities – Cargo and others 25.2 25.4Industry & Assurance – Exploration and Production Services* 20.2 20.4Industry & Assurance – Industry Services 325.3 38.8Industry & Assurance – Systems Certification 61.2 14.6Consumer Goods 9.7 6.7Commercial & Electrical 59.6 59.7Chemicals & Pharmaceuticals 92.5 92.5Total goodwill net book value at 31 December 637.0 301.5
* Formerly known as Upstream.
In order to determine whether impairments are required the Group estimates the recoverable amount of each CGU. The calculation is based on projecting future cash flows over a five year period and using a terminal value to incorporate expectations of growth thereafter. The terminal value is calculated using a perpetuity model which assumes long term growth rates of operating cash flows of between 2.5% to 3.9% (2010: 2.5% to 4.1%) reflecting the long term GDP growth forecasts in the various regions in which the respective CGUs operate. A discount factor is applied to obtain a value in use which is the recoverable amount, unless the fair value less costs to sell the respective CGU is an amount in excess of the value in use.
The value in use calculation includes estimates about the future financial performance of the CGUs. The approved Group Business Plans for the 3 years 2012 to 2014 form the basis for the cash flow projections for each CGU. The cash flow projections for the succeeding 2 years 2015 to 2016 reflect management’s conservative expectations of the medium term operating performance of the CGUs and growth prospects in the various CGUs’ markets and regions.
Key assumptionsThe key assumptions in the value in use calculations are the revenue and operating margin growth rates which directly influence the forecasted operating cash flows, as well as the discount rate applied. In determining the key assumptions, management have taken into account the current economic climate and the resulting impact on expected growth and discount rates.
The calculation of the value in use is sensitive to the following key assumptions:
Operating cash flowOne of the key drivers of the operating cash flow is revenue. The 2012 to 2014 revenues for each CGU are based on the approved business plans. For the years 2015 and 2016, the likely organic growth rates were assessed for each region in the CGU, taking account of past experience and GDP growth prospects. The compound annual growth rates for each CGU ranged from 7.3% to 16.8% (2010: 8.3% to 13.9%). In all cases it is considered the assumed growth rates are realistic.
Intertek Annual Report 2011 | 83
Notes to the financial statements

Notes to the financial statements
9 Goodwill and other intangible assets (continued)The other key driver of the operating cash flow is operating profit. The compound annual growth rates, which are considered realistic, ranged from 6.8% to 23.9% (2010: 7.6% to 22.1%) reflecting management assessment of current and future market environment of the sectors and countries in which the CGUs operate.
Discount rate applied The discount rate applied to a CGU represents a pre tax rate that reflects the Group’s weighted average cost of capital adjusted for the risks specific to the CGU. The discount rates applied to the CGU were in the range of 9.1% to 12.7% (2010: 9.8% to 14.3%).
Sensitivity analysisThere are no realistic changes that could be made to the key assumptions that would cause the carrying amount of each CGU to exceed its recoverable amount. Management have also considered the effect of the following scenarios:
(i) Assuming revenues decline each year by 1% in 2013 to 2016 from the 2012 budgeted revenues, with margins increasing with base assumptions, all CGUs continue to show sufficient headroom.
(ii) Assuming zero growth in operating profit margins in 2013 to 2016, with revenues increasing per base assumptions, all CGUs continue to show sufficient headroom.
(iii) Assuming an increase in the discount rates used by 1%, all CGUs continue to show sufficient headroom.
Management consider that the likelihood of any or all of the above scenarios occurring is low.
10 AcquisitionsAcquisitions in 2011Moody InternationalOn 27 April 2011, the Group acquired 100% of the equity of Moody (comprising Moody International (Holdings) Limited, Inspection Services (US) Inc and Inspection Services Italy SRL) for a cash consideration of £449.9m, on a cash and debt free basis. Moody was headquartered in the UK and operates in over 60 countries. It is a leading provider of quality and safety services to the energy industry. It also provides systems certification services to the manufacturing, construction and service markets. This acquisition has been integrated into the Industry & Assurance division.
Provisional details of net assets acquired and fair value adjustments are set out in the following table. The analysis is provisional and amendments may be made to these figures in the 12 months following the date of the acquisition:
Moody International
Book value prior to
acquisition£m
Fair value adjustments
£m
Fair value to Group on acquisition
£m
Property, plant and equipment 5.1 – 5.1Goodwill – 322.7 322.7Other intangible assets – 145.9 145.9Trade and other receivables* 95.9 (7.2) 88.7Trade and other payables (43.2) (7.0) (50.2)Provisions for liabilities and charges** (5.6) (1.3) (6.9)Corporation tax payable (3.9) (7.1) (11.0)Deferred tax asset/(liability) 1.2 (44.7) (43.5)Non-controlling interest (0.9) – (0.9)Net assets acquired 48.6 401.3 449.9Cash outflow (net of cash acquired) 449.9Total consideration 449.9
* Trade receivables comprise gross contractual amounts due of £54.7m with a fair value of £51.4m.** Provisions for liabilities and charges include amounts that are classified as accruals in the Intertek reporting environment.
The goodwill of £322.7m represents the value of the assembled workforce and the benefits Intertek expects to gain from becoming a leading provider of quality and safety services for the energy market, creating a global platform for the provision of Industry Services, extending existing European and American positions and extending the depth of the service portfolio for energy assets, processes and products.
The intangible assets of £145.9m represent the value placed on customer contracts and relationships and the deferred tax thereon was £44.7m.
84 | www.intertek.com

10 Acquisitions (continued)The revenue for the period 27 April 2011 to 31 December 2011 was £251.8m. The revenue for the period 1 January 2011 to 26 April 2011 was £104.7m. The profit after tax for the period 27 April 2011 to 31 December 2011 was £14.1m. The profit after tax for the period 1 January 2011 to 26 April 2011 was £2.6m.
Other acquisitionsIn addition to Moody, there were four other acquisitions in the year:
(a) Recherche, Developpement & Consulting – Bruxelles SA (‘RDC’)On 29 July 2011, the Group acquired 100% of the share capital of RDC, a company based in Belgium for a cash consideration of £3.0m. In addition, contingent consideration of up to £1.6m will become payable on the achievement of specified performance targets. Fixed assets of £0.1m and other net tangible assets of £0.9m were acquired. Intangibles, being the value placed on customer relationships, of £0.5m were identified. Goodwill arising was £3.1m and represents the value placed on the benefits Intertek expects from the opportunity to expand the environmental impact services in Europe. The acquisition has been integrated into the Consumer Goods division.
(b) Food Analytical Laboratories LimitedOn 31 July 2011, the Group acquired 100% of the share capital of Food Analytical Laboratories Limited, a company based in the UK for a cash consideration of £6.0m. An amount of £0.4m is estimated to be receivable from the escrow account in respect of adjustments to consideration based on performance targets. The acquisition represents an opportunity to increase the Group’s food testing capabilities in the UK. Fixed assets of £0.7m and other net tangible assets of £1.2m were acquired. Intangibles, being the value placed on customer relationships, of £0.7m were identified. Goodwill arising was £3.0m and represents the value placed on the benefits in expanding the food testing services in the Industry & Assurance division.
(c) Business acquired from QinetiQ LimitedOn 1 August 2011, the Group acquired the oil and lubricants testing business from QinetiQ Limited, a company based in the UK for £0.5m. Net tangible assets acquired were £0.1m and there was goodwill of £0.4m identified representing the opportunity to enhance the Group’s capabilities in the energy and transport sector in the Chemicals & Pharmaceuticals division.
(d) Labs and Testing Chile SAOn 30 November 2011, the Group acquired 100% of the share capital of Labs and Testing Chile SA, a company based in Chile, for a cash consideration of £0.3m. In addition, contingent consideration of up to £0.2m will become payable on the achievement of specified performance targets. The acquisition represents an opportunity for the Group to expand its chemical and microbiology services in South America. Net tangible liabilities acquired were £0.2m. Goodwill arising was £0.7m representing the value placed on the opportunity to enhance the Group’s microbiological and environmental services business in the Commodities and Industry & Assurance divisions.
Goodwill The total goodwill arising on acquisitions noted above made during 2011 was £329.9m. In addition there was a reduction of £1.6m to goodwill in respect of prior years’ acquisitions arising out of adjustments to contingent consideration.
Consideration paidThe total cash consideration paid for the acquisitions in the year was £459.7m (2010: £41.9m).
Contribution of acquisitions to revenue and profitsIn total the acquisitions made during 2011 contributed revenues of £255.6m and profit after tax of £14.4m from their respective dates of acquisition to 31 December 2011.
The Group revenue and profit after tax for the year ended 31 December 2011 would have been £1,860.9m and £154.6m respectively if all the acquisitions were assumed to have been made on 1 January 2011.
Intertek Annual Report 2011 | 85
Notes to the financial statements
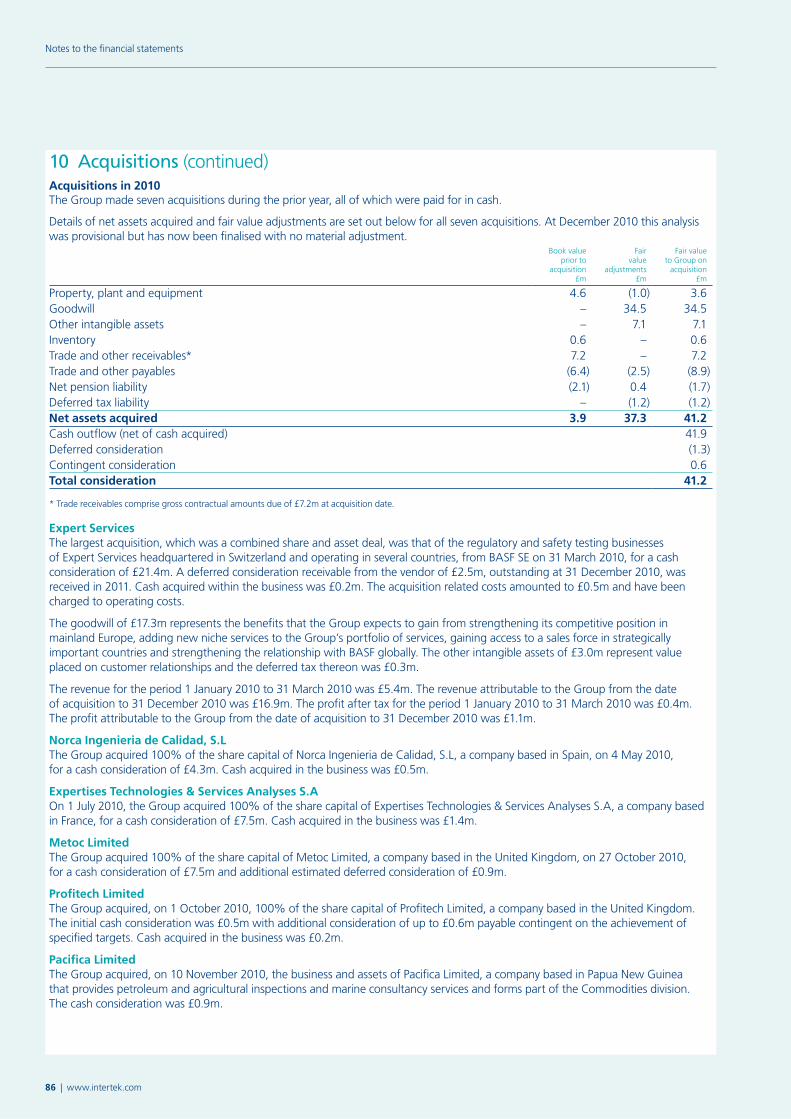
Notes to the financial statements
10 Acquisitions (continued)Acquisitions in 2010The Group made seven acquisitions during the prior year, all of which were paid for in cash.
Details of net assets acquired and fair value adjustments are set out below for all seven acquisitions. At December 2010 this analysis was provisional but has now been finalised with no material adjustment.
Book value prior to
acquisition£m
Fair value
adjustments £m
Fair value to Group on acquisition
£m
Property, plant and equipment 4.6 (1.0) 3.6Goodwill – 34.5 34.5Other intangible assets – 7.1 7.1Inventory 0.6 – 0.6Trade and other receivables* 7.2 – 7.2Trade and other payables (6.4) (2.5) (8.9)Net pension liability (2.1) 0.4 (1.7)Deferred tax liability – (1.2) (1.2)Net assets acquired 3.9 37.3 41.2Cash outflow (net of cash acquired) 41.9Deferred consideration (1.3)Contingent consideration 0.6Total consideration 41.2
* Trade receivables comprise gross contractual amounts due of £7.2m at acquisition date.
Expert ServicesThe largest acquisition, which was a combined share and asset deal, was that of the regulatory and safety testing businesses of Expert Services headquartered in Switzerland and operating in several countries, from BASF SE on 31 March 2010, for a cash consideration of £21.4m. A deferred consideration receivable from the vendor of £2.5m, outstanding at 31 December 2010, was received in 2011. Cash acquired within the business was £0.2m. The acquisition related costs amounted to £0.5m and have been charged to operating costs.
The goodwill of £17.3m represents the benefits that the Group expects to gain from strengthening its competitive position in mainland Europe, adding new niche services to the Group’s portfolio of services, gaining access to a sales force in strategically important countries and strengthening the relationship with BASF globally. The other intangible assets of £3.0m represent value placed on customer relationships and the deferred tax thereon was £0.3m.
The revenue for the period 1 January 2010 to 31 March 2010 was £5.4m. The revenue attributable to the Group from the date of acquisition to 31 December 2010 was £16.9m. The profit after tax for the period 1 January 2010 to 31 March 2010 was £0.4m. The profit attributable to the Group from the date of acquisition to 31 December 2010 was £1.1m.
Norca Ingenieria de Calidad, S.LThe Group acquired 100% of the share capital of Norca Ingenieria de Calidad, S.L, a company based in Spain, on 4 May 2010, for a cash consideration of £4.3m. Cash acquired in the business was £0.5m.
Expertises Technologies & Services Analyses S.AOn 1 July 2010, the Group acquired 100% of the share capital of Expertises Technologies & Services Analyses S.A, a company based in France, for a cash consideration of £7.5m. Cash acquired in the business was £1.4m.
Metoc LimitedThe Group acquired 100% of the share capital of Metoc Limited, a company based in the United Kingdom, on 27 October 2010, for a cash consideration of £7.5m and additional estimated deferred consideration of £0.9m.
Profitech LimitedThe Group acquired, on 1 October 2010, 100% of the share capital of Profitech Limited, a company based in the United Kingdom. The initial cash consideration was £0.5m with additional consideration of up to £0.6m payable contingent on the achievement of specified targets. Cash acquired in the business was £0.2m.
Pacifica LimitedThe Group acquired, on 10 November 2010, the business and assets of Pacifica Limited, a company based in Papua New Guinea that provides petroleum and agricultural inspections and marine consultancy services and forms part of the Commodities division. The cash consideration was £0.9m.
86 | www.intertek.com

10 Acquisitions (continued)American Analytical Chemistry Laboratories CorporationThe Group acquired 100% of the share capital of American Analytical Chemistry Laboratories Corporation, a company based in Illinois, USA, on 31 December 2010, for an initial cash consideration of £4.5m; and additional deferred consideration of up to £0.5m.
Contribution of acquisitions to revenue and profitsIn total the acquisitions made during 2010 contributed revenues of £24.1m and profits of £1.8m to the Group from their respective dates of acquisition to 31 December 2010.
The Group revenue and profit after tax for the year ended 31 December 2010 would have been £1,395.4m and £145.0m respectively if all the acquisitions were assumed to have been made on 1 January 2010.
11 Trade and other receivablesAccounting policyTrade receivables are recognised initially at the value of the invoice sent to the customer and subsequently at the amounts considered recoverable (amortised cost).
Estimates are used in determining the level of receivables that will not, in the opinion of the Directors, be collected. Based on historic default rates, reflecting the track record of payments by the Group’s customers, the Group believes that no impairment allowance is necessary in respect of trade receivables which are less than six months outstanding, unless there are specific circumstances such as the bankruptcy of a customer which would render the trade receivable irrecoverable.
The Group provides fully for all trade receivables over 12 months old as these are considered likely to be irrecoverable. Where recovery is in doubt, a provision is made against the specific trade receivable until such time as the Group believes the amount to be irrecoverable. At that time the trade receivable is written off.
Trade and other receivablesTrade and other receivables are analysed below:
2011£m
2010£m
Trade receivables 320.6 235.7Other receivables 50.9 38.1Prepayments and accrued income 71.1 41.4Total trade and other receivables 442.6 315.2
Trade receivables are shown net of an allowance for impairment losses of £15.4m (2010: £10.3m) and are all expected to be recovered within 12 months. Impairment on trade receivables charged as part of operating costs was £6.1m (2010: £4.8m) and a fair value adjustment of £3.4m was made in relation to the acquisition of Moody.
There is no material difference between the above amounts for trade and other receivables and their fair value, due to their short-term duration. There is no concentration of credit risk with respect to trade receivables as the Group has a large number of customers who are internationally dispersed.
The ageing of trade receivables at the reporting date was as follows:
2011£m
2010£m
Under 3 months 272.0 205.2Between 3 and 6 months 34.8 21.8Between 6 and 12 months 17.1 11.7Over 12 months 12.1 7.3Gross trade receivables 336.0 246.0Allowance for impairment (15.4) (10.3)Trade receivables, net of allowance 320.6 235.7
Included in trade receivables under three months of £272.0m (2010: £205.2m) are trade receivables of £151.2m (2010: £118.2m) which are not yet due for payment under the Group’s standard terms and conditions of sale.
Intertek Annual Report 2011 | 87
Notes to the financial statements

11 Trade and other receivables (continued)The movement in the allowance for impairment in respect of trade receivables during the year was as follows:
Impairment allowance for doubtful trade receivables2011
£m2010
£m
At 1 January 10.3 9.9Acquisitions 3.4 –Exchange differences (0.3) 0.3Cash recovered (0.4) (0.4)Impairment loss recognised 6.1 4.8Receivables written off (3.7) (4.3)At 31 December 15.4 10.3
There were no material individual impairments of trade receivables.
12 Trade and other payablesAccounting policyTrade payables are recognised at the value of the invoice received from a supplier. The carrying value of trade payables is considered approximate to fair value.
Trade and other payablesTrade and other payables are analysed below:
Current2011
£m
Current2010
£m
Non-current2011
£m
Non-current2010
£m
Trade payables 52.7 36.7 – –Other payables* 44.6 22.8 0.8 2.2Accruals and deferred income 198.2 160.8 8.2 5.1Total trade and other payables 295.5 220.3 9.0 7.3
* Other payables include £nil (2010: £1.8m) of deferred consideration in respect of acquisitions.
The Group’s exposure to liquidity risk related to trade payables is disclosed in note 14.
13 ProvisionsAccounting policyA provision is recognised in the balance sheet when the Group has a present legal or constructive obligation that can be estimated reliably as a result of a past event, and it is probable that an outflow of economic benefits will be required to settle the obligation.
Provisions Contingent
consideration£m
Claims£m
Other£m
Total£m
At 1 January 2011 2.4 17.9 4.0 24.3Exchange adjustments – (0.2) 0.2 –Provided in the year: – 3.1 7.5 10.6
in respect of current year acquisitions 1.8 0.5 0.3 2.6in respect of prior year acquisitions 0.6 – – 0.6
Released during the year (2.2) (4.4) (1.3) (7.9)Utilised during the year (0.8)* (10.8) (0.2) (11.8)At 31 December 2011 1.8 6.1 10.5 18.4Included in:Current liabilities 1.0 6.1 10.0 17.1Non-current liabilities 0.8 – 0.5 1.3At 31 December 2011 1.8 6.1 10.5 18.4
* In addition to the £0.8m paid above, another £1.8m was paid during the year discharging amounts shown in trade and other payables last year.
From time-to-time the Group is involved in various claims and lawsuits incidental to the ordinary course of its business. The outcome of such litigation and the timing of any potential liability cannot be readily foreseen, as it is often subject to legal proceedings. Based on information currently available, the Directors consider that the cost to the Group of an unfavourable outcome arising from such litigation is unlikely to have a materially adverse effect on the financial position of the Group in the foreseeable future.
88 | www.intertek.com
Notes to the financial statements

Notes to the financial statements
13 Provisions (continued)The provision for claims of £6.1m (2010: £17.9m) represents an estimate of the amounts payable in connection with identified claims from customers, former employees and other plaintiffs and associated legal costs. The timing of the cash outflow relating to the provisions is uncertain but is likely to be within one year. Details of contingent liabilities in respect of claims are set out in note 22.
The other provision of £10.5m (2010: £4.0m) includes restructuring provisions, onerous contracts and acquisition integration costs.
14 Borrowings and financial instrumentsFinancial instrumentsAccounting policy Net financing costsNet financing costs comprise interest expense on borrowings, facility fees, interest receivable on funds invested, net foreign exchange gains or losses, interest income and expense relating to pension assets and liabilities and gains and losses on hedging instruments that are recognised in the income statement. Interest income and interest expense are recognised as they accrue using the effective interest rate method.
Loans and receivablesLoans and receivables comprise trade and other receivables. Loans and receivables are recognised initially at fair value and subsequently at amortised cost less impairment losses (including bad debt provision).
Cash and cash equivalents Cash and cash equivalents comprise cash balances and call deposits. Bank overdrafts that are repayable on demand and form an integral part of the Group’s cash management are included as a component of cash and cash equivalents for the purpose of the statement of cash flows. Net debt comprises borrowings less cash and cash equivalents.
Non-derivative financial liabilitiesTrade and other payables are recognised initially at fair value and subsequently are stated at their amortised cost.
Interest-bearing borrowings are initially recognised at fair value less transaction costs. Subsequent to initial recognition, interest-bearing borrowings are stated at amortised cost with any difference between cost and redemption value being recognised in the income statement over the period of the borrowings on an effective interest basis.
Derivative financial instrumentsThe Group uses derivative financial instruments, including interest rate swaps and forward exchange contracts, to hedge economically its exposure to foreign exchange and interest rate risks arising from operational, financing and investment activities. In accordance with its treasury policy, the Group does not hold or issue derivative financial instruments for speculative purposes.
Derivative financial instruments are recognised initially and subsequently at fair value; attributable transaction costs are recognised in profit or loss when incurred. The gain or loss on re-measurement to fair value at each period end is recognised immediately in the income statement except where derivatives qualify for hedge accounting.
The fair value of interest rate swaps is the estimated amount that the Group would receive or pay to terminate the swap at the balance sheet date.
The fair value of forward exchange contracts is their quoted market price at the balance sheet date, being the present value of the difference between the quoted forward price and the exercise price of the contract.
HedgingHedge of monetary assets and liabilitiesWhere a derivative financial instrument is used economically to hedge the foreign exchange exposure of a recognised monetary asset or liability, no hedge accounting is applied and any gain or loss on the hedging instrument is recognised in the income statement in the same caption as the foreign exchange on the related item.
Hedge of net investment in a foreign operationThe portion of the gain or loss on an instrument designated as a hedge of a net investment in a foreign operation that is determined to be an effective hedge, is recognised directly in equity in the translation reserve. The ineffective portion is recognised immediately in the income statement.
The Group has external borrowings denominated in foreign currencies which are used to hedge the net investment in its foreign operations.
Intertek Annual Report 2011 | 89

Notes to the financial statements
14 Borrowings and financial instruments (continued)ImpairmentA financial asset is assessed at each reporting date to determine whether there is any objective evidence that it is impaired. A financial asset is considered to be impaired if objective evidence indicates that one or more events have had a negative effect on the estimated future cash flows of that asset.
An impairment loss in respect of a financial asset measured at amortised cost is calculated as the difference between its carrying amount, and the present value of the estimated future cash flows discounted at the original effective interest rate. All impairment losses are recognised in the income statement.
Net financing costs Net financing costs are shown below:
Recognised in income statement2011
£m2010
£m
Finance incomeInterest on bank balances 2.5 0.9Expected return on pension assets (note 16) 5.7 5.2Ineffective portion of cash flow hedges* – 0.9Change in fair value of financial instruments held for trading (forward exchange contracts) – 0.2Total finance income 8.2 7.2Finance expenseInterest on borrowings (22.1) (14.5)Pension interest cost (note 16) (4.7) (5.1)Net change in fair value of cash flow hedge transferred from equity* – (1.9)Foreign exchange differences on revaluation of net monetary assets and liabilities (0.6) (1.6)Facility fees and other (1.8) (0.7)Total finance expense (29.2) (23.8)Net financing costs (21.0) (16.6)
* Net effect of £nil (2010: £1.0m) is shown in note 3.
Recognised directly in other comprehensive income 2011
£m2010
£m
Foreign exchange translation differences of foreign operations (2.2) 30.1Net exchange loss on hedges of net investment in foreign operations (21.5) (6.3)Effective portion of changes in fair value of cash flow hedges – 0.9Net change in fair value of cash flow hedges transferred to profit or loss – 2.1Income tax recognised in other comprehensive income – (0.8)Finance (expense)/income recognised directly in other comprehensive income, net of tax (23.7) 26.0
Attributable to:Equity holders of the Company (23.6) 24.8Non-controlling interest (0.1) 1.2Finance (expense)/income recognised directly in other comprehensive income, net of tax (23.7) 26.0Recognised in:Hedging reserve – 3.0Translation reserve and non-controlling interest (23.7) 23.8Retained earnings – (0.8)Finance (expense)/income recognised directly in other comprehensive income, net of tax (23.7) 26.0
90 | www.intertek.com

14 Borrowings and financial instruments (continued)Analysis of net debtThe components of net debt are outlined below:
1 January 2011
£mCash flow
£m
Exchange adjustments
£m
31 December 2011
£m
Cash 217.0 (35.8) 0.7 181.9Borrowings:Principal bank facility (93.6) 89.9 3.7 –Revolving credit facility US$600m – (293.6) (10.8) (304.4)Bridge facility US$300m – (143.5) (11.6) (155.1)Bilateral multi-currency facility – (14.4) 1.0 (13.4)Senior notes US$25m 2014 (16.1) – – (16.1)Senior notes US$100m 2015 (64.6) – – (64.6)Senior notes US$75m 2016 (48.5) – – (48.5)Senior notes US$100m 2017 (64.6) – – (64.6)Senior notes US$150m 2020 (96.8) – – (96.8)Other* (2.5) 4.3 (0.9) 0.9Total borrowings (386.7) (357.3) (18.6) (762.6)Total net debt (169.7) (393.1) (17.9) (580.7)
* Includes other borrowings of £2.2m (2010: £3.1m) and facility fees.1 January
2010£m
Cash flow£m
Exchange adjustments
£m
31 December 2010
£m
Cash 134.2 76.5 6.3 217.0Borrowings:Principal bank facility (206.6) 115.9 (2.9) (93.6)Senior notes US$25m 2014 (15.7) – (0.4) (16.1)Senior notes US$100m 2015 (62.6) – (2.0) (64.6)Senior notes US$75m 2016 (47.0) – (1.5) (48.5)Senior notes US$100m 2017 – (64.8) 0.2 (64.6)Senior notes US$150m 2020 – (97.1) 0.3 (96.8)Other* (3.7) 1.6 (0.4) (2.5)Total borrowings (335.6) (44.4) (6.7) (386.7)Total net debt (201.4) 32.1 (0.4) (169.7)
* Includes other borrowings and facility fees.
BorrowingsBorrowings are split into current and non current as outlined below:
Current2011
£m
Current2010
£m
Non-current2011
£m
Non-current 2010
£m
Senior term loans and notes 38.7 93.6 721.7 290.0Other borrowings – – 2.2 3.1Total borrowings 38.7 93.6 723.9 293.1
Analysis of debt2011
£m2010
£m
Debt falling due:In one year or less 38.7 93.6Between one and two years 115.9 –Between two and five years 447.1 80.8Over five years 160.9 212.3Total borrowings 762.6 386.7
Intertek Annual Report 2011 | 91
Notes to the financial statements

14 Borrowings and financial instruments (continued)Description of borrowingsTotal undrawn committed borrowing facilities as at 31 December 2011 were £149m (2010: £336m).
Principal bank facilityThe remaining £94m of Facility D of the principal bank facility was repaid in February 2011. Advances under this facility bore interest at a rate equal to LIBOR plus 0.3% from December 2010 until it was repaid.
US$600m revolving credit facilityIn February 2011 the Group successfully signed a new principal bank facility. The new syndicated facility comprises a US$600m multi-currency revolving credit facility available to 31 March 2016. Advances under the new facility bear interest at a rate equal to LIBOR, or their local currency equivalent, plus a margin, depending on the Group’s leverage. Drawings under this facility at 31 December 2011 were £304.4m.
US$300m bridge facility On 4 March 2011 the Group signed a US$300m facility with a group of banks to part fund the Moody International acquisition. This facility matures on 31 March 2013 with part principal repayments of US$60m made on 31 December 2011 and US$60m due on 31 December 2012. Advances under this facility bear interest at a rate equal to LIBOR plus a margin, depending on the Group’s leverage. Drawings under this facility at 31 December 2011 were £155.1m.
Bilateral multi-currency facilityIn December 2010 the Group signed a multi-currency facility available to March 2016. The facility comprises a £20m multi-currency revolver facility and a €12m multi-currency term loan facility. On 22 March 2011 the £20m multi-currency revolver facility was increased by £10m to £30m. Drawings under these facilities at 31 December 2011 were £13.4m (2010: £nil).
Private placement bondsIn June 2008 the Group raised US$100m by way of a senior note issue. The notes are repayable on 26 June 2015 and pay a fixed annual interest rate of 5.54%.
In December 2008 the Group issued a further US$100m of senior notes. These notes were issued in two tranches with US$25m repayable on 21 January 2014 at a fixed annual interest rate of 7.5% and US$75m repayable on 10 June 2016 at a fixed annual interest rate of 8.0%.
In December 2010 the Group issued a further US$250m of senior notes. These notes were issued in two tranches with US$100m repayable on 15 December 2017 at a fixed annual interest rate of 3.2% and US$150m repayable on 15 December 2020 at a fixed annual interest rate of 3.91%.
Other facilitiesThe Group also has a US$60m bilateral, multi-currency facility that was signed in January 2010 and is available to 25 January 2013. Drawings under this facility at 31 December 2011 were £nil (2010: £nil).
2012 Private placement bondsIn October 2011 the Group secured funding of US$265m by way of a senior note issue. The funds were received in January 2012. These notes were issued in three tranches with US$20m repayable on 18 January 2019 at a fixed annual interest rate of 3.0%, US$140m repayable on 18 January 2022 at a fixed annual interest rate of 3.75% and US$105m repayable on 18 January 2024 at a fixed annual interest rate of 3.85%.
These funds were used to repay and cancel the US$300m bridge facility with effect from 27 February 2012.
92 | www.intertek.com
Notes to the financial statements

14 Borrowings and financial instruments (continued)Financial risks Details of the Group’s treasury controls, exposures and the policies and processes for managing capital and credit, liquidity, interest rate and currency risk are set out below, in the Directors’ Report – Financial Review that starts on page 24 and Principal Risks and Uncertainties on pages 45 to 47.
Credit riskExposure to credit riskCredit risks arise mainly from the possibility that customers may not be able to settle their obligations as agreed. The Group monitors the creditworthiness of customers on an ongoing basis. The Group’s credit risk is diversified due to the large number of entities, industries and regions that make up the Group’s customer base.
The carrying amount of financial assets represents the maximum credit exposure. At the reporting date this was as follows:
2011£m
2010£m
Trade receivables, net of allowance 320.6 235.7Cash and cash equivalents 181.9 217.0Total 502.5 452.7
The maximum exposure to credit risk for trade receivables at the reporting date by geographic region was as follows:
2011£m
2010£m
Americas 105.7 74.8Europe, Middle East and Africa 124.1 85.9Asia Pacific 90.8 75.0Total 320.6 235.7
Counterparty riskCash and cash equivalents and available borrowing facilities are at risk in the event that the counterparty is not able to meet its obligations in regards to the cash held or facilities available to the Group. The Group also enters into transactions with counterparties in relation to derivative financial instruments. If the counterparty was not able to meet its obligations, the Group may be exposed to additional foreign currency or interest rate risk.
The Group, wherever possible, enters into arrangements with counterparties who have robust credit standing, which the Group defines as a financial institution with a credit rating of at least A-. The Group has existing banking relationships with a number of ‘relationship banks’ that meet this criterion, and seeks to use their services wherever possible while avoiding excessive concentration of credit risk. Given the diverse geographic nature of the Group’s activities, it is not always possible to use a relationship bank. Therefore the Group has set limits on the level of deposits to be held at non-relationship banks to minimise the risk to the Group. It is also Group policy to remit any excess funds from local entities back to Group Treasury in the UK. Given the controls in place, and based on a current assessment of our banking relationships, management does not expect any counterparty to fail to meet its obligations.
Intertek Annual Report 2011 | 93
Notes to the financial statements
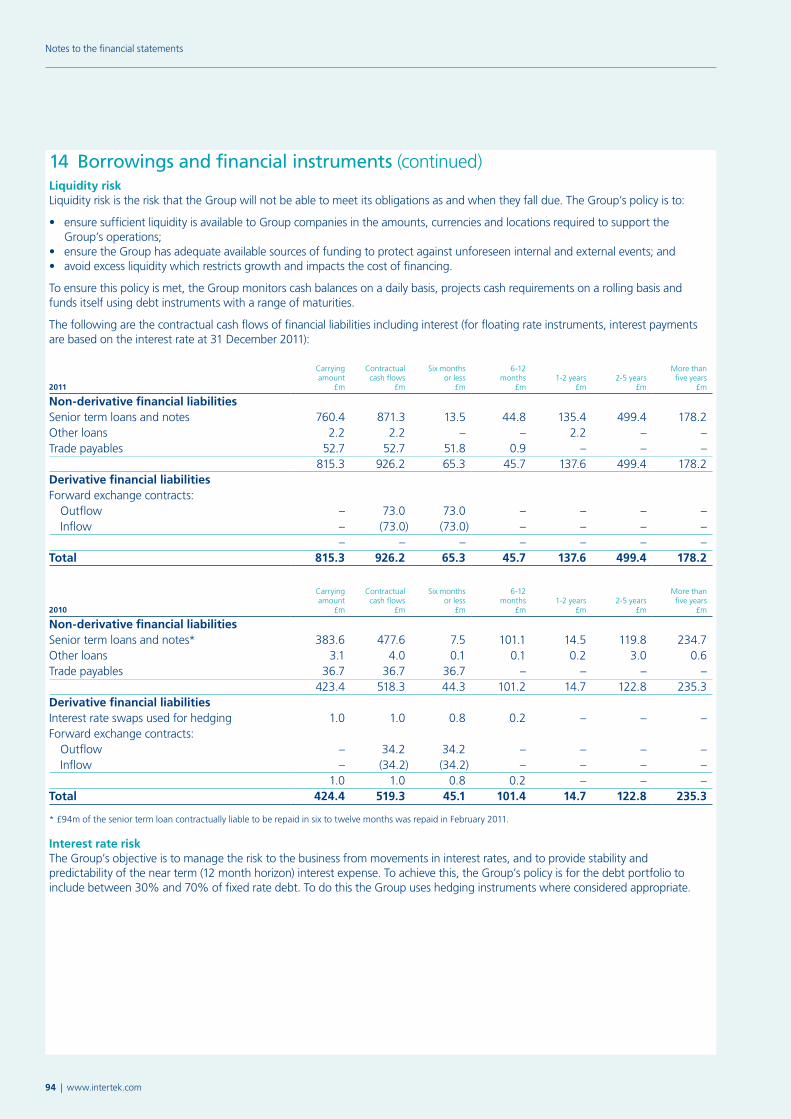
14 Borrowings and financial instruments (continued)Liquidity riskLiquidity risk is the risk that the Group will not be able to meet its obligations as and when they fall due. The Group’s policy is to:
ensure sufficient liquidity is available to Group companies in the amounts, currencies and locations required to support the Group’s operations;
ensure the Group has adequate available sources of funding to protect against unforeseen internal and external events; and avoid excess liquidity which restricts growth and impacts the cost of financing.
To ensure this policy is met, the Group monitors cash balances on a daily basis, projects cash requirements on a rolling basis and funds itself using debt instruments with a range of maturities.
The following are the contractual cash flows of financial liabilities including interest (for floating rate instruments, interest payments are based on the interest rate at 31 December 2011):
2011
Carrying amount
£m
Contractual cash flows
£m
Six months or less
£m
6-12 months
£m1-2 years
£m2-5 years
£m
More than five years
£m
Non-derivative financial liabilitiesSenior term loans and notes 760.4 871.3 13.5 44.8 135.4 499.4 178.2Other loans 2.2 2.2 – – 2.2 – –Trade payables 52.7 52.7 51.8 0.9 – – –
815.3 926.2 65.3 45.7 137.6 499.4 178.2Derivative financial liabilitiesForward exchange contracts:
Outflow – 73.0 73.0 – – – –Inflow – (73.0) (73.0) – – – –
– – – – – – –Total 815.3 926.2 65.3 45.7 137.6 499.4 178.2
2010
Carrying amount
£m
Contractual cash flows
£m
Six months or less
£m
6-12 months
£m1-2 years
£m2-5 years
£m
More than five years
£m
Non-derivative financial liabilitiesSenior term loans and notes* 383.6 477.6 7.5 101.1 14.5 119.8 234.7Other loans 3.1 4.0 0.1 0.1 0.2 3.0 0.6Trade payables 36.7 36.7 36.7 – – – –
423.4 518.3 44.3 101.2 14.7 122.8 235.3Derivative financial liabilitiesInterest rate swaps used for hedging 1.0 1.0 0.8 0.2 – – –Forward exchange contracts:
Outflow – 34.2 34.2 – – – –Inflow – (34.2) (34.2) – – – –
1.0 1.0 0.8 0.2 – – –Total 424.4 519.3 45.1 101.4 14.7 122.8 235.3
* £94m of the senior term loan contractually liable to be repaid in six to twelve months was repaid in February 2011.
Interest rate riskThe Group’s objective is to manage the risk to the business from movements in interest rates, and to provide stability and predictability of the near term (12 month horizon) interest expense. To achieve this, the Group’s policy is for the debt portfolio to include between 30% and 70% of fixed rate debt. To do this the Group uses hedging instruments where considered appropriate.
94 | www.intertek.com
Notes to the financial statements
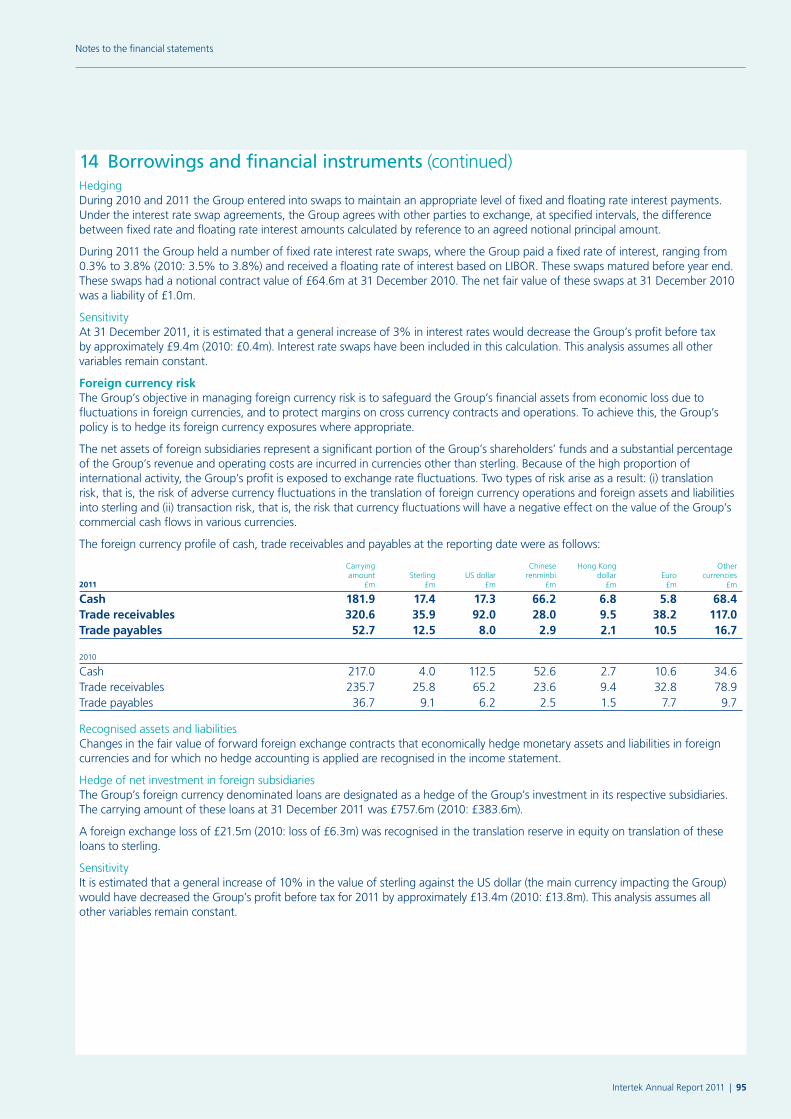
14 Borrowings and financial instruments (continued)HedgingDuring 2010 and 2011 the Group entered into swaps to maintain an appropriate level of fixed and floating rate interest payments. Under the interest rate swap agreements, the Group agrees with other parties to exchange, at specified intervals, the difference between fixed rate and floating rate interest amounts calculated by reference to an agreed notional principal amount.
During 2011 the Group held a number of fixed rate interest rate swaps, where the Group paid a fixed rate of interest, ranging from 0.3% to 3.8% (2010: 3.5% to 3.8%) and received a floating rate of interest based on LIBOR. These swaps matured before year end. These swaps had a notional contract value of £64.6m at 31 December 2010. The net fair value of these swaps at 31 December 2010 was a liability of £1.0m.
SensitivityAt 31 December 2011, it is estimated that a general increase of 3% in interest rates would decrease the Group’s profit before tax by approximately £9.4m (2010: £0.4m). Interest rate swaps have been included in this calculation. This analysis assumes all other variables remain constant.
Foreign currency riskThe Group’s objective in managing foreign currency risk is to safeguard the Group’s financial assets from economic loss due to fluctuations in foreign currencies, and to protect margins on cross currency contracts and operations. To achieve this, the Group’s policy is to hedge its foreign currency exposures where appropriate.
The net assets of foreign subsidiaries represent a significant portion of the Group’s shareholders’ funds and a substantial percentage of the Group’s revenue and operating costs are incurred in currencies other than sterling. Because of the high proportion of international activity, the Group’s profit is exposed to exchange rate fluctuations. Two types of risk arise as a result: (i) translation risk, that is, the risk of adverse currency fluctuations in the translation of foreign currency operations and foreign assets and liabilities into sterling and (ii) transaction risk, that is, the risk that currency fluctuations will have a negative effect on the value of the Group’s commercial cash flows in various currencies.
The foreign currency profile of cash, trade receivables and payables at the reporting date were as follows:
2011
Carrying amount
£mSterling
£mUS dollar
£m
Chinese renminbi
£m
Hong Kong dollar
£mEuro
£m
Other currencies
£m
Cash 181.9 17.4 17.3 66.2 6.8 5.8 68.4Trade receivables 320.6 35.9 92.0 28.0 9.5 38.2 117.0Trade payables 52.7 12.5 8.0 2.9 2.1 10.5 16.7
2010
Cash 217.0 4.0 112.5 52.6 2.7 10.6 34.6Trade receivables 235.7 25.8 65.2 23.6 9.4 32.8 78.9Trade payables 36.7 9.1 6.2 2.5 1.5 7.7 9.7
Recognised assets and liabilitiesChanges in the fair value of forward foreign exchange contracts that economically hedge monetary assets and liabilities in foreign currencies and for which no hedge accounting is applied are recognised in the income statement.
Hedge of net investment in foreign subsidiariesThe Group’s foreign currency denominated loans are designated as a hedge of the Group’s investment in its respective subsidiaries. The carrying amount of these loans at 31 December 2011 was £757.6m (2010: £383.6m).
A foreign exchange loss of £21.5m (2010: loss of £6.3m) was recognised in the translation reserve in equity on translation of these loans to sterling.
SensitivityIt is estimated that a general increase of 10% in the value of sterling against the US dollar (the main currency impacting the Group) would have decreased the Group’s profit before tax for 2011 by approximately £13.4m (2010: £13.8m). This analysis assumes all other variables remain constant.
Intertek Annual Report 2011 | 95
Notes to the financial statements

14 Borrowings and financial instruments (continued)Fair valuesThe table below sets out a comparison of the book values and corresponding fair values of all the Group’s financial instruments by class.
Book value2011
£m
Fair value2011
£m
Book value2010
£m
Fair value2010
£m
Financial assetsCash and cash equivalents 181.9 181.9 217.0 217.0Trade receivables 320.6 320.6 235.7 235.7Total financial assets 502.5 502.5 452.7 452.7Financial liabilitiesInterest bearing loans and borrowings 762.6 786.5 386.7 397.3Interest rate swaps – – 1.0 1.0Trade payables 52.7 52.7 36.7 36.7Total financial liabilities 815.3 839.2 424.4 435.0
The major methods and assumptions used in estimating the fair values of the Group’s financial instruments are summarised below.
Interest rate swaps Bank valuations are used to estimate the fair value of interest rate swaps. Valuations are tested by considering the equivalent swap rate as at 31 December and calculating the difference in interest earned at this rate compared to the original swap rates.
Interest bearing loans and borrowingsThe fair value of the floating interest bearing loans and borrowings is equal to the book value, since the floating interest rates were reset just prior to the year end. The fair value of the fixed interest bearing loans and borrowings has been calculated based on the present value of future principal and interest cash flows discounted at the market rate at the reporting date.
Trade receivables and payablesFor trade receivables and payables with a remaining life of less than one year, the notional amount is deemed to reflect the fair value. All others are estimated as the present value of future cash flows discounted at the market rate of interest at the reporting date.
15 Capital and reserves Accounting policyDividendsInterim dividends are recognised as a movement in equity when they are paid. Final dividends are reported as a movement in equity in the year in which they are approved by the shareholders.
Own shares held by the Employee Benefit Trust (‘EBT’)Transactions of the Group sponsored EBT are included in the Group financial statements. In particular, the Trust’s purchases of shares in the Company are debited directly in equity to retained earnings.
Share capital
Group and Company2011
Number2011
£m2010
£m
Allotted, called up and fully paid:Ordinary shares of 1p each at start of year 159,554,209 1.6 1.6Employee share option schemes – options exercised (note 17) 72,839 – –Deferred Bonus Plan (note 17) 533,917 – –Ordinary shares of 1p each at end of year 160,160,965 1.6 1.6Shares classified in shareholders’ funds 1.6 1.6
The holders of ordinary shares are entitled to receive dividends and are entitled to vote at general meetings of the Company.
During the year, the Company issued 72,839 (2010: 423,749 ) ordinary shares in respect of the share options exercised, for consideration of £0.4m (2010: £2.8m) settled in cash and issued 533,917 (2010: 419,251) shares under the Deferred Bonus Plan for £nil consideration.
96 | www.intertek.com
Notes to the financial statements
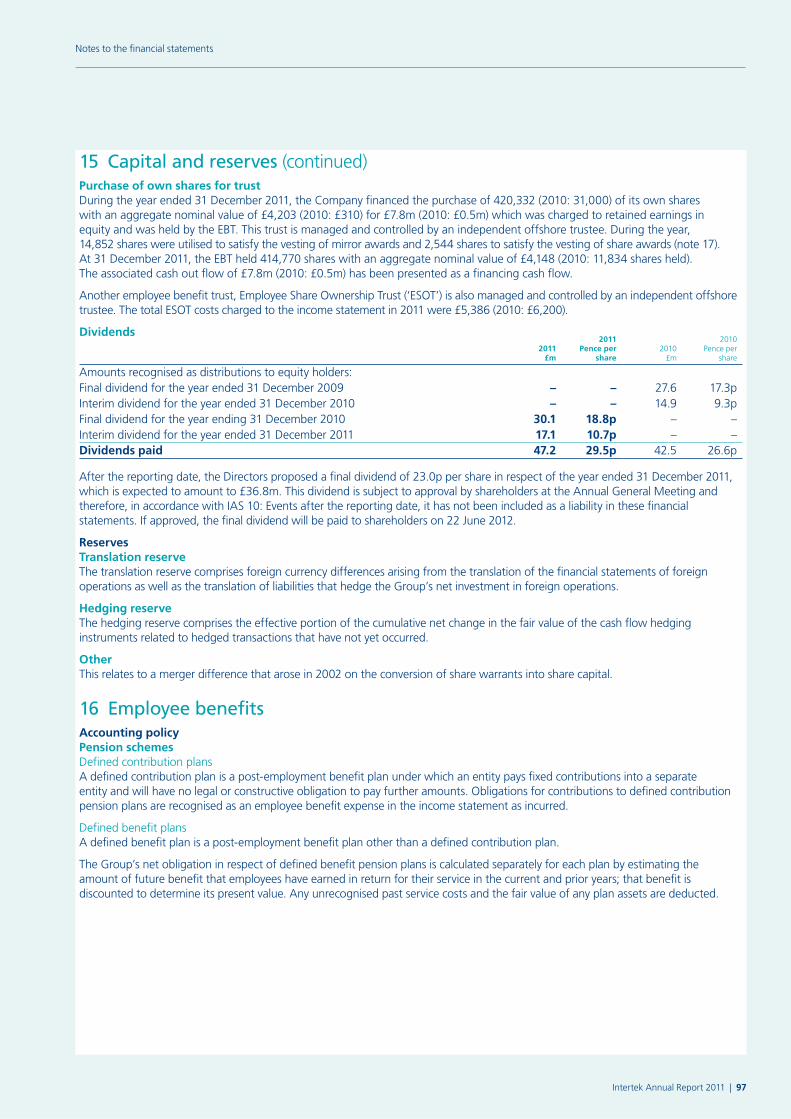
15 Capital and reserves (continued)Purchase of own shares for trustDuring the year ended 31 December 2011, the Company financed the purchase of 420,332 (2010: 31,000) of its own shares with an aggregate nominal value of £4,203 (2010: £310) for £7.8m (2010: £0.5m) which was charged to retained earnings in equity and was held by the EBT. This trust is managed and controlled by an independent offshore trustee. During the year, 14,852 shares were utilised to satisfy the vesting of mirror awards and 2,544 shares to satisfy the vesting of share awards (note 17). At 31 December 2011, the EBT held 414,770 shares with an aggregate nominal value of £4,148 (2010: 11,834 shares held). The associated cash out flow of £7.8m (2010: £0.5m) has been presented as a financing cash flow.
Another employee benefit trust, Employee Share Ownership Trust (‘ESOT’) is also managed and controlled by an independent offshore trustee. The total ESOT costs charged to the income statement in 2011 were £5,386 (2010: £6,200).
Dividends 2011
£m
2011Pence per
share2010
£m
2010Pence per
share
Amounts recognised as distributions to equity holders:Final dividend for the year ended 31 December 2009 – – 27.6 17.3pInterim dividend for the year ended 31 December 2010 – – 14.9 9.3pFinal dividend for the year ending 31 December 2010 30.1 18.8p – –Interim dividend for the year ended 31 December 2011 17.1 10.7p – –Dividends paid 47.2 29.5p 42.5 26.6p
After the reporting date, the Directors proposed a final dividend of 23.0p per share in respect of the year ended 31 December 2011, which is expected to amount to £36.8m. This dividend is subject to approval by shareholders at the Annual General Meeting and therefore, in accordance with IAS 10: Events after the reporting date, it has not been included as a liability in these financial statements. If approved, the final dividend will be paid to shareholders on 22 June 2012.
ReservesTranslation reserveThe translation reserve comprises foreign currency differences arising from the translation of the financial statements of foreign operations as well as the translation of liabilities that hedge the Group’s net investment in foreign operations.
Hedging reserveThe hedging reserve comprises the effective portion of the cumulative net change in the fair value of the cash flow hedging instruments related to hedged transactions that have not yet occurred.
Other This relates to a merger difference that arose in 2002 on the conversion of share warrants into share capital.
16 Employee benefits Accounting policyPension schemesDefined contribution plansA defined contribution plan is a post-employment benefit plan under which an entity pays fixed contributions into a separate entity and will have no legal or constructive obligation to pay further amounts. Obligations for contributions to defined contribution pension plans are recognised as an employee benefit expense in the income statement as incurred.
Defined benefit plansA defined benefit plan is a post-employment benefit plan other than a defined contribution plan.
The Group’s net obligation in respect of defined benefit pension plans is calculated separately for each plan by estimating the amount of future benefit that employees have earned in return for their service in the current and prior years; that benefit is discounted to determine its present value. Any unrecognised past service costs and the fair value of any plan assets are deducted.
Intertek Annual Report 2011 | 97
Notes to the financial statements

16 Employee benefits (continued)In calculating the defined benefit deficit, the discount rate is the yield at the reporting date on AA credit-rated bonds that have maturity dates approximating the terms of the Group’s obligations and that are denominated in the same currency in which the benefits are expected to be paid. The calculation is performed annually by a qualified actuary using the projected unit credit method. When the calculation results in a benefit to the Group, the recognised asset is limited to the total of any unrecognised past service costs and the present value of economic benefits available in the form of:
(i) an unconditional right to a refund from the plan; or
(ii) reductions in future contributions to the plan as measured by the estimated future service cost less the estimated minimum funding contributions required in respect of the future accrual of benefits in that year. An economic benefit is available to the Group if it is realisable during the life of the plan, or on settlement of the plan liabilities. In addition a provision for future minimum funding contributions is recorded to the extent that such payments are required to cover an existing shortfall, as measured on a minimum funding contribution basis, and having been paid will not be available as a refund or a reduction in future contributions to the plan.
The increase in the present value of the liabilities expected to arise from the employees’ services in the accounting period is charged to the operating profit in the income statement. The expected return on the schemes’ assets and the interest on the present value of the schemes’ liabilities, during the accounting period, are shown as finance income and finance expense respectively.
The Group operates a number of pension schemes throughout the world. In most locations, these are defined contribution arrangements. However, there are significant defined benefit schemes in the United Kingdom, Hong Kong and Switzerland. These are funded schemes, with assets held in separate trustee administered funds. The schemes in the United Kingdom and Hong Kong were closed to new entrants in 2002 and 2000, respectively. Other funded defined benefit schemes are not considered to be material and are therefore accounted for as if they were defined contribution schemes.
The Group recognises all actuarial gains and losses in each year in equity through the consolidated statement of comprehensive income.
Total pension costThe total pension cost included in operating profit for the Group was:
2011£m
2010£m
Defined contribution schemes (26.8) (20.3)Defined benefit schemes – current service cost (2.4) (2.4)Pension cost included in operating profit (note 5) (29.2) (22.7)
The pension cost for the defined benefit schemes was assessed in accordance with the advice of qualified actuaries. The last full triennial actuarial valuation of The Intertek Pension Scheme in the United Kingdom was carried out as at 1 April 2010, but this has been updated to 31 December 2011 for IAS 19 purposes. The Capcis Scheme in the UK was merged into The Intertek Pension Scheme during the year. The last full actuarial valuation of the Hong Kong scheme was carried out as at 31 December 2010, for local accounting purposes but this has been updated to 31 December 2011 for IAS 19 purposes. The Swiss scheme was actuarially valued for IAS 19 purposes at 31 December 2011.
The Group is currently making additional contributions into The Intertek Pension Scheme with the overall objective of paying off the deficit in line with actuary’s recommendations.
Defined benefit schemesThe cost of defined benefit schemesThe amounts recognised in the income statement were as follows:
2011£m
2010£m
Current service cost (2.4) (2.4)Expected return on scheme assets (note 14) 5.7 5.2Pension interest cost (note 14) (4.7) (5.1)Total charge (1.4) (2.3)
The current service cost is included in operating costs in the income statement and pension interest cost and expected return on scheme assets are included in net financing costs.
98 | www.intertek.com
Notes to the financial statements

16 Employee benefits (continued)Actuarial gains and losses recognised directly in the consolidated statement of comprehensive income:
2011£m
2010£m
Cumulative loss at 1 January (0.8) (15.8)Recognised (losses)/gains in the year (7.9) 15.0Cumulative loss at 31 December (8.7) (0.8)
Company contributionsIn 2012 the Group expects to make normal contributions of £2.1m (2011: £1.9m). Additionally, in February 2012, the Group made a special contribution of £0.6m (2011: £1.2m) to the UK pension scheme.
Pension liability for defined benefit schemesThe amounts recognised in the statement of financial position for defined benefit schemes were as follows:
2011£m
2010£m
2009£m
Fair value of scheme assets 96.7 96.3 73.0Present value of funded defined benefit obligations (108.0) (101.8) (92.5)Net liability in the statement of financial position (11.3) (5.5) (19.5)
The fair value changes in the scheme assets are shown below:
2011£m
2010£m
Fair value of scheme assets at 1 January 96.3 73.0Acquisitions – 9.3Swiss scheme – 1.9Expected return on scheme assets 5.7 5.2Normal contributions by the employer 1.9 1.9Special contributions by the employer 1.2 1.2Contributions by scheme participants 0.9 0.7Benefits paid (3.2) (3.1)Effect of exchange rate changes on overseas schemes 0.1 1.3Actuarial (losses)/gains (6.2) 4.9Fair value of scheme assets at 31 December 96.7 96.3
Composition of scheme assets in each category:
United Kingdom Scheme Hong Kong Scheme Swiss Scheme
2011 2010 2011 2010 2011 2010
Equities 61% 63% 58% 67% – –Bonds 30% 30% 39% 31% 100% 100%Cash/other 9% 7% 3% 2% – –
The actual return on scheme assets was as follows:
United Kingdom Scheme Hong Kong Scheme Swiss Scheme
2011£m
2010£m
2011£m
2010£m
2011£m
2010£m
Actual return (0.5) 8.4 (0.8) 1.6 0.8 0.2
Intertek Annual Report 2011 | 99
Notes to the financial statements

16 Employee benefits (continued)Changes in the present value of the defined benefit obligations were as follows:
2011£m
2010£m
Defined benefit obligations at 1 January 101.8 92.5Acquisitions – 11.0Swiss scheme – 1.9Current service cost 2.4 2.4Interest cost 4.7 5.1Contributions by scheme participants 0.9 0.7Benefits paid (3.2) (3.1)Effect of exchange rate changes on overseas schemes (0.3) 1.4Actuarial losses/(gains) 1.7 (10.1)Defined benefit obligations at 31 December 108.0 101.8
The pension deficit of each scheme at 31 December 2011 was as follows:
United Kingdom
Scheme£m
Hong Kong Scheme
£m
SwissScheme
£mTotal
£m
Fair value of scheme assets 68.9 13.9 13.9 96.7Present value of funded defined benefit obligations (71.7) (20.6) (15.7) (108.0)Deficit in schemes (2.8) (6.7) (1.8) (11.3)
Principal actuarial assumptions:
United Kingdom Scheme Hong Kong Scheme Swiss Scheme Weighted average
2011 2010 2011 2010 2011 2010 2011 2010
Discount rate 4.9% 5.4% 1.5% 3.1% 2.5% 3.0% 3.9% 4.7%Inflation rate (based on CPI)* 2.0% 3.1% n/a n/a 0.0% 0.5% 1.7% 2.7%Rate of salary increases 3.0% 4.1% 4.0% 3.0% 1.5% 1.5% 3.0% 3.5%Rate of pension increases:CPI subject to a maximum of 5% p.a 2.0% 3.1% n/a n/a n/a n/a 2.0% 3.1%Increases subject to a maximum of 2.5% p.a 1.7% 2.5% n/a n/a n/a n/a 1.7% 2.5%Annualised expected return on scheme assets 5.0% 6.0% 6.5% 7.8% 3.5% 4.0% 5.0% 6.0%
* The revaluation of benefits in deferment and pension increases in payment under the United Kingdom scheme were, with effect from January 2011, based on the CPI instead of the RPI. For pensions accrued after 5 April 2005, pension increases in payment are subject to a cap of 2.5% per annum. For pensions accrued prior to 5 April 2005, pension increases in payment are subject to a cap of 5% per annum. The effect of the change to the CPI of £2.7m was reflected within actuarial gains in the financial statements in 2010.
The retirement arrangements in Hong Kong pays lump sums to members instead of pensions and the Swiss scheme is an insured plan.
The expected rates of return on scheme assets are determined by reference to relevant indices which take into account the current level of expected returns on risk free investments, the historical level of risk premium associated with equities and the expectation for future returns on such assets. The overall expected rate of return is calculated by weighting the individual rates in accordance with the anticipated balance in the plan’s investment portfolio.
Where investments are held in bonds and cash, the expected long-term rate of return is taken to be the yields generally prevailing on such assets at the reporting date. A higher rate of return is expected on equity investments. This is based on an out-performance assumption over gilt yields.
100 | www.intertek.com
Notes to the financial statements

16 Employee benefits (continued)Life expectancy assumptions at year end for:
United Kingdom Scheme Hong Kong Scheme* Swiss Scheme
2011 2010 2011 2010 2011 2010
Male aged 40 46.6 46.5 n/a n/a 41.6 40.2Male aged 65 21.1 21.0 n/a n/a 18.9 17.9Female aged 40 48.8 48.7 n/a n/a 44.6 44.2Female aged 65 23.7 23.6 n/a n/a 21.4 20.9
* The retirement arrangement in Hong Kong pays lump sums to members instead of pensions at the point they retire. Since the amount of the lump sum is not related to the life expectancy of the members, the post-retirement mortality is not a relevant assumption for the Hong Kong scheme.
The table above shows, for the United Kingdom scheme, the number of years a male or female is expected to live, assuming they were aged either 40 or 65 at 31 December. The 2011 mortality tables adopted for the United Kingdom scheme are the S1PA projected by year of birth, with an allowance for the medium cohort effect and a minimum improvement of 1% (the same tables were used in 2010). For the Swiss scheme, the mortality table adopted is the BVG 2010 (an updated version of BVG 2005 adopted last year), an industry standard in Switzerland which is based on statistical evidence of major Swiss pension funds.
Sensitivity analysisThe table below sets out the sensitivity on the pension assets and liabilities as at 31 December 2011 of the two main assumptions:
Change in assumptionsLiabilities
£mAssets
£mDeficit
£m
Increase/ (decrease) in deficit
£m
No change 108.0 96.7 (11.3) –0.25% rise in discount rate 103.7 96.7 (7.0) (4.3)0.25% fall in discount rate 112.5 96.7 (15.8) 4.50.25% rise in inflation 110.5 96.7 (13.8) 2.50.25% fall in inflation 105.7 96.7 (9.0) (2.3)
History of experience gains and losses:
2011£m
2010£m
2009£m
2008£m
2007£m
Fair value of scheme assets 96.7 96.3 73.0 58.6 66.6Defined benefit obligations (108.0) (101.8) (92.5) (77.1) (73.9)Deficit (11.3) (5.5) (19.5) (18.5) (7.3)Experience (losses)/gains on scheme liabilities (1.4) 2.8 (1.8) 0.4 1.5Experience (losses)/gains on scheme assets (6.2) 4.9 11.7 (17.4) 2.1
Intertek Annual Report 2011 | 101
Notes to the financial statements

17 Share schemesAccounting policy Share-based payment transactionsThe share-based compensation plans operated by the Group allow employees to acquire shares of the Company. The fair value of the employee services, received in exchange for the grant of share options or shares, is measured at the grant date and is recognised as an expense with a corresponding increase in equity. The charge is calculated using the Monte Carlo method and expensed to the income statement over the vesting period of the relevant award. The charge for the share options and for the share awards is adjusted to reflect expected and actual levels of vesting where conditions are non-market based. The expense of the Performance Awards, (previously Matching Awards), is also additionally adjusted for the probability of performance conditions being achieved.
The Group has taken advantage of the provisions of IFRS 1: First-time Adoption of International Financial Reporting Standards, and has recognised an expense only in respect of share options and awards granted since 7 November 2002.
Share option schemes The Company established a share option scheme for senior management in March 1997. The maximum number of options that can be granted under the scheme have been allocated and that scheme has been discontinued. In May 2002, the Intertek Group plc 2002 Share Option Plan (the 2002 Plan) and the Intertek Group plc 2002 Approved Share Option Plan (the Approved Plan) were established for employees to be granted share options at the discretion of the Remuneration Committee. These plans have also been discontinued and the last grants under these plans were made in September 2005.
The number and weighted average exercise prices of share options are as follows:
2011 2010
Weighted average exercise
priceNumber of
options
Weighted average exercise
priceNumber of
options
At beginning of year 631p 379,347 646p 813,457Exercised 659p (72,839) 599p (423,749)Forfeited 578p (21,244) 769p (10,361)Outstanding options at end of year 628p 285,264 631p 379,347Exercisable at end of year 628p 285,264 631p 379,347
The weighted average share price of the Company at the date of exercise of share options was 1,956p (2010: 1,534p). The options outstanding at the year end have an exercise price in the range of 359p to 778p and a weighted average contractual life of 2.6 years.
The outstanding options at 31 December 2011 are exercisable as follows:
Option SchemeNumber of options
outstanding Exercise price per share Exercisable between
2002 Plan 24,908 437p 30 May 2005 30 May 201228,583 359p 7 April 2006 7 April 2013
4,977 462p 12 September 2006 12 September 201371,574 523.5p 7 April 2007 7 April 20143,600 607p 14 September 2007 14 September 2014
138,755 778p 7 April 2008 7 April 20152,125 711p 13 September 2008 13 September 2015
274,522Approved Plan 343 437p 30 May 2005 30 May 2012
– 380p 17 July 2005 17 July 2012477 359p 7 April 2006 7 April 2013262 462p 12 September 2006 12 September 2013
5,266 523.5p 7 April 2007 7 April 20144,394 778p 7 April 2007 7 April 2014
10,742Total 285,264
102 | www.intertek.com
Notes to the financial statements
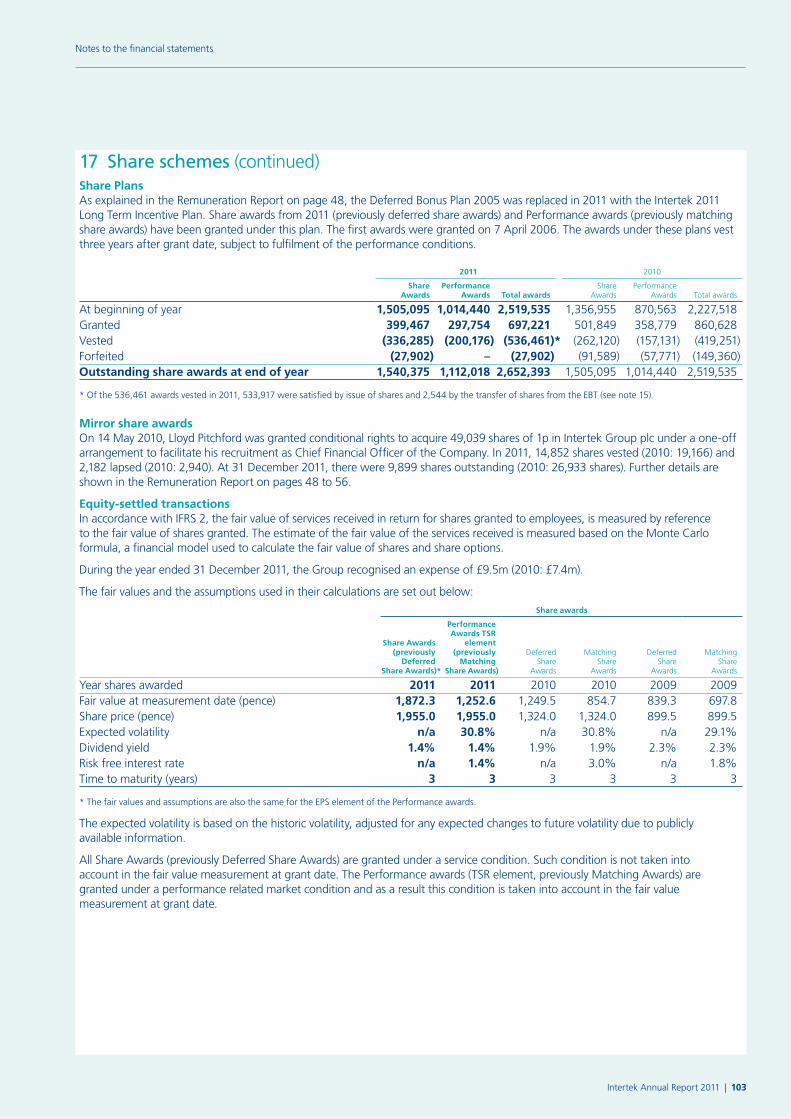
17 Share schemes (continued)Share PlansAs explained in the Remuneration Report on page 48, the Deferred Bonus Plan 2005 was replaced in 2011 with the Intertek 2011 Long Term Incentive Plan. Share awards from 2011 (previously deferred share awards) and Performance awards (previously matching share awards) have been granted under this plan. The first awards were granted on 7 April 2006. The awards under these plans vest three years after grant date, subject to fulfilment of the performance conditions.
2011 2010
Share Awards
Performance Awards Total awards
Share Awards
Performance Awards Total awards
At beginning of year 1,505,095 1,014,440 2,519,535 1,356,955 870,563 2,227,518Granted 399,467 297,754 697,221 501,849 358,779 860,628Vested (336,285) (200,176) (536,461)* (262,120) (157,131) (419,251)Forfeited (27,902) – (27,902) (91,589) (57,771) (149,360)Outstanding share awards at end of year 1,540,375 1,112,018 2,652,393 1,505,095 1,014,440 2,519,535
* Of the 536,461 awards vested in 2011, 533,917 were satisfied by issue of shares and 2,544 by the transfer of shares from the EBT (see note 15).
Mirror share awardsOn 14 May 2010, Lloyd Pitchford was granted conditional rights to acquire 49,039 shares of 1p in Intertek Group plc under a one-off arrangement to facilitate his recruitment as Chief Financial Officer of the Company. In 2011, 14,852 shares vested (2010: 19,166) and 2,182 lapsed (2010: 2,940). At 31 December 2011, there were 9,899 shares outstanding (2010: 26,933 shares). Further details are shown in the Remuneration Report on pages 48 to 56.
Equity-settled transactionsIn accordance with IFRS 2, the fair value of services received in return for shares granted to employees, is measured by reference to the fair value of shares granted. The estimate of the fair value of the services received is measured based on the Monte Carlo formula, a financial model used to calculate the fair value of shares and share options.
During the year ended 31 December 2011, the Group recognised an expense of £9.5m (2010: £7.4m).
The fair values and the assumptions used in their calculations are set out below:Share awards
Share Awards(previously
DeferredShare Awards)*
Performance Awards TSR
element (previously
Matching Share Awards)
DeferredShare
Awards
MatchingShare
Awards
DeferredShare
Awards
MatchingShare
Awards
Year shares awarded 2011 2011 2010 2010 2009 2009Fair value at measurement date (pence) 1,872.3 1,252.6 1,249.5 854.7 839.3 697.8Share price (pence) 1,955.0 1,955.0 1,324.0 1,324.0 899.5 899.5Expected volatility n/a 30.8% n/a 30.8% n/a 29.1%Dividend yield 1.4% 1.4% 1.9% 1.9% 2.3% 2.3%Risk free interest rate n/a 1.4% n/a 3.0% n/a 1.8%Time to maturity (years) 3 3 3 3 3 3
* The fair values and assumptions are also the same for the EPS element of the Performance awards.
The expected volatility is based on the historic volatility, adjusted for any expected changes to future volatility due to publicly available information.
All Share Awards (previously Deferred Share Awards) are granted under a service condition. Such condition is not taken into account in the fair value measurement at grant date. The Performance awards (TSR element, previously Matching Awards) are granted under a performance related market condition and as a result this condition is taken into account in the fair value measurement at grant date.
Intertek Annual Report 2011 | 103
Notes to the financial statements

Notes to the financial statements
18 Subsequent events2012 Private placement bondsIn October 2011 the Group secured funding of US$265m by way of a senior note issue. The funds were received in January 2012. These notes were issued in three tranches with US$20m repayable on 18 January 2019 at a fixed annual interest rate of 3%, US$140m repayable on 18 January 2022 at a fixed annual interest rate of 3.75% and US$105m repayable on 18 January 2024 at a fixed annual interest rate of 3.85%. These funds were used to repay and cancel the US$300m bridge facility with effect from February 2012.
19 Capital management The Directors have to determine the appropriate capital structure of Intertek; specifically how much is raised from shareholders (equity) and how much is borrowed from financial institutions (debt) in order to finance the Group’s activities. These activities include ongoing operations as well as acquisitions as described in note 10.
The Group’s policy is to maintain a robust capital base (including cash and debt) to ensure the market and key stakeholders retain confidence in the capital profile. Debt capital is monitored by Group Treasury assessing the liquidity buffer on a short and longer term basis as discussed in the Principal Risks and Uncertainties section.
The Group uses KPIs, including return on invested capital and diluted adjusted earnings per share to monitor the capital position of the Group to ensure it is being utilised effectively.
The dividend policy also forms part of the Board’s capital management policy, and the Board ensures there is appropriate earnings cover for the dividend proposed at both the interim and year end.
20 Non-controlling interest Accounting policyAcquisitions of non-controlling interests are accounted for as transactions with owners in their capacity as owners and therefore no goodwill is recognised as a result of such transactions. The purchase of non-controlling interests are based on a proportionate amount of the net assets of the subsidiary.
Non-controlling interestAn analysis of the movement in non-controlling interest is shown below:
2011£m
2010£m
At 1 January 23.1 18.0Exchange adjustments (0.1) 1.2Share of profit for the year 12.3 10.4Additions 0.3 0.1Purchase of non-controlling interest* (1.2) –Dividends paid to non-controlling interest (10.4) (6.6)At 31 December 24.0 23.1
* In 2011, the Group purchased a non-controlling interest for cash consideration of £1.8m and recognised a decrease in a non-controlling interest of £1.2m and a decrease in retained earnings of £0.6m.
104 | www.intertek.com
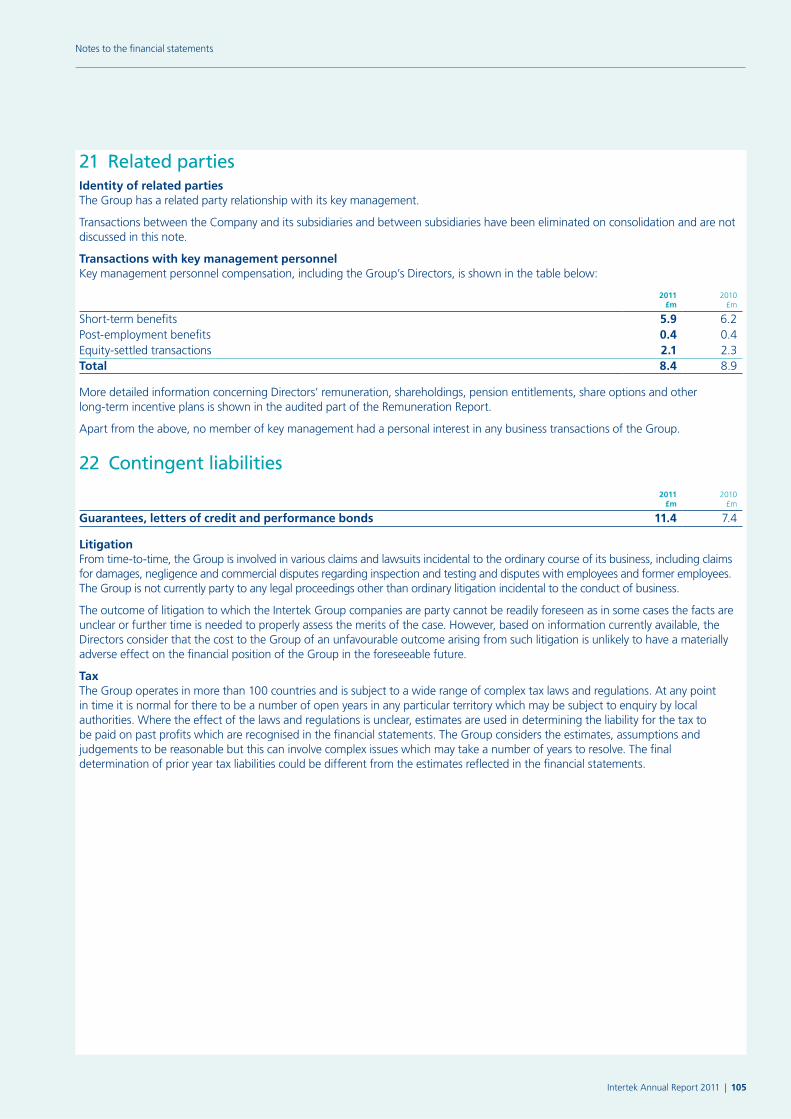
21 Related parties Identity of related partiesThe Group has a related party relationship with its key management.
Transactions between the Company and its subsidiaries and between subsidiaries have been eliminated on consolidation and are not discussed in this note.
Transactions with key management personnel Key management personnel compensation, including the Group’s Directors, is shown in the table below:
2011£m
2010£m
Short-term benefits 5.9 6.2Post-employment benefits 0.4 0.4Equity-settled transactions 2.1 2.3Total 8.4 8.9
More detailed information concerning Directors’ remuneration, shareholdings, pension entitlements, share options and other long-term incentive plans is shown in the audited part of the Remuneration Report.
Apart from the above, no member of key management had a personal interest in any business transactions of the Group.
22 Contingent liabilities
2011£m
2010£m
Guarantees, letters of credit and performance bonds 11.4 7.4
LitigationFrom time-to-time, the Group is involved in various claims and lawsuits incidental to the ordinary course of its business, including claims for damages, negligence and commercial disputes regarding inspection and testing and disputes with employees and former employees. The Group is not currently party to any legal proceedings other than ordinary litigation incidental to the conduct of business.
The outcome of litigation to which the Intertek Group companies are party cannot be readily foreseen as in some cases the facts are unclear or further time is needed to properly assess the merits of the case. However, based on information currently available, the Directors consider that the cost to the Group of an unfavourable outcome arising from such litigation is unlikely to have a materially adverse effect on the financial position of the Group in the foreseeable future.
TaxThe Group operates in more than 100 countries and is subject to a wide range of complex tax laws and regulations. At any point in time it is normal for there to be a number of open years in any particular territory which may be subject to enquiry by local authorities. Where the effect of the laws and regulations is unclear, estimates are used in determining the liability for the tax to be paid on past profits which are recognised in the financial statements. The Group considers the estimates, assumptions and judgements to be reasonable but this can involve complex issues which may take a number of years to resolve. The final determination of prior year tax liabilities could be different from the estimates reflected in the financial statements.
Intertek Annual Report 2011 | 105
Notes to the financial statements
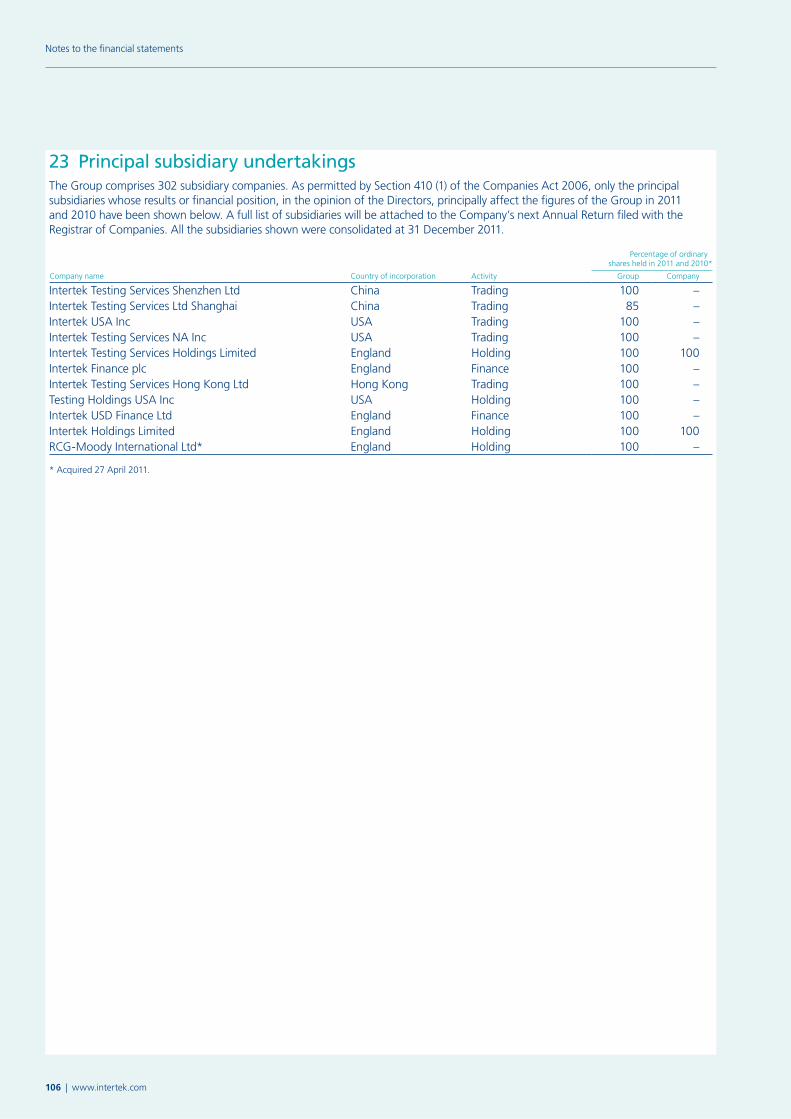
Notes to the financial statements
23 Principal subsidiary undertakings The Group comprises 302 subsidiary companies. As permitted by Section 410 (1) of the Companies Act 2006, only the principal subsidiaries whose results or financial position, in the opinion of the Directors, principally affect the figures of the Group in 2011 and 2010 have been shown below. A full list of subsidiaries will be attached to the Company’s next Annual Return filed with the Registrar of Companies. All the subsidiaries shown were consolidated at 31 December 2011.
Company name Country of incorporation Activity
Percentage of ordinary shares held in 2011 and 2010*
Group Company
Intertek Testing Services Shenzhen Ltd China Trading 100 –Intertek Testing Services Ltd Shanghai China Trading 85 –Intertek USA Inc USA Trading 100 –Intertek Testing Services NA Inc USA Trading 100 –Intertek Testing Services Holdings Limited England Holding 100 100Intertek Finance plc England Finance 100 –Intertek Testing Services Hong Kong Ltd Hong Kong Trading 100 –Testing Holdings USA Inc USA Holding 100 –Intertek USD Finance Ltd England Finance 100 –Intertek Holdings Limited England Holding 100 100RCG-Moody International Ltd* England Holding 100 –
* Acquired 27 April 2011.
106 | www.intertek.com

Intertek Group plc Company Balance SheetAs at 31 December 2011
Notes2011
£m2010
£m
Fixed assetsInvestments in subsidiary undertakings (d) 305.1 295.2
Current assetsDebtors due after more than one year (e) 54.0 43.6Debtors due within one year 2.6 1.7
56.6 45.3Cash at bank and in hand 0.6 0.2
57.2 45.5Creditors due within one yearOther creditors (1.3) (0.2)
Net current assets 55.9 45.3Total assets less current liabilities 361.0 340.5
Creditors due after more than one yearOther creditors – (0.1)Net assets 361.0 340.4
Capital and reservesCalled up share capital (f) 1.6 1.6Share premium (f) 256.7 256.3Profit and loss account (f) 102.7 82.5Shareholders’ funds 361.0 340.4
The financial statements on pages 107 to 110 were approved by the Board on 2 March 2012 and were signed on its behalf by:
Wolfhart Hauser Lloyd Pitchford Director Director
Intertek Annual Report 2011 | 107

Notes to the Company financial statements
(a) Accounting policies – Company The following accounting policies have been applied consistently in dealing with items which are considered material in relation to the Company’s financial statements.
Basis of preparation The financial statements have been prepared in accordance with applicable United Kingdom Accounting Standards and under the historical cost accounting rules.
Under Section 408 of the Companies Act 2006 the Company is exempt from the requirement to present its own profit and loss account.
The Company is exempt from the requirement to prepare a cash flow statement on the grounds that it is included in the consolidated financial statements which it has prepared.
Foreign currenciesTransactions in foreign currencies are recorded using the rate of exchange ruling at the date of the transaction. Monetary assets and liabilities in foreign currencies are translated into sterling at the rates of exchange prevailing at the balance sheet date. All foreign exchange differences are taken to the profit and loss account.
TaxationThe charge for taxation is based on the profit for the year and takes into account taxation deferred because of timing differences between the treatment of certain items for taxation and accounting purposes.
Deferred tax is recognised, without discounting, in respect of all timing differences between the treatment of certain items for taxation and accounting purposes, which have arisen but not reversed by the balance sheet date, except as otherwise required by FRS 19. Deferred tax assets in respect of timing differences are only recognised to the extent that it is more likely than not there will be suitable taxable profits to offset the future reversal of these timing differences.
Dividends on shares presented within shareholders’ funds Dividend income is recognised in profit or loss on the date that the Company’s right to receive payment is established.
Dividends unpaid at the balance sheet date are only recognised as a liability at that date to the extent that they are appropriately authorised and are no longer at the discretion of the Company. Unpaid dividends that do not meet these criteria are disclosed in the notes to the financial statements.
Investments in subsidiariesInvestments in subsidiaries are stated at cost less any provisions for impairment.
Intercompany financial guaranteesWhen the Company enters into financial guarantee contracts to guarantee the indebtedness of other companies in the Group, the Company considers these to be insurance arrangements and accounts for them as such. In this respect the Company treats the guarantee contract as a contingent liability, until such time as it becomes probable that the Company will be required to make a payment under the guarantee.
Share-based paymentsIntertek Group plc runs a share ownership programme that allows Group employees to acquire shares in the Company. Details of the share schemes are given in note 17 of the Group financial statements.
The fair value of options and share awards granted to employees of the Company is recognised as an employee expense with a corresponding increase in equity. As the Company has no employees, there is no recognition of an employee expense nor the corresponding increase in equity. However, the Company grants options and awards over its own shares to the employees of its subsidiaries and therefore the Company recognises an increase in the cost of investment in its subsidiaries, equivalent to the equity-settled share-based payment charge recognised in respect of employees of the subsidiaries, with the corresponding credit being recognised directly in equity.
The fair value is measured at grant date and is spread over the period during which the employee becomes unconditionally entitled to the options. The fair value granted is measured using the Monte Carlo model. This method, in calculating the fair value, takes into account various factors including the expected volatility of the shares, the dividend yield and the risk free interest rate.
The fair value of shares granted under the Intertek 2011 Long Term Incentive Plan is also measured using the Monte Carlo model and is spread over the period during which the employee becomes unconditionally entitled to the shares.
108 | www.intertek.com

(b) Profit and loss accountAmounts paid to the Company’s auditor and their associates in respect of services to the Company, other than the audit of the Company’s financial statements, have not been disclosed as the information is required instead to be disclosed on a consolidated basis.
The Company does not have any employees.
Details of the remuneration of the Directors are set out in the Remuneration Report.
(c) DividendsThe aggregate amount of dividends comprises:
2011£m
2010£m
Final dividend paid in respect of prior year but not recognised as a liability in that year 30.1 27.6Interim dividends paid in respect of the current year 17.1 14.9Aggregate amount of dividends paid in the financial year 47.2 42.5
The aggregate amount of dividends proposed and recognised as liabilities as at 31 December 2011 is £nil (2010: £nil). The aggregate amount of dividends proposed and not recognised as liabilities as at 31 December 2011 is £36.8m (2010: £30.0m).
(d) Investment in subsidiary undertakings2011
£m2010
£m
Cost and net book valueAt 1 January 295.2 289.6Additions due to share-based payments 9.5 7.4Adjustments/(disposals) 0.4 (1.8)At 31 December 305.1 295.2
The Company has granted options over its own shares and made share awards to the employees of its direct and indirectly-owned subsidiaries, and as such, the Company recognises an increase in the cost of investment in subsidiaries of £9.5m (2010: £7.4m). Details of the principal operating subsidiaries are set out in note 23 to the Group financial statements.
The Company had two direct subsidiary undertakings at 31 December 2011. Intertek Testing Services Holdings Limited and Intertek Holdings Limited, both of which are holding companies, are incorporated in the United Kingdom and registered in England and Wales. All interests are in the ordinary share capital and all are wholly owned. In the opinion of the Directors, the value of the investments in subsidiary undertakings is not less than the amount at which the investments are stated in the balance sheet.
There is no impairment to the carrying value of these investments.
(e) Debtors due after more than one year 2011
£m2010
£m
Amounts owed by Group undertakings 54.0 43.6
The amounts owed by Group undertakings represent long-term loans due in two to five years, which carry interest based on the denomination of the borrowing currency.
Intertek Annual Report 2011 | 109
Notes to the Company financial statements

(f) Reconciliation of movements in shareholders’ fundsShare
capital£m
Share premium
£m
Profit and loss
£mTotal
£m
At 1 January 2010 1.6 253.5 56.3 311.4Profit for the financial year – – 61.8 61.8Dividends paid – – (42.5) (42.5)Credit in relation to share-based payments – – 7.4 7.4Purchase of own shares – – (0.5) (0.5)Shares issued – 2.8 – 2.8At 31 December 2010 1.6 256.3 82.5 340.4Profit for the financial year – – 65.7 65.7Dividends paid – – (47.2) (47.2)Credit in relation to share-based payments – – 9.5 9.5Purchase of own shares – – (7.8) (7.8)Shares issued – 0.4 – 0.4At 31 December 2011 1.6 256.7 102.7 361.0
Details of share capital are set out in note 15 and details of share based payments are set out in note 17 to the Group financial statements.
A profit and loss account for Intertek Group plc has not been presented as permitted by Section 408 of the Companies Act 2006. The profit for the financial year, before dividends paid to shareholders of £47.2m (2010: £42.5m) was £65.7m (2010: £61.8m) which was mainly in respect of dividends received from subsidiaries.
During the year ended 31 December 2011, the Company purchased, through its Employee Benefit Trust, 420,332 (2010: 31,000) of its own shares with an aggregate nominal value of £4,203 (2010: £310) for £7.8m (2010: £0.5m) which was debited to profit and loss in equity.
(g) Related party transactionsDetails of related party transactions are set out in note 21 of the Group financial statements.
(h) Contingent liabilitiesThe Company is a member of a group of UK companies that are part of a composite banking cross guarantee arrangement. This is a joint and several guarantee given by all members of the Intertek UK cash pool, guaranteeing the total gross liability position of the pool which was £20.0m at 31 December 2011 (2010: £14.1m).
From time-to-time, in the normal course of business, the Company may give guarantees in respect of certain liabilities of subsidiary undertakings.
(i) Post balance sheet eventsDetails of post balance sheet events relevant to the Company and the Group are given in note 18 of the Group financial statements.
110 | www.intertek.com110 | www.intertek.com
Notes to the Company financial statements

Intertek Annual Report 2011 | 111
Shareholder and Corporate Information
Shareholders’ EnquiriesAny shareholder with enquiries relating to their shareholding should, in the first instance, contact our Registrars, Equiniti using the address on this page.
Electronic Shareholder CommunicationsShareholders who would prefer to view documentation electronically can elect to receive automatic notification by email each time the Company distributes documents, instead of receiving a paper version of such documents. Registering for electronic communication is very straightforward and can be done via shareview, www.shareview.co.uk. Shareview is Equiniti’s suite of online services that helps shareholders to manage their holdings and give access to a wide range of useful information.
There is no fee for using this service and shareholders will automatically receive confirmation that a request has been registered. To request a paper version of any document in the future, shareholders may contact the Registrar by email or by post.
The facility also allows shareholders to view their holding details, find out how to register a change of name or what to do if a share certificate is lost, as well as download forms in respect of changes of address, dividend mandates and share transfers.
Share Dealing ServiceA share dealing service for the purchase or sale of shares in Intertek is available through J.P. Morgan Cazenove, whose details are as follows:
J.P. Morgan Cazenove10 Aldermanbury2nd FloorLondon EC2V 7RFT: +44 20 7155 5338
ShareGiftIf you have a small shareholding which is uneconomical to sell, you may want to consider donating it to ShareGift. The Orr Mackintosh Foundation operates this charity share donation scheme. Details of the scheme are available from:
ShareGift at www.sharegift.orgT: +44 20 7930 3737
Share Price InformationInformation on the Company’s share price is available from the investor pages of www.intertek.com
Financial CalendarFinancial year end 31 December 2011Results announced 5 March 2012Annual General Meeting 17 May 2012Ex-dividend date for final dividend 6 June 2012Record date for final dividend 8 June 2012Final dividend payable 22 June 2012Interim results announced 26 July 2012Ex-dividend date for interim dividend 31 October 2012Record date for interim dividend 2 November 2012Interim dividend payable 16 November 2012
All future dates are indicative and subject to change.
Investor relationsE: [email protected]: +44 20 7396 3400
RegistrarsEquinitiAspect House Spencer RoadLancingWest Sussex BN99 6DAT: 0871 384 2653 (UK)*T: +44 121 415 7047 (outside UK)
* Calls to this number cost 8p per minute from a BT landline, other providers costs may vary. Lines open 8.30am to 5.30pm, Monday to Friday.
AuditorsKPMG Audit Plc15 Canada SquareLondon E14 5GLT: +44 20 7311 1000
BrokersJ.P. Morgan Cazenove10 Aldermanbury2nd FloorLondon EC2V 7RFT: +44 20 7155 5338
Goldman Sachs InternationalPeterborough Court133 Fleet StreetLondon EC4A 2BBT: +44 20 7774 1000
Registered OfficeIntertek Group plc25 Savile RowLondon W1S 2EST: +44 20 7396 3400F: +44 20 7396 3480www.intertek.com
Registered number: 4267576
ISIN: GB0031638363
London Stock ExchangeSupport ServicesFTSE 100Symbol: ITRK
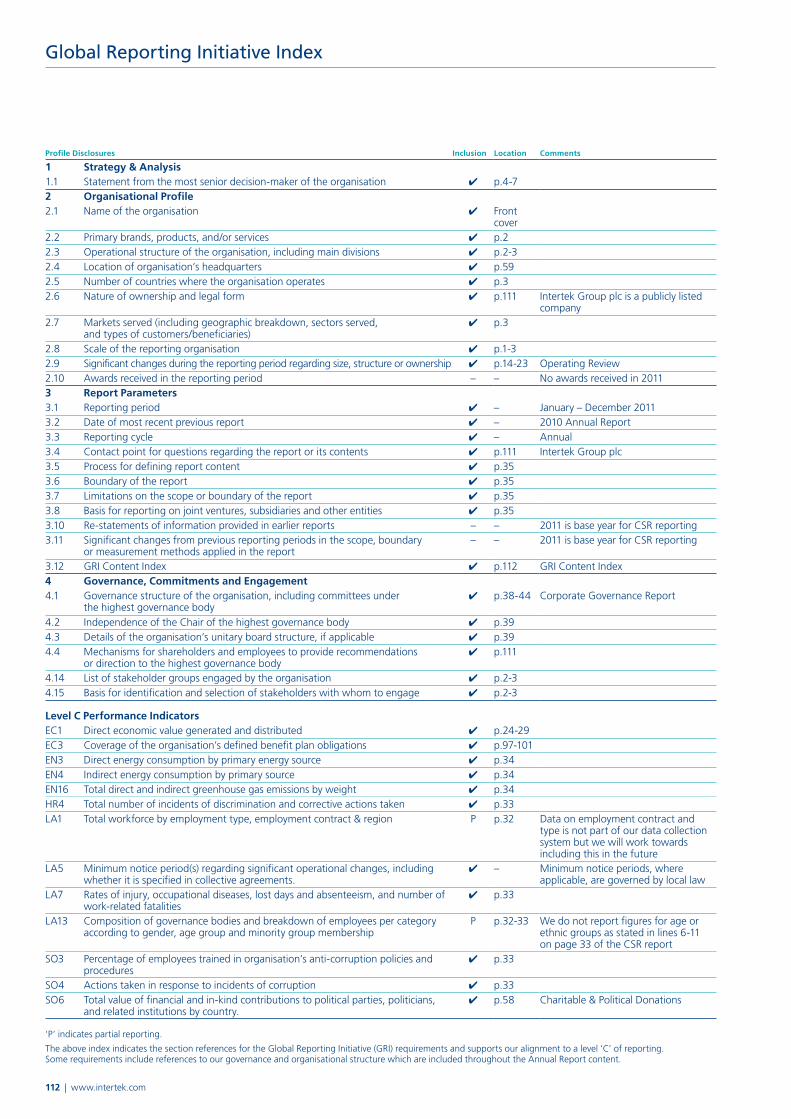
112 | www.intertek.com
Global Reporting Initiative Index
Profile Disclosures Inclusion Location Comments
1 Strategy & Analysis1.1 Statement from the most senior decision-maker of the organisation � p.4-72 Organisational Profile2.1 Name of the organisation � Front
cover2.2 Primary brands, products, and/or services � p.22.3 Operational structure of the organisation, including main divisions � p.2-32.4 Location of organisation’s headquarters � p.592.5 Number of countries where the organisation operates � p.32.6 Nature of ownership and legal form � p.111 Intertek Group plc is a publicly listed
company 2.7 Markets served (including geographic breakdown, sectors served,
and types of customers/beneficiaries)� p.3
2.8 Scale of the reporting organisation � p.1-32.9 Significant changes during the reporting period regarding size, structure or ownership � p.14-23 Operating Review2.10 Awards received in the reporting period – – No awards received in 20113 Report Parameters3.1 Reporting period � – January – December 20113.2 Date of most recent previous report � – 2010 Annual Report3.3 Reporting cycle � – Annual3.4 Contact point for questions regarding the report or its contents � p.111 Intertek Group plc3.5 Process for defining report content � p.353.6 Boundary of the report � p.353.7 Limitations on the scope or boundary of the report � p.353.8 Basis for reporting on joint ventures, subsidiaries and other entities � p.353.10 Re-statements of information provided in earlier reports – – 2011 is base year for CSR reporting3.11 Significant changes from previous reporting periods in the scope, boundary
or measurement methods applied in the report– – 2011 is base year for CSR reporting
3.12 GRI Content Index � p.112 GRI Content Index4 Governance, Commitments and Engagement4.1 Governance structure of the organisation, including committees under
the highest governance body� p.38-44 Corporate Governance Report
4.2 Independence of the Chair of the highest governance body � p.394.3 Details of the organisation’s unitary board structure, if applicable � p.394.4 Mechanisms for shareholders and employees to provide recommendations
or direction to the highest governance body� p.111
4.14 List of stakeholder groups engaged by the organisation � p.2-34.15 Basis for identification and selection of stakeholders with whom to engage � p.2-3
Level C Performance IndicatorsEC1 Direct economic value generated and distributed � p.24-29EC3 Coverage of the organisation’s defined benefit plan obligations � p.97-101EN3 Direct energy consumption by primary energy source � p.34EN4 Indirect energy consumption by primary source � p.34EN16 Total direct and indirect greenhouse gas emissions by weight � p.34HR4 Total number of incidents of discrimination and corrective actions taken � p.33LA1 Total workforce by employment type, employment contract & region P p.32 Data on employment contract and
type is not part of our data collection system but we will work towards including this in the future
LA5 Minimum notice period(s) regarding significant operational changes, including whether it is specified in collective agreements.
� – Minimum notice periods, where applicable, are governed by local law
LA7 Rates of injury, occupational diseases, lost days and absenteeism, and number of work-related fatalities
� p.33
LA13 Composition of governance bodies and breakdown of employees per category according to gender, age group and minority group membership
P p.32-33 We do not report figures for age or ethnic groups as stated in lines 6-11 on page 33 of the CSR report
SO3 Percentage of employees trained in organisation’s anti-corruption policies and procedures
� p.33
SO4 Actions taken in response to incidents of corruption � p.33SO6 Total value of financial and in-kind contributions to political parties, politicians,
and related institutions by country.� p.58 Charitable & Political Donations
‘P’ indicates partial reporting.
The above index indicates the section references for the Global Reporting Initiative (GRI) requirements and supports our alignment to a level ‘C’ of reporting. Some requirements include references to our governance and organisational structure which are included throughout the Annual Report content.

Designed and produced by
This report has been printed in the UK by Pureprint Group, a CarbonNeutral® company, using their environmental printing technology. Vegetable based inks were used throughout.
The paper is Amadeus 50% Recycled and the pulp is bleached using a totally chlorine free (TCF) process. Both printer and paper mill are ISO14001 and registered to EMAS.

Intertek Group plc25 Savile RowLondonW1S 2ESUnited Kingdomt: +44 20 7396 3400f: +44 20 7396 3480e: [email protected]