young adults and higher education: barriers and...
TRANSCRIPT

National Poverty Center Working Paper Series
#10-08
August 2010
Young Adults and Higher Education: Barriers and
Breakthroughs to Success
Thomas Brock, MDRC
This paper is available online at the National Poverty Center Working Paper Series index at:
http://www.npc.umich.edu/publications/working_papers/
Any opinions, findings, conclusions, or recommendations expressed in this material are those of the author(s) and do
not necessarily reflect the view of the National Poverty Center or any sponsoring agency.

Young Adults and Higher Education: Barriers and Breakthroughs to Success
VOL. 20 / NO. 1 / SPRING 2010 109
Young Adults and Higher Education: Barriers and Breakthroughs to Success
Thomas Brock
SummaryAlthough access to higher education has increased substantially over the past forty years, stu-dent success in college—as measured by persistence and degree attainment—has not improved at all. Thomas Brock reviews systematic research findings on the effectiveness of various inter-ventions designed to help at-risk students remain in college.
Brock shows how changes in federal policy and public attitudes since the mid-1960s have opened up higher education to women, minorities, and nontraditional students and also shifted the “center of gravity” in higher education away from traditional four-year colleges toward nonselective community colleges. Students at two-year colleges, however, are far less likely than those at four-year institutions to complete a degree. Brock argues that the nation’s higher education system must do much more to promote student success. Three areas, he says, are particularly ripe for reform: remedial education, student support services, and financial aid.
In each of these three areas, Brock reviews programs and interventions that community col-leges have undertaken in order to raise completion rates. Some colleges have, for example, experimented with remedial programs that build social cohesion between students and fac-ulty and integrate content across courses. Other colleges have tested student support service programs that offer counseling and advising that are regular, intensive, and personalized. Still others have experimented with ways to simplify the financial aid application process and incen-tivize students to earn good grades and persist in school.
Research shows that such programs and interventions can improve student outcomes, but Brock argues that more must be done to bring proven practices to scale and to test new ideas that might lead to better results. Institutions that most need help are those that provide the greatest access to nontraditional and underprepared students in community colleges and less selective universities.
www.futureofchildren.org
Thomas Brock is the director of the Young Adults and Postsecondary Education Policy Area at MDRC.

110 THE FUTURE OF CHILDREN
Thomas Brock
Few decisions matter more to a young person’s future than the decision to attend college and earn a degree. As described by Sheldon Danziger and David
Ratner in their article in this volume, college graduates have substantially better prospects in the labor market than peers who stop their formal education after high school. In fact, over a lifetime, an adult with a bachelor’s degree will earn about $2.1 million—roughly one-third more than an adult who starts but does not complete college and nearly twice as much as one who has only a high school diploma.1 College attendance and completion provide other benefits as well. For example, adults who have attended some college or earned a bachelor’s degree are more likely to report “excellent” or “very good” health than those who have only a high school diploma, even when they have comparable incomes.2 College is often where people form their deepest friendships and meet future spouses or partners. Finally, as Constance Flanagan and Peter Levine discuss in their article in this volume, research shows that educational attainment has positive effects on voting and other measures of civic engagement.3
Clearly, many of the benefits that accrue from a college education are explained by the knowledge, skills, and contacts that students gain from their time on campus and in the classroom. From a developmental standpoint, colleges and universities also provide a safe environment for young adults to explore new ideas and interests, interact with people who are different from themselves, and form their identity. For all these reasons, colleges and universities play an indispensable role in the transition to adulthood. At their best, they foster both intellectual and personal growth and prepare young people for productive lives at work and in society. Few public or
private institutions have the capacity to do so much good for so many.
My purpose in this article is to examine data on college enrollment and completion in the United States and to explore what might be done to help more young people benefit from the experience and complete college degrees. I begin by reviewing historical trends to show how the numbers and characteristics of col-lege students have changed in the past forty years. Access to higher education, it turns out, has increased substantially, although some racial and ethnic groups remain underrepre-sented. But success in college—as measured by persistence and degree attainment—has not improved at all. I then examine some leading explanations for why college students do not succeed and review some research findings on interventions designed to help at-risk students overcome barriers. I conclude with some lessons and suggestions to guide policy makers, practitioners, and researchers.
The Changing Landscape of Higher Education: 1965–2005Before 1965, American colleges and universi-ties were rarefied places populated mostly by
Access to higher education has increased substantially, although some racial and ethnic groups remain underrepresented. But success in college—as measured by persistence and degree attainment— has not improved at all.

VOL. 20 / NO. 1 / SPRING 2010 111
Young Adults and Higher Education: Barriers and Breakthroughs to Success
white males from middle- or upper-income families. In part, the lack of diversity reflected the fact that for much of the nation’s history, a college education was not needed to make a decent living. Indeed, after World War II, the difference between the average wages of high school and college graduates was small and shrinking. After 1950, however, the trend moved in the opposite direction and accelerated as the demand for highly skilled labor increased.4 In 1975, year-round workers with a bachelor’s degree earned 1.5 times the annual pay of workers with only a high school diploma; by 1999, that ratio had risen to 1.8.5
Prevailing social norms and a limited federal role in higher education also served to keep higher education an exclusive domain before the 1960s. In many parts of the country, discriminatory laws and attitudes kept many blacks and other racial or ethnic minorities from pursuing a college degree. Prevailing attitudes about the role of women limited their college-going as well. Finally, before 1965, financial aid was not generally available for college students. The federal G.I. Bill had covered college costs for tens of thousands of veterans after World War II, but it, too, had “masculinized” campus life and had aided whites far more than African Americans.6
The mid-to-late 1960s marked a major turn-ing point. Changes in federal policy, coupled with big changes in public attitudes and expectations, opened up higher education as never before. From a policy perspective, the passage of the Higher Education Act of 1965 was arguably the most important change, as it extended need-based financial assistance to the general population for the first time.7 The federal role expanded in other ways, too, fueling growth on college and university campuses. Starting in 1963, for example,
the federal government launched a major program for facilities construction, target-ing “developing institutions” like community colleges and historically black colleges and universities.8 Federal spending on higher education increased exponentially, from $655 million in 1956 to $3.5 billion in 1966.9
During the same period, the civil rights movement influenced higher education by challenging public laws and practices that excluded blacks and other minority groups from attending some colleges and universi-ties, particularly in the South. Early battles focused on winning admittance for individual students. In 1964, Congress passed the Civil Rights Act, which outlawed discrimination based on race in schools, public places, and employment and mandated equal opportu-nity for women. By the late 1960s, civil rights activists broadened their perspective to encompass poverty and income inequality and helped launch dozens of Great Society programs that funded education and job training programs targeted to low-income Americans.10
Demographic trends, combined with the social activism of the 1960s, also created pressure for change. As the baby boom generation reached maturity, young adults poured onto college campuses in record numbers. Colleges and universities became centers of protest, most famously against the Vietnam War, but also against all manner of social convention and custom.11 Rules gov-erning higher education were not above the fray. Questions of who should have access—and what role colleges and universities should play in confronting and reducing inequities in the larger society—were hotly debated. The “open admissions” movement gained currency during this era, most famously with the 1970 decision by the City University of
112 THE FUTURE OF CHILDREN
Thomas Brock
New York to allow all high school graduates to pursue college degrees regardless of aca-demic preparation. Other institutions across the country, notably community colleges, adopted similar policies.12
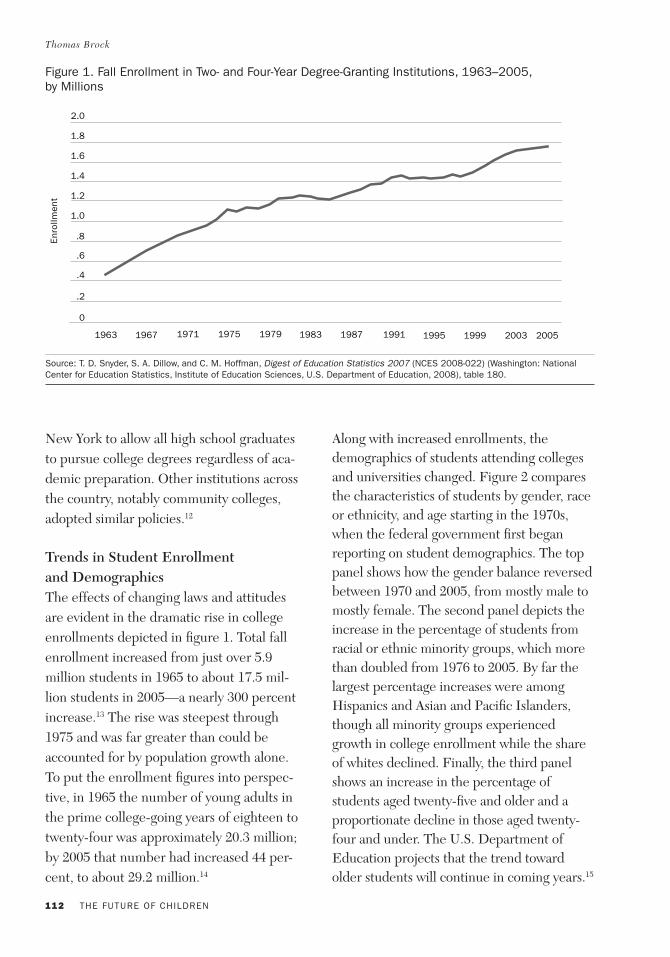
Trends in Student Enrollment and DemographicsThe effects of changing laws and attitudes are evident in the dramatic rise in college enrollments depicted in figure 1. Total fall enrollment increased from just over 5.9 million students in 1965 to about 17.5 mil-lion students in 2005—a nearly 300 percent increase.13 The rise was steepest through 1975 and was far greater than could be accounted for by population growth alone. To put the enrollment figures into perspec-tive, in 1965 the number of young adults in the prime college-going years of eighteen to twenty-four was approximately 20.3 million; by 2005 that number had increased 44 per-cent, to about 29.2 million.14
Along with increased enrollments, the demographics of students attending colleges and universities changed. Figure 2 compares the characteristics of students by gender, race or ethnicity, and age starting in the 1970s, when the federal government first began reporting on student demographics. The top panel shows how the gender balance reversed between 1970 and 2005, from mostly male to mostly female. The second panel depicts the increase in the percentage of students from racial or ethnic minority groups, which more than doubled from 1976 to 2005. By far the largest percentage increases were among Hispanics and Asian and Pacific Islanders, though all minority groups experienced growth in college enrollment while the share of whites declined. Finally, the third panel shows an increase in the percentage of students aged twenty-five and older and a proportionate decline in those aged twenty-four and under. The U.S. Department of Education projects that the trend toward older students will continue in coming years.15
Source: T. D. Snyder, S. A. Dillow, and C. M. Hoffman, Digest of Education Statistics 2007 (NCES 2008-022) (Washington: National Center for Education Statistics, Institute of Education Sciences, U.S. Department of Education, 2008), table 180.
Figure 1. Fall Enrollment in Two- and Four-Year Degree-Granting Institutions, 1963–2005, by Millions
.4
.2
0
.6
.8
1.0
1.2
1.4
1.6
1.8
2.0
1963 1967 1975 19791971 1983 1999 2003 2005199519911987
Enro
llment

VOL. 20 / NO. 1 / SPRING 2010 113
Young Adults and Higher Education: Barriers and Breakthroughs to Success
The shift in demographic characteristics hints at another significant development in the student population. The so-called traditional undergraduate—the high school graduate who enrolls full-time immediately after fin-ishing high school, relies on parents for finan-cial support, and either does not work during the school year or works only part-time—is now the exception rather than the rule. Only 27 percent of undergraduates met these criteria in 1999–2000. By comparison, in the same year, 28 percent of undergraduates met the Department of Education’s definition of “highly nontraditional”: they were likely in their twenties or older, working while going to school, and raising children (possibly as single parents), among other criteria. Some highly nontraditional students did not have a high school diploma.16
Patterns of Institutional AttendanceGovernment statistics show that a large majority of undergraduates enroll in four-year colleges and universities. At the same time, the “center of gravity” in higher educa-tion has gradually shifted, with community colleges playing a much more prominent role today than in the past. In 1969 (when the government adopted its current methodology for categorizing two- and four-year schools), 26 percent of all college students attended two-year institutions. By 2005, that figure had risen to 37 percent.17
The vast majority of students enroll in publicly funded colleges and universities. In 2005, private institutions accounted for about one-fourth of all undergraduates—a figure that has increased only slightly in the past decade. Nearly all of these students are enrolled in four-year institutions, though a small percentage of students is enrolled in private two-year colleges.18 The advent of online courses may be changing higher
education again. Indeed, two of the five largest higher education institutions in 2005 rely principally on online instruction: the University of Phoenix, with an enrollment of more than 117,000 students, and Western International University, with an enrollment of nearly 51,000 students.19
Although the demographic composition of colleges and universities has become more diverse over the past forty years, the increased diversity is largely accounted for by
Figure 2. Characteristics of Students Attending College, by Gender, Race and Ethnicity, and Age, 1970 and 2005
Source: Same as figure 1, tables 187, 217, and 181.
Female
Male
Gender
1970 2005
1976 2005
24 + up
24 + under
Age
1970 2005
White
Race and ethnicity
Black
Hispanic
Asian/Pacific Islander
AmericanIndian/AlaskanNative
Non-residentalien

114 THE FUTURE OF CHILDREN
Thomas Brock
nonselective institutions. Specifically, female, black, and Hispanic students are dispropor-tionately enrolled in community colleges.20 Nontraditional students are also much more likely to be enrolled in community colleges and to participate in distance education via the Internet.21
Trends in Persistence and CompletionGovernment statistics indicate that student outcomes differ markedly by type of institu-tion attended. Specifically, undergraduates who begin at four-year colleges and universi-ties are about twice as likely to complete a postsecondary degree as undergraduates who begin at two-year institutions. The five-year completion rate for students who began at a four-year college or university—taking into account certificates, associate’s degrees, or bachelor’s degrees—was 60 percent in the 1995–96 academic year. For students who began at a community college, the rate of completion was 32 percent.22
Many students take longer than five years to earn a degree: some are enrolled part-time, some change their majors, some need to drop out temporarily, and some have other reasons for the delay. Measures of persistence take into account those who have earned a certificate or degree as well as those who are still enrolled in college. Eighty percent of students who began at a four-year col-lege or university in 1995–96 persisted after five years. Among students who began at a community college, the persistence rate was 52 percent. The data also show that students attending private institutions (both four-year and two-year) persist at higher rates than their counterparts at public institutions.23
Viewed historically, rates of comple-tion at four-year institutions have been unchanged since the federal government
began collecting data during the 1970s. A recent study suggests that there has been a slight uptick in the persistence rate at public four-year colleges.24 Although that increase may seem contradictory, it likely reflects the longer time it now takes students in four-year colleges, particularly at less selective public institutions, to earn degrees.25 Historical data on students attending community college go back only to 1990, but show no significant change in persistence or completion.26
Persistence and completion rates differ significantly by race and ethnicity and by gen-der. At public two- and four-year institutions, Asian and Pacific Islanders have the highest persistence and completion rates of any racial or ethnic group, followed by non-Hispanic whites, Hispanics, and non-Hispanic blacks. (The longitudinal studies commissioned by the government lack sufficient numbers of American Indians and Alaska Natives on which to report.) Asian and Pacific Islanders who entered public four-year institutions in 1995–96 were nearly twice as likely to earn a degree or still be in school after six years as non-Hispanic blacks who entered the same year. The story by gender is a bit more complicated. At public four-year institutions, women have slightly higher persistence and completion rates than men (a difference of about 5 percentage points); at public two-year institutions, the gender difference is reversed.27 It is important to recall that because more women than men enroll in college, many more associate’s and bachelor’s degrees are awarded to women—a pattern that has held true at both two- and four-year institutions since at least the late 1980s.28
Despite these patterns, neither race and ethnicity nor gender is a good predictor of who will earn a college degree, owing to large variation within these demographic groups.

VOL. 20 / NO. 1 / SPRING 2010 115
Young Adults and Higher Education: Barriers and Breakthroughs to Success
Research by Clifford Adelman for the Department of Education shows that the two best predictors are entering college immedi-ately after finishing high school and taking a high school curriculum that stresses reading at grade level and math beyond basic algebra. Higher socioeconomic status is also a predic-tor, though only moderately so.29 Consistent with these findings, being classified as a traditional student is another strong predictor of college completion. Conversely, all of the characteristics used to define nontraditional status—delayed entry into college from high school, working full-time, single parenthood, and so on—are considered “risk factors” because they are negatively correlated with persistence.30 As noted, community colleges account for a disproportionate share of nontraditional students; they are also the institutions that raise the most concern about persistence and completion.
Summary of Trends and Key Issues Access to higher education has been greatly expanded since the mid-1960s. More students are attending college—both in real terms and as a percentage of the population—and they are demographically more diverse. Actions taken by the federal government clearly played a major part in these trends, though larger economic, demographic, and social forces were also at play. Finally, the growth of nonselective institutions like community colleges and, more recently, online courses and programs has made it easier for people to attend college even if they lack good prepara-tion or are working while going to school.
Despite these gains, college access remains problematic, and gaps in enrollment between certain racial and ethnic minority groups are substantial. In 2006, for example, 44 percent of whites between the ages of eighteen and twenty-four were enrolled in college,
compared with 32 percent of blacks and 25 percent of Hispanics.31 Rates of college attendance for black and Hispanic males are particularly low. A recent national survey of college-qualified students who did not enroll in college underscores that college costs, availability of aid, and uncertainty about the steps needed to enroll in college remain significant deterrents.32 Inadequate prepara-tion for college is another factor, though with the rise of nonselective institutions, it is less a barrier to access than to success once students have enrolled in college.
From a public policy standpoint, it makes little sense to promote greater college access if students are failing once they get there. Figuring out how to boost college completion is the challenge. The United States has seen no progress on this measure since the advent of statistics on it and is losing ground to other nations in the share of the adult population with college degrees.33 The costs of such failure—to students especially, but also to colleges, governments, and society at large—are extremely high. I next examine why some students don’t succeed and what might be done in response.
Improving Academic Outcomes for Students in Higher EducationThe search for solutions to the college persis-tence and completion problem begins with an understanding of its underlying causes. In his seminal book Leaving College, Vincent Tinto examines why students depart prematurely from both two-year and four-year institutions. He acknowledges that students come to col-lege with different skills and abilities, vary-ing personal motivation and objectives, and diverse external commitments that will influ-ence their ability to succeed, but he argues that what happens to them after they arrive on campus is at least as important as what

116 THE FUTURE OF CHILDREN
Thomas Brock
happened before. Specifically, he focuses on how well students are integrated into the classrooms and laboratories where instruc-tion takes place and into the informal meet-ing places such as dormitories, cafeterias, and hallways. In all of these situations, he notes, the quality and frequency of interac-tions between students, faculty, and staff will shape students’ experiences and determine how well they “fit” at a particular institution.34 Other theorists have placed greater weight on how cultural norms and organizational structures and processes may affect student success, but generally support Tinto’s dual emphasis on student attributes and institu-tional practices as the keys to understanding college persistence and completion.35
Some observers have argued that the prob-lem of low persistence and completion would go away if primary and secondary schools did a better job of preparing students for col-lege. There is certainly truth to this claim, and another article, if not a book, could be written on educational reforms and college preparatory programs that target younger students.36 But these reforms and programs will always fail to reach some students, and blaming the nation’s schools for poor college completion rates lets colleges and universi-ties off the hook too easily. America’s higher education system has many strengths, but it is far from perfect, and policy makers and insti-tutions can do much more to promote greater student success. Three areas seem particu-larly ripe for reform: remedial education, student support services, and financial aid.
Rethinking Remedial EducationThat many students arrive on college cam-puses unprepared to do college-level work is well known. Both two- and four-year institu-tions face this deficit, though the nation has made a conscious policy choice in recent
years to shift the primary teaching responsi-bility for remedial education to community colleges. The most recent data from the Department of Education indicate that 42 percent of freshmen at community colleges enroll in at least one remedial reading, writ-ing, or mathematics course. At private and public four-year institutions, the figure ranges from 12 to 24 percent.37
Research and anecdotal evidence suggest that many students who are assigned to remedial education drop out of the classes (and often out of college) and that those who remain make slow progress. An analysis of data from the Department of Education’s National Education Longitudinal Study shows that only 28 percent of remedial students in two-year colleges attain a degree or certifi-cate within eight and one-half years of entry (compared with 43 percent of nonremedial students), and that 52 percent of remedial students in four-year colleges finish bach-elor’s degrees within this period (compared with 78 percent of students without remedial course work). The analysis also shows that remedial education delays time-to-degree for students in two-year colleges. Though seldom acknowledged, remedial education acts as a gatekeeper and quality control mechanism in most institutions.38 It allows underpre-pared students access to campus facilities and resources, yet clearly divides them from students considered to be “college ready.”
Is this the best that colleges and universities can do, or is it possible to remake remedial education so that greater numbers of stu-dents acquire basic skills and go on to earn college degrees? Many educators believe that change is possible, noting the propensity of remedial education classes to use outmoded teaching methods—including repetition and memorization of material that does not

VOL. 20 / NO. 1 / SPRING 2010 117
Young Adults and Higher Education: Barriers and Breakthroughs to Success
connect to students’ interests—and to isolate and marginalize students from the rest of the college community.39 Many reforms have been suggested or tried, but relatively few have been evaluated in a way that establishes a causal relationship between the reforms and educational attainment.40
A notable exception is an evaluation of a Learning Communities program at Kingsborough Community College in Brooklyn, New York, one of four sites in a national demonstration project called Opening Doors.41 The goal of Opening Doors was to test interventions designed to increase persistence and raise academic achievement among low-income community college students. At all of the Opening Doors sites, students were randomly assigned either to a program group that received an enhanced set of services or to a control group that experi-enced “business as usual” at the college. Random assignment ensures that the students in the program and control groups are similar at baseline; subsequent differences in educa-tional attainment or other outcomes can therefore be attributed to the intervention, rather than to differences in student motiva-tion or characteristics. The Opening Doors research was conducted by MDRC, in
partnership with the MacArthur Network on Transitions to Adulthood. I discuss the other Opening Doors interventions later.
Kingsborough’s Learning Communities pro-gram targeted incoming freshmen, the great majority of whom required remedial English. Students were placed into groups of fifteen to twenty-five to take three of their first-semester courses together: an English course (based on level of proficiency, but usually remedial); a regular college course like intro-ductory psychology or health; and a student success course, taught by a college counselor, that covered time management, effective study habits, and other skills considered necessary to succeed in college. Faculty who taught in the Learning Communities were expected to coordinate assignments and meet periodically to review student progress. The idea was to build social cohesion between students and faculty and to make the sub-ject matter more meaningful to students by integrating the content and helping students apply the concepts and lessons across the courses.42
More than 1,500 students participated in the Learning Communities evaluation and were, as noted, randomly assigned to either a program group that participated in Learning Communities or a control group that took regular, unlinked courses. The students were young (mostly seventeen to twenty years old), low-income, and highly diverse in terms of race and ethnicity. Researchers tracked program and control group members for two years and found that students in the Learning Communities were more likely to feel integrated at school and to be engaged in their courses and with fellow students and instructors. They also passed more courses and earned more credits during their first semester, moved more quickly through
Many reforms have been suggested or tried, but relatively few have been evaluated in a way that establishes a causal relationship between the reforms and educational attainment.

118 THE FUTURE OF CHILDREN
Thomas Brock
remedial English requirements, and were more likely to take and pass an English skills assessment test that was required for gradua-tion. It is important to note that these effects, while statistically significant, were generally modest. For example, after four semesters, students in the program group earned an average of 33.2 college credits, compared with an average of 30.8 credits for the control group (a difference of 2.4 credits, or less than one standard college course). Moreover, contrary to expectations, the Learning Communities did not have an immediate effect on persistence. Kingsborough is only one test, however, and a new set of random-ized trials is under way to determine whether similarly structured programs at six com-munity colleges around the country will help students complete remedial English or math requirements and persist.43
As noted, one of the underlying concepts of Learning Communities is to make the course material more meaningful to students by linking the information covered in one class to the discussions and assignments in another class. Another way to make remedial educa-tion more meaningful is exemplified by Washington State’s Integrated Basic Education and Skills Training (I-BEST) program. I-BEST offers “contextualized instruction,” which integrates basic English and math skills into college-level career or technical training in fields such as nursing, early childhood education, automobile repair, and data entry. For example, nursing students in the I-BEST program attend English classes that emphasize medical terminology and writing used in health care settings. If students have trouble making sense of the words because of limited English proficiency, they receive additional help in learning basic language skills.
A recent evaluation comparing academic outcomes for 900 I-BEST participants with those of more than 31,000 students in regular remedial courses in Washington State com-munity colleges found that I-BEST students had higher persistence rates, earned more credits toward a college credential, earned more occupational certificates, and showed greater increases on remedial education tests. The evaluation did not use a random-assignment design and therefore cannot eliminate the possibility that students who were selected into I-BEST were more motivated or had other characteristics that may have distinguished them from students in regular remedial courses, although the authors controlled for observed differences in student backgrounds and enrollment patterns. The results suggest that the model holds promise and should be subject to more rigorous experimental evaluation in the future.44
Another approach to reforming remedial education is to accelerate the pace at which students move through it. For example, students who test just below college level may be assigned to a short-term review class rather than a full-semester course. Alternatively, colleges may set up basic skills “immersion” courses that are shorter in duration but require more hours of atten-dance each week, to help students master the material more quickly. Such courses can be offered during the regular semester or during breaks between semesters.45 Incoming students may also be targeted for intensive remediation before they start classes to help them do better on basic skills assess-ment tests and possibly avoid remediation altogether. A summer “bridge” program in Texas, for example, offers remedial English and math instruction along with general study skills to students who just finished high school and are about to enroll in a

VOL. 20 / NO. 1 / SPRING 2010 119
Young Adults and Higher Education: Barriers and Breakthroughs to Success
community college or public university. To date, researchers have not produced evi-dence on whether acceleration or immersion strategies improve student outcomes, though the Texas summer bridge program began undergoing a random-assignment evaluation in summer 2009.46
Many other promising remedial education reforms have been suggested or tried. The Carnegie Foundation for the Advancement of Teaching, for example, encourages adop-tion of pedagogical practices that emphasize “high structure” and “high challenge”—for example, giving students step-by-step guide-lines for undertaking complicated academic tasks, while also engaging them in authen-tic debate and intellectual exchange. The foundation also encourages colleges and universities to adopt a strategy known as faculty inquiry, in which teachers formulate and explore questions about their students’ learning and use the answers to improve their teaching.47 Supplemental Instruction, another popular strategy, trains students who have passed remedial courses to lead study sessions for students currently enrolled in the courses; the leaders’ job is to review difficult concepts and serve as role models outside the classroom.48 Finally, many colleges and universities have developed remedial educa-tion laboratories or “success centers” where students can receive individualized tutor-ing, participate in study groups, and access computers loaded with instructional aids and review materials.
College completion rates in the United States are not likely to improve until substantially greater numbers of students break through the remedial barrier. For that reason—and because the nation already invests between $1 billion and $2 billion in remedial educa-tion programs—researchers must do much
more to identify effective practices.49 The strategies I have outlined provide some promising venues for future evaluation; other ideas should be developed and tested as well. There is arguably no greater priority for research in higher education.
Enhancing Student Advising and Support ServicesSome students may arrive at college knowing exactly what they need to do to accomplish their goals. Most, however, need guidance to figure out which courses to take and in what sequence, how to add or drop courses and apply for financial aid, and what resources are available to help them adjust to campus life. Even after they have been in college for awhile, many students need help knowing how to fulfill their major requirements, file for graduation or transfer, and resolve per-sonal or academic problems that may inter-fere with their progress. One of the ironies in higher education is that institutions, such as Ivy League schools and highly selective liberal arts colleges, that enroll the best pre-pared and most traditional students tend to offer the most such guidance, while institu-tions that serve the least prepared and most nontraditional students tend to offer much less. In community colleges, counselor-to- student ratios of 1 to 1,000 are not uncom-mon.50 A national survey of entering com-munity college students found that 32 percent did not attend a freshmen orientation program and half did not meet with or recall seeing an academic adviser during their first four weeks of college.51
The primary reason why student services are so meager in some institutions is lack of funding. One study finds a general pattern in the United States of increased stratification in higher education and reductions in funding per student outside of top-tier institutions,

120 THE FUTURE OF CHILDREN
Thomas Brock
affecting course availability, student-faculty ratios, and student services. The authors make a strong case that these reductions explain the increase in time-to-degree at less selective colleges and universities.52 In California, for example, community colleges receive less than half the funding per full-time enrolled student that the state universi-ties receive, and only about one-fifth as much as the University of California.53 In addition, California community colleges are limited by state law in the percentage of their budget that can be devoted to non-instructional activities, which further constrains their abil-ity to provide adequate support services.
Since the late 1960s, the federal govern-ment has funded TRIO programs (so-called because initially TRIO consisted of three pro-grams) to serve and assist low-income, first-generation college students, and students with disabilities, to progress from middle school to post-baccalaureate programs. The largest and best-known TRIO program, Upward Bound, is geared toward helping disadvantaged high school students prepare for college. A smaller and lesser-known program, Student Support Services, provides funds for basic skills instruction, tutoring, academic advising, financial aid and career counseling, transfer and graduate school counseling, and mentoring to disadvantaged students on college and university campuses. In 2003–04, the Student Support Services program awarded more than 936 grants to colleges and universities and reached more than 200,000 students nationwide, about half of whom were in community colleges.
The Student Support Services program has not been subject to rigorous impact evalu-ation, though a Department of Education report indicates that it succeeded in reaching a needy target group. The report also states
that more than two-thirds of full-time fresh-men who received Student Support Services in community colleges persisted to their second year of college, and that 9 percent of these students earned an associate’s degree at the end of two years.54 Without a control group, however, it is impossible to know whether that record represents an improve-ment over what students would have accom-plished on their own, had the extra services not been available.
As part of the Opening Doors demonstration discussed above, MDRC and the MacArthur Network on Transitions to Adulthood con-ducted random-assignment studies of two enhanced student services programs oper-ating at community colleges. One of these programs, at Chaffey College in California, targeted a traditional group of community col-lege students who were on probation because of poor grades or an excessive number of course withdrawals.55 The program featured a College Success course, taught by a coun-selor, in which students addressed such topics as personal motivation, time management,
The current financial aid system has significant flaws, but more money is available than students or the general public often realizes. The federal government now spends $18.6 billion a year on grant aid and an additional $70 billion on student loan programs.

VOL. 20 / NO. 1 / SPRING 2010 121
Young Adults and Higher Education: Barriers and Breakthroughs to Success
college expectations, and note-taking and test-taking skills. The program also included additional counseling and required students to make use of the college’s “Success Centers,” where students could get help from instructors or tutors in reading, writing, or math.
Chaffey recruited nearly 900 students to par-ticipate in the evaluation during the first year, and close to 450 students during the second year. The students were generally young, and three out of five were female. Hispanics made up a slight majority; whites accounted for about a fourth of the sample. As in the other Opening Doors sites, students at Chaffey were randomly assigned to program and control groups. Control group members did not have access to the College Success class, but could take advantage of the Success Centers and any other campus resources on their own if they chose.
In its first year Chaffey’s program was not implemented as planned. Word went out that the program was voluntary, and only about half the students who were assigned to the program group enrolled in the College Success class. Moreover, some of the coun-selors reported that they did not fully under-stand their roles or require students to visit the Success Centers. The evaluation of the first-year program showed no measurable effects. However, to the college’s credit, administrators and staff came back together and addressed the major implementation problems before the second-year program began. Perhaps most important, after they informed students in the program group that enrollment in the College Success class was mandatory, participation rates rose to nearly 75 percent. The counselors were also better prepared and enforced the Success Center visits more consistently. The effects of the second-year program after two semesters
were large and significant. Students in the program group earned an average of 8.3 college credits, compared with an average of 5.6 credits for students in the control group. And almost twice as many students in the program group as in the control group got off probation and returned to good academic standing. The turnaround between the first- and second-year results underscores the importance not only of a good program model, but of strong implementation and high participation. Longer follow-up will be needed to determine whether the effects from the second-year program translate into increased persistence and degree completion at Chaffey.
The other enhanced student services pro-gram evaluated as part of the Opening Doors demonstration was operated by Lorain County Community College and Owens Community College, both in Ohio.56 The Ohio program, it should be noted, targeted a different group of students than Chaffey: beginning freshmen and continuing students who had completed fewer than thirteen credits. Some of the students showed signs of academic trouble, but they were not on aca-demic probation. The Ohio sample was also largely nontraditional, consisting mostly of working women in their mid-twenties. A little more than 2,100 students were randomly assigned to program and control groups.
For the program group, the Ohio colleges offered counseling and advising services that were much more regular, intensive, and personalized than they (or other community colleges) typically provide. The counselor-to-student ratio was less than 1 to 160, com-pared with 1 to 1,000 for students randomly assigned to the control group. In addition, the program paid students a modest stipend of $150 if they completed at least two counselor

122 THE FUTURE OF CHILDREN
Thomas Brock
visits a semester. The enhanced counseling services lasted two semesters. Close to 90 percent of students in the program group saw a counselor at least once during this time, and results from a survey indicated that almost two-thirds of the program group reported having at least three academic advising sessions during their first year in the study, compared with only 40 percent of the control group. Even so, the intervention resulted in only a temporary improvement in persistence. Students in the program group were more likely to register for college after one semester in the program, but the effect went away as soon as the more intensive services ended. There was no effect on other key indicators of academic performance, such as credits earned.
The collective findings from the Chaffey and Ohio Opening Doors programs suggest that enhanced student services have the poten-tial to improve student outcomes, but that researchers must do more to determine the precise ingredients of an effective program. The choice of target group seems to be one such ingredient, judging by the fact that the relatively young, traditional group of students at Chaffey seemed to benefit more from an intervention than a relatively older, nontradi-tional group of students in Ohio. Of course, the Chaffey students were also all on aca-demic probation, which could mean they had more to gain from an intervention. The qual-ity and intensity of the program also seemed to matter. The Chaffey model, with its combination of the College Success course, Success Center visits, and individualized counseling, was more intensive overall than the Ohio model, but it worked only when it was implemented well and when participa-tion rates crossed a certain threshold. The Ohio program produced a positive impact on persistence while students were still receiving
the enhanced counseling and advising, which suggests it may have had a more enduring effect if it had lasted longer than two semes-ters. As noted, more selective colleges and universities tend to provide intensive coun-seling and advising on an ongoing basis.
Making Financial Aid More EffectiveIn their article in this volume, Sheldon Danziger and David Ratner examine how uncertainty over how to pay for college and impediments to borrowing keep many young adults from attending college. As I discuss below, the current financial aid system has significant flaws, but more money is available than students or the general public often realizes. The federal government now spends $18.6 billion a year on grant aid and an additional $70 billion on student loan pro-grams.57 It also spends about $2 billion on the federal work-study program, which pays for up to 75 percent of the wages low-income students can earn at jobs on campus or with other participating employers.58 Many states operate financial aid programs as well, supplementing the funds provided by the federal government.
Students are awarded some combination of these funds after completing a Free Application for Federal Student Aid (FAFSA). College financial aid offices make individual awards to students using a formula that takes into account the cost of attendance at the institution and the student’s expected family contribution based on income and assets. Grant aid does not need to be paid back and is arguably the most important tool to promote college-going among low-income students, particularly because research shows that many low-income students are reluctant to take out loans, even when they have high levels of need.59 Pell Grants provide the most funding and serve the most students,

VOL. 20 / NO. 1 / SPRING 2010 123
Young Adults and Higher Education: Barriers and Breakthroughs to Success
followed by the Supplemental Education Opportunity Grant. In 2006, Congress also established Academic Competitiveness Grants and SMART Grants to provide financial support to students from lower-income families who meet criteria related to academic achievement and course of study.60
Unlike federal grants, student loans are available to families in all income brackets, although only lower-income students may qualify for subsidized loans (meaning that the federal government pays the interest while students are enrolled in school). The federal government also funds an array of tax credits that enable students and their families to reduce their federal income tax obligation in relation to the tuition costs they pay each year. These tax credits primarily support middle- and upper-income families.61
Despite the large federal investment in finan-cial aid, researchers know little about how effective the various federal programs are in promoting higher education attendance or completion. To determine how student aid affects college attendance, Susan Dynarski examined the Social Security Student Benefit program, which between 1965 and 1982 paid the college costs for eighteen- to twenty-two-year-old children whose parents had qualified for Social Security benefits but were deceased. The sudden elimination of the program made it possible to compare how students in similar circumstances responded before and after the change. Dynarski found that an offer of $1,000 in grant aid increased the probability of attending college by about 3.6 percentage points and also increased col-lege completion. These estimates are con-sistent with other analyses of the effects of variation in tuition costs at public institutions within states and of a merit aid program in Georgia, known as the Helping Outstanding
Pupils Educationally (HOPE) scholarship (discussed further below).62
Although the effects of the federal govern-ment’s financial aid programs may be uncer-tain, this much is clear: the present system has few supporters. Chief among the criti-cisms is that government aid has not kept up with the rising costs of college attendance; the various grant, loan, and tax credit pro-grams are duplicative, inefficient, and not always successful in directing federal aid to the neediest students and families; and the process of applying for federal aid is need-lessly complex.63 The Obama administra-tion has made the overhaul of financial aid a priority and has increased the value of the Pell Grant (from $4,731 to $5,350) and raised the tuition tax credit (from $1,800 to $2,500) as part of the American Recovery and Reinvestment Act.64 The administration plans to make these changes permanent in its 2010 budget and to tie future increases in Pell Grants to the Consumer Price Index. It has also proposed to consolidate the tax credits into one program and make them refundable for low-income families and to restructure student loan programs so that they are provided directly through the fed-eral government rather than through private lenders.65 Finally, the administration recently announced plans to simplify the financial aid application process.66
A forthcoming evaluation of a program in Ohio and North Carolina that helped low-income families complete the federal finan-cial aid application process indicates that FAFSA simplification may have a substantial payoff. The program targeted families with annual incomes below $45,000 and at least one household member between the ages of fifteen and thirty who did not have a col-lege degree. The goal was not only to make

124 THE FUTURE OF CHILDREN
Thomas Brock
Georgia program increased course withdraw-als, presumably because students worried about maintaining the required grade point average. It may also have contributed to overall grade inflation and price increases in the state’s public university.71 Finally, some observers have expressed concern that merit-based scholarships may crowd out need-based financial aid and go to students from more privileged backgrounds.72
A slight twist on the merit-based scholar-ship idea is the performance-based scholar-ship. MDRC and the MacArthur Network tested one version in Louisiana as part of the Opening Doors demonstration; another model was tested by researchers in Canada. Performance-based scholarships differ from merit-based scholarships in that they are predicated not on students’ past per-formance, but rather on how students do after the scholarship is awarded. Students “earn” the scholarship as they get passing grades or meet other progress benchmarks. Performance-based scholarships may also include a student services component. The programs in Louisiana and Canada, for example, both hired counselors to monitor students’ academic progress and help them satisfy scholarship conditions.
The Louisiana program, operated at two community colleges in the New Orleans area, offered $1,000 for each of two semesters ($2,000 total) if students stayed in college at least half-time and maintained a “C” average. The scholarships were paid in increments at the beginning, middle, and end of the semes-ter, and program counselors monitored stu-dents’ academic performance. Because state welfare funds were used to pay for the schol-arship, eligibility was limited to students who were parents and whose household income was below 200 percent of the federal poverty
families aware of how much aid they might qualify for if a family member attended a college or university but also to provide such information early enough to influence deci-sions about whether to apply to college and enroll. Through random assignment, one group of families received assistance from trained H&R Block employees to fill out the FAFSA, using information captured off their federal income tax forms; the other group received no such assistance, but could com-plete the FAFSA on their own. Early results indicate that the intervention produced substantial positive effects on financial aid receipt and college enrollment.67
Critics of the current financial aid system also charge that it does not do enough to encour-age high academic achievement, persistence, and completion.68 One strategy, popular among many states, is to create merit-based scholarship programs that reward students who have demonstrated their ability to earn good grades in high school and college. One of the best-known examples is the previously mentioned HOPE scholarship in Georgia, which now provides annual grants of up to $3,500 to students who graduated from a public high school with a 3.0, or “B,” grade point average and who maintain that average in college.69
A comprehensive analysis of merit-based scholarship programs in seven states, includ-ing Georgia, found that the HOPE scholar-ship and other programs like it increased the probability of college attendance among college-age youth by 5 to 7 percentage points and that they encouraged students to attend four-year institutions rather than two-year schools. Some of the state programs also appeared to close racial and ethnic gaps in schooling.70 Although this finding came as good news, there was also evidence that the

VOL. 20 / NO. 1 / SPRING 2010 125
Young Adults and Higher Education: Barriers and Breakthroughs to Success
level. A little more than 1,000 students enrolled in the study and were randomly assigned to program and control groups. Most were African American women in their twen-ties, and most had one or two children. The evaluation found that the scholarship program gave these students a substantial boost. They were more likely to register for college and attend full-time, even though only half-time enrollment was required to receive a scholar-ship. They were also more likely to persist in college. In the second semester of the program, 65 percent of the program group registered for courses, compared with 50 percent of the control group. Significant dif-ferences remained over four semesters. And, finally, students in the program group earned better grades and completed more course credits than those in the control group, earn-ing on average 3.5 more credits (a little more than one standard college course) over four semesters. The study also found that students in the program had more social support and felt more confident that they would achieve their personal and academic goals.73
The Canadian study took place at a campus of a large, public, four-year university. Like the Louisiana program, the Canadian program —called the Student Achievement and Retention Project (STAR)—lasted two semesters. It differed in one major way: students received higher payments when they earned better grades. Students received a $1,000 payment if they earned grades between a “C+” and a “B” and up to $5,000 if they earned grades of “A-” or better. The Canadian program also targeted a more traditional group of students than the Louisiana program.
The Project STAR researchers randomly assigned more than 1,600 students, all first-year undergraduates, to three treatment
groups: one that received only the scholar-ship, one that received only enhanced coun-seling, and one that received the scholarship and the enhanced counseling combined. The combination of scholarships and counseling yielded the best results, including significant effects on grades and persistence. The schol-arship alone also produced positive effects, but not as large; and the counseling alone produced no effects. Finally, the analysis showed that the positive effects were concen-trated among women.74
Both the Louisiana and the Canadian stud-ies point to the promise of performance-based scholarships in improving academic outcomes. The studies also suggest that researchers have more to learn about how best to design and implement such pro-grams: which groups of students to target, what scholarship amount is optimal, and what role counselors should play, among other issues. A random-assignment study is now under way in New York, Ohio, New Mexico, and California to test variations of performance-based scholarships, including different models of service delivery and dif-ferent target groups.75 Another large random-assignment study in Wisconsin is testing the
If there is one overarching lesson from this review, it is that changes in higher education policies and practices can lead to improvements in college attendance, persistence, and completion.

126 THE FUTURE OF CHILDREN
Thomas Brock
value added of a scholarship alone, without performance criteria, for low-income parents attending state colleges and universities.76
ConclusionIf there is one overarching lesson from this review, it is that changes in higher education policies and practices can lead to improve-ments in college attendance, persistence, and completion. That insight is evident from dramatic changes in the number and composition of students attending colleges and universities since the mid-1960s, when federal policy makers and college and uni-versity administrators acted aggressively to open higher education to excluded groups. It is also evident from the rigorous evaluations performed on various interventions designed to help college students succeed.
This is not to say that the problems of college access and completion are fully solved—far from it. Some groups, such as African American and Hispanic males, are sorely underrepresented on college campuses. Overall rates of degree attainment have not improved in decades. Time-to-degree is also increasing, particularly at two-year institu-tions. Remedial education programs often do a better job of weeding students out than helping them advance to college-level courses and degrees. Such trends run counter to the country’s need for a sizable college-educated workforce in an era of global competition. Similarly, young people need a college degree to better their chance of land-ing a well-paying, stable job and supporting a family.
To boost college completion rates in the United States, policy makers and educators must act on two fronts. First they must encourage development and implementation of strategies that lead to greater student
success. I have identified several such strategies—learning communities and performance-based scholarships, for exam-ple—but much more needs to be done to bring proven strategies to scale and to incubate new ideas that might lead to better results. The Obama administration has put forth proposals to support such efforts, and several major philanthropies have indicated their intentions to invest in higher education reforms as well.77 Given the severe financial pressures on most states and institutions, the challenge will be to make sure that new funds are used to make meaningful changes in existing programs and services, not to fill budget gaps or support business as usual.
Second, policy makers and practitioners must place much greater emphasis on evaluat-ing reforms. Aside from the studies I have described, there is very little research that demonstrates the efficacy of most higher education interventions. Randomized control trials—the best means of establishing a causal connection between an intervention and student outcomes—are rare. Without clear evidence on what to do differently, colleges and universities are likely to continue the same kinds of programs and services that they have been running for years, and with similar results. Researchers must actively disseminate evaluation findings and technical assistance to help administrators, faculty, and staff adapt the most effective program strate-gies to their campuses.
A recurrent theme in this volume is the obstacles that face many young people making the transition to adulthood. William Bowen and Derek Bok make this point in their book on minority students in higher education, called The Shape of the River: “We often hear of the importance of keeping young people moving through the ‘pipeline’

VOL. 20 / NO. 1 / SPRING 2010 127
Young Adults and Higher Education: Barriers and Breakthroughs to Success
from elementary school to high school to college, on through graduate and profes-sional schools, and into jobs, family respon-sibilities, and civic life. But this image is misleading, with its connotation of a smooth, well-defined, and well-understood passage. It is more helpful to think of the nurturing of talent as a process akin to moving down a winding river, with rock-strewn rapids and slow channels, muddy at times and clear at others.”78
The authors’ words point to the need for a paradigm shift throughout higher education. To increase college persistence and comple-tion, policy makers and educators must take a harder look at the needs and circumstances of the students they are serving and must ask what might be done to help them navi-gate more effectively the rocks and shoals of higher education. The answer is likely to require greater public investment in the institutions that provide the most access to nontraditional and underprepared students: community colleges and other less selective institutions.

128 THE FUTURE OF CHILDREN
Thomas Brock
Endnotes
1. U.S. Census Bureau, “The Big Payoff: Educational Attainment and Synthetic Estimates of Work-Life
Earnings” (Washington: U.S. Census Bureau, July 2002).
2. Sandy Baum and Jennifer Ma, “Education Pays: The Benefits of Higher Education for Individuals and
Society” (Washington: College Board, 2007), pp. 21–23.
3. Thomas S. Dee, “Are There Returns to Civic Engagement?” Journal of Public Economics 88 (2004):
1697–1720.
4. Donald R. Deere and Jelena Vesovic, “Educational Wage Premiums and the U.S. Income Distribution,”
in Handbook of the Economics of Education, vol. 1, edited by Eric Alan Hanushek and Finis Welch
(Amsterdam: North-Holland, 2006), pp. 255–306.
5. U.S. Census Bureau, “The Big Payoff” (see note 1).
6. Wilson Smith and Thomas Bender, “Introduction,” American Higher Education Transformed: 1940–2005
(Baltimore: Johns Hopkins University Press), pp. 1–11.
7. Judith Eaton, “The Evolution of Access Policy: 1965–1990,” in Public Policy in Higher Education, edited
by. L. F. Goodchild and others (Needham Heights, Mass.: Pearson Custom Publishing, 1997), pp. 237–46.
8. Thomas Diener, Growth of an American Invention: A Documentary History of the Junior and Community
College Movement (New York: Greenwood Press, 1986); Lawrence E. Gladieux and Thomas R. Wolanin,
Congress and the Colleges (Lexington, Mass.: Lexington Books, 1976), pp. 1–14.
9. Gladieux and Wolanin, Congress and the Colleges (see note 8), pp. 12–13.
10. Taylor Branch, Parting the Waters: America in the King Years, 1954–63 (New York: Simon and Schuster,
1988); Taylor Branch, Pillar of Fire: America in the King Years, 1963–65 (New York: Simon and Schuster,
1998); Taylor Branch, At Canaan’s Edge: America in the King Years 1965–68 (New York: Simon and
Schuster, 2006).
11. Todd Gitlin, The Sixties: Years of Hope, Days of Rage (New York: Bantam, 1993).
12. Eaton, “The Evolution of Access Policy: 1965–1990” (see note 7), pp. 237–46.
13. T. D. Snyder, S. A. Dillow, and C. M. Hoffman, Digest of Education Statistics 2007 (NCES 2008-022)
(Washington: National Center for Education Statistics, Institute of Education Sciences, U.S. Department
of Education, 2008), table 180.
14. Population Division, U.S. Census Bureau, “Annual Estimates of the Population by Sex and Selected Age
Groups for the United States: April 1, 2000, to July 1, 2007 (NC-EST2007-02)” (Washington: U.S. Census
Bureau, May 1, 2008); Population Division, U.S. Census Bureau, “Resident Population plus Armed
Forces Overseas—Estimates by Age, Sex, and Race: July 1, 1965” (Washington: U.S. Census Bureau,
Internet Release Date: October 1, 2004.)
15. Snyder, Dillow, and Hoffman, Digest of Education Statistics 2007 (see note 13), tables 181, 187, 217.
16. Susan Choy, Findings from the Condition of Education 2002: Nontraditional Undergraduates (NCES
2002-012) (Washington: National Center for Education Statistics, Institute of Education Sciences, U.S.
Department of Education, 2002).

VOL. 20 / NO. 1 / SPRING 2010 129
Young Adults and Higher Education: Barriers and Breakthroughs to Success
17. Snyder, Dillow, and Hoffman, Digest of Education Statistics 2007 (see note 13), tables 180, 187.
18. Ibid., table 187.
19. Ibid., table 225.
20. Stephen Provasnik and Michael Planty, Community Colleges: Special Supplement to The Condition of
Education 2008 (NCES 2008-033) (Washington: National Center for Education Statistics, Institute of
Education Sciences, U.S. Department of Education, 2008).
21. Susan Choy, Findings from the Condition of Education 2002: Nontraditional Undergraduates (see
note 16).
22. Laura Horn and Rachel Berger, College Persistence on the Rise? Changes in 5-year Degree Completion
and Postsecondary Persistence Rates between 1995 and 2000 (NCES 2005-156) (Washington: National
Center for Education Statistics, Institute of Education Sciences, U.S. Department of Education, 2004).
23. Ibid.
24. Ibid.
25. John Bound, Michael F. Lovenheim, and Sarah Turner, Understanding the Decrease in College
Completion Rates and Increased Time to the Baccalaureate Degree (Ann Arbor, Mich.: Population Studies
Center, University of Michigan Institute for Social Research, November 2007).
26. Horn and Berger, College Persistence on the Rise? (see note 22).
27. Lutz Berkner, Shirley He, and Emily Forrest Cataldi, Descriptive Summary of 1995–96 Beginning
Postsecondary Students: Six Years Later (NCES 2003-151) (Washington: National Center for Education
Statistics, Institute of Education Sciences, U.S. Department of Education, 2002), pp. 61 and 65.
28. Snyder, Dillow, and Hoffman, Digest of Education Statistics 2007 (see note 13), table 178.
29. Clifford Adelman, The Toolbox Revisited: Paths to Degree Completion from High School through College
(Washington: U.S. Department of Education, February 2006).
30. Choy, Findings from the Condition of Education 2002: Nontraditional Undergraduates (see note 16).
31. American Council on Education, Minorities in Higher Education 2008: Twenty-Third Status Report
(Washington: American Council on Education, 2008).
32. Ryan H. Hahn and Derek Price, Promise Lost: College-Qualified Students Who Don’t Enroll in College
(Washington: Institute for Higher Education Policy, November 2008).
33. Organisation for Economic Co-operation and Development, Education at a Glance: OECD Indicators
2007 (Paris: OECD Publishing, 2007).
34. Vincent Tinto, Leaving College: Rethinking the Causes and Cures of Student Attrition (University of
Chicago Press, 1993).
35. See, for example, John M. Braxton, ed., Reworking the Student Departure Puzzle (Vanderbilt University
Press, 2002).
130 THE FUTURE OF CHILDREN
Thomas Brock
36. See, for example, Monica Martinez and Shayna Klopott, The Link between High School Reform and
College Access and Success for Low-Income and Minority Youth (Washington and Boston: American
Youth Policy Forum and Pathways to College Network, 2005); and Michael Bangser, Preparing High
School Students for Successful Transitions to Postsecondary Education and Employment (www.betterhigh-
schools.org, August 2008).
37. Basmat Parsad and Laurie Lewis, Remedial Education at Degree-Granting Postsecondary Institutions in
Fall 2000 (NCES 2004-010) (Washington: National Center for Education Statistics, Institute of Education
Sciences, U.S. Department of Education, November 2003).
38. Paul Attewell and others, “New Evidence on College Remediation,” Journal of Higher Education 77
(2006): 886–924.
39. W. Norton Grubb, “Second Chances in Changing Times: The Roles of Community Colleges in Advancing
Low-Skilled Workers,” in Low-Wage Workers in the New Economy: Strategies for Opportunity and
Advancement, edited by Richard Kazis and Marc S. Miller (Washington: Urban Institute Press, 2001), pp.
277–302; and Vincent Tinto, “Learning Communities and the Reconstruction of Remedial Education in
Higher Education,” paper prepared for the Conference on Replacing Remediation in Higher Education
at Stanford University, January 26–27, 1998.
40. Henry M. Levin and Juan Carlos Calcagno, “Remediation in the Community College: An Evaluator’s
Perspective,” Community College Review 35 (2008): 181–207; Thomas R. Bailey and Mariana Alfonso,
Paths to Persistence: An Analysis of Research on Program Effectiveness at Community Colleges
(Indianapolis, Ind.: Lumina Foundation for Education, January 2005).
41. Susan Scrivener and others, A Good Start: Two-Year Effects of a Freshmen Learning Community Program
at Kingsborough Community College (New York: MDRC, 2008).
42. Ibid.
43. Mary G. Visher and others, The Learning Communities Demonstration: Rationale, Sites, and Research
Design (New York: MDRC, 2008).
44. Davis Jenkins, Matthew Zeidenberg, and Gregor Kienzl, Educational Outcomes of I-BEST, Washington
State Community and Technical College System’s Integrated Basic Education and Skills Training
Program: Findings from a Multivariate Analysis, Community College Research Center, Working Paper 16
(New York: Columbia University, Teachers College, Community College Research Center, May 2009).
45. The Carnegie Foundation for the Advancement of Teaching, Basic Skills for Complex Lives: Designs for
Learning in the Community College (Stanford, Calif.: The Carnegie Foundation for the Advancement of
Teaching, 2008).
46. See National Center for Postsecondary Research website: www.postsecondaryresearch.org/index.html?Id
=Research&Info=Developmental+Summer+Bridges.
47. The Carnegie Foundation for the Advancement of Teaching, Basic Skills for Complex Lives (see note 45).
48. See International Center for Supplementary Instruction website: www.umkc.edu/cad/SI/overview.html.
49. The Institute for Higher Education Policy, College Remediation: What It Is, What It Costs, What’s at
Stake (Washington: The Institute for Higher Education Policy, December 1998).

VOL. 20 / NO. 1 / SPRING 2010 131
Young Adults and Higher Education: Barriers and Breakthroughs to Success
50. Norton W. Grubb, “Getting into the World: Guidance and Counseling in Community Colleges,”
Community College Research Center, Working Paper 1 (New York: Columbia University, Teachers
College, Community College Research Center, 2001).
51. Community College Survey of Student Engagement, Committing to Student Engagement: Reflections on
CCSSE’s First Five Years (Austin, Tex.: Community College Leadership Program, University of Texas–
Austin, 2007).
52. Bound and others, Understanding the Decrease in College Completion Rates and the Increased Time to
the Baccalaureate Degree (see note 25).
53. Colleen Moore and Nancy Shulock, Beyond the Open Door: Increasing Student Success in the California
Community Colleges (Sacramento, Calif.: Institute for Higher Education Leadership and Policy,
California State University, Sacramento, 2007).
54. U.S. Department of Education, Office of Postsecondary Education, Federal TRIO Programs, An Interim
Report on the Student Support Services Program: 2002–03 and 2003–04, with Select Data from 1998–
2002 (Washington: U.S. Department of Education, 2007).
55. Susan Scrivener, Colleen Sommo, and Herbert Collado, Getting Back on Track: Effects of a Program for
Probationary Students at Chaffey College (New York: MDRC, 2009).
56. Susan Scrivener and Michael Weiss, Enhanced Student Services: The Effects of Two Programs in Ohio
(New York: MDRC, 2009).
57. New America Foundation, Federal Education Budget Project, “Education Policy Program: Federal Higher
Education Programs—Overview” (www.newamerica.net/programs/education_policy/federal_education_
budget_project/higher_ed [July 1, 2009]).
58. U.S. Government Accountability Office, Student Aid and Postsecondary Tax Preferences: Limited
Research Exists on Effectiveness of Tools to Assist Students and Families through Title IV Student Aid and
Tax Preferences (Washington: U.S. Government Accountability Office, July 2005).
59. Alisa F. Cunningham and Deborah A. Santiago, Student Aversion to Borrowing: Who Borrows and Who
Doesn’t (Washington: Institute for Higher Education Policy and Excellence in Education, 2008).
60. U.S. Government Accountability Office, Student Aid and Postsecondary Tax Preferences (see note 58).
61. Ibid.
62. Susan M. Dynarski, “Does Aid Matter? Measuring the Effect of Student Aid on College Attendance and
Completion,” American Economic Review 93, no. 1 (March 2003): 279–88.
63. See, for example, U.S. Department of Education, A Test of Leadership: Charting the Future of U.S.
Higher Education: A Report of the Commission Appointed by Secretary of Education Margaret Spellings
(Washington: U.S. Department of Education, 2006); and College Board, Fulfilling the Commitment:
Recommendations for Reforming Federal Student Aid (www.collegeboard.com, September 2008).
64. U.S. Department of Education, “The American Recovery and Reinvestment Act of 2009: Education, Jobs,
and Reform,” program description from website (www.ed.gov/policy/gen/leg/recovery/factsheet/overview.
html [February 18, 2009]).

132 THE FUTURE OF CHILDREN
Thomas Brock
65. U.S. Department of Education, “Education Secretary Duncan Highlights Budget Proposals to Increase
College Access and Affordability,” press release from website (www.ed.gov/news/pressreleases/2009/02
/02262009.html [February 26, 2009]).
66. U.S. Department of Education, “Obama Administration Announces Streamlined College Aid Application,”
press release from website (www.ed.gov/news/pressreleases/2009/06/06242009.html [June 24, 2009]).
67. Eric P. Bettinger and others, “The Role of Information and Simplification in College Decisions: Results
from the H&R Block FAFSA Experiment” (Cambridge, Mass.: National Bureau of Economic Research,
July 2009 draft).
68. U.S. Department of Education, A Test of Leadership (see note 63); and College Board, Fulfilling the
Commitment (see note 63).
69. See Georgia college information website: www.gacollege411.org/FinAid/ScholarshipsAndGrants/
HOPEScholarship/overview.asp (July 1, 2009).
70. Susan Dynarski, “The New Merit Aid,” in College Choices: The Economics of Where to Go, When to Go,
and How to Pay for It, edited by Caroline M. Hoxby (University of Chicago Press, 2004), pp. 63–100.
71. Ibid.; Christopher Cornwell, David B. Mustard, and Deepa J. Sridhar, “The Enrollment Effects of Merit-
Based Financial Aid: Evidence from Georgia’s HOPE Scholarship,” Journal of Labor Economics 24, no. 4
(2006): 761–86.
72. Lashawn Richburg-Hayes and others, Rewarding Persistence: Effects of a Performance-Based Scholarship
Program for Low-Income Parents (New York: MDRC, 2009), pp. 9–10.
73. Ibid.
74. Joshua Angrist, Daniel Lang, and Philip Oreopoulos, “Incentives and Services for College Achievement:
Evidence from a Randomized Trial,” American Economic Journal: Applied Economics 1, no. 1 (January
2009): 136–63.
75. See project website for the Performance-Based Scholarship Demonstration: www.mdrc.org/project_31
_91.html.
76. See project website for the Wisconsin Scholars Longitudinal Study: www.wiscape.wisc.edu/research/
Details.aspx?id=17.
77. See note 65. Philanthropic foundations announcing major investments in postsecondary education include
the Bill and Melinda Gates Foundation, based in Seattle, Washington; and Lumina Foundation for
Education, based in Indianapolis, Indiana.
78. Derek Bok and William Bowen, The Shape of the River: Long-Term Consequences of Considering Race in
College and University Admissions (Princeton University Press, 1998), p. xxi.