year-end report, january-december 2015mb.cision.com/main/357/9912097/475491.pdf · the years high...
TRANSCRIPT
Meda is a leading international specialty pharma company with a broad product
portfolio and its own sales organizations in over 60 countries. Including those markets
where sales are managed by distributors, Meda’s products are sold in more than 150
different countries. Meda AB is the Group’s parent company and its headquarters are
located in Solna outside of Stockholm. The Meda share is listed under Large Cap on
Nasdaq Stockholm.
All information in this year-end report refers to the Group unless otherwise stated. Figures shown refer to the period indicated in the
paragraph heading, and figures in parentheses refer to the corresponding period last year. For further information about medicines
and development projects, see www.meda.se and the 2014 Annual Report. For definitions, see page 23 or the 2014 Annual Report.
Year-end Report, January-December 2015
January-December 20151 Net sales reached SEK 19,648 million (15,352), corresponding to an increase of
28%, 21% at constant exchange rates, compared with the previous year.
EBITDA, excluding non-recurring items, was SEK 6,482 million (4,700),
corresponding to an increase of 38%, and a margin of 33.0% (30.6).
Non-recurring items had a SEK 698 million negative impact on earnings before
tax.
Profit after tax amounted to SEK 1.192 million (402).
Earnings per share reached SEK 3.22 (1.23)2. Excluding non-recurring items,
earnings per share totaled SEK 4.14 (3.64)2.
Cash earnings per share amounted to SEK 8.47 (8.97)2. Excluding non-recurring
items cash earnings per share totaled SEK 11.41 (9.28)2.
Proposed dividend per share: SEK 2.50 (2.50).
Fourth quarter 20151 Net sales reached SEK 5,019 million (5,154), corresponding to a decrease of 3%,
5% at constant exchange rates compared with the previous year.
EBITDA, excluding non-recurring items, was SEK 1,626 million (1,754),
corresponding to a decrease of 7%, yielding a 32.4% margin (34.0).
Non-recurring items had a SEK 21 million negative impact on earnings before
tax.
Profit after tax amounted to SEK 411 million (-275).
Earnings per share reached SEK 1.08 (-0.92)2. Excluding non-recurring items,
earnings per share totaled SEK 1.11 (1.47)2.
Cash earnings per share amounted to SEK 3.52 (2.86)2. Excluding non-recurring
items cash earnings per share totaled SEK 3.92 (3.07)2.
1) For information about non-recurring items, see page 7
2) Recalculation of comparative figures to consider the bonus issue element in the 2014 new share issue.
Webcast presentation of the report on February 11 at 10:00 a.m.
The presentation can be accessed at www.meda.se/investors, where a recorded version will also be available
until the next interim report.
For further inquiries, please contact:
Paula Treutiger, VP Corporate Communications & Sustainability, [email protected], +46 733-666 599.

Year-end Report, January-December 2015 2 (24)
CEO statement I am proud of what Meda and its employees have achieved in 2015. We have successfully integrated our largest
ever acquisition ahead of plan and achieved more than the planned synergies for the year while at the same
time continuing to drive our day-to-day business forward in our respective markets. We have now achieved a
leading position in the European specialty pharma market with good profitability and strong cash flow generation.
For the full year 2015 sales amounted to SEK 19.6 billion and EBITDA excluding non-recurring items was SEK
6.5 billion corresponding to an improved EBITDA margin of 33%. Free cash flow excluding non-recurring items
for the year was SEK 4.2 billion corresponding to an increase of close to 40%.
As planned, we took measures in the fourth quarter to address issues in our Italian business. The challenges
we are facing in Italy include a Cx business with potential to improve, unfavorable pricing conditions, and over
the years high inventories built up at the wholesale level. We have now reorganized the Cx business so the
sales force will have greater pharmacy reach in order to increase demand at the pharmacy level. At the same
time, we have reduced sales to Italian wholesalers in order to improve the situation with wholesale stocks. As a
result of this we significantly reduced in receivables and improved cash flow. Going forward our sales will be at
more favorable pricing conditions. I truly believe we are now on the right track with our business in Italy.
The strategic review of our manufacturing structure is progressing and during the last quarter of the year we
divested Euromed, a non-core manufacturing operation. This was a step within our program targeting improved
gross margin.
Our Western European business continues to be supported by our major products such as Dymista, EpiPen
and Elidel. Tambocor is still weighing on sales in France but the impact is gradually levelling out. Adjusting for
the situation in Italy, Q4 sales in Western Europe increased slightly.
Our US business is still benefitting from strong performance by Felbatol, and Dymista has also added to growth.
However, several other products such as Soma, Astelin and Astepro are still under pressure due to generic
competition.
Emerging Markets showed solid performance with, Russia, the Middle East and Greater China in particular
showing positive development. In Emerging Markets, the former Rottapharm products are important growth
drivers for us.
Following completion of the Rottapharm integration, cash flow and the balance sheet have strengthened and
we are preparing for the next steps building a world-leading specialty pharma company. Meda is well equipped
and our organization is ready to take on new growth opportunities.
In 2016, we will continue our journey. Our focus will be on further exploiting our growth products, Emerging
Markets franchises and other opportunities to counter challenges faced by our base business.
Jörg-Thomas Dierks
Group President and CEO

Year-end Report, January-December 2015 3 (24)
Sales For information on sales trends for major products, see the table on page 20. Definitions of geographic regions
and product categories are presented on page 23.
January-December Net sales for the period amounted to SEK 19,648 million (15,352), which corresponds to an increase of 28%.
At constant exchange rates, sales increased by 21%. The Rottapharm acquisition contributed sales of SEK
4,937 million. Pro forma organic growth for the period amounted to -1%. Strong sales in Emerging Markets
and in the US region were more than offset by lower sales in Western Europe, mainly attributable to Italy.
Excluding Italy, pro forma organic growth was 2%. For the top 20 products pro forma organic growth for the
period was 4%.
October-December Net sales for the period amounted to SEK 5,019 million (5,154), which corresponds to a decrease of 3%. At
constant exchange rates, sales decreased by 5%. The Rottapharm acquisition contributed sales of SEK 1,310
million. Organic growth for the quarter amounted to -5%. Emerging Markets and the US showed good sales
development while mainly because of Italy, quarterly sales in Western Europe was 10% lower than last year.
Excluding Italy, organic growth was 4%. For the top 20 products organic growth in Q4 was 1%.
Sales by geographic area
January-December Sales for Western Europe over the period were SEK 12,213 million (10,205), representing a 20% increase
and a 16% increase at constant exchange rates. Sales of products from Rottapharm amounted to SEK 3,013
million. Sales were negatively impacted above all by poor sales development in Italy, as well as in France, due
to generic competition for Tambocor. Full year sales development was positive in the Nordic markets,
Germany, Austria and Portugal.
US sales amounted to SEK 3,354 million (2,542), corresponding to an increase of 32% and 10% at constant
exchange rates. Sales were held back by the impact of generic competition on Astepro and sales of launch
quantities in Q1 2014 for Aerospan. These negative effects were more than compensated for by higher sales
of Felbatol in particular, as well as Astelin and some other products. Dymista sales of SEK 706 million were
3% higher than last year in local currency.
Sales in Emerging Markets amounted to SEK 3,660 million (2,370), representing a 54% increase. At constant
exchange rates, the increase was 48% and pro forma organic growth was 7%. Sales of products from
Rottapharm amounted to SEK 1,612 million. Sales were especially strong in Greater China, the Middle East,
and Malaysia. Sales in the CIS region were hampered by the economic situation while Australia and Turkey
also showed lower sales.
Other Sales amounted to SEK 421 million (235).
October-December Sales for Western Europe over the period were SEK 3,120 million (3,455), corresponding to a decrease of
11% at constant exchange rates. Sales of products from Rottapharm amounted to SEK 770 million. In Italy we
took the decision to sell less into the market than in the fourth quarter of the previous year in order to sell on
more favorable terms over the year and to reduce high inventory levels at wholesaler level. Sales for the
remaining countries (excluding Italy) were slightly positive for the quarter. Sales in France declined, still mainly
as a result of generic competitors to Tambocor but with less impact than previous quarters. Sales were also
down in the UK, due to an increased negative impact from the Pharmaceutical Price Regulation System
(PPRS), something that will improve in 2016. Germany on the other hand showed strong sales development
for the quarter. Dymista sales growth in the region was 125%.
US sales amounted to SEK 857 million (705), representing an increase of 21% and of 7% at constant
exchange rates. This increase was mainly attributable to higher sales figures for Felbatol as a result of price
increases. Dymista sales at SEK 214 million were 3% higher than in the previous year in local currency.
Aerospan prescriptions continued to show a strong trend for the quarter.
Sales in Emerging Markets amounted to SEK 956 million (879), representing an 11% increase at constant
exchange rates. Sales of products from Rottapharm amounted to SEK 466 million. Organic growth was 11%.
Sales in Southeast Asia, boosted by improved business terms with customers, and the Middle East made
strong contributions to growth. In addition, Russia performed well compared to last year. The negative
development in the CIS region in the previous quarters turned slightly positive in the fourth quarter.
Year-end Report, January-December 2015 4 (24)
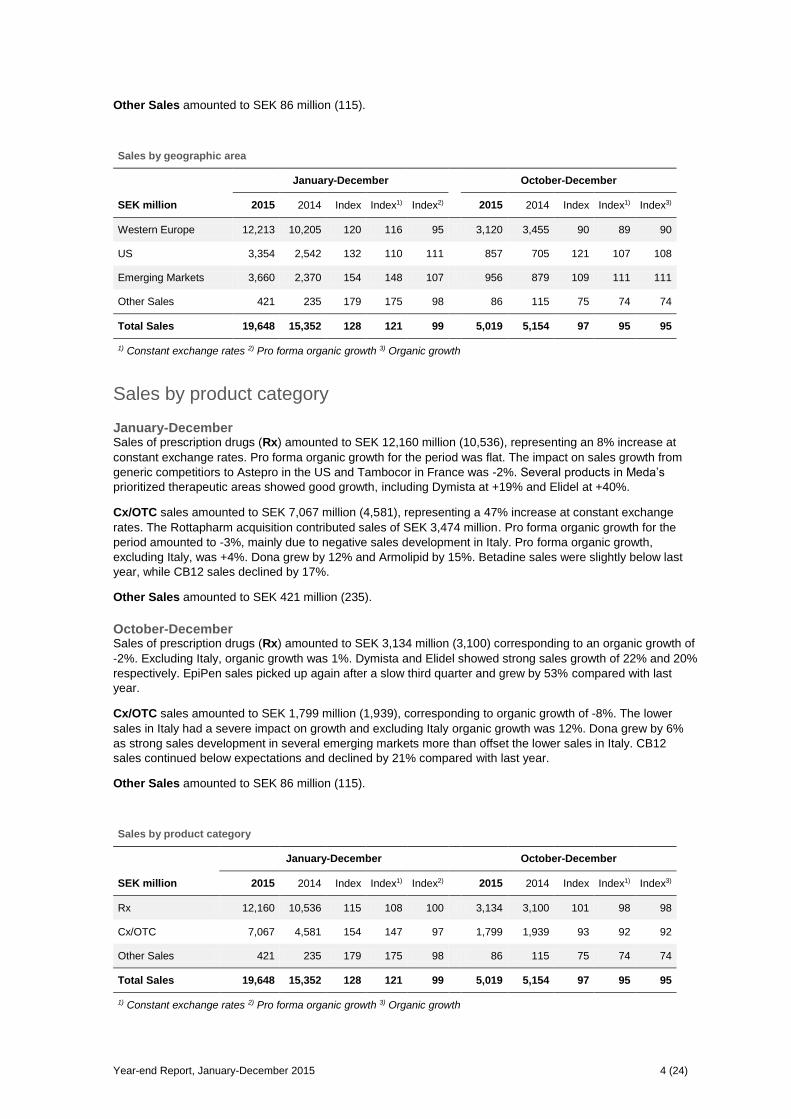
Other Sales amounted to SEK 86 million (115).
Sales by geographic area
January-December October-December
SEK million 2015 2014 Index Index1) Index2) 2015 2014 Index Index1) Index3)
Western Europe 12,213 10,205 120 116 95 3,120 3,455 90 89 90
US 3,354 2,542 132 110 111 857 705 121 107 108
Emerging Markets 3,660 2,370 154 148 107 956 879 109 111 111
Other Sales 421 235 179 175 98 86 115 75 74 74
Total Sales 19,648 15,352 128 121 99 5,019 5,154 97 95 95
1) Constant exchange rates 2) Pro forma organic growth 3) Organic growth
Sales by product category
January-December Sales of prescription drugs (Rx) amounted to SEK 12,160 million (10,536), representing an 8% increase at
constant exchange rates. Pro forma organic growth for the period was flat. The impact on sales growth from
generic competitiors to Astepro in the US and Tambocor in France was -2%. Several products in Meda’s
prioritized therapeutic areas showed good growth, including Dymista at +19% and Elidel at +40%.
Cx/OTC sales amounted to SEK 7,067 million (4,581), representing a 47% increase at constant exchange
rates. The Rottapharm acquisition contributed sales of SEK 3,474 million. Pro forma organic growth for the
period amounted to -3%, mainly due to negative sales development in Italy. Pro forma organic growth,
excluding Italy, was +4%. Dona grew by 12% and Armolipid by 15%. Betadine sales were slightly below last
year, while CB12 sales declined by 17%.
Other Sales amounted to SEK 421 million (235).
October-December Sales of prescription drugs (Rx) amounted to SEK 3,134 million (3,100) corresponding to an organic growth of
-2%. Excluding Italy, organic growth was 1%. Dymista and Elidel showed strong sales growth of 22% and 20%
respectively. EpiPen sales picked up again after a slow third quarter and grew by 53% compared with last
year.
Cx/OTC sales amounted to SEK 1,799 million (1,939), corresponding to organic growth of -8%. The lower
sales in Italy had a severe impact on growth and excluding Italy organic growth was 12%. Dona grew by 6%
as strong sales development in several emerging markets more than offset the lower sales in Italy. CB12
sales continued below expectations and declined by 21% compared with last year.
Other Sales amounted to SEK 86 million (115).
Sales by product category
January-December October-December
SEK million 2015 2014 Index Index1) Index2) 2015 2014 Index Index1) Index3)
Rx 12,160 10,536 115 108 100 3,134 3,100 101 98 98
Cx/OTC 7,067 4,581 154 147 97 1,799 1,939 93 92 92
Other Sales 421 235 179 175 98 86 115 75 74 74
Total Sales 19,648 15,352 128 121 99 5,019 5,154 97 95 95
1) Constant exchange rates 2) Pro forma organic growth 3) Organic growth

Year-end Report, January-December 2015 5 (24)
Earnings
Operating profit
January-December Operating profit for the period was SEK 2,719 million (1,487) and EBITDA was SEK 6,003 million (3,990),
yielding a 30.6% margin (26.0). Excluding non-recurring items, operating profit amounted to SEK 3,198 million
(2,197) and EBITDA to SEK 6,482 million (4,700). This corresponds to a growth rate of 38%, or 30% at
constant exchange rates, and to an EBITDA margin of 33.0% (30.6).
Operating expenses for the period amounted to SEK 9,426 million (7,824) and included restructuring costs of
SEK 299 million and a provision of SEK 210 million related to the ongoing US product liability cases involving
the product Reglan. Accordingly, operating expenses excluding non-recurring items were SEK 8,917 million
(7,102).
Selling expenses for the period, including restructuring costs of SEK 227 million, were SEK 4,359 million
(3,718). Selling expenses excluding non-recurring costs increased by 15% compared with the previous year at
constant exchange rates.
Medicine and business development expenses, including restructuring costs of SEK 25 million and the
provision of SEK 210 million mentioned above, were SEK 4,086 million (3,223).
Administrative expenses for the period, including restructuring costs of SEK 47 million, totaled SEK 981 million
(883).
October-December Operating profit for the period was SEK 776 million (204) and EBITDA was SEK 1,605 million (1,012), yielding
a 32.0% margin (19.6). Excluding non-recurring items, operating profit amounted to SEK 797 million (946) and
EBITDA to SEK 1,626 million (1,754), corresponding to a margin of 32.4% (34.0).
Other income of SEK 22 million relates to the divestment of the Euromed manufacturing unit in Spain.
Operating expenses for the period amounted to SEK 2,328 million (2,935) and included restructuring costs of
SEK 43 million. Accordingly, operating expenses excluding non-recurring items were SEK 2,285 million
(2,223), corresponding to an increase of 1% at constant exchange rates.
Selling expenses for the period, including restructuring costs of SEK 29 million, were SEK 1,125 million
(1,415). Selling expenses excluding restructuring costs increased by 2% compared with the previous year at
constant exchange rates.
Medicine and business development expenses, including restructuring costs of SEK 1 million, were SEK 964
million (1,123).
Administrative expenses for the period, including restructuring costs of SEK 13 million, totaled SEK 239 million
(397).
EBITDA (SEK MILLION)*
*Excluding non-recurring items
0
500
1 000
1 500
2 000
Q12014
Q22014
Q32014
Q42014
Q12015
Q22015
Q32015
Q42015

Year-end Report, January-December 2015 6 (24)
Net financial items, tax and earnings per share
January-December Group net financial items amounted to SEK -1,415 million (-905) and include non-recurring expenses of SEK
219 million related to the redemption of the bond loan in late April 2015 which was absorbed in conjunction
with the acquisition of Rottapharm. Excluding non-recurring expenses, net financial items totaled SEK -1,196
million (-665).
Profit/loss after net financial items totaled SEK 1,304 million (582).
Reported tax for the period amounted to SEK -112 million (-180). Tax was SEK 359 million lower as a result of
non-recurring items and the utilization of a non-capitalized loss carry-forward in the German operations.
Excluding non-recurring items, the Group’s tax expense was SEK 471 million (351), equivalent to a tax rate of
23.5% (22.9).
Net profit totaled SEK 1,192 million (402).
Earnings per share reached SEK 3.22 (1.23). Excluding non-recurring items, earnings per share totaled SEK
4.14 (3.64). The comparative amounts have been recalculated to consider the bonus issue element in the
2014 new share issue.
October-December Group net financial items amounted to SEK -243 million (-501).
Profit/loss after net financial items totaled SEK 533 million (-297).
Reported tax for the period was SEK -122 million (22) and was SEK 10 million (187) lower as a result of tax on
non-recurring items. Excluding non-recurring items the tax expense was SEK 132 million (165), equivalent to a
tax rate of 23.8% (24.8).
Net profit totaled SEK 411 million (-275).
Earnings per share reached SEK 1.08 (-0.92). Excluding non-recurring items, earnings per share totaled SEK
1.11 (1.47). The comparative amounts have been recalculated to take account of the bonus issue element in
the 2014 new share issue.

Year-end Report, January-December 2015 7 (24)
Earnings excluding non-recurring items
January-December October-December
SEK million 2015 Non-
recurring effects
2015 excluding
non-recurring
effects
2015 Non-
recurring effects
2015 excluding
non-recurring
effects
Net sales 19,648 - 19,648 5,019 - 5,019
Cost of sales -7,525 8 1) -7,533 -1,937 - -1,937
Gross profit 12,123 8 12,115 3,082 - 3,082
Other income 22 22 2) - 22 22 2) -
Operating expenses -9,426 -509 1) -8,917 -2,328 -43 1) -2,285
Operating profit/loss (EBIT) 2,719 -479 3,198 776 -21 797
Net financial items -1,415 -219 3) -1,196 -243 - -243
Profit/loss for the period after net financial items (EBT)
1,304 -698 2,002 533 -21 554
Tax -112 359 4) -471 -122 10 4) -132
Net profit/loss 1,192 -339 1,531 411 -11 422
EBITDA 6,003 -479 1) 2) 6,482 1,605 -21 1) 2) 1,626
Amortization, product rights -3,040 - -3,040 -764 - -764
Depreciation and amortization, other
-244 - -244 -65 - -65
Operating profit/loss (EBIT) 2,719 -479 3,198 776 -21 797
1) Refers to restructuring costs of SEK 291 million, of which SEK 248 million was expensed in the
previous quarters, and a provision of SEK 210 million, expensed in the third quarter, referring to the ongoing US product liability cases involving the product Reglan.
2) Refers to the divestment of the Euromed manufacturing unit in Spain
3) Refers to non-recurring expenses of SEK 219 million related to redemption of the bond loan in late
April 2015 which was absorbed in conjunction with the acquisition of Rottapharm.
4) Refers to non-recurring items of SEK 200 million, recognized in the first quarter, relating to the
utilization of a non-capitalized loss carry-forward in the German operations, SEK 80 million related to the ongoing US product liability cases, SEK 27 million, recognized in the first and second quarter, relating to tax on non-recurring items in net financial items, SEK 82 million related to tax on restructuring costs of which SEK 72 million refers to previous quarters, SEK -8 million, expensed in the first quarter, relating to additional tax for previous financial years, SEK -27 million, of which SEK 22 million was expensed in the second quarter, relating to internal restructuring of operations due to the acquisition of Rottapharm and SEK 5 million related to the divestment of the Euromed manufacturing unit in Spain.

Year-end Report, January-December 2015 8 (24)
Cash flow
January-December Cash flow from operating activities before changes in working capital amounted to SEK 3,717 million (3,254).
Working capital had an impact of SEK -393 million (-212) on cash flow. Cash flow from inventories totaled
SEK -198 million, mainly relating to bridging stocks of raw material for Elidel, following to the transfer to in-
house manufacturing and lower sales in Q4 compared with Q4 2014. Receivables had a negative effect of
SEK 96 million on cash flow. Liabilities had a negative effect of SEK 99 million on cash flow due to fluctuations
in payments of trade payables offset by a reduction of accrued expenses in the US market and the payment of
acquisition-related transaction costs. Accordingly, cash flow from operating activities amounted to SEK 3,324
million (3,042).
Free cash flow was SEK 3,095 million (2,901). Restructuring costs of SEK 632 million, acquisition-related
transaction costs of SEK 113 million, costs related to the early redemption of the bond loan in Rottapharm of
SEK 289 million, a tax payment of SEK 22 million linked to internal restructuring of subsidiaries and settlement
costs of SEK 21 million related to Reglan were paid during the period. Accordingly, free cash flow excluding
non-recurring items totaled SEK 4,172 million (3,000), corresponding to a 39% increase.
Cash earnings per share for the period totaled SEK 8.47 (8.97). Excluding non-recurring items, cash earnings
per share rose by 23% to SEK 11.41 (9.28). The comparative amounts have been recalculated to take
account of the bonus issue element in the 2014 new share issue.
Cash flow from investing activities amounted to SEK 262 million (-8,906).
Cash flow from financing activities amounted to SEK -4,272 million (7,914). The dividend of SEK 914 million
was paid in the second quarter.
October-December Cash flow from operating activities before changes in working capital amounted to SEK 965 million (1,101).
Working capital had a positive impact of SEK 383 million (-50) on cash flow. Cash flow from inventories totaled
SEK -76 million, primarily due to the timing of raw material purchases related to Elidel as mentioned above.
Receivables had a positive effect of SEK 221 million on cash flow mainly to the collection of receivables
relating to sales in Italy in 2014 with long credit terms combined with low sales in Italy for the quarter.
Liabilities had a positive effect of SEK 238 million on cash flow owing mainly to due to timing of inventory
purchases and fluctuations in payments of trade payables. Accordingly, cash flow from operating activities
amounted to SEK 1,348 million (1,051).
Free cash flow was SEK 1,288 million (986). Restructuring costs of SEK 125 million and settlement costs of
SEK 21 million related to Reglan were paid in the quarter. Accordingly, free cash flow excluding non-recurring
items totaled SEK 1,434 million (1,053), corresponding to an increase of 36%. Free cash flow in relation to
EBITDA, excluding non-recurring items, rose to 88% for the quarter.
Cash earnings per share for the period totaled SEK 3.52 (2.86). Excluding non-recurring items, cash earnings
per share rose by 28% to SEK 3.92 (3.07). The comparative amounts have been recalculated to take account
of the bonus issue element in the 2014 new share issue.
Cash flow from investing activities amounted to SEK 621 million (-8,790) and includes a cash effect of SEK
701 million related to the divestment of the Euromed manufacturing unit in Spain.
Cash flow from financing activities amounted to SEK -1,876 million (9,739).

Year-end Report, January-December 2015 9 (24)
Cash earnings per share (SEK)* Free cash flow/EBITDA (%)*
* Excluding non-recurring items
Financing On December 31, equity stood at SEK 20,956 million compared with SEK 20,680 million at the start of the
year, which corresponds to SEK 57.3 (56.6) per share. The equity/assets ratio was 34.4% compared with
31.8% at the start of the year.
Net debt for the Group totaled SEK 25,505 million on December 31, compared with SEK 28,244 million at the
start of the year. At December 31, 2015, the average cost of the debt portfolio, including pension liabilities,
was 3.1%.
Performance for net debt and net debt/adjusted EBITDA over the past eight quarters is illustrated by the
following charts.
Net debt (SEK million) Net debt/adjusted EBITDA (times)
Integration of Rottapharm The integration of Rottapharm, which was initiated in October 2014, has been completed in most operating
units. Meda recognized additional restructuring costs in the amount of SEK 291 million in 2015, putting total
restructuring costs since October 2014 at SEK 922 million.
Agreements and key events
Divestment of Euromed manufacturing unit On December 1, 2015, Meda announced the divestment of the Euromed manufacturing unit in Spain. The
total consideration was EUR 82 million in upfront cash for the shares of Euromed. The unit generates sales of
around EUR 40 million and an EBITDA margin of around 20% on an annual basis.
0,000,501,001,502,002,503,003,504,00
Q12014
Q22014
Q32014
Q42014
Q12015
Q22015
Q32015
Q42015
20
30
40
50
60
70
80
90
100
Q12014
Q22014
Q32014
Q42014
Q12015
Q22015
Q32015
Q42015
12 000
14 000
16 000
18 000
20 000
22 000
24 000
26 000
28 000
30 000
Q12014
Q22014
Q32014
Q42014
Q12015
Q22015
Q32015
Q42015
2
2,5
3
3,5
4
4,5
5
5,5
Q12014
Q22014
Q32014
Q42014
Q12015
Q22015
Q32015
Q42015

Year-end Report, January-December 2015 10 (24)
Events after the reporting date Mylan N.V., a company incorporated in the Netherlands, and whose ordinary shares are traded on the
NASDAQ Global Select Market and the Tel Aviv Stock Exchange, has today announced a recommended
public offer to the shareholders of Meda AB to transfer all of their shares in Meda AB to Mylan N.V. for a
consideration consisting of a combination of cash and shares of common stock in Mylan N.V.. Please refer to
Mylan N.V.’s separate offer announcement for more information about the offer, and to a separate press
release issued by Meda AB regarding the Board’s recommendation of the offer.
Outcome compared with forecast for full-year 2015 In its interim report for Q3 2015, Meda published the following forecast for full-year 2015:
“Meda expects sales for full-year 2015 to reach just below SEK 20 billion with an EBITDA margin around 32%
(excluding non-recurring items)”. The outcome relevant to the forecast was sales of SEK 19,648 million and an
EBITDA margin of 33%, excluding non-recurring items.
Dividend The board proposes a dividend of SEK 2.50 (2.50) per share, equivalent to SEK 914 million (914).
The annual general meeting and the annual report The annual general meeting of shareholders will be held on April 14 at 5 p.m. at Meda’s head office at Pipers
Väg 2A in Solna, Sweden. The Swedish annual report will be published no later than March 24 and will be
available on the company’s website www.meda.se.
Risks and uncertainties The Group’s business is exposed to financial risks, which are described in Meda’s 2014 Annual Report on
pages 90-91. Risks related to Group operations are described in the 2014 Annual Report on pages 67-68.
Accounting policies The Group complies with the EU-approved IFRS standards and their interpretations (IFRIC). This interim
report was prepared as per IAS 34 Interim Financial Reporting. Further information about Group reporting and
valuation principles is detailed in Note 1 on pages 86-90 of the 2014 Annual Report. The parent company
applies RFR 2, Accounting for Legal Entities.
The Group uses the same accounting policies in this interim report as applied in the preparation of the 2014
Annual Report. The new and amended IFRS standards and IFRIC interpretations effective from January 1,
2015 have not had any material effect on the consolidated financial statements.
Changes in external reporting As of 2015, Meda reports all medical device products by geographic area and by product category. These
products were previously not allocated in full by geographic area and were recognized as other sales in the
reporting by product category. The comparative figures have been adjusted as follows:
January-December 2014 Other Sales by product category have been adjusted from SEK 492 million to SEK 235 million, with SEK 28
million allocated to Rx and SEK 229 million allocated to Cx/OTC.
October-December 2014 Other Sales by geographic area has been adjusted to SEK 115 million, as opposed to SEK 108 million
previously. The change has been allocated to Western Europe. Other Sales by product category have been
adjusted from SEK 209 million to SEK 115 million, with SEK 9 million allocated to Rx and SEK 85 million to
Cx/OTC.

Year-end Report, January-December 2015 11 (24)
The Board of Directors and CEO hereby confirm that this interim report provides a true and fair view of the
parent company’s and Group’s operations, position, and performance, and describes material risks and
uncertainties faced by the parent company and Group companies.
Stockholm, February 10, 2016
Martin Svalstedt Luca Rovati Peter Claesson
Board chairman Vice Board chairman Board member
Peter von Ehrenheim Kimberly Lein-Mathisen Guido Oelkers
Board member Board member Board member
Karen Sörensen Lillie Li Valeur Lars Westerberg
Board member Board member Board member
Jörg-Thomas Dierks
CEO
The company’s auditors did not review this year-end report.
Meda AB
Pipers väg 2A, Box 906, 170 09 Solna, Sweden, Tel: +46 8-630 19 00, Fax: +46 8-630 19 50,
email: [email protected], www.meda.se, Corp. ID: 556427-2812
Upcoming reporting dates
Interim report, January-March May 3, 2016
Interim report, January-June July 21, 2016
Interim report, January-September October 26, 2016
Forward-looking statement This report is not an offer to sell or a solicitation to buy shares in Meda. This report also contains certain forward-looking
statements with respect to certain future events and Meda’s potential financial performance. These forward-looking
statements can be identified by the fact that they do not relate only to historical or current facts and may sometimes include
words such as “may”, “will”, “seek”, “anticipate”, “expect”, “estimate”, “intend”, “plan”, “forecast”, “believe”, or other words of
similar meaning. These forward-looking statements reflect the current expectations on future events of the management at
the time such statements are made, but are made subject to a number of risks and uncertainties. In the event such risks or
uncertainties materialize, Meda’s results could be materially affected. The risks and uncertainties include, but are not limited
to, risks associated with the inherent uncertainty of pharmaceutical research and product development, manufacturing and
commercialization, the impact of competitive products, patents, legal challenges, government regulation and approval,
Meda’s ability to secure new products for commercialization and/or development, and other risks and uncertainties detailed
from time to time in Meda AB’s interim or annual reports, prospectuses, or press releases. Listeners and readers are
cautioned that no forward-looking statement is a guarantee of future performance and that actual results could differ
materially from those contained in the forward-looking statement. Meda does not intend or undertake to update any such
forward-looking statements.
Meda AB discloses the information provided herein pursuant to the Securities Market Act and/or the Financial Instruments
Trading Act. This information was submitted for publication on February 10, 2016 at 22:30 p.m.
Year-end Report, January-December 2015 12 (24)
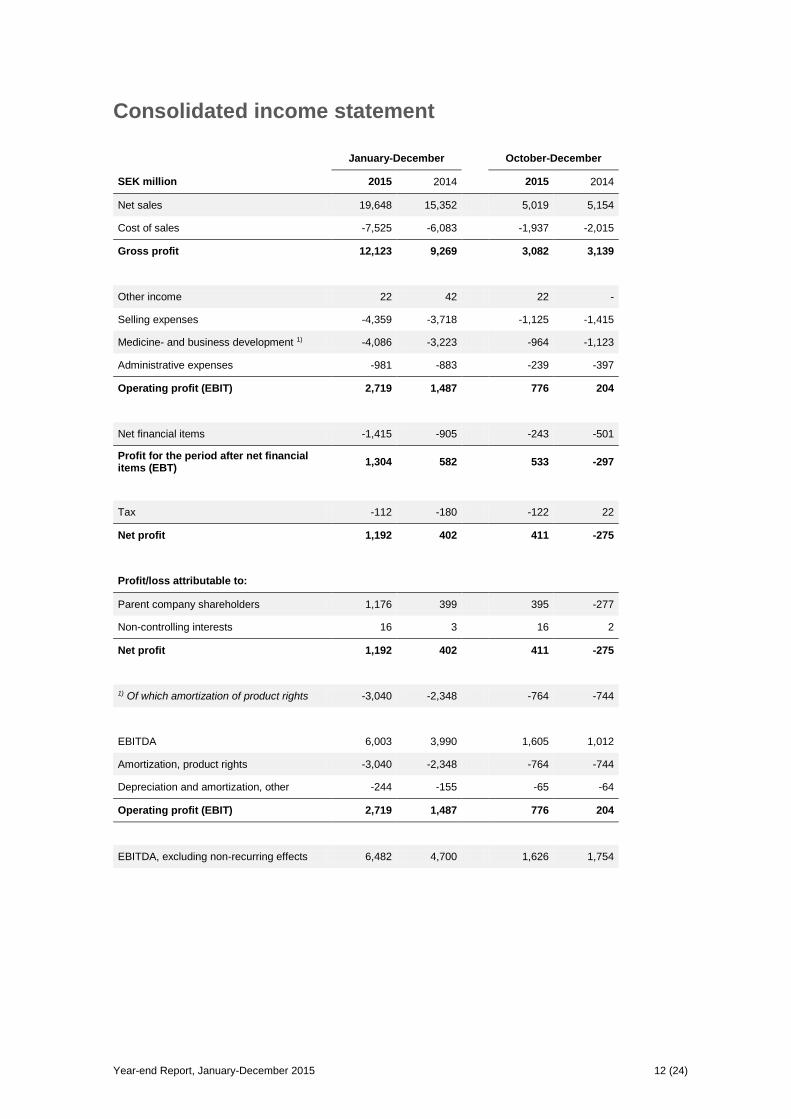
Consolidated income statement
January-December October-December
SEK million 2015 2014 2015 2014
Net sales 19,648 15,352 5,019 5,154
Cost of sales -7,525 -6,083 -1,937 -2,015
Gross profit 12,123 9,269 3,082 3,139
Other income 22 42 22 -
Selling expenses -4,359 -3,718 -1,125 -1,415
Medicine- and business development 1) -4,086 -3,223 -964 -1,123
Administrative expenses -981 -883 -239 -397
Operating profit (EBIT) 2,719 1,487 776 204
Net financial items -1,415 -905 -243 -501
Profit for the period after net financial items (EBT)
1,304 582 533 -297
Tax -112 -180 -122 22
Net profit 1,192 402 411 -275
Profit/loss attributable to:
Parent company shareholders 1,176 399 395 -277
Non-controlling interests 16 3 16 2
Net profit 1,192 402 411 -275
1) Of which amortization of product rights -3,040 -2,348 -764 -744
EBITDA 6,003 3,990 1,605 1,012
Amortization, product rights -3,040 -2,348 -764 -744
Depreciation and amortization, other -244 -155 -65 -64
Operating profit (EBIT) 2,719 1,487 776 204
EBITDA, excluding non-recurring effects 6,482 4,700 1,626 1,754

Year-end Report, January-December 2015 13 (24)
Consolidated statement of earnings and comprehensive income
January-December October-December
SEK million 2015 2014 2015 2014
Net profit 1,192 402 411 -275
Items that will not be reclassified to the income statement
Revaluation of defined-benefit pension plans and similar plans, net of tax
55 -292 -17 -193
55 -292 -17 -193
Items that may be reclassified to the income statement
Translation difference -376 2,118 -790 1,116
Translation difference reversed to income statement
-3 -11 -3 -6
Hedge of net investment, net of tax 308 -1,014 443 -587
Cash flow hedges, net of tax -1 9 2 4
Available-for-sale financial assets, net of tax -9 6 0 6
-81 1,108 -348 533
Other comprehensive income, net of tax -26 816 -365 340
Total comprehensive income 1,166 1,218 46 65
Profit attributable to:
Parent company shareholders 1,176 1,215 56 63
Non-controlling interests 16 3 16 2
Total comprehensive income 1,192 1,218 72 65

Year-end Report, January-December 2015 14 (24)
Share data
January-December October-December
2015 2014 2015 2014
Earnings per share 1)
Basic earnings per share, SEK 3.22 1.23 1.08 -0.92
Diluted earnings per share, SEK 3.22 1.23 1.08 -0.92
Basic earnings per share, SEK 2) 4.14 3.64 1.11 1.47
Diluted earnings per share, SEK 2) 4.14 3.64 1.11 1.47
Average number of shares 1)
Basic (thousands) 365,467 323,397 365,467 352,254
Diluted (thousands) 365,467 323,397 365,467 352,254
Number of shares on closing day 1)
Basic (thousands) 365,467 365,467 365,467 365,467
Diluted (thousands) 365,467 365,467 365,467 365,467
1) Recalculated for 2014 to consider the bonus issue element in the 2014 new share issue.
2) Earnings per share excluding non-recurring effects. See page 7 for explanation of non-recurring effects.

Year-end Report, January-December 2015 15 (24)
Consolidated balance sheet
December 31 December 31
SEK million 2015 2014
ASSETS
Non-current assets
- Property, plant and equipment 1,504 1,692
- Intangible 1) 47,478 50,798
- Other non-current assets 2,097 2,015
Non-current assets 51,079 54,505
Current assets
- Inventories 2,876 2,988
- Current receivables 5,279 5,308
- Cash and cash equivalents 1,612 2,311
Current assets 9,767 10,607
Total assets 60,846 65,112
EQUITY AND LIABILITIES
Equity 20,956 20,680
Non-current liabilities
- Borrowings 22,507 26,817
- Pension obligations 2,273 2,430
- Deferred tax liabilities 4,708 5,278
- Other non-current liabilities 2,829 2,861
Non-current liabilities 32,317 37,386
Current liabilities
- Borrowings 2,355 1,391
- Other current liabilities 5,218 5,655
Current liabilities 7,573 7,046
Total equity and liabilities 60,846 65,112
1) Of which goodwill 25,524 25,352

Year-end Report, January-December 2015 16 (24)
Consolidated cash flow statement
January-December October-December
SEK million 2015 2014 2015 2014
Profit after financial items 1,304 582 533 -297
Adjustments for items not included in cash flow 3,373 2,668 820 998
Net change in pensions -45 -46 -14 -25
Net change in other provisions -112 601 -32 645
Income taxes paid -803 -551 -342 -220
Cash flow from operating activities before changes in working capital
3,717 3,254 965 1,101
Cash flow from changes in working capital
Inventories -198 182 -76 72
Receivables -96 -536 221 -318
Liabilities -99 142 238 196
Cash flow from operating activities 3,324 3,042 1,348 1,051
Cash flow from investing activities 262 -8,906 621 -8,790
Cash flow from financing activities -4,272 7,914 -1,876 9,739
Cash flow for the period -686 2,050 93 2,000
Cash and cash equivalents at period´s start 2,311 178 1,535 239
Exchange-rate difference in cash and cash equivalents
-13 83 -16 72
Cash and cash equivalents at period´s end 1,612 2,311 1,612 2,311
Free cash flow, SEK million 3,095 2,901 1,288 986
Free cash flow, excluding non-recurring effects, SEK million
4,172 3,000 1,434 1,053
Cash earnings per share, SEK 1) 8.47 8.97 3.52 2.86
Cash earnings per share, excluding non-recurring effects, SEK 1)
11.41 9.28 3.92 3.07
1) Recalculated for 2014 to consider the bonus issue element in 2014 new share issue
Year-end Report, January-December 2015 17 (24)
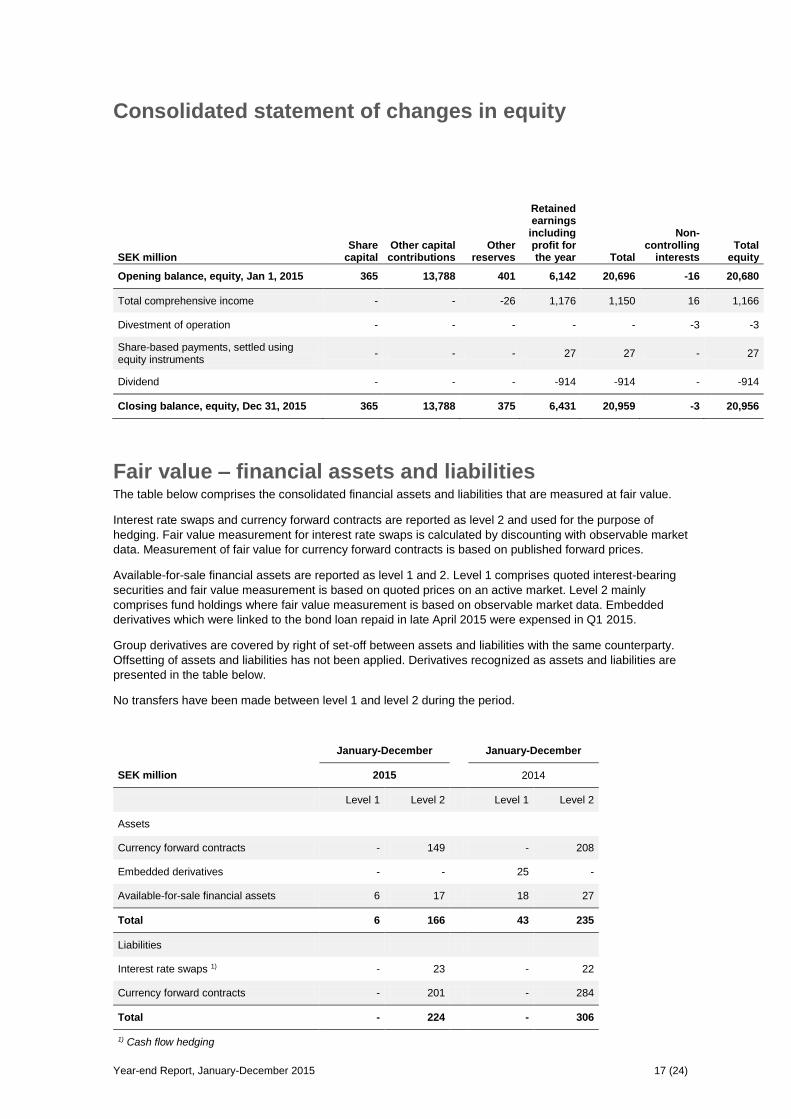
Consolidated statement of changes in equity
SEK million Share
capital Other capital contributions
Other reserves
Retained earnings
including profit for the year Total
Non-controlling
interests Total
equity
Opening balance, equity, Jan 1, 2015 365 13,788 401 6,142 20,696 -16 20,680
Total comprehensive income - - -26 1,176 1,150 16 1,166
Divestment of operation - - - - - -3 -3
Share-based payments, settled using equity instruments
- - - 27 27 - 27
Dividend - - - -914 -914 - -914
Closing balance, equity, Dec 31, 2015 365 13,788 375 6,431 20,959 -3 20,956
Fair value – financial assets and liabilities The table below comprises the consolidated financial assets and liabilities that are measured at fair value.
Interest rate swaps and currency forward contracts are reported as level 2 and used for the purpose of
hedging. Fair value measurement for interest rate swaps is calculated by discounting with observable market
data. Measurement of fair value for currency forward contracts is based on published forward prices.
Available-for-sale financial assets are reported as level 1 and 2. Level 1 comprises quoted interest-bearing
securities and fair value measurement is based on quoted prices on an active market. Level 2 mainly
comprises fund holdings where fair value measurement is based on observable market data. Embedded
derivatives which were linked to the bond loan repaid in late April 2015 were expensed in Q1 2015.
Group derivatives are covered by right of set-off between assets and liabilities with the same counterparty.
Offsetting of assets and liabilities has not been applied. Derivatives recognized as assets and liabilities are
presented in the table below.
No transfers have been made between level 1 and level 2 during the period.
January-December January-December
SEK million 2015 2014
Level 1 Level 2 Level 1 Level 2
Assets
Currency forward contracts - 149 - 208
Embedded derivatives - - 25 -
Available-for-sale financial assets 6 17 18 27
Total 6 166 43 235
Liabilities
Interest rate swaps 1) - 23 - 22
Currency forward contracts - 201 - 284
Total - 224 - 306
1) Cash flow hedging

Year-end Report, January-December 2015 18 (24)
Parent company
The parent company’s net sales reached SEK 6,422 million (6,011), of which intra-Group sales represented
SEK 4,390 million (4,052). Operating profit totaled SEK 950 million (809) and net financial items amounted to
SEK 214 million (261).
Investments in intellectual property rights for the period were SEK 17 million (6), and investments in property,
plant, and equipment totaled SEK 46 million (0).
Financial assets on December 31, 2015, totaled SEK 40,224 million, compared to SEK 38,425 million at the
end of the previous year. Cash and cash equivalents amounted to SEK 968 million (611).
Income statement for the parent company
January-December
SEK million 2015 2014
Net sales 6,422 6,011
Cost of sales -3,831 -3,388
Gross profit 2,591 2,623
Selling expenses -518 -484
Medicine- and development expenses -912 -1,173
Administrative expenses -211 -157
Operating profit (EBIT) 950 809
Net financial items 214 261
Profit for the period after net financial items (EBT)
1,164 1,070
Appropriations and tax -710 -285
Net profit 454 785

Year-end Report, January-December 2015 19 (24)
Balance sheet for the parent company
December 31 December 31
2015 2014
ASSETS
Non-current assets
- Intangible 4,459 5,137
- Property, plant and equipment 45 1
- Financial 40,224 38,425
Total non-current assets 44,728 43,563
Current assets
- Inventories 535 493
- Current receivables 1,725 1,837
- Cash and bank balances 968 611
Total current assets 3,228 2,941
Total assets 47,956 46,504
EQUITY AND LIABILITIES
Restricted equity 3,540 3,540
Non-restricted equity 12,623 13,109
Total equity 16,163 16,649
Untaxed reserves 1,520 1,679
Provisions 75 67
Non-current liabilities 24,075 24,682
Current liabilities 6,123 3,427
Total equity and liabilities 47,956 46,504
Year-end Report, January-December 2015 20 (24)
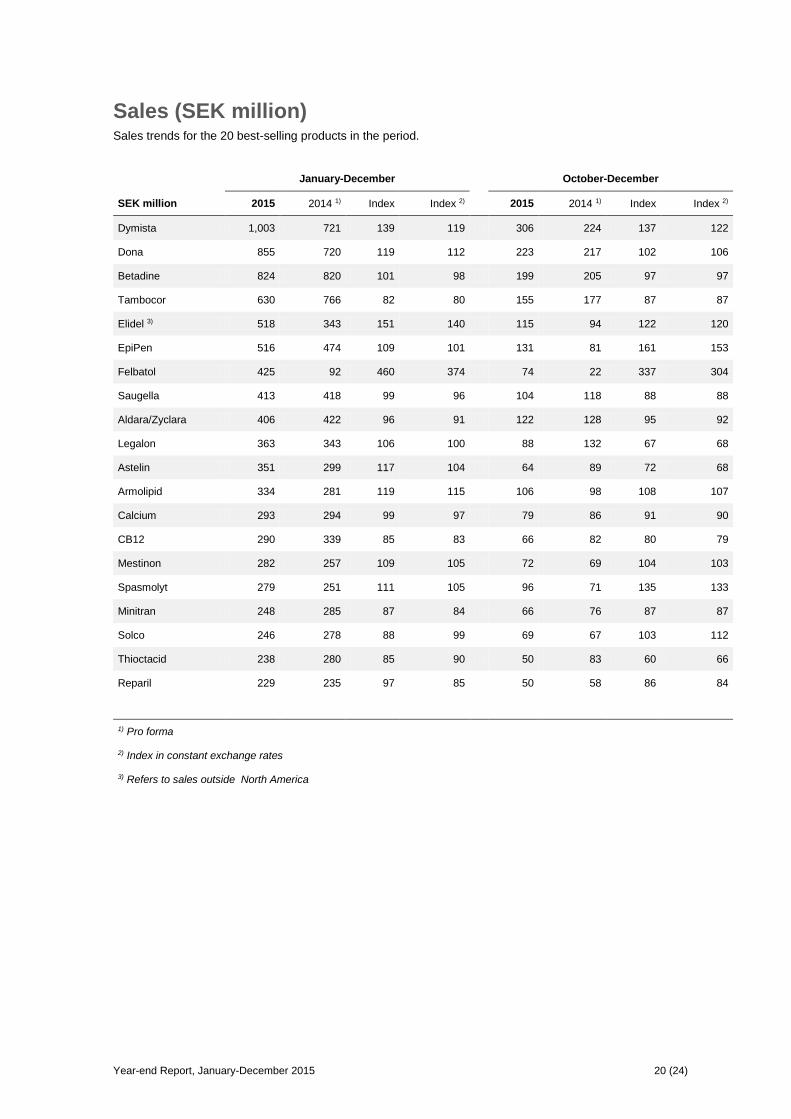
Sales (SEK million) Sales trends for the 20 best-selling products in the period.
January-December October-December
SEK million 2015 2014 1) Index Index 2) 2015 2014 1) Index Index 2)
Dymista 1,003 721 139 119 306 224 137 122
Dona 855 720 119 112 223 217 102 106
Betadine 824 820 101 98 199 205 97 97
Tambocor 630 766 82 80 155 177 87 87
Elidel 3) 518 343 151 140 115 94 122 120
EpiPen 516 474 109 101 131 81 161 153
Felbatol 425 92 460 374 74 22 337 304
Saugella 413 418 99 96 104 118 88 88
Aldara/Zyclara 406 422 96 91 122 128 95 92
Legalon 363 343 106 100 88 132 67 68
Astelin 351 299 117 104 64 89 72 68
Armolipid 334 281 119 115 106 98 108 107
Calcium 293 294 99 97 79 86 91 90
CB12 290 339 85 83 66 82 80 79
Mestinon 282 257 109 105 72 69 104 103
Spasmolyt 279 251 111 105 96 71 135 133
Minitran 248 285 87 84 66 76 87 87
Solco 246 278 88 99 69 67 103 112
Thioctacid 238 280 85 90 50 83 60 66
Reparil 229 235 97 85 50 58 86 84
1) Pro forma
2) Index in constant exchange rates
3) Refers to sales outside North America

Year-end Report, January-December 2015 21 (24)
Segment information
External net sales
January-December October-December
SEK million 2015 2014 2015 2014
Western Europe 12,213 10,205 3,120 3,455
USA 3,354 2,542 857 705
Emerging Markets 3,660 2,370 956 879
Other Sales 421 235 86 115
Total external net sales 19,648 15,352 5,019 5,154
EBITDA
January-December October-December
SEK million 2015 2014 2015 2014
Western Europe 4,247 3,327 1,095 933
USA 1,432 972 332 308
Emerging Markets 1,281 663 356 256
Other Sales -957 -972 -178 -485
Total EBITDA 6,003 3,990 1,605 1,012
EBITDA, excluding non-recurring effects
January-December October-December
SEK million 2015 2014 2015 2014
Western Europe 4,476 3,772 1,116 1,368
USA 1,432 972 332 308
Emerging Markets 1,294 697 356 290
Other Sales -720 -741 -178 -212
Total EBITDA 6,482 4,700 1,626 1,754

Year-end Report, January-December 2015 22 (24)
Key ratios
January-December October-December
2015 2014 2015 2014
Related to earnings
Net sales, SEK million 19,648 15,352 5,019 5,154
- Growth, total 28% 17% -3% 49%
- Growth, constant exchange rates 21% 12% -5% 41%
- Growth, organic -1% *) 2% -5% 0%
Gross margin 61.7% 60.6% 61.4% 61.5%
EBITDA, SEK million 6,003 3,990 1,605 1,012
EBITDA margin 30.6% 26.0% 32.0% 19.6%
EBITDA excluding non-recurring items, SEK million
6,482 4,700 1,626 1,754
EBITDA margin excluding non-recurring items 33.0% 30.6% 32.4% 34.0%
Earnings per share, SEK 3.22 1.23 1.08 -0.92
Earnings per share excluding non-recurring items, SEK
4.14 3.64 1.11 1.47
Adjusted earnings per share, SEK 10.57 9.29 2.72 3.10
Related to cash flow
Free cash flow, SEK million 3,095 2,901 1,288 986
Cash earnings per share, SEK 8.47 8.97 3.52 2.86
Free cash flow excluding non-recurring items, SEK million
4,172 3,000 1,434 1,053
Cash earnings per share excluding non-recurring items, SEK
11.41 9.28 3.92 3.07
Return/Efficiency
Adjusted free cash flow/capital employed 10.3% 10.7%
Adjusted free cash flow/equity 20.1% 18.2%
Net working capital/net sales 22% 23%
Free cash flow/EBITDA 52% 73% 80% 97%
Free cash flow excluding non-recurring items/EBITDA excluding non-recurring items
64% 64% 88% 60%
Related to balance sheet
Net debt, SEK million 25,505 28,244
Net debt/equity ratio, times 1.2 1.4
Equity per share, SEK (at end of period) 57.3 56.6
Equity/asset ratio 34% 32%
Other
Net debt/adjusted EBITDA 4.11 5.20
*) Organic growth pro forma
Year-end Report, January-December 2015 23 (24)
Definitions related to sales comments
Sales by geographic area
Western Europe – Western Europe, excluding the Baltics, Poland, Czech Republic, Slovakia, and Hungary.
US – includes Canada.
Emerging Markets – Eastern Europe, including the Baltics, Poland, Czech Republic, Slovakia, and Hungary,
Turkey, the Middle East, Mexico, and other non-European markets.
Other Sales – revenues from contract manufacturing, services, and other income.
Sales by product category
Rx – prescription drugs and specialty products.
Cx/OTC – non-prescription products.
Other Sales – revenues from contract manufacturing, services, and other income.
Definitions of key ratios
Related to earnings
Growth, total – sales development in relation to the same period previous year.
Growth, constant exchange rates – sales development in relation to the same period the previous year
adjusted for currency effects.
Growth, organic – sales development adjusted for currency effects, acquisitions, disposals, discontinued
products, and revenues from the cooperation agreement with Valeant.
Organic growth pro forma – sales development in relation to the same period the previous year including
acquisitions of products and business adjusted for currency effects.
Earnings per share – profit for the period attributable to parent company shareholders in relation to weighted
average number of shares for the period. Where applicable, the comparative periods have been recalculated
to consider the bonus issue element.
Adjusted earnings per share – earnings per share adjusted for non-recurring items and amortizations on
product rights and related tax.
Related to cash flow
Free cash flow – cash flow from operating activities less cash flow from investing activities (excluding
acquired product rights and acquired operations).
Cash earnings per share – free cash flow for the period in relation to weighted average number of shares for
the period. Where applicable, the comparative periods have been recalculated to consider the bonus issue
element.
Return/Efficiency
Capital employed – the balance sheet total less cash and cash equivalents, tax provisions, and non-interest
bearing liabilities.
Adjusted free cash flow/capital employed – free cash flow rolling 12 months excluding non-recurring items
and paid interest in relation to average capital employed.
Free cash flow/equity – free cash flow rolling 12 months excluding non-recurring items in relation to average
equity.
Net working capital/net sales – current assets less current liabilities in relation to net sales rolling 12 months
pro forma.

Year-end Report, January-December 2015 24 (24)
Related to balance sheet
Net debt – net of interest-bearing liabilities and interest-bearing provisions less cash and cash equivalents,
including current investments and interest-bearing non-current financial assets.
Net debt/equity ratio – net debt divided by equity.
Equity/assets ratio – equity as a percentage of the balance sheet total.
Other
Net debt/adjusted EBITDA – net debt divided by EBITDA rolling 12 months pro forma excluding restructuring
and transaction costs due to acquisitions.