year - arden-capital.com · corporate governance report directors' profiles senior...
TRANSCRIPT
Private Equity Investments Advisory
2 0 1 5A n n u a l R e p o r t
5Y E A RA n n i v e r s a r y
Corporate Data
Directors Name Appointed on Resigned onMr. Gyanisha Seegobin Gopee 22 April 2013 23 January 2015Mr. Kiransingh Gulab 22 April 2013 -Mr. George Manyere 28 November 2014 -Mr. Walter Tineyi Kambwanji 28 November 2014 -Mr. Preetam R. Prayag 23 January 2015 -Mr. Richard Godfrey Muirimi 9 July 2015 -Mr. Alwyn Erhardt Scholtz 9 July 2015 -Mr. Cornelis Tobias Vermaak 9 July 2015 -Mr. Simon Frederick William Village 25 January 2016 -
Company Secretary and AdministratorFiducieForte Management Services LimitedLevel 2, Alexander House, Silicone Avenue, Ebène Cybercity, Republic of Mauritius
Registered OfficeC/O FiducieForte Management Services LimitedLevel 2, Alexander House, Silicon Avenue, Ebène Cybercity, Republic of Mauritius
AuditorsKPMGKPMG Centre, 31 Cybercity Ebène, Republic of Mauritius
BankersAfrAsia Bank Limited4th floor, NeXTeracom Tower III, Ebène, Republic of Mauritius
Investee CompaniesAfrican Sun Limited www.africansunhotels.comDawn Properties Limited www.dawnpropertyconsult.co.zwFML Logistics (Private) Limited www.fmloil.co.zwGetBucks Financial Services Limited www.getbucks.co.zwGetSure Life Assurance Company (Private) Limited www.GetSure.co.zw
BRAINWORKS LIMITED(Formerly Brainworks Capital Management Limited)
FMLOIL COMPANY OF ZIMBABWE (PRIVATE) LIMITED
Dawn Properties LimitedHotels and Resorts
Hotels and Resorts
Hotels and Resorts
We abide by the set of values listed below which we believe to be pivotal to our success.
IntegrityWe strive to provide services to stakeholders with the highest levels of integrity. This is essential to achieving the shared
goal of creating value for all stakeholders.
RespectWe believe in respect amongst team members and for all stakeholders thereby creating lasting relationships.
Excellence and innovationWe believe that excellence in execution is critical in the quest to create long-term value for investors.
TeamworkWe have a team of professionals that have strong experience in their areas of expertise. In order for the Company and
its stakeholders to benefit from this wide skill set, management and staff work as a team to create long-term value.
SharingWe believe in broad-based and transparent sharing of value created from the Company’s investment activities through
various ways. Beneficiaries include the Company’s shareholders, directors and employees, Government and local
communities.
1
Value Statement
2015 Annual Report

Contents
2

Contents
04
16
17
21
24
27
30
31
32
33
35
36
38
42
44
93
94
95
96
Letter to Shareholders
Leadership
Corporate Governance Report
Directors' Profiles
Senior Management's Profiles
Corporate Social Responsibility
Secretary’s Certificate under Section 166(D) of the Mauritius Companies Act
Directors' Report for the year ended 31 December 2015
2015 Financial Statements
Independent Auditors' Report to the members of Brainworks Limited
Consolidated and separate statements of financial position as at 31 December 2015
Consolidated and separate statements of profit or loss and other comprehensive income
for the year ended 31 December 2015
Consolidated and separate statements of changes in equity for the year ended 31 December 2015
Consolidated and separate statements of cash flows for the year ended 31 December 2015
Notes to the consolidated and separate financial statements for the year ended 31 December 2015
Supplementary Information
Five year Financial Summary
Annual General Meeting notice
Annual General Meeting proxy form
These financial statements are presented in United States Dollars ("US$") and are rounded off to the next dollar.
32015 Annual Report

Letter to Shareholders
4
Dear Shareholders
We are pleased to present the consolidated financial statements for Brainworks Limited ("the Company" or "Brainworks") and its subsidiaries (herein collectively referred to as "the Group") for the year ended 31 December 2015.
The year 2015 witnessed significant transformation of the Company, beginning with the completion of the scheme of reorganisation which resulted in a Mauritian-registered holding company Brainworks. Shareholding in African Sun Limited ("African Sun") was increased from 43% to 58% while that in Dawn Properties Limited ("Dawn Properties") was increased from 29% to 67%. As a result, African Sun became a subsidiary on 30 April 2015, while Dawn Properties became a subsidiary on 31 March 2015. However, the reorganisation of the Group was officially completed on 17 June 2015, on which date Brainworks Capital Management (Private) Limited ("Brainworks Capital") became a subsidiary of Brainworks.
The Group now comprises of the holding company Brainworks domiciled in Mauritius, a wholly-owned subsidiary of Brainworks Capital, operating subsidiaries, associate investments and other investments as follows:
• Dawn Properties at 67% shareholding (31 December 2014: 29%) and is listed on the Zimbabwe Stock Exchange ("ZSE");• African Sun at 58% shareholding (31 December 2014: 43%) and is listed on the ZSE;• GetBucks Financial Services (Private) Limited ("GetBucks") an associate company in which the Group held 34% at 31
December 2015 (31 December 2014: 45%) and is listed on the ZSE;• GetSure Life Assurance Company (Private) Limited ("GetSure") at 100% shareholding (31 December 2014: 100%). GetSure
was not operational as at 31 December 2014 and commenced operations during 2015. It was capitalised to US$2,4 million in 2015 to facilitate the setting up of operations, and meeting the minimum capital requirements of the Insurance and Pensions Commission ("IPEC");
• FML Logistics (Private) Limited ("FML Logistics") at 100% shareholding (31 December 2014: 100%); and • MyBucks S.A., a Luxembourg financial services group with microfinance operations in 9 African countries and 2 European
countries, operating under the GetBucks brand, at 2.5% shareholding (31 December 2014: 2.5%). The operating environment has been difficult primarily due to liquidity constraints, subdued foreign direct investment and the high cost of funding. Notwithstanding this, and the numerous attendant challenges facing the Zimbabwean economy, Brainworks made significant strategic achievements during 2015, notably:
• Approval and consummation of a Scheme of Reorganisation which resulted in the creating of a Mauritian-registered holding company, Brainworks;
• Successfully launched a US$35 million rights offer which raised US$30 million in March 2015; • Acquisition of a controlling stake in African Sun, which paved the way for consolidation of African Sun into the Brainworks
Group from 30 April 2015;• Acquisition of a controlling stake in Dawn Properties, which paved the way for consolidation of Dawn Properties into the
Brainworks Group from 31 March 2015;• Capitalisation of GetSure for a total of US$2,4 million and commencement of operations;• GetBucks successfully converted from a credit-only microfinance company to a deposit-taking microfinance institution;• Successfully exited from Ecobank Zimbabwe Holdings ("Ecobank") for a total of US$12,5 million which enabled the Group
to focus on GetBucks, a licensed deposit-taking microfinance institution;• The Group distributed US$4,7 million in dividends to shareholders through cash dividends and an in-specie dividend;• Growing the FML Logistics fleet of trucks and tankers by an additional 20 trucks to bring the total fleet to a sizeable 30; and• Successfully listed GetBucks on the ZSE in January 2016, and to-date, the share has performed very well.
5
Letter to Shareholders
2015 Annual Report
Overview of the Zimbabwean economic environment
The Zimbabwean economy was relatively flat in 2015, with a lower than expected GDP growth of 1.5%, against the projected growth rate of 3.5%. The low GDP growth was largely attributed to the continued tight liquidity constraints, high costs of funding and low demand with negative inflation rates that closed at -2.47% at 31 December 2015. The capital and current account deficit grew from US$40,3 million in 2014 to an estimated deficit of US$385,8 million in 2015.
Further challenges included the global decline in the commodity prices, and the decline in agricultural productivity due to poor rains. This meant that the country could not generate as much revenue from its exports. Commodity prices are expected to continue to decline in part due to the strengthening of the US Dollar following the interest rate hike by the Federal Reserve Bank of America.
The direction and performance of the US Dollar will continue to have a direct impact on the local economy. In particular, and directly related to Brainworks’ key investee companies, Dawn Properties and African Sun suffered the direct impact of the strong US Dollar on the tourism industry, which makes Zimbabwe comparatively more expensive than other destinations in the region.
Our Businesses The Group’s business activities can be classified under two main categories:
1. Proprietary Investments; and2. Advisory Services.
1. Proprietary Investments
The proprietary investments of the Group broadly fall within four sectors: financial services, real estate, hospitality, and logistics.
Financial Services Sector
Investee Company: GetBucks Financial Services Limited ("GetBucks")
2015 Performance Highlights
GetBucks operates 13 branches in the major cities and towns in Zimbabwe and has grown its loan book to US$11 million with a customer-base of over 18,000. GetBucks achieved a profit after tax of US$4,56 million for the year ended 30 June 2015, and the company declared a final dividend of US$1 million. This strong performance continued for the remainder of the year, with GetBucks achieving a profit after tax of US$1,99 million for the 6 months to 31 December 2015. GetBucks declared an interim dividend of US$0,5 million at 31 December 2015. This brings its 12 months’ performance to 31 December 2015 to a profit after tax of US$2 million and total dividends declared of US$1,5 million.
GetBucks was granted a Deposit-Taking Microfinance Institution Licence by the Reserve Bank of Zimbabwe on 19 July 2015, making it one of the first deposit-taking microfinance Institutions in the country. The conversion to a deposit-taking institution will strengthen the ability of the institution to offer its clients competitive products and a better range of financial services and products.
The company also successfully listed on the ZSE on 15 January 2016 through an Initial Public Offering (IPO) where the company raised US$3,2 million, notwithstanding the tight liquidity conditions prevailing.
6
Letter to Shareholders
2015 Annual Report
During the year, Brainworks distributed to its shareholders by way of a dividend in specie a total of 121,526,666 shares in GetBucks. This resulted in Brainworks’ direct interest in GetBucks reducing to 34.06%. Brainworks’ interest in the company was further reduced to 31.14% following the IPO by GetBucks which resulted in a dilution for all shareholders in GetBucks.
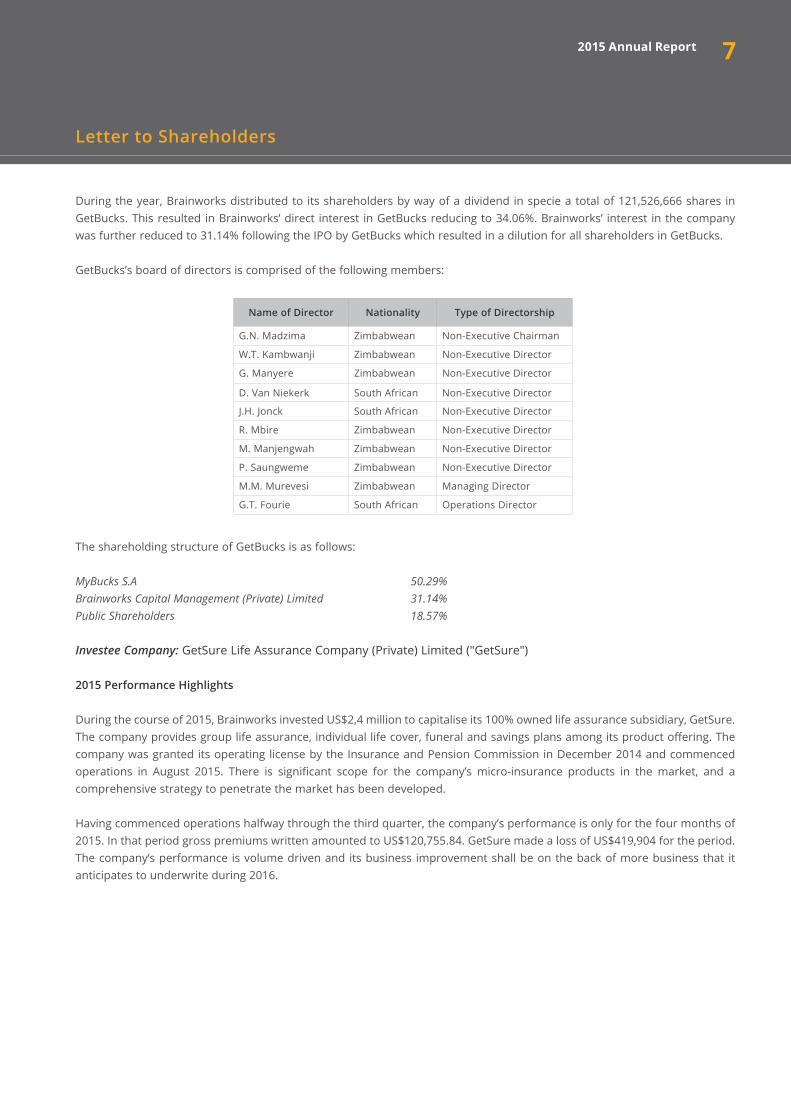
GetBucks’s board of directors is comprised of the following members:
The shareholding structure of GetBucks is as follows:
MyBucks S.A 50.29%Brainworks Capital Management (Private) Limited 31.14%Public Shareholders 18.57%
Investee Company: GetSure Life Assurance Company (Private) Limited ("GetSure")
2015 Performance Highlights
During the course of 2015, Brainworks invested US$2,4 million to capitalise its 100% owned life assurance subsidiary, GetSure. The company provides group life assurance, individual life cover, funeral and savings plans among its product offering. The company was granted its operating license by the Insurance and Pension Commission in December 2014 and commenced operations in August 2015. There is significant scope for the company’s micro-insurance products in the market, and a comprehensive strategy to penetrate the market has been developed.
Having commenced operations halfway through the third quarter, the company’s performance is only for the four months of 2015. In that period gross premiums written amounted to US$120,755.84. GetSure made a loss of US$419,904 for the period. The company’s performance is volume driven and its business improvement shall be on the back of more business that it anticipates to underwrite during 2016.
Name of Director Nationality Type of Directorship
G.N. Madzima Zimbabwean Non-Executive Chairman
W.T. Kambwanji Zimbabwean Non-Executive Director
G. Manyere Zimbabwean Non-Executive Director
D. Van Niekerk South African Non-Executive Director
J.H. Jonck South African Non-Executive Director
R. Mbire Zimbabwean Non-Executive Director
M. Manjengwah Zimbabwean Non-Executive Director
P. Saungweme Zimbabwean Non-Executive Director
M.M. Murevesi Zimbabwean Managing Director
G.T. Fourie South African Operations Director
Letter to Shareholders
72015 Annual Report

GetSure’s board of directors is comprised of the following members:
The shareholding structure of GetSure is as follows:
Brainworks Capital Management (Private) Limited 100%
Hospitality Sector
Investee Company: African Sun Limited ("African Sun")
2015 Performance Highlights
2015 was another difficult year for the tourism industry in Zimbabwe, caused by the slow global economic recovery, a weak South African Rand ("ZAR") and a strong US Dollar which made Zimbabwe an expensive destination within the region. African Sun was not spared from the prevailing conditions in the sector. Group revenue for the fifteen-month period ended 31 December 2015 was US$63,15 million. On a like-for-like comparison, revenue decreased by 8% as the Group experienced noticeable decline in average monthly revenues during the period under review. The drop in average monthly revenue was mainly as a result of a 5% reduction in the average daily rate ("ADR") from US$98 achieved in the prior year to US$93. The ADR drop is partially attributable to the introduction of Value Added Tax on foreign revenue which could not be recovered from guests resulting in reduced revenues for the hotels. Occupancy marginally increased to 49% from 48%. Overall there was a 4% drop in revenue per available room ("RevPAR"), from US$47 to US$45.
Despite the additional three months of trading, EBITDA dropped by 15% to US$7,09 million from US$8,34 million achieved last year. On a positive note, finance costs for the period under review decreased by 19% from US$3,09 million to US$2,5 million following repayments of borrowings amounting to US$9,61 million during the period. The loss for the period was US$8,31 million compared to a loss of US$2,29 million posted last year. The loss for the period was a result of the following once-off significant events:
• Impairment loss on property and equipment of US$2,34 million as a result of a change in accounting policy necessitated by the need to harmonise accounting policies within the Group;
• Change in accounting estimates for service stocks, which increased the impairment charge for the period by US$1,93 million which was brought about by the need to reflect the correct pattern of usage of the services stocks;
• Staff retrenchments and separation costs of US$2,24 million; and• Provision for closure costs of foreign operations of US$1 million.
8
Letter to Shareholders
Name of Director Nationality Type of Directorship
W. Kambwanji Zimbabwean Non-Executive Chairman
F. Chisango Zimbabwean Non-Executive Director
J. Jonck South African Non-Executive Director
G. Manyere Zimbabwean Non-Executive Director
G. Niemand South African Non-Executive Director
G. Nyengedza Zimbabwean Non-Executive Director
D. Van Niekerk South African Non-Executive Director
K. Mubvumbi Zimbabwean Executive Director
2015 Annual Report

During 2015, Brainworks acquired additional shareholding of 15% in African Sun, increasing its stake from 43% to 58%. This resulted in African Sun becoming a subsidiary of Brainworks. Having taken control of the company, Brainworks implemented a series of transactions that will lead to African Sun returning to profitability in 2016 and beyond. These include:
• Implementing a staff reduction exercise that reduced the number of African Sun employees from 1 490 to 1 179. This was done at a cost of US$2,24 million. Annual savings expected from this initiative is about US$2,7 million;
• Change in business model from a hotel operator to hotel investment company. This resulted in the appointment of Legacy Hotels as a manager for selected hotels, and retaining the IHG franchise on others. These changes also meant that head office staff complement reduced from 44 to 17, and a consequent reduction in annual costs from US$4,1 million to US$2,77 million;
• Closure of loss making hotels namely Amber Accra Hotel, Ghana and Beitbridge Express Hotel. The two hotels were not self-sustaining, with a combined loss of US$2,62 million for the period under review, which will be avoided going forward;
• Abandoned the regional strategy to focus on the Zimbabwe operations. Consequently, all foreign operations (Nigeria, Ghana, South Africa and Mauritius) were closed, and this will stop the cash drain from the profitable Zimbabwe operations; and
• Continued the drive to clean the balance sheet by reducing borrowings, from a total of US$17,35 million reported in September 2014, to US$7,74 million as at 31 December 2015, this has helped reduce financing costs by 31% on a like-for-like basis, and African Sun’s effective cost of funds to 11% from 13% reported as at September 2014.
African Sun’s board of directors is comprised of the following members:
The shareholding structure of African Sun is as follows:
Brainworks Capital Management (Private) Limited 57.64%Public Shareholders 42.36%
9
Letter to Shareholders
Name of Director Nationality Type of Directorship
H. Nkala Zimbabwean Non-Executive Chairman
E. A. Fundira Zimbabwean Non-Executive Director
W. T. Kambwanji Zimbabwean Non-Executive Director
A. Makamure Zimbabwean Non-Executive Director
G. Manyere Zimbabwean Non-Executive Director
N. G. Maphosa Zimbabwean Non-Executive Director
T. Ndebele Zimbabwean Non-Executive Director
T. Nuy Dutch Non-Executive Director
E. T. Shangwa Zimbabwean Managing Director
B. H. Dirorimwe Zimbabwean Finance Director
2015 Annual Report

Real Estate Sector
Investee Company: Dawn Properties Limited
2015 Performance Highlights
During 2015, Brainworks acquired additional shareholding of 38% in Dawn Properties, increasing its stake from 29% to 67%. This resulted in Dawn Properties becoming a subsidiary of Brainworks. Following the increase in shareholding by Brainworks, a mandatory offer to minority shareholders in Dawn Properties was made in line with ZSE requirements. An additional 4% shareholding was acquired from the mandatory offer process. Brainworks was awarded a management contract effective 1 January 2016, to manage the operations of the company. The management contract will result in improved performance, lean operating structure and cordial relations with African Sun, another Brainworks subsidiary.
In the nine months to 31 December 2015, Dawn Properties achieved a turnover of US$3,445 million. Operating expenses were higher at US$3,787 million with significant once-off charges including retrenchment costs at US$514,109. As a result, the Group achieved an operating loss of US$341,930.
Dawn Properties carried out an extensive restructuring of its operations during 2015 and post the restructuring, it is expected that operating costs will significantly reduce in 2016, and the company should return to profitability under the new leaner and efficient structure.
Dawn Properties incurred an income tax charge of US$3,771 million in 2015. This was as a result of Dawn Properties losing an historic tax case against ZIMRA. The court ruled that the treatment of properties for tax purposes on the adoption of multicurrency’s in 2009 was incorrect. As a result of the tax case, Dawn Properties was instructed to pay a tax charge of US$3,6 million. As a result, Dawn Properties achieved a loss after tax of US$3,843 million.
The carrying value of the investment property has remained at US$84,528 million as per the valuation performed by Dawn Property Consulting (Private) Limited ("DPC").
The performance of the hotel property portfolio is expected to improve following the various initiatives undertaken. Further, improved performance is expected from management’s increased focus on property development, with the first development, Elizabeth Windsor Gardens, expected to be delivered in the 2016 financial year.
Mr. Justin Dowa resigned as Chief Executive Officer and director of the company with effect from 1 December 2015. The board has appointed Patrick Matute as Chief Executive Officer with effect from 1 December 2015. Messrs P. Saungweme was appointed to the board on 21 September 2015.
Dawn Properties’ board of directors is now comprised of the following members:
10
Letter to Shareholders
Name of Director Nationality Type of Directorship
P.J. Matute Zimbabwean Chief Executive Officer
P.P. Gwatidzo Zimbabwean Non-Executive Director
G. Manyere Zimbabwean Non-Executive Director
W.T. Kambwanji Zimbabwean Non-Executive Director
T.N. Chiweshe Zimbabwean Non-Executive Director
M. Mukonoweshuro Zimbabwean Non-Executive Director
P. Saungweme Zimbabwean Executive Director
2015 Annual Report

The shareholding structure of Dawn Properties is as follows:
Brainworks Capital Management (Private) Limited 66.77%Public Shareholders 44.33%
Logistics Sector
Investee Company: FML Logistics (Private) Limited ("FML Logistics")
2015 Performance Highlights
In 2015, FML Logistics continued to position itself in the regional fuel transportation market as a fuel transporter of choice due to its world-class ADR (European Agreement for the Carriage of Dangerous Goods and Use of Transportable Pressure Equipment Regulations) compliant trucks and tankers, its professional approach, and highly skilled and motivated staff.
By March 2015, FML Logistics had an additional 8 trucks and tankers on the road, and was busy with new contracts which had been acquired through a loan from a local bank. Post this acquisition, the total fleet comprised 18 units.
During the first half of the year, demand for additional units was strong and the company had signed dedicated long-term contracts with major oil marketing companies such as Dalbit International and Trafigura for the delivery of product to Zambia and the Democratic Republic of Congo ("DRC"). On the back of this, FML Logistics arranged for an additional loan and an additional 12 trucks and tankers were sourced from the United Kingdom at very competitive prices. The total fleet size is currently 30 trucks and tankers, which in the market, is a very lucrative number with which to source contracts.
However, in the last two months of 2015, the fuel transportation industry experienced a significant downturn in work due to various reasons, such as the disruption in the Zambian payment system for fuel, a reduction in imports to Zambia and the DRC caused by the tightening economic situation, low commodity prices and the onset of the rainy season, which resulted in open cast mines slowing or discontinuing operations. To mitigate the adverse effects of this on FML Logistics, management commenced an expenditure reduction program and ceased all repairs and maintenance, sent all drivers and non-essential staff on leave and curtailed any other non-critical operating costs.
In addition to this, management continues in its efforts to actively seek work from local and regional contractors including Engen, IPG and Total, and is at present involved in ongoing discussions with local and international clients for the supply and purchase of fuel.
FML Logistics’ board of directors is comprised of the following members:
The shareholding structure of FML Logistics is as follows:
Brainworks Capital Management (Private) Limited 100%
11
Letter to Shareholders
Name of Director Nationality Type of Directorship
G. Manyere Zimbabwean Non-Executive Chairman
W. T. Kambwanji Zimbabwean Non-Executive Director
P.J. Matute Zimbabwean Non-Executive Director
T.N. Chiweshe Zimbabwean Non-Executive Director
W. Waterworth Zimbabwean Managing Director
2015 Annual Report

2. Advisory Services
During 2015, the Company’s advisory services were limited to in-house activities for Brainworks’ subsidiaries. The Company took control of ZSE-listed African Sun and Dawn Properties. Following these changes in control of the two subsidiaries, the companies underwent mandatory offers to minority shareholders. In addition, the advisory team has been extensively involved in the listing process for Brainworks and has worked closely with our corporate advisors in the various jurisdictions where the Company is considering a listing.
During the course of the year, the Company picked up external mandates in the agricultural, energy, mining and media sectors which are ongoing.
Brainworks’ Securities Investment Advisory license was renewed by the Securities and Exchange Commission of Zimbabwe for 2016.
Brainworks’ operations outside Zimbabwe have begun taking shape with a presence established by the Company in Equatorial Guinea. The Company is currently in the process of setting up a micro-lending business in that country and has already engaged professional advisors to this end. In addition, Brainworks has been invited to submit expressions of interest for several advisory mandates from the government. We remain confident in the potential of the Equatorial Guinean market and the role that we will play in that market.
Listing Update
Brainworks has engaged corporate advisors to steer the process of listing Brainworks on an international stock exchange, and also on the ZSE. The process is ongoing and we are confident that the Company will secure a listing in the short-term.
Compliance with Zimbabwe's Indigenisation Laws
In 2011, the shareholding of the Company was vetted by the Ministry of Youth Development, Indigenisation and Empowerment and was certified compliant with the indigenisation regulations. Over the years, subsequent fundraising exercises have resulted in more foreign ownership of the Company. The Group is committed to compliance and have put in place a process that ensures compliance within five years. Pursuant to this, an indigenisation plan was submitted in terms of the Zimbabwe Indigenisation and Economic Empowerment Act (Chapter 14:33) which achieves compliance with the requirements of the law.
12
Letter to Shareholders
2015 Annual Report

# Shareholders Shares %
1 Red Rock Capital 289,920,520 33.59%
2 Blue Air Capital 225,000,000 26.07%
3 Ecobank Asset Management Company (Private) Limited 77,750,000 9.01%
4 Fintrust Pension Fund 67,241,425 7.79%
5 Brainworks Capital Private Equity Managers Staff Trust 34,498,997 4.00%
6 Zahra Investments Trust 25,000,000 2.90%
7 Matthew Daniels Trust 25,000,000 2.90%
8 TDC Investment Trust 15,000,000 1.74%
9 AWT Investment Trust 15,000,000 1.74%
10 Carnaud Metalbox Pension Fund 11,458,917 1.33%
11 Comarton Consultants (Private) Limited 11,109,670 1.29%
12 Brainworks Investments Trust 10,000,000 1.16%
13 Green Valley Investment Trust 10,000,000 1.16%
14 PTC Self Insurance Plan 9,851,608 1.14%
15 Comarton Consultants Preservation Fund 7,825,669 0.91%
16 Spiral Farming (Private) Limited 7,069,132 0.82%
17 Association of Trust Schools Pension Fund - Christian Brothers College 2,574,282 0.30%
18 Jacob Bethel (Zimbabwe) Corporation Pension Fund 2,426,870 0.28%
19 Comarton Consultants Pension Fund 2,329,795 0.27%
20 Comarton Consortium Self Insurance Pool 2,000,000 0.23%
21 Brands Africa Pension Fund 1,878,930 0.22%
22 CIH Group Pension Fund 1,783,333 0.21%
23 Archer Clothing Manufacturers (Private) Limited Pension Fund 1,360,000 0.16%
24 Zimbabwe International Trade Fair Company Pension Fund 1,294,331 0.15%
25 Atchison Actuarial Services Company (Private) Limited 1,000,000 0.12%
26 Tourism Industry Pension Fund 850,000 0.10%
27 Zimbabwe Agricultural Society Pension Fund 808,957 0.09%
28 Brainworks Capital Pension Fund 785,295 0.09%
29 Marathon Group Pension Fund 759,000 0.09%
30 Association of Trust Schools Pension Fund - Petra High School 600,000 0.07%
31 Femina Garments Pension Fund 428,747 0.05%
32 United Styles Pension Fund 180,000 0.02%
33 Comarton Consultants Preservation Fund - Style International 177,970 0.02%
34 Comarton Consultants Preservation Fund - Henroy Trucking 98,500 0.01%
Total Issued Shares 863,061,948 100.00%
Shareholding and Broad-Based Local Ownership
Below is the shareholding of the Company as at 31 March 2016, which shows that the Company was 40.43% locally-owned and 59.66% foreign-owned. An indigenisation plan was submitted in terms of the Zimbabwe Indigenisation and Economic Empowerment Act (Chapter 14:33) which achieves compliance with the requirements of the law.
Over 11,000 indigenous Zimbabweans are beneficiaries in the Company through the Pension Funds, as well as through direct shareholding in the Company as follows:
13
Letter to Shareholders
2015 Annual Report
Management remuneration
As the Company is pursuing a listing, necessary support structures have been put in place and these include revisions to existing management contracts. The remuneration of executive management has been reviewed as a result. The key terms of executive management remuneration are as follows: • Management are on long-term service contracts of at least 5 years with the Company;• Management are on salaries and benefits comparable to market levels which are subject to review by the Board
Remuneration Committee periodically; and• Management are entitled to an annual bonus equivalent to 20% of advisory fee income after deducting operating
expenses.
Non-Executive Directors remuneration
Non-Executive Directors’ fees for the year amount to US$37,500 for their services as directors.
Financial results
The financial results for the year ended 31 December 2015 should be read and interpreted cognisant of the fact that the Group undertook a reorganisation that was effective from 17 June 2015. The reorganisation created a new holding company Brainworks Limited from that date. However, the results have been prepared on the pooling of interests’ method as the reorganisation was between companies under common control.
The Group generated total revenue of US$39,6 million for the year ended 31 December 2015. The significant increase in revenue compared to the prior year revenue of US$4,9 million is attributable to the consolidation of Dawn Properties and African Sun previously accounted for as associates. Also included in revenue is the share of associate income of US$2,5 million, comprising the share of profits from Ecobank and GetBucks. Dividends of US$5,28 million relate to dividends received in specie and in cash. Upon such payment to shareholders, the fair value of the dividend was recognised in the statement of profit and loss and other comprehensive income.
Operating costs were US$28,58 million made up of staff costs (US$8,9 million), administration costs (US$15,9 million) and impairment and depreciation (US$12 million). Included in the total costs were once-off costs amounting to US$14,6 million. These were made up of US$2,1 million in retrenchment costs mostly in African Sun, US$2 million in impairment expenses incurred to align accounting policies within the group, US$4,6 million in the revaluation of investments to fair value on acquisition of control, US$2,3 million incurred to close-off loss-making foreign operations, and US$3,6 million incurred in tax charges at Dawn Properties after the judgement was passed on the protracted tax case.
The Group posted a profit for the year of US$4,76 million.
The Group’s balance sheet grew to US$146,11 million from US$51,76 million as at 31 December 2014. This was driven by the acquisitions of significant shareholding in subsidiaries Dawn Properties and African Sun leading to the consolidation of the two companies onto our balance sheet. A significant portion of the balance sheet relates to property and equipment US$113,93 million largely comprising hotel properties and hotel equipment. Investments in associates have come down after the reclassification of Dawn Properties and African Sun to subsidiaries, and the disposal of the Ecobank investment. Cash and cash equivalents significantly increased from US$0,9 million to US$5,45 million reflecting the growth of the Group. Inventory of US$2,54 million relates to hotel stocks.
The merger reserve of US$19,996 million is the difference between the consideration paid and the capital of the acquired entity. The carrying values of the assets and liabilities of the companies on reorganisation were not adjusted to fair value on consolidation, as this was a common control transaction. However, the difference between the cost of investment and the nominal value of the share capital acquired from the Zimbabwean subsidiary was debited to the merger reserve.
14
Letter to Shareholders
2015 Annual Report
Mr. Preetam Prayag Mr.George ManyereOutgoing Group Board Chairman Group Chief Executive Officer
Shareholders’ funds grew from US$31,39 million in 2014 to US$65,73 million following the rights offer that was undertaken during the year which raised US$30 million in new capital. The non-controlling interest of US$28,48 million relates to minority shareholders’ interests in Dawn Properties and African Sun following the recognition of those two entities as subsidiaries.
Directorate
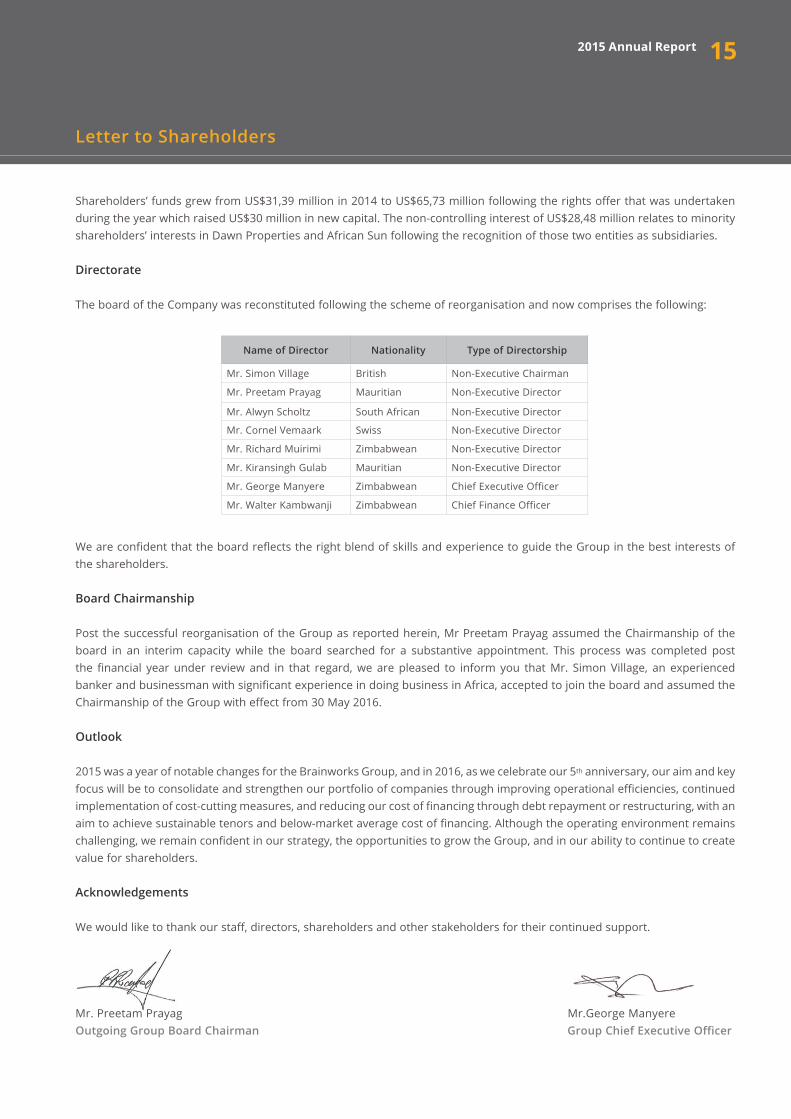
The board of the Company was reconstituted following the scheme of reorganisation and now comprises the following:
We are confident that the board reflects the right blend of skills and experience to guide the Group in the best interests of the shareholders.
Board Chairmanship
Post the successful reorganisation of the Group as reported herein, Mr Preetam Prayag assumed the Chairmanship of the board in an interim capacity while the board searched for a substantive appointment. This process was completed post the financial year under review and in that regard, we are pleased to inform you that Mr. Simon Village, an experienced banker and businessman with significant experience in doing business in Africa, accepted to join the board and assumed the Chairmanship of the Group with effect from 30 May 2016.
Outlook
2015 was a year of notable changes for the Brainworks Group, and in 2016, as we celebrate our 5th anniversary, our aim and key focus will be to consolidate and strengthen our portfolio of companies through improving operational efficiencies, continued implementation of cost-cutting measures, and reducing our cost of financing through debt repayment or restructuring, with an aim to achieve sustainable tenors and below-market average cost of financing. Although the operating environment remains challenging, we remain confident in our strategy, the opportunities to grow the Group, and in our ability to continue to create value for shareholders. Acknowledgements
We would like to thank our staff, directors, shareholders and other stakeholders for their continued support.
15
Letter to Shareholders
Name of Director Nationality Type of Directorship
Mr. Simon Village British Non-Executive Chairman
Mr. Preetam Prayag Mauritian Non-Executive Director
Mr. Alwyn Scholtz South African Non-Executive Director
Mr. Cornel Vemaark Swiss Non-Executive Director
Mr. Richard Muirimi Zimbabwean Non-Executive Director
Mr. Kiransingh Gulab Mauritian Non-Executive Director
Mr. George Manyere Zimbabwean Chief Executive Officer
Mr. Walter Kambwanji Zimbabwean Chief Finance Officer
2015 Annual Report

Leadership
16

17
Leadership
Corporate Governance Report
Statement of Compliance
The Brainworks Limited ("the Company" or "Brainworks") board has put in place a framework for governance that is in line with the code of corporate practices and conduct, as set out in the Code of Corporate Governance for Mauritius ("the Code"). The disclosures included in this review are consistent with the requirements of the Code.
The board is responsible for the overall stewardship of the Company and its subsidiaries. The board sets out the strategic direction, and establishes the procedures and practices for effective controls, while ensuring adherence of the Company and its subsidiaries to relevant regulations and policies. The board has set up board committees to assist in meeting specific issues and objectives in support of the board’s mandate and responsibilities. The framework provides for delegation of authority, while enabling the board to retain adequate control and maintain an effective oversight over the affairs and operations of the Company.
Segregation of Responsibilities
The day-to-day running of the business is entrusted to the management executives, with the board regularly monitoring compliance thereof to set objectives and policies. In this respect, the Board Charter provides a clear definition of executive and non-executive director roles. The chairperson’s role is to enure that the board is effective in its duties of setting out and implementing the Group’s direction and strategy, while providing leadership.
Board Effectiveness
All newly appointed directors undergo an induction programme to ensure a clear understanding of their roles and responsibilities, as well as providing them with an overview of the Company’s activities, strategy and structure.
Board of Directors
The board comprises of two executive directors, and five independent non-executive directors. All directors serve for a maximum period of one year, and are subject to retirement by rotation and re-election by members in a general meeting. Board appointments are made in terms of the policy on nominations and appointments, and such appointments are transparent and a matter for the board as a whole. There are no fixed-term contracts for executive directors and the notice period for termination or resignation is one calendar month. There is no restraint of trade period for executive directors.
Independence of the Board
The Board's independence from the executive management team is ensured by the following:
• Separation of the roles of the chairman and chief executive officer, with the chairman being independent;• The board being dominated by non-executive directors;• The audit, investment, nomination, risk, remuneration, and social and ethics committees having a majority of non-
executive directors;• Non-executive directors not holding service contracts;• All directors having access to the advice and services of the Company Secretary; and • With prior agreement from the chairman, all directors are entitled to seek independent professional advice concerning
the affairs of the Company at the Company's expense.
2015 Annual Report
18
The following non-executive directors chair the various sub-committees of the board:
• Mr. Alwyn Scholtz (independent): Audit and Risk Committee• Mr. Cornel Vermaak (independent): Investments Committee• Mr. Kiran Gulab (independent): Remuneration Committee• Mr. Richard Muirimi (independent): Corporate Social Responsibility Committee
The criteria used to assess the independence of the directors are as follows:
• Whether the director is a representative of a shareholder who has the ability to control or significantly influence management or the board;
• Whether the director has a direct or indirect interest in the Company which exceeds 5% of the Company's total number of shares in issue;
• Whether the director has a direct or indirect interest in the Company which is less that 5% of the Company's total number of shares in issue, but is material to the director's personal wealth;
• Whether the director has been employed by the Company in any executive capacity, or appointed as the designated auditor or partner in the Company's external audit firm, or senior legal advisor for the preceding financial year;
• Whether the director is a member of the immediate family of an individual who is or has during the preceding financial year been employed by the Company in an executive capacity;
• Whether the director is a professional adviser to the Company other than in the capacity as a director;• Whether the director is free from any business or other relationship (contractual or statutory) which could be seen by an
objective outsider to interfere materially with the director's capacity to act in an independent manner, such as being a director of a material customer or supplier to the Company; and
• Whether the director receives remuneration contingent upon the performance of the Company.
Directors Interests
A full list of directors' interest is maintained, and directors certify that the list is correct at each board meeting. Directors recuse themselves from any discussion and decision on matters in which they have a material financial interest.
Committees of the board
The board has set up the following four board committees to ensure delivery on its mandate:
• Audit and Risk Committee• Investments Committee• Remuneration Committee• Corporate Social Responsibility Committee
All Committees’ charters were approved by the board, setting out role, composition, powers, responsibility, structure, resources, and any other relevant matters for each committee.
Leadership
2015 Annual Report

19
Audit and Risk Committee
The Audit and Risk Committee monitors the integrity of the financial statements of the Company, primarily its annual and half-yearly reports, interim management statements, and any other formal announcement relating to its financial performance. It reviews significant financial reporting issues and judgments, which are contained in the reports and, in particular, review and challenge where necessary. The Committee keeps under review the adequacy and effectiveness of the Company’s internal financial controls and internal control and risk management systems, and also reviews and approves the statements to be included in the annual report concerning internal controls and risk management. The Committee considers and recommends to the Board, for shareholders’ approval at the Annual General Meeting, the appointment, re-appointment and removal of the Company’s auditors. The Company does not have a formalised internal audit department.
The Audit and Risk Committee continually examines the appropriateness of utilising independent internal auditors to periodically review activities of the Company.
Membership:
• Mr. Alwyn Scholtz (Chairman)• Mr. Kiransingh Gulab • Mr. Preetam R. Prayag
Investments Committee
The responsibilities and duties of the Investments Committee are to ensure that investment, disposals or acquisitions are relative to similar transactions in the industry, and are in line with the Group’s overall strategy, and ensure that appropriate due diligence procedures are followed when acquiring or disposing of assets. The Committee manages the process of capital allocation within the Group, and specifically ensures that investments/divestments increase shareholder value and meet the Group’s financial criteria. The Committee assesses the viability of capital projects and/or acquisition and/or disposals of assets and the effect they may have on the Group’s cash flow, as well as whether they comply with the Group’s overall strategy.
While performing such other investment-related functions as may be determined by the board from time to time, and at all times give due consideration to the relevant regulatory and legal provisions.
Membership:
• Mr. Cornel Vermaak (Chairman)• Mr. Richard Muirimi• Mr. Preetam R. Prayag
Remuneration Committee
The Remuneration Committee has an independent role, to oversee the remuneration process, consider and approve remuneration related issues and proposals and, if it considers it appropriate, to refer matters to the board. Review and determine the remuneration policy of the Group generally. Determine remuneration policy in relation to bonus and share incentive awards for the Group, and set remuneration policy to promote the achievement of the strategic objectives of the Group. Review the annual remuneration increases of employees in total, and members of the executive committee specifically. Review and approve the award of share incentives to employees. Review, as it deems necessary, or as it is requested to do so by the board or CEO, the service agreements of members of the executive committee and executive directors. Review and advise on the remuneration of executive directors and members of the executive committee. Review and advise on the remuneration of non-executive directors and the chairperson of the board. Review all benefits, including retirement benefits and other financial arrangements, for fairness, correctness and appropriateness.
Leadership
2015 Annual Report
20
Membership:
• Mr. Kiran Gulab (Chairman)• Mr. Cornel Vermaak• Mr. Richard Muirimi
Corporate Social Responsibility Committee
The Corporate Social Responsibility Committee is an integral component of the Corporate Social Responsibility ("CSR") process and the Committee’s duties include the following:
• Oversee the development and annual review of a policy and plan for CSR to recommend for approval to the board; • Monitor the implementation of the policy and plan for CSR taking place, by means of social responsibility management
systems and processes;• Ensure that the CSR plan is widely disseminated throughout the Group, and integrated in the day-to-day activities of the
Group;• Ensure that CSR assessments are performed on a continuous basis;• Ensure that management considers and implements appropriate CSR responses; • Ensure that continuous CSR monitoring by management takes place; • Review reporting concerning CSR that is to be included in the integrated report for it being timely, comprehensive and
relevant; • Monitor the Group’s activities, having regard to any relevant legislation, other legal requirements or prevailing codes
of best practise, with regard to matters relating to: social and economic development and good corporate citizenship, including the Group’s promotion of equality, prevention of unfair discrimination, and reduction of corruption; and
• Contribution to the development of the communities in which the Group’s activities are predominantly conducted, and maintain records of sponsorship, donations and charitable giving.
Membership:
• Mr. Richard Muirimi (Chairman)• Mr. Cornel Vermaak• Mr. Walter Kambwanji
Company Secretary
The board considered the competence, qualifications and experience of the Company Secretary, FiducieForte Management Services Limited ("Fiducie"), and deemed it fit to continue in the role as company secretary for Brainworks. Fiducie is independent of Brainworks, and the relationship with the board has been assessed, and is considered to be at arm’s length.
Leadership
2015 Annual Report

21
Mr. Simon VillageNon-Executive Chairman (British)
Mr. Simon Village, a resident of Mauritius, is the founding director of Argentum Limited, a company with substantial relationships across Africa, and a proven record of accomplishments in business development and corporate finance services to emerging corporates in Southern, Central and Eastern Africa. He has served on the boards of numerous international companies, and has led a number of successful global initiatives, with the foremost of these being the development of a series of commodity-backed funds, which his team listed in 13 countries, and which revolutionised the gold market, attracting some US$100 billion of new investment into that sector. He also led the financing and development of a number of resource companies, where he served as a director, including raising some US$500 million required for building the first gold mine in the DRC since that country’s independence. Prior to this, he was a Managing Director with HSBC in London, having worked his way up through HSBC as a top-ranked Financial Analyst to Head of Research for their emerging markets business, before being appointed as Managing Director of the securities business in South Africa, and prior to that De Beers in Southern Africa. He holds a Bachelor of Engineering (Honours) degree in Mining Engineering from the Camborne School of Mines in the United Kingdom.
Mr. Preetam PrayagNon-Executive Director (Mauritian)
Mr. Preetam Prayag, a resident of Mauritius, is an Executive Director of FiducieForte and its various subsidiaries, as well as, the Chief Executive Officer of Imara Trust Company (Mauritius) Limited, which are both management companies licensed by the Financial Services Commission of Mauritius. He also sits on the boards of a number of global businesses, and other private and public companies. He has over 20 years’ experience in the financial services sector. He joined the offshore financial services sector in 1994, where for seven years he worked as the manager of the Mauritius Offshore Business Activities Authority, which in 2001 became the Financial Services Commission. He was then appointed General Manager of SIC Management Services, a subsidiary of the State Investment Corporation, the investment arm of the government of Mauritius. Since 2005, he has been involved in management company operations as Managing Director of Beresford Trust & Corporate Services Limited which eventually amalgamated with Imara Trust Company (Mauritius) Limited, where he gained vast experience in corporate and trust structuring. He holds a BSc in Business Administration from the University of Buckingham (UK), an MBA from the University of Leicester (UK) and is a member of the Society of Trust and Estate Practitioners (STEP).
Directors' Profiles
Brainworks is managed and controlled from Mauritius, and its board includes three Mauritian resident directors.
Brief profiles of the Directors are set out below:
Leadership
2015 Annual Report

22
Leadership
Mr. Richard Godfrey MuirimiNon-Executive Director (Zimbabwean) Mr. Richard Muirimi has significant experience in pension and employee benefits services. In 1995, he founded Comarton Consultants (Private) Limited ("Comarton") and is currently its Managing Director. Comarton is a leading pension fund administrator in Zimbabwe, administering at least 40 pension funds. He was the Non-Executive Chairman of Kingdom Financial Holdings Limited ("KFHL") upon its formation in 1995 until he resigned from the board in 2005. During that period as Chairman of KFHL, he guided the company through the initial capitalisation through private placement, the IPO of KFHL on the ZSE, the establishment of subsidiaries in asset management, merchant banking, commercial banking and stock broking, and regional expansion. He was previously the Chairman of the Zimbabwe Association of Pension Funds from April 2002 to February 2004. He has been the Deputy Chairman of the Insurance and Pensions Commission since November 2005. He has also previously held senior positions in Zimnat Life Assurance Company Limited (1995 - 1998) and AON/Minet Insurance Brokers (1982 - 1995). In 1987, he graduated as a fellow of the Executive Development Program with the University of Zimbabwe.
Mr. George ManyereChief Executive Officer/Chief Investment Officer (Zimbabwean)
Mr. George Manyere is the Chief Executive Officer/Chief Investment Officer and founder of Brainworks. He has been involved in all phases of Brainworks development since its founding in 2011. Within the first five years of its formation, Brainworks has become one of Zimbabwe’s leading investment holding companies and a market leader in the provision of corporate advisory services. Under his leadership, Brainworks has successfully concluded approximately US$150 million in proprietary investments (80% equity transactions and 20% debt), and approximately US$500 million in third party corporate advisory transactions comprising both debt and equity transactions. Brainworks has successfully concluded investments in various sectors in Zimbabwe, namely financial services (banking and insurance), mobile payments and digital platforms, petroleum logistics, hospitality and real estate. Prior to founding Brainworks, he was an investment professional with the International Finance Corporation ("IFC"), headquartered in Washington DC. While at IFC, he was responsible for investing in excess of US$600 million in sub-Saharan Africa, managing a portfolio of investments in excess of US$400 million, and represented the IFC on several investee companies’ boards. He sits on several boards of directors, and holds a Bachelor of Accounting Science and Accounting Science (Honours) from the University of South Africa. He also holds a Certificate in Theory of Accounting from the University of South Africa, and has completed various international courses in finance, strategy and investment banking.
2015 Annual Report
23
Leadership
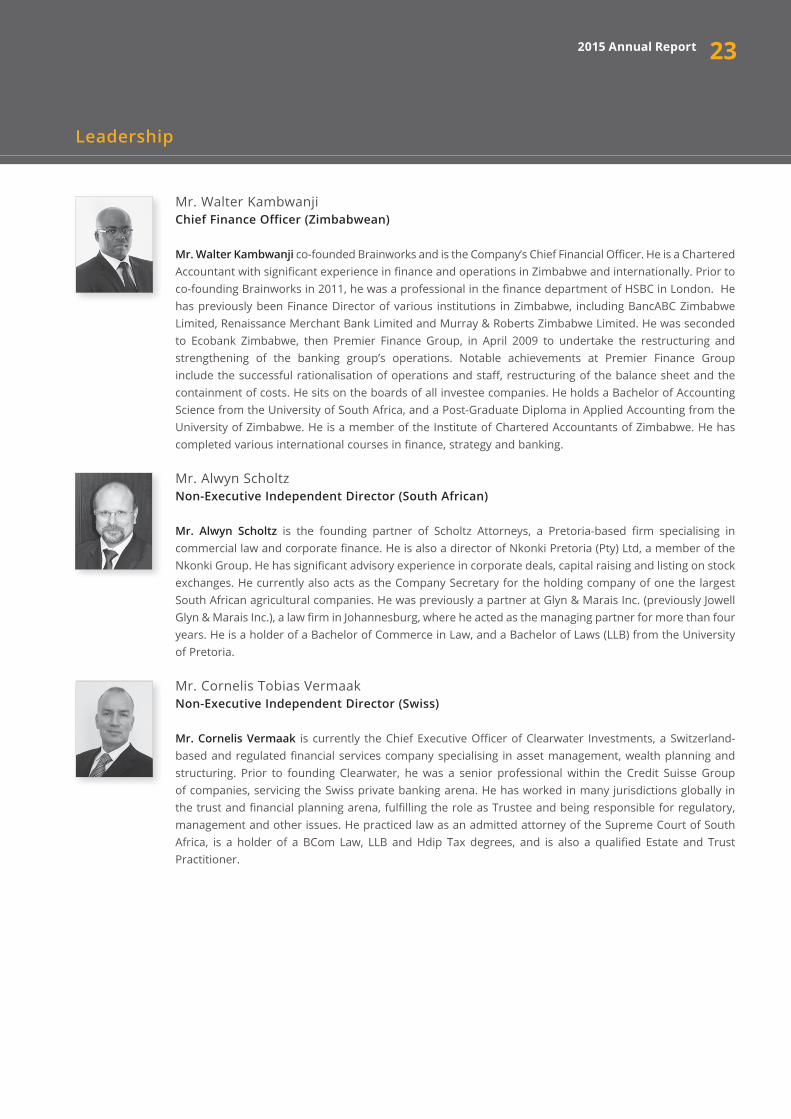
Mr. Walter KambwanjiChief Finance Officer (Zimbabwean) Mr. Walter Kambwanji co-founded Brainworks and is the Company’s Chief Financial Officer. He is a Chartered Accountant with significant experience in finance and operations in Zimbabwe and internationally. Prior to co-founding Brainworks in 2011, he was a professional in the finance department of HSBC in London. He has previously been Finance Director of various institutions in Zimbabwe, including BancABC Zimbabwe Limited, Renaissance Merchant Bank Limited and Murray & Roberts Zimbabwe Limited. He was seconded to Ecobank Zimbabwe, then Premier Finance Group, in April 2009 to undertake the restructuring and strengthening of the banking group’s operations. Notable achievements at Premier Finance Group include the successful rationalisation of operations and staff, restructuring of the balance sheet and the containment of costs. He sits on the boards of all investee companies. He holds a Bachelor of Accounting Science from the University of South Africa, and a Post-Graduate Diploma in Applied Accounting from the University of Zimbabwe. He is a member of the Institute of Chartered Accountants of Zimbabwe. He has completed various international courses in finance, strategy and banking.
Mr. Alwyn ScholtzNon-Executive Independent Director (South African)
Mr. Alwyn Scholtz is the founding partner of Scholtz Attorneys, a Pretoria-based firm specialising in commercial law and corporate finance. He is also a director of Nkonki Pretoria (Pty) Ltd, a member of the Nkonki Group. He has significant advisory experience in corporate deals, capital raising and listing on stock exchanges. He currently also acts as the Company Secretary for the holding company of one the largest South African agricultural companies. He was previously a partner at Glyn & Marais Inc. (previously Jowell Glyn & Marais Inc.), a law firm in Johannesburg, where he acted as the managing partner for more than four years. He is a holder of a Bachelor of Commerce in Law, and a Bachelor of Laws (LLB) from the University of Pretoria.
Mr. Cornelis Tobias VermaakNon-Executive Independent Director (Swiss)
Mr. Cornelis Vermaak is currently the Chief Executive Officer of Clearwater Investments, a Switzerland-based and regulated financial services company specialising in asset management, wealth planning and structuring. Prior to founding Clearwater, he was a senior professional within the Credit Suisse Group of companies, servicing the Swiss private banking arena. He has worked in many jurisdictions globally in the trust and financial planning arena, fulfilling the role as Trustee and being responsible for regulatory, management and other issues. He practiced law as an admitted attorney of the Supreme Court of South Africa, is a holder of a BCom Law, LLB and Hdip Tax degrees, and is also a qualified Estate and Trust Practitioner.
2015 Annual Report

24
Leadership
Mr. Kiransingh GulabNon-Executive Independent Director (Mauritian) Mr. Kiransingh Gulab, a resident of Mauritius, is an executive director of FiducieForte and its various subsidiaries, as well as the Chief Operating Officer of Imara Trust Company (Mauritius) Limited. He also sits on the boards of a number of global businesses and other companies. He has over 14 years’ experience in the finance and global business fields, during which time he has been responsible for the administration of global funds and other private equity companies, having aggregate Assets under Management of over US$2 billion. He also advises clients on corporate, asset planning and fund structuring, regulatory matters, administration and tax. He is a member of the Mauritius Institute of Professional Accountants ("MIPA") and of several UK professional bodies namely, the Chartered Institute of Management Accountants ("CIMA"), the Chartered Management Institute ("CMI"), the Chartered Institute of Securities & Investments ("CISI"), and the Society of Trust and Estate Practitioners ("STEP"). He is also a Chartered Global Management Accountant ("CGMA"), and further holds a BSc (Honours) in Management, with specialisation in accounting and finance, from the University of Mauritius. His previous roles have included executive posts at International Financial Services Limited, and CMT Ltée, two flagship companies in their respective fields in Mauritius.
Senior Management's Profiles
Mr. George ManyereChief Executive Officer/Chief Investment Officer (Zimbabwean) See profile on Page 22.
Mr. Walter KambwanjiChief Finance Officer (Zimbabwean) See profile on Page 23.
Mr. Patrick MatuteManaging Director – Real Estate (Zimbabwean) Mr. Patrick Matute has over eight years’ experience in corporate finance and private equity in sub-Saharan Africa. He began his career in 2008 with QuestCo Corporate Advisory, a corporate finance company based in Johannesburg, South Africa. While at QuestCo, he was involved in a number of corporate finance deals in the mining, industrial, financial services and real estate sectors. In 2012, he joined African Development Corporation ("ADC") as an investment manager focusing on financial services in sub-Saharan African. ADC was listed on the Frankfurt Stock Exchange and had investments in nine African countries, with total assets of approximately US$1,1 billion. He joined Brainworks in 2013, and has been involved in driving the advisory business and the real estate portfolio. During his time at Brainworks, he has been involved in the acquisition of a majority stake in Dawn Properties. He was previously the Chairman of Dawn Properties’ Finance and Investments committee where he oversaw the implementation of Dawn Properties’ entry into property development, and the acquisition of various residential stands for future development. He also sits on the boards of various Brainworks investee companies. He holds an MBA from Hult International Business School, a Bachelor of Commerce (Honours) in Finance (University of the Witwatersrand, South Africa), a Bachelor of Commerce (Finance) (NUST, Zimbabwe), and has completed CFA Level 1 and 2 exams.
2015 Annual Report

25
Leadership
Mr. Edwin ShangwaManaging Director – Hospitality (Zimbabwean) Mr. Edwin Shangwa has over 30 years’ experience in the tourism and hospitality sector. He joined the then Zimbabwe Sun Limited (now African Sun) in 1977 as a trainee accountant, and has held various positions within the African Sun Group including Finance Director of African Sun Zimbabwe and Group Company Secretary. As Managing Director of the hospitality sector for Brainworks, he oversees the management of the hotels and resorts under the various operating models. He is a Fellow of the Institute of Administration and Commerce of Southern Africa, and is a member of the Chartered Secretaries and Administrators of Zimbabwe. In addition, he holds an MBA from Nottingham Business School in the UK.
Mr. Wayne WaterworthManaging Director – Logistics (Zimbabwean) Mr. Wayne Waterworth is a highly experienced professional with more than 20 years’ experience in senior, general and technical management roles. He has a proven track record in a variety of industrial and commercial, and turn-key projects in the mining sectors, petrochemicals, and large and small-scale construction sectors. A chartered electrical engineer by profession, he has significant experience in the mining, construction and engineering sectors in Zimbabwe. Prior to joining Brainworks, he was the Managing Director of Falcon Gold Limited, a ZSE-listed gold mining company, a role he assumed in 2008.He has worked in Europe, and in various southern African countries. At Brainworks, he is also responsible for the technical evaluation of business opportunities, and assists the Company’s investee companies in strengthening their technical operations, and enhancing shareholder value.
Mr. Tendayi ChiwesheManaging Director – Advisory and Africa (Zimbabwean) Mr. Tendayi Chiweshe has over ten years’ experience in investment and corporate banking. His expertise includes corporate finance advisory, capital raising, infrastructure and municipal financing, credit processing and trade finance. He has led and managed capital raising exercises for private and listed companies, and has a thorough knowledge of equity and debt capital market transactions. He is well-versed in corporate banking credit initiation and management. Prior to joining Brainworks, he worked at Ecobank where he held the roles of Senior Account Manager and Head of Investment Banking. While at Ecobank, he oversaw a portfolio of structured commodity trade transactions for regional corporates and multinationals. He was previously Transaction Manager at Imara Corporate Finance where he oversaw advisory and capital raising transactions in Zimbabwe, Zambia and Malawi. He spearheads Brainworks operations in Africa and he sits on the boards of Dawn Properties and FML Logistics. He holds a Bachelor of Business Administration majoring in finance from Solusi University, and an International MBA from the European School of Management and Technology in Berlin. He speaks English, French and is conversational in Spanish.
Ms. Mercy Murevesi Managing Director – GetBucks Financial Services Limited (Zimbabwean) Ms. Mercy Murevesi has over 19 years' experience in the banking and finance sector, specifically regulatory risk management and compliance. Prior to GetBucks, she was the Country Risk Manager for Ecobank Zimbabwe and a SADC Cluster Risk Manager for the SADC cluster. She is a board member of the Zimbabwe Microfinance Wholesale Facility and MIB Glenrand Insurance Brokers. She holds an MBA, and a Bachelor of Commerce (Honours) from the University of Technology (Sydney, Australia).
2015 Annual Report

26
Leadership
Mr. Medicine MavhondoManaging Director – Mobile Payments & Digital Platforms (Zimbabwean) Mr. Medicine Mavhondo has over 8 years’ experience in banking and finance. In 2007, he joined Citigroup in New York as an analyst in the Global Structured Credit Products division on the Collateralised Debt Obligations Syndications desk, and later joined the Commodities Trading desk in London. Upon his return to Zimbabwe in 2012, he joined Rift Valley Holdings ("Rift Valley") as Group Finance Analyst. Rift Valley is an investment holding company with interests in the agro-processing sector across East and Southern Africa. At Rift Valley he was responsible for developing financial models, providing advisory services to the group companies, preparing strategy packs, presentations, the review of management practices and policies, and recommending changes to enhance operating efficiencies. More recently, he was co-principal of Advisory at MTM Advisory, a boutique management and financial advisory firm in Zimbabwe. As principal at MTM Advisory, he advised on one of the top merger and acquisition transactions of 2015 in the country. He joined Brainworks in October 2015 to lead the growth of the advisory business for the investee companies, as well as leading the advisory function on carefully selected mandates. He also provides oversight on the activities of Brainworks’ asset management business dealings. He holds a BA degree in Economics from Brown University (USA) and a Post-Graduate Diploma in Financial Economics from the University of Leicester (UK).
Mr. Kim MubvumbiGeneral Manager – GetSure Life Assurance Company (Private) Limited (Zimbabwean) Mr. Kim Mubvumbi has 28 years experience in the insurance industry. He holds an MBA, is an associate of AIISA, and is a holder of a Higher Certificate in Insurance. He is a founder member of Champions Insurance Company and Momentum Insurance Brokers.
Name of Director Direct holding Indirect holding Total Shares Held % of Issued Shares
Mr. Simon Village - - - -
Mr. Preetam Prayag - - - -
Mr. Richard Muirimi - - - -
Mr. George Manyere - 74,093,258 74,093,258 8.58%
Mr. Walter Kambwanji - 51,297,922 51,297,922 5.94%
Mr. Alwyn Scholtz - - - -
Mr. Cornelis Vermaak - - - -
Mr. Kiransingh Gulab - - - -
Total - 125,391,180 125,391,180 14.52%
2015 Annual Report
Attendance of board meetingsDirectors have attended all meetings held to-date.
Director’s interests in the equity of the Company
Directors’ service contractsThere were no service contracts between the Company and its non-executive directors during the year.
Related party transactionsRelated party transactions are covered fully in the Financial Statements.
Dealing in shares by the directors during the yearDealing in the Company’s securities by directors and company officials is in terms of the Company’s constitution.
Statement of remuneration philosophyThe non-executive directors are remunerated for their knowledge, experience and insight provided to the board and respective committees.
Share option plansThe Company does not have any share option plans. Dividend policyThe Company will pay 25% of profits earned as dividends subject to solvency and liquidity conditions being achieved to the satisfaction of the board.
Corporate Social Responsibility
The Group’s Corporate Social Responsibility ("CSR") activities are carried out at the individual investee companies. The Group promotes being an engaging and active corporate citizen, and this ethos is passed through to its subsidiaries and associates. These initiatives are anchored around ensuring that the Group is conscious of its activities in the communities in which it operates, its impact on the environment, and its employment policies. Central to all CSR activities is to ensure that its activities are responsible and sustainable, and do not compromise society’s ideals.
The pillars of the Group’s CSR policy are as follows:
• Local communities;• The environment;• Regulators; and • Employees.
Below are the CSR initiatives for each subsidiary:
African Sun Limited ("African Sun")
Employees
African Sun is the largest employer within the Group, and employs a large number of young people and casual employees. This poses several risks to the Group, and in this regard, African Sun’s labour practices are fair, transparent and in line with social norms and moral ethics.
In addition to hiring practices, the company’s operations are dispersed throughout the country, and often staff are required to relocate to different parts of the country, moving away from their families and communities. The company ensures that staff have accommodation, as well as amenities that help them integrate into the new communities they are relocated to.
27
Leadership
2015 Annual Report
28
Leadership
Community
African Sun has a portfolio of tourist resort hotels which are surrounded by rural communities and wild life reserve areas.
African Sun’s operations are cognisant of the needs of these communities, and efforts to support them in a sustainable manner are made through financial and material support, to NGO programs such as the Community Areas Management Program for Indigenous Resources (Campfire), whose mission is to assist rural communities in the management of their natural resources.
Within specified time frames, the hotels need to replace its linen, towels, utensils and other non-durable items. The company has a CSR scheme that these are donated to the elderly and children’s homes. In recent years, Chinotimba Old People’s Home in Victoria Falls, SOS Children’s Village, the children’s ward at Mpilo Hospital in Bulawayo, and Svinurai Children’s Home in Kariba have been beneficiaries of this scheme.
The hotels of African Sun have procurement and hiring practices in place to source local contractors, companies and staff, ensuring the hotels support the economic activities and communities directly around them.
Environment
Operations at the hotels are potentially detrimental to the environment, such as the laundry operations, which consume large amounts of water. As such, and in line with global practices, there is a system in place at the hotels where guests control when linen and towels require cleaning.
As guests use huge amounts of soaps and detergents, it is imperative that the hotels purchase biodegradable supplies where possible. Additionally, the water discharge systems ensure that, where necessary and possible, the water is treated and recycled for use in the hotel gardens. The hotels are subject to an annual inspection by the Environmental Management Authority ("EMA") to ensure that discharged water complies with EMA standards.
The hotels that have golf courses use vast quantities of fertilisers and water. It is important that fertilisers used on the courses are environmentally-friendly to protect the surrounding soils and wildlife, and water sources, and the water table, are not severely compromised while maintaining the course grounds.
The kitchens in hotels also use huge quantities of cooking oil. The hotels are responsible for ensuring they have practices in place to discharge the used oil in such a manner that it does not pollute the water sources in the localities in which they operate. The discharging of used oil is also regulated and inspected by the EMA.
The use of energy such as heating, cooling and lighting are significant costs in the running of an hotel. African Sun has been engaging alternative energy suppliers and solar companies to install rooftop solar panels to address the costs of electricity. At present, the hotels use low energy lights, which is in keeping with the thrust to go green, and to save costs.
Dawn Properties Limited ("Dawn Properties")
Dawn Properties has historically focused on its hotel property portfolio where it has been the landlord of African Sun’s hotels. Due to the symbiotic relationship between the activities of Dawn Properties and African Sun, there is a need to co-ordinate the CSR activities of both companies.
Dawn Properties has embarked on property development activities which will bring a range of challenges, and risks of doing business, that will significantly impact local resources, the environment, communities and businesses.
2015 Annual Report

29
Leadership
Environment
Property developments by nature have the potential to disrupt the environment. While there is regulation in terms of managing environmental impact through the EMA, the company needs to take pro-active steps to ensure that it complies with local environmental laws, codes of conduct and best practice.
The company has a good understanding of the expectations of the EMA to ensure that as it builds on land banks, or carries out development, the costs of regulation are captured. This prevents the company from overpaying for land, or miscalculating the costs of development, as the worst case scenario is for building to be halted due to the violation of statutes and laws, in particular those dealing with the wetlands.
At present, a key CSR matter in real estate development is the construction of green buildings. Dawn Properties is cognisant of green building design trends, and encourages its designers and architects to incorporate "green philosophies" in its buildings where possible.
FML Logistics (Private) Limited ("FML Logistics")
Employees
As a fuel logistics business, the bulk of FML Logistics’ employees are truck drivers. Drivers are on the road for long stretches giving rise to risks that require management to ensure that the well-being of these drivers is not compromised. Drivers are allowed adequate leave periods and days off to rest, and relief drivers are employed to ensure this is possible without disrupting the flow of business.
Environment
FML Logistics transports petroleum products by road across several countries in the region, which requires special handling to avoid leaks in the tankers. Also, if not properly maintained, trucks emit significant amounts of pollution into the atmosphere. In this regard, the company ensures that its drivers receive exceptional training to ensure they transport and handle the petroleum products safely; and its vehicles are regularly maintained for roadworthiness, to avoid excessive emissions, and to meet the highest regional and international standards required for logistical transportation.
GetBucks Financial Services Limited ("GetBucks")
Responsible Lending
The microlending industry is fraught with potential pitfalls of over-lending to individuals who are not able to repay the loans they borrow, leading to a perpetual debt cycle. GetBucks has implemented systems, policies and rules around responsible lending to ensure that its customers make sound financial decisions, spend their money wisely and do not incur unnecessary debt. The company does not offer facilities to consumers who are under debt review or administration. All these requirements help to ensure that its customers have the ability to pay back their loans. As the company’s loans are payday-based and unsecured, it is imperative that its customers’ current financial situation is healthy, and that they are able to repay their loans.
Financial Inclusion
As a micro lender the company is opening up financial space to individuals who have traditionally been left outside the banking infrastructure. The company does this by opening low cost accounts that help with financial inclusion of the unbanked population. This is in keeping with the thrust spearheaded by the Reserve Bank of Zimbabwe.
2015 Annual Report
30
Leadership
Secretary’s Certificate under Section 166(D) of the Mauritius Companies Act
We certify, to the best of our knowledge and belief, that the Company has filed with the Registrar of Companies all such returns as are required of the Company under this Act for the year ended 31 December 2015.
__________________________________________________________________________________________________________________________________FiducieForte Management Services LimitedCompany SecretaryLevel 2, Alexander House, Silicone Avenue, Ebène Cybercity, 72201Republic of Mauritius30 May 2016
Forte RedPantone 187CCMYK 0 100 79 20RGB 196 18 48
Cool GreyPantone Cool Grey 11CCMYK 0 0 2 68RGB 113 113 116
2015 Annual Report
31
Leadership
Directors’ report for the year ended 31 December 2015
The directors are pleased to present their report together with the audited financial statements of Brainworks Limited ("the Company") and its subsidiaries (together "the Group") for the year ended 31 December 2015.
Principal activity
The principal activity of the Company is that of investment holding, consultancy and advisory services.
Results and dividends
The results for the year are shown on Pages 36 and 37.
The directors approved dividend in specie of US$4,290,758 and US$450,000 in cash during the year (2014: nil).
Statement of directors’ responsibilities in respect of the financial statements
The Company’s directors are responsible for the preparation and fair presentation of the financial statements, comprising the statement of financial position as at 31 December 2015, the statements of profit or loss and other comprehensive income, the statements of changes in equity, the statements of cash flows for the year then ended, and the notes to the financial statements, which include a summary of significant accounting policies and other explanatory notes, in accordance with International Financial Reporting Standards, and in compliance with the requirements of the Mauritius Companies Act. The directors’ responsibilities include: designing, implementing and maintaining internal controls relevant to the preparation and fair presentation of these financial statements that are free from material misstatement, whether due to fraud or error, selecting and applying appropriate accounting policies and making accounting estimates that are reasonable in the circumstances. The directors have made an assessment of the Company’s ability to continue as a going concern and have no reason to believe the business will not be a going concern in the year ahead. Auditors
The auditors, KPMG, have expressed their willingness to continue in office, and will be automatically re-appointed at the Annual General Meeting.
By order of the Board.
__________________________________________________________________________________________________________________________________FiducieForte Management Services LimitedCompany SecretaryLevel 2, Alexander House, Silicone Avenue, Ebène Cybercity, 72201Republic of Mauritius30 May 2016
2015 Annual Report

2015 Financial Statements
32
33
2015 Financial StatementsIndependent Auditors' Report to the members of Brainworks Limited
Report on the Financial Statements
We have audited the consolidated and separate financial statements of Brainworks Limited (the "Company"), which comprise the statements of financial position as at 31 December 2015 and the statements of profit or loss and other comprehensive income, changes in equity and cash flows for the year then ended, and the notes to the financial statements which include a summary of significant accounting policies and other explanatory notes, as set out on Pages 45 to 92.
This report is made solely to the entity’s members, as a body, in accordance with Section 205 of the Mauritius Companies Act. Our audit work has been undertaken so that we might state to the entity’s members, as a body, those matters that we are required to state to them in an auditors’ report and for no other purpose. To the fullest extent permitted by law, we do not accept or assume responsibility to anyone other than the entity and the entity’s members, as a body, for our audit work, for this report, or for the opinions we have formed.
Directors’ Responsibility for the Financial Statements
The directors are responsible for the preparation and fair presentation of these financial statements in accordance with International Financial Reporting Standards and in compliance with the requirements of the Mauritius Companies Act, and for such internal control as the directors determine is necessary to enable the preparation of financial statements that are free from material misstatement, whether due to fraud or error.
Auditors’ Responsibility
Our responsibility is to express an opinion on these financial statements based on our audit. We conducted our audit in accordance with International Standards on Auditing. Those Standards require that we comply with ethical requirements and plan and perform the audit to obtain reasonable assurance about whether the financial statements are free from material misstatement.
An audit involves performing procedures to obtain audit evidence about the amounts and disclosures in the financial statements. The procedures selected depend on the auditors’ judgement, including the assessment of the risks of material misstatement of the financial statements, whether due to fraud or error. In making those risk assessments, the auditors consider internal control relevant to the entity’s preparation and fair presentation of the financial statements in order to design audit procedures that are appropriate in the circumstances, but not for the purpose of expressing an opinion on the effectiveness of the entity’s internal control. An audit also includes evaluating the appropriateness of accounting policies used and the reasonableness of accounting estimates made by the directors, as well as evaluating the overall presentation of the financial statements.
We believe that the audit evidence we have obtained is sufficient and appropriate to provide a basis for our audit opinion.
Opinion
In our opinion, these financial statements give a true and fair view of the consolidated and separate financial position of Brainworks Limited as at 31 December 2015 and of its consolidated and separate financial performance and consolidated and separate cash flows for the year then ended in accordance with International Financial Reporting Standards and in compliance with the requirements of the Mauritius Companies Act.
2015 Annual Report

34 2015 Annual Report
2015 Financial StatementsIndependent Auditors' Report to the members of Brainworks Limited
Report on Other Legal and Regulatory Requirements
Mauritius Companies Act
We have no relationship with or interests in the entity other than in our capacity as auditors. We have obtained all the information and explanations we have required.
In our opinion, proper accounting records have been kept by the entity as far as it appears from our examination of those records.
__________________________________________________________________________________________________________________________________KPMG Wayne PretoriusKPMG Centre, 31 Cybercity, Ebène, Republic of Mauritius Licensed by FRC30 May 2016
KPMG, a Mauritian partnership and a member firm of the KPMG network of independent member firms affiliated with KPMG International Cooperative ("KPMG International"), a Swiss entity.

Walter Kambwanji Alwyn ScholtzChief Finance Officer Chairman: Audit and Risk Committee30 May 2016 30 May 2016
2015 Financial StatementsConsolidated and separate statements of financial position as at 31 December 2015
Consolidated Separate
Note 2015 2014 2013
2015
2014
US$ US$ US$
US$
US$ Assets
Cash and cash equivalents 5 5,454,914 909,496 179,067 7,150 5,215
Inventories 6 2,538,617 - - - -
Trade and other receivables 7 16,421,204 5,243,633 4,742,777 69,964 48,193 Financial assets held at fair value through profit or loss 8 3,500,000 1,250,113 7,243,986 3,500,000 1,250,113
Investment in subsidiary 9 - - - 86,306,195 -
Investment in associates 10 3,110,544 41,015,270 33,469,599 - -
Property and equipment 11 113,926,848 2,448,095 2,789,557 - -
Biological assets 12 165,137 - - - -
Deferred tax asset 13 996,512 889,463 1,462,073 - -
Total Assets
146,113,776 51,756,070 49,887,059 89,883,309 1,303,521 Equity and Liabilities
Equity
Share capital 14 86,307 86,307 86,307 86,307 48,193
Share premium
86,219,889 86,219,889 86,219,889 86,219,889 -
Share awaiting allotment
- 3,449,900 2,500,000 - -
Translation reserve
(53,535) - - - -
Merger reserve (19,995,688) (53,109,311) (60,609,311) - -
Non-distributable reserve
(476,378) (2,449,872) 117,664 - -
Accumulated (loss)/profit
(46,760) (2,808,007) 613,037 2,582,601 786,970
65,733,835 31,388,906 28,927,586 88,888,797 835,163
Non-controlling interest 15 28,479,795 - 6,491,922 - -
Total Equity
94,213,630 31,388,906 35,419,508 88,888,797 835,163 Liabilities
Borrowings 16 21,401,773 10,000,803 13,547,149 926,677 -
Income tax payable
1,244,709 - - 37,285 -
Trade and other payables 17(a) 18,035,870 10,329,111 890,402 30,550 468,358
Provisions 17(b) 3,847,308 37,250 30,000 - -
Deferred tax liabilities 18 7,370,486 - - - -
Total Liabilities
51,900,146 20,367,164 14,467,551 994,512 468,358
Total Equity and Liabilities
146,113,776 51,756,070 49,887,059 89,883,309 1,303,521
Approved by the board on 30 May 2016 and signed on its behalf by:
The notes on Pages 45 to 92 form part of these financial statements.
352015 Annual Report
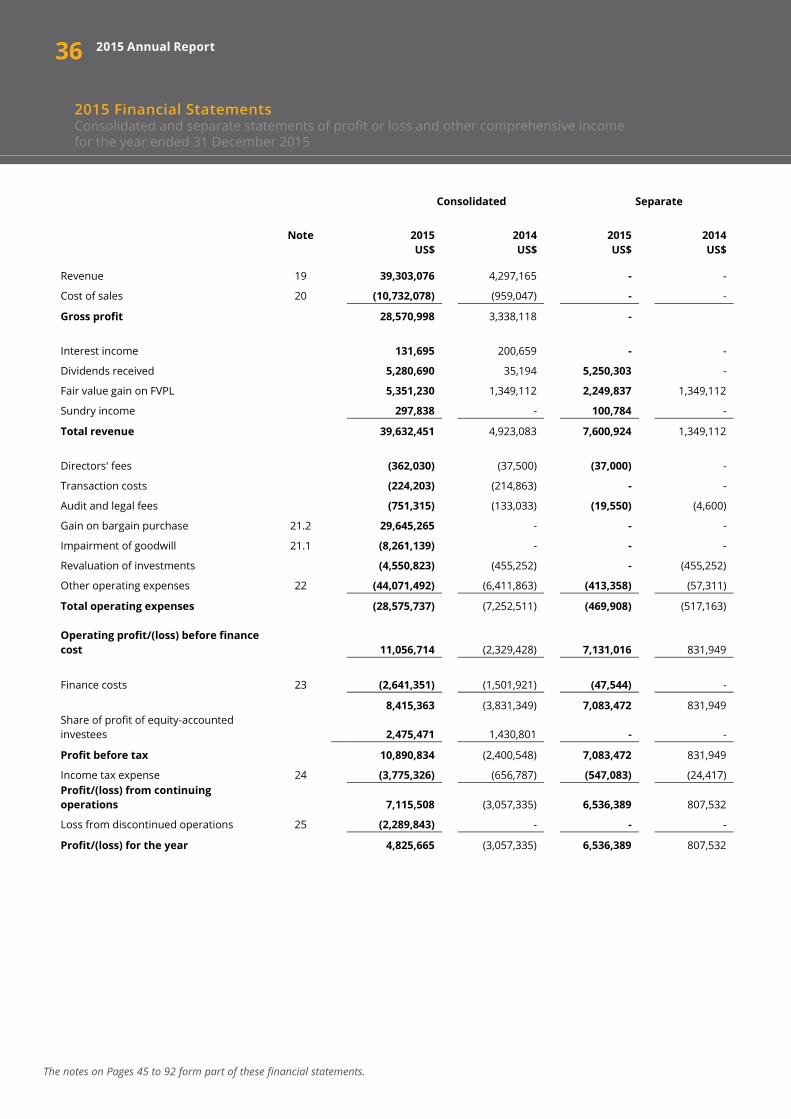
2015 Financial StatementsConsolidated and separate statements of profit or loss and other comprehensive income for the year ended 31 December 2015
Consolidated
Separate
Note
2015 US$
2014 US$
2015 US$
2014 US$
Revenue 19
39,303,076 4,297,165 - -
Cost of sales 20
(10,732,078) (959,047) - -
Gross profit
28,570,998 3,338,118 -
Interest income
131,695 200,659 - -
Dividends received
5,280,690 35,194 5,250,303 -
Fair value gain on FVPL
5,351,230 1,349,112 2,249,837 1,349,112
Sundry income
297,838 - 100,784 -
Total revenue
39,632,451 4,923,083 7,600,924 1,349,112
Directors' fees
(362,030) (37,500) (37,000) -
Transaction costs
(224,203) (214,863) - -
Audit and legal fees
(751,315) (133,033) (19,550) (4,600)
Gain on bargain purchase 21.2
29,645,265 - - -
Impairment of goodwill 21.1
(8,261,139) - - -
Revaluation of investments
(4,550,823) (455,252) - (455,252)
Other operating expenses 22
(44,071,492) (6,411,863) (413,358) (57,311)
Total operating expenses
(28,575,737) (7,252,511) (469,908) (517,163)
Operating profit/(loss) before finance cost
11,056,714 (2,329,428) 7,131,016 831,949
Finance costs 23
(2,641,351) (1,501,921) (47,544) -
8,415,363 (3,831,349) 7,083,472 831,949
Share of profit of equity-accounted investees
2,475,471 1,430,801 - -
Profit before tax
10,890,834 (2,400,548) 7,083,472 831,949
Income tax expense 24
(3,775,326) (656,787) (547,083) (24,417) Profit/(loss) from continuing operations
7,115,508 (3,057,335) 6,536,389 807,532
Loss from discontinued operations 25
(2,289,843) - - -
Profit/(loss) for the year
4,825,665 (3,057,335) 6,536,389 807,532
The notes on Pages 45 to 92 form part of these financial statements.
36 2015 Annual Report
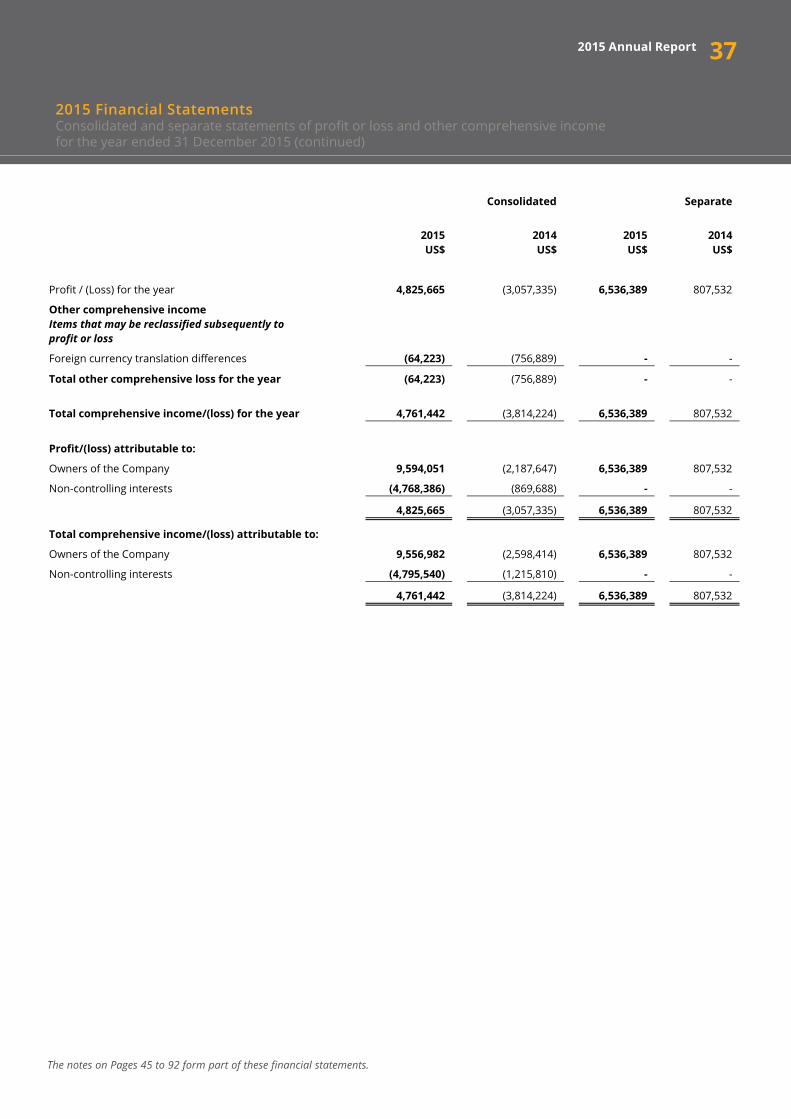
2015 Financial StatementsConsolidated and separate statements of profit or loss and other comprehensive income for the year ended 31 December 2015
The notes on Pages 45 to 92 form part of these financial statements.
Consolidated
Separate
2015 US$
2014 US$
2015 US$
2014 US$
Profit / (Loss) for the year 4,825,665 (3,057,335) 6,536,389 807,532
Other comprehensive income Items that may be reclassified subsequently to
profit or loss Foreign currency translation differences (64,223) (756,889) - -
Total other comprehensive loss for the year (64,223) (756,889) - -
Total comprehensive income/(loss) for the year
4,761,442 (3,814,224) 6,536,389 807,532
Profit/(loss) attributable to:
Owners of the Company
9,594,051 (2,187,647) 6,536,389 807,532
Non-controlling interests
(4,768,386) (869,688) - -
4,825,665 (3,057,335) 6,536,389 807,532
Total comprehensive income/(loss) attributable to:
Owners of the Company
9,556,982 (2,598,414) 6,536,389 807,532
Non-controlling interests
(4,795,540) (1,215,810) - -
4,761,442 (3,814,224) 6,536,389 807,532
2015 Financial StatementsConsolidated and separate statements of profit or loss and other comprehensive income for the year ended 31 December 2015 (continued)
372015 Annual Report
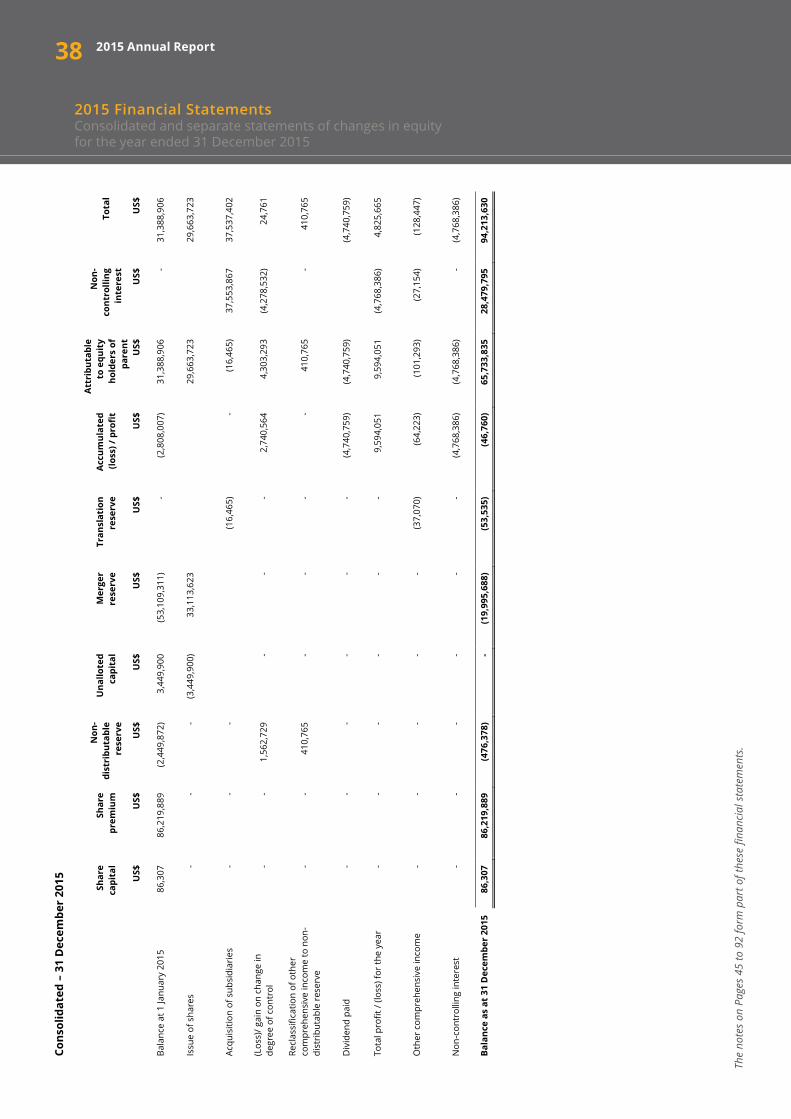
Cons
olid
ated
– 3
1 D
ecem
ber
2015
Sh
are
capi
tal
Shar
e pr
emiu
m
Non
- di
stri
buta
ble
rese
rve
Una
llote
d ca
pita
l M
erge
r
rese
rve
Tran
slat
ion
rese
rve
Acc
umul
ated
(lo
ss) /
pro
fit
Att
ribu
tabl
e to
equ
ity
hold
ers
of
pare
nt
Non
-co
ntro
lling
in
tere
st
Tota
l
US$
U
S$
US$
U
S$
US$
U
S$
US$
U
S$
US$
U
S$
Bala
nce
at 1
Janu
ary
2015
86,3
07
86,2
19,8
89
(2,4
49,8
72)
3,44
9,90
0 (5
3,10
9,31
1)
- (2
,808
,007
) 31
,388
,906
-
31,3
88,9
06
Issu
e of
sha
res
-
- -
(3,4
49,9
00)
33,1
13,6
23
29,6
63,7
23
29
,663
,723
Acqu
isiti
on o
f sub
sidi
arie
s
- -
-
(1
6,46
5)
- (1
6,46
5)
37,5
53,8
67
37,5
37,4
02
(Los
s)/ g
ain
on c
hang
e in
de
gree
of c
ontr
ol
-
- 1,
562,
729
- -
- 2,
740,
564
4,30
3,29
3
(4,2
78,5
32)
24,7
61
Recl
assi
ficat
ion
of o
ther
co
mpr
ehen
sive
inco
me
to n
on-
dist
ribut
able
rese
rve
-
- 41
0,76
5 -
- -
- 41
0,76
5
- 41
0,76
5
Div
iden
d pa
id
-
- -
- -
- (4
,740
,759
) (4
,740
,759
)
(4,7
40,7
59)
Tota
l pro
fit /
(loss
) for
the
year
- -
- -
- -
9,59
4,05
1 9,
594,
051
(4,7
68,3
86)
4,82
5,66
5
Oth
er c
ompr
ehen
sive
inco
me
-
- -
- -
(37,
070)
(6
4,22
3)
(101
,293
) (2
7,15
4)
(128
,447
)
Non
-con
trol
ling
inte
rest
- -
- -
- -
(4,7
68,3
86)
(4,7
68,3
86)
- (4
,768
,386
)
Bala
nce
as a
t 31
Dec
embe
r 20
15
86,3
07
86,2
19,8
89
(476
,378
) -
(19,
995,
688)
(5
3,53
5)
(46,
760)
65
,733
,835
28
,479
,795
94
,213
,630
2015 Financial StatementsConsolidated and separate statements of changes in equity for the year ended 31 December 2015
The
note
s on
Pag
es 4
5 to
92
form
par
t of t
hese
fina
ncia
l sta
tem
ents
.
38 2015 Annual Report

2015 Financial StatementsConsolidated and separate statements of changes in equity for the year ended 31 December 2015
Cons
olid
ated
– 3
1 D
ecem
ber
2014
Sh
are
capi
tal
Shar
e pr
emiu
m
Non
- di
stri
buta
ble
rese
rve
Una
llote
d ca
pita
l
Mer
ger
rese
rve
Acc
umul
ated
(lo
ss) /
pro
fit
Att
ribu
tabl
e to
equ
ity
hold
ers
of
pare
nt
Non
-co
ntro
lling
in
tere
st
Tota
l
US$
U
S$
US$
U
S$
US$
U
S$
US$
U
S$
US$
Ba
lanc
e at
1 Ja
nuar
y 20
14
86
,307
86
,219
,889
11
7,66
4
2,50
0,00
0
(60,
609,
311)
61
3,03
7
28,9
27,5
86
6,49
1,92
2
35,4
19,5
08
Is
sue
of s
hare
s
- -
- (2
,500
,000
) 7,
500,
000
- 5,
000,
000
- 5,
000,
000
Shar
e aw
aitin
g al
lotm
ent
-
-
3,44
9,90
0
-
3,44
9,90
0
- 3,
449,
900
D
erec
ogni
tion
of N
CI
-
- 11
3,05
0
- -
(922
,684
) (8
09,6
34)
(5,2
76,1
12)
(6,0
85,7
46)
Gai
n/ (l
oss)
on
char
ge in
deg
ree
of c
ontr
ol
-
- (2
,580
,532
) -
-
(2,5
80,5
32)
- (2
,580
,532
)
Re
clas
sific
atio
n of
gai
n on
cha
nge
in d
egre
e in
co
ntro
l to
non-
dist
ribut
able
rese
rve
-
- 31
0,71
3
- -
(310
,713
) -
- -
To
tal l
oss
for t
he y
ear
-
- -
- -
(3,0
57,3
35)
(3,0
57,3
35)
- (3
,057
,335
)
Oth
er c
ompr
ehen
sive
inco
me
-
- (4
10,7
67)
- -
- (4
10,7
67)
(346
,122
) (7
56,8
89)
Non
-con
trol
ling
inte
rest
- -
- -
- 86
9,68
8 86
9,68
8 (8
69,6
88)
-
Bala
nce
at 3
1 D
ecem
ber
2014
86,3
07
86,2
19,8
89
(2,4
49,8
72)
3,44
9,90
0
(53,
109,
311)
(2
,808
,007
) 31
,388
,906
-
31,3
88,9
06
The
note
s on
Pag
es 4
5 to
92
form
par
t of t
hese
fina
ncia
l sta
tem
ents
.
392015 Annual Report
2015 Financial StatementsConsolidated and separate statements of changes in equityfor the year ended 31 December 2015 (continued)

Cons
olid
ated
– 3
1 D
ecem
ber
2013
Shar
e ca
pita
l
Shar
e pr
emiu
m
Non
- di
stri
buta
ble
rese
rve
U
nallo
ted
capi
tal
M
erge
r re
serv
e
Acc
umul
ated
(lo
ss) /
pro
fit
Att
ribu
tabl
e to
equ
ity
hold
ers
of
pare
nt
Non
-co
ntro
lling
in
tere
st
To
tal
US$
US$
US$
US$
US$
US$
US$
US$
US$
Bala
nce
at 1
Janu
ary
2013
31,5
23
12
,646
,626
-
-
-
983,
875
13
,662
,024
-
13,6
62,0
24
Is
sue
of s
hare
s
54,7
84
73
,573
,263
-
-
(60,
609,
311)
-
13,0
18,7
36
-
13
,018
,736
Shar
e aw
aitin
g al
lotm
ent
-
-
-
2,
500,
000
-
-
2,
500,
000
-
2,
500,
000
Ac
quis
ition
of s
ubsi
diar
y
-
-
117,
664
-
-
-
11
7,66
4
6,94
2,64
0
7,06
0,30
4
Gai
n/ (l
oss)
on
char
ge in
deg
ree
of
cont
rol
-
-
-
-
-
31
0,71
3
310,
713
(3
10,7
13)
-
To
tal l
oss
for t
he y
ear
-
-
-
-
-
(8
21,5
56)
(8
21,5
56)
-
(8
21,5
56)
Ef
fect
of c
onso
lidat
ion
-
-
-
-
-
(1
00,7
33)
(1
00,7
33)
10
0,73
3
-
Non
-con
trol
ling
inte
rest
-
-
-
-
-
240,
738
24
0,73
8
(240
,738
)
-
Bala
nce
at 3
1 D
ecem
ber
2013
86,3
07
86
,219
,889
117,
664
2,50
0,00
0
(6
0,60
9,31
1)
61
3,03
7
28
,927
,586
6,49
1,92
2
35
,419
,508
The
note
s on
Pag
es 4
5 to
92
form
par
t of t
hese
fina
ncia
l sta
tem
ents
.
40 2015 Annual Report
2015 Financial StatementsConsolidated and separate statements of changes in equity for the year ended 31 December 2015 (continued)

Separate – 31 December 2014
Share capital
Share
premium Accumulated
(loss)/profit Total
US$
US$
US$
US$
Balance as at 1 January 2014
48,193 - (20,562) 27,631
Total comprehensive income for the year
Profit for the year
- - 807,532 807,532
Balance at 31 December 2014
48,193 - 786,970 835,163 Issue of shares
38,114 86,219,889 - 86,258,003
Total comprehensive income for the year Profit for the year
- - 6,536,389 6,536,389
Dividend
- - (4,740,758) (4,740,758)
Balance as at 31 December 2015
86,307 86,219,889 2,582,601 88,888,797
The notes on Pages 45 to 92 form part of these financial statements.
412015 Annual Report
2015 Financial StatementsConsolidated and separate statements of changes in equity for the year ended 31 December 2015 (continued)

Consolidated Separate
Note 2015
US$ 2014 US$
2015 US$
2014 US$
Profit/(loss) before taxation
10,890,834 (2,400,548) 7,083,472 831,949
Loss from discontinued operations
(2,289,843)
Adjust for:
Depreciation
6,135,388 166,590 - -
Loss/(profit) on disposal of assets
157,095 (13,502) - - Impairment and exchange difference in property and equipment
2,970,837
-
-
-
Impairment of receivables
5,855,537 370,314 - -
Share based payment expense - 3,449,900 -
Dividends received
(30,387) (35,194) - -
Interest expense
2,593,807 1,501,921 - -
Interest income
(131,694) (200,659) - -
Share of associate income
(2,475,471) (1,430,801) - -
Net share swap effect
(48,192) - (48,192) -
Loss on disposal in associate 3,935,005 - - - Revaluation gain on re-measurement to fair value 2,300,936
- (2,249,887) -
Gain on bargain purchase (29,645,265) - - -
Impairment of goodwill
8,261,139 - - -
Revaluation of investments
(3,101,393) 455,252 - 455,252
Provisions 457,807 - - -
Non cash revenues
- (1,349,112) - (1,349,112)
5,836,140 514,161 4,785,393 (61,911)
Changes in inventory
(440,932) - - -
Changes in trade and other payables
(5,723,448) (547,007) (146,473) 447,796
Changes in receivables
(4,097,096) (882,669) (21,771) -
Cash (utilised in)/from operations
(4,425,336)
(915,515) 4,617,149 385,885
Interest received
131,694 200,659 - -
Interest paid
(2,482,735) (1,016,494) - -
Dividends paid
(5,190,758) - (4,740,758) -
Dividends received
480,387 515,452 - -
Capital gains tax paid
- (55,642) - - Income tax paid
(611,772) (24,417) (547,083) (24,417)
Net cash (utilised in)/from operating activities
(12,098,520)
(1,295,957) (670,692) 361,468
The notes on Pages 45 to 92 form part of these financial statements.
42 2015 Annual Report
2015 Financial StatementsConsolidated and separate statements of of cash flows for the year ended 31 December 2015
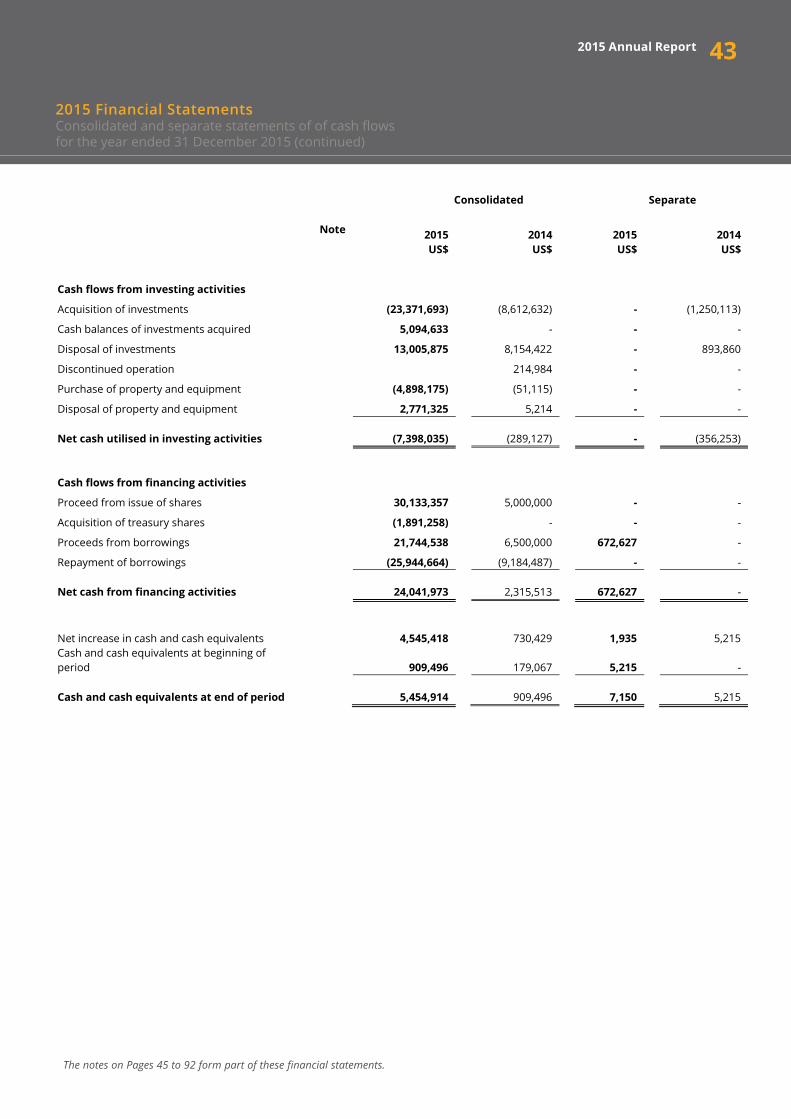
Consolidated Separate
Note 2015
US$
2014 US$
2015 US$
2014 US$
Cash flows from investing activities
Acquisition of investments
(23,371,693) (8,612,632) - (1,250,113)
Cash balances of investments acquired
5,094,633 - - -
Disposal of investments
13,005,875 8,154,422 - 893,860
Discontinued operation 214,984 - -
Purchase of property and equipment
(4,898,175) (51,115) - -
Disposal of property and equipment
2,771,325 5,214 - -
Net cash utilised in investing activities
(7,398,035)
(289,127) - (356,253)
Cash flows from financing activities
Proceed from issue of shares 30,133,357 5,000,000 - -
Acquisition of treasury shares (1,891,258) - - -
Proceeds from borrowings
21,744,538 6,500,000 672,627 -
Repayment of borrowings
(25,944,664) (9,184,487) - -
Net cash from financing activities
24,041,973
2,315,513 672,627 -
Net increase in cash and cash equivalents 4,545,418
730,429 1,935 5,215 Cash and cash equivalents at beginning of period
909,496
179,067 5,215 -
Cash and cash equivalents at end of period
5,454,914
909,496 7,150 5,215
The notes on Pages 45 to 92 form part of these financial statements.
432015 Annual Report
2015 Financial StatementsConsolidated and separate statements of of cash flows for the year ended 31 December 2015 (continued)

44
Notes to the consolidated and separate financial statementsfor the year ended 31 December 2015
1. General information Brainworks Limited (previously Brainworks Capital Management Limited) ("the Company") was incorporated in the Republic of Mauritius on 22 April 2013 as a private company limited by shares and has its registered office at C/o FiducieForte Management Services, Level 2 Silicone Avenue, Alexander House, 35 Ebène, Cybercity, Republic of Mauritius.
The principal activity of the Company is that of investment holding, consulting and advisory services.
The Company is the holder of a Category 1 Global Licence under the Mauritius Companies Act and the Financial Services Act 2007. As the Company operates in an international environment and conducts most of its transactions in foreign currencies, the Company has elected the United States Dollar ("USD") as its reporting and presentation currency.
During the year, the Board of Directors of the Company, in their meeting held on 18 June 2015 , approved the share swap transaction for 1:1 share with Brainworks Capital Management (Private) Limited.
As a result of the share swap between the Company and Brainworks Capital Management (Private) Limited, the results of the entities have been combined for the purposes of preparation of these financial statements for the year ended 31 December 2015. The acquisition method under IFRS 3 - "Business Combinations" is not applicable as the share swap is between companies under common control. The Parent company of the combining entities remains the Company and the latter has applied the "pooling of interests" method to account for the share swap.
The comparatives in the accompanying statement of financial position of the Group as at 31 December 2014 and 31 December 2013 have therefore been restated.
2. Basis of preparation
(a) Statement of compliance
The consolidated and the separate financial statements have been prepared in accordance with International Financial Reporting Standards ("IFRS") and the Mauritius Companies Act.
Included in the consolidated financial statements are the Group’s operational subsidiaries, Dawn Properties Limited, African Sun Limited, FML Logistics (Private) Limited and GetSure Life Assurance Company (Private) Limited. Lengrah Investments (Private) Limited is not actively operational, but just holds some of the shares in African Sun Limited and Dawn Properties Limited. The subsidiaries are all incorporated in Zimbabwe and the principal places of business are noted below:
Group’s shareholding and the principal places of business in the respective subsidiaries is as follows:
• Dawn Properties Limited ("Dawn Properties") 67% (31 December 2014: 29%). Brainworks acquired a controlling stake in Dawn Properties on 31 March 2015. The principal place of business for Dawn Properties is at 8th Floor, Beverley Court, 100 Nelson Mandela Avenue, Harare;
• African Sun Limited ("African Sun") 58% (31 December 2014: 43%). Brainworks acquired a controlling stake in African Sun on 30 April 2015. The principal place of business for African Sun is at 6 Seagrave Road, Mount Pleasant, Harare;
• Brainworks Petroleum (Private) Limited ("Brainworks Petroleum") 100% (31 December 2014: 100%). Brainworks Petroleum holds an investment in FML Logistics (Private) Limited ("FML Logistics). The shareholding in FML Logistics is 100% (31 December 2014: 100%). The principal place of business for FML Logistics is at 4 Arden Road, Newlands, Harare;
• Lengrah Investments (Private) Limited ("Lengrah") 100% (31 December 2014: 100%). The principal place of business for Lengrah is at 4 Arden Road, Newlands, Harare; and
452015 Annual Report
Notes to the consolidated and separate financial statements for the year ended 31 December 2015

• GetSure Life Assurance Company (Private) Limited ("GetSure") 100% (31 December 2014: 100%). GetSure was not operational as at 31 December 2014 and became operational during 2015. The principal place of business for GetSure is at MIPF House, 1st Floor South Wing, 5 Central Avenue, Harare.
• Brainworks Capital Management E.G SL ("Brainworks EG") 50% (31 December 2014: 50%). Brainworks EG was not operational as at 31 December 2015. The principal place of business for Brainworks EG is ComplejoDaVinci, Malabo II, Malabo, Equatorial Guinea.
(b) Basis of measurement
The consolidated and the separate financial statements have been prepared under the historical cost basis.
(c) Functional and presentation currency
The consolidated and separate financial statements are presented in United States Dollars ("US$") which is the Group’s functional currency.
(d) Use of estimates and judgements
In preparing these consolidated and separate financial statements, management has made judgements, estimates and assumptions that affect the application of accounting policies and the reported amounts of assets, liabilities, disclosure of contingent assets and liabilities and the reported amounts of income and expenses during the reporting period. Actual results could differ from these estimates.
Estimates and underlying assumptions are reviewed on an on-going basis. Revisions to accounting estimates are recognised prospectively.
In particular, information about significant areas of estimation, uncertainty and critical judgements in applying accounting policies that have the most significant effect of the amount registered in the financial statements are described in the following notes:
• Determination of useful lives and residual values used in the calculation of the depreciation expense; • Recognition of deferred tax asset; • Determination of whether an investment is a financial instrument at fair value through profit and loss, investment in
associate or a subsidiary; • Determination of fair values of investment in associate or a subsidiary; • Valuation of biological assets; • Revenue recognition with respect to fixed price contracts where the percentage of completion method is used;• Assessment for impairment of assets; • Acquisition dates of subsidiaries; • Going concern; and • Non-coterminous periods for associates and new subsidiaries.
46 2015 Annual Report
Notes to the consolidated and separate financial statements for the year ended 31 December 2015

(e) Changes in accounting policies / new standards and interpretations adopted for the year ended 31 December 2015
The accounting policies adopted by the Group and the Company are consistent with those of the previous years.
3. Significant accounting policies
The accounting policies set out below have been applied consistently to all periods presented in these consolidated and separate financial statements, except as explained in Note 2 (e).
(a) Basis of consolidation
(i) Business combination
Business combinations are accounted for using the acquisition method as at the acquisition date – i.e. when control is transferred to the Group. The consideration transferred in the acquisition is generally measured at fair value, as are the identifiable net assets acquired. Any goodwill that arises is tested annually for impairment. Any gain on a bargain purchase is recognised in profit or loss immediately. Transaction costs are expensed as incurred, but if they are related to the issue of debt or equity securities, they are capitalised.
The consideration transferred does not include amounts related to the settlement of pre-existing relationships. Such amounts are generally recognised in profit or loss.
Any contingent consideration payable is measured at fair value at the acquisition date. If the contingent consideration is classified as equity, then it is not remeasured and settlement is accounted for within equity. Otherwise, subsequent changes in the fair value of the contingent consideration are recognised in profit or loss.
(ii) Non-controlling interests (‘NCIs’)
NCIs are measured at their proportionate share of the acquiree’s identifiable net assets at the acquisition date.
(iii) Subsidiaries
‘Subsidiaries’ are investees controlled by the Group. The Group ‘controls’ an investee if it is exposed to, or has rights to variable returns from its involvement with the investee and has the ability to affect those returns through its power over the investee. The financial statements of subsidiaries are included in the consolidated financial statements from the date on which control commences until the date when control ceases.
(iv) Loss of control
When the Group loses control over a subsidiary, it derecognises the assets and liabilities of the subsidiary and any related non-controlling interests and other components of equity. Any resulting gain or loss is recognised in profit or loss. Any interest retained in the former subsidiary is measured at fair value when control is lost.
(v) Transactions eliminated on consolidation
Intra-group balances and transactions, and any unrealised income and expenses (except for foreign currency transaction gains or losses) arising from intra-group transactions, are eliminated in preparing the consolidated financial statements. Unrealised losses are eliminated in the same way as unrealised gains, but only to the extent that there is no evidence of impairment.
472015 Annual Report
Notes to the consolidated and separate financial statements for the year ended 31 December 2015

(vi) Associates
Associates are all entities over which the Group has significant influence but not control, generally accompanying a shareholding of between 20% and 49% of the voting rights. If the holding is less than 20%, the Group will be presumed not to have significant influence unless such influence can be clearly demonstrated. The existence of significant influence by the Group is usually evidenced in one or more of the following ways:
• Representation on the Board of Directors or equivalent governing body of the investee; • Participation in the policy making process; • Material transactions between the investor and the investee; • Interchange of managerial personnel; and • Provision of essential technical information.
Investments in associates are accounted for by the equity method of accounting in the consolidated financial statements and are initially recognised at cost and the carrying amount is increased or decreased to recognise the investor’s share of profit or loss of the investee after the date of acquisition. If the ownership in an associate is reduced but significant influence is retained, only a proportionate share of the amounts previously recognised in other comprehensive income would be reclassified to profit or loss where appropriate.
The Group determines at each reporting date whether there is any objective evidence that the investment in the associate is impaired. If this is the case, the Group calculates the amount of impairment as the difference between the recoverable amount of the associate and its carrying value and recognises the amount adjacent to "share of profit or loss of associate" in the statement of profit or loss and other comprehensive income.
(b) Property, plant and equipment
(i) Recognition and measurement
Items of property, plant and equipment are measured at cost less accumulated depreciation and any accumulated impairment losses. Cost includes expenditure that is directly attributable to the acquisition of the assets.
Any gain or loss on disposal of an item of property, plant and equipment is recognised in profit or loss.
(ii) Subsequent costs
Subsequent expenditure is capitalised only if it is probable that the future economic benefits associated with the expenditure will flow to the Group. Ongoing repair and maintenance are expensed as incurred.
(iii) Depreciation
Items of equipment are depreciated on a straight-line basis in profit or loss over the estimated useful lives of each component to the residual value of the item. Items of equipment are depreciated from the date that they are installed and are ready for use.
48 2015 Annual Report
Notes to the consolidated and separate financial statements for the year ended 31 December 2015

The estimated useful lives for the current and comparative years of significant items of property and equipment are as follows:
• Leasehold improvements 5 to 25 years • Motor vehicles 5 years • Heavy motor vehicles 10 years • Computer equipment 5 years • Office equipment 5 years • Furniture and fittings 5 years • Hotel equipment 7 years• Hotel properties 100 years • Farm equipment and implements 10 years • Freehold properties 50 years • Building 20 years
Depreciation methods, useful lives and residual values are reviewed at each reporting date and adjusted if appropriate. Land and capital work in progress are not depreciated.
(c) Biological assets
Timber plantations are measured at their fair value less estimated point of sale costs. The fair value of timber plantations is determined by a professional valuer based on fair values for the stages of forest development.
(d) Financial instruments
The Group recognises financial assets or financial liabilities on its consolidated statement of financial position when it becomes a party to the contractual provisions of the financial instrument.
Non-derivative financial assets
The Group initially recognises loans and receivables on the date that they are originated. All other financial assets (including assets designated as at fair value through profit or loss) are recognised initially on the trade date, which is the date that the Group becomes a party to the contractual provisions of the instrument.
The Group derecognises a financial asset when the contractual rights to the cash flows from the asset expire, or it transfers the rights to receive the contractual cash flows in a transaction in which substantially all the risks and rewards of ownership of the financial asset are transferred. Any interest in such transferred financial assets that is created or retained by the Group is recognised as a separate asset or liability.
Financial assets and liabilities are offset and the net amount presented in the statement of financial position when, and only when, the Group has a legal right to offset the amounts and intends either to settle on a net basis or to realise the asset and settle the liability simultaneously.
Financial assets at fair value through profit or loss
A financial asset is classified as at fair value through profit or loss if it is classified as held for trading or is designated as such on initial recognition. Financial assets are designated as at fair value through profit or loss if the Group manages such investments and makes purchase and sale decisions based on their fair value in accordance with the Group's documented risk management or investment strategy. Attributable transaction costs are recognised in profit or loss as incurred. Financial assets at fair value through profit or loss are measured at fair value and changes therein, which takes into account any dividend income.
492015 Annual Report
Notes to the consolidated and separate financial statements for the year ended 31 December 2015

Financial assets designated as at fair value through profit and loss comprise equity securities that otherwise would have been classified as available for sale.
Loans and receivables
Loans and receivables are financial assets with fixed or determinable payments that are not quoted in an active market. Such assets are recognised initially at fair value plus any directly attributable transaction costs. Subsequent to initial recognition, loans and receivables are measured at amortised cost using the effective interest method, less any impairment losses. Trade and other receivables are treated as loans and receivables.
Cash and cash equivalents
Cash and cash equivalents comprise cash balances and call deposits with maturities of three months or less from the acquisition date that are subject to an insignificant risk of changes in their fair value, and are used by the Group in the management of its short-term commitments.
Non-derivative financial assets
The Group initially recognises debt securities issued and subordinated liabilities on the date that they are originated. All other financial liabilities are recognised initially on the trade date, which is the date that the Group becomes a party to the contractual provisions of the instrument.
The Group derecognises a financial liability when its contractual obligations are discharged, cancelled or expire. The Group classifies non-derivative financial liabilities into the other financial liabilities category. Such financial liabilities are recognised initially at fair value less any directly attributable transaction costs. Subsequent to initial recognition, these financial liabilities are measured at amortized cost using the effective interest method.
Other financial liabilities comprise borrowings and trade and other payables.
Fair value of financial assets and liabilities
The valuation technique used depends on the nature of the financial instrument.
Fair value hierarchy
Fair value is the price that would be received to sell an asset or paid to transfer a liability in an orderly transaction between market participants at the measurement date. IFRS 13 specifies a hierarchy of valuation techniques based on whether the inputs to those valuation techniques are observable or unobservable. Observable inputs reflect market data obtained from independent sources; unobservable inputs reflect the Company and Group’s market assumptions. These two types of inputs have created the following fair value hierarchy:
Level 1 – Quoted prices (unadjusted) in active markets for identical assets or liabilities. This level includes listed equity securities traded on the stock exchange.Level 2 – Inputs other than quoted prices included within Level 1 that are observable for the asset or liability, either directly (that is, as prices) or indirectly (that is, derived from prices).Level 3 – Inputs for the asset or liability that are not based on observable market data (unobservable inputs).This level includes equity investments and debt instruments with significant unobservable components. This level includes unlisted equity investments.
The hierarchy requires the use of observable market data when available. The Group considers relevant and observable market prices in its valuations where possible.
50 2015 Annual Report
Notes to the consolidated and separate financial statements for the year ended 31 December 2015

(e) Share capital
Ordinary shares
Incremental costs directly attributable to the issue of ordinary shares are recognised as a deduction from equity. Income tax relating to transaction costs of an equity transaction is accounted for in accordance with IAS 12.
Share premium
Any amount paid in excess of the nominal value of ordinary shares is credited to the share premium account.
(f) Impairment
(i) Non-derivative financial assets
Financial assets not classified as at fair value through profit or loss are assessed at each reporting date to determine whether there is objective evidence of impairment.
Objective evidence that financial assets are impaired includes:
• Default or delinquency by a debtor;• Restructuring of an amount due to the Group on terms that the Group would not consider otherwise;• Indications that a debtor or issuer will enter bankruptcy;• Adverse changes in the payment status of borrowers or issuers;• The disappearance of an active market for a security; or• Observable data indicating that there is measurable decrease in expected cash flows from group financial assets.
Financial assets measured at amortised cost
The Group considers evidence of impairment for these assets at both an individual asset and a collective level. All individually significant assets are individually assessed for impairment. Those found not to be impaired are then collectively assessed for any impairment that has been incurred but not yet individually identified. Assets that are not individually significant are collectively assessed for impairment. Collective assessment is carried out by grouping together assets with similar risk characteristics.
In assessing collective impairment, the Group uses historical information on the timing of recoveries and the amount of loss incurred, and makes an adjustment if current economic and credit conditions are such that the actual losses are likely to be greater or lesser than suggested by historical trends.
An impairment loss in respect of a financial asset measured at amortised cost is calculated as the difference between an asset’s carrying amount and the present value of the estimated future cash flows discounted at the asset’s original effective interest rate. Losses are recognised in profit or loss and reflected in an allowance account. When the Group considers that there are no realistic prospects of recovery of the asset, the relevant amounts are written off. If the amount of impairment loss subsequently decreases and the decrease can be related objectively to an event occurring after the impairment was recognised, then the previously recognised impairment loss is reversed through profit or loss.
512015 Annual Report
Notes to the consolidated and separate financial statements for the year ended 31 December 2015

(ii) Non-financial assets
At each reporting date, the Group reviews the carrying amounts of its non-financial assets to determine whether there is any indication of impairment.
For impairment testing, assets are grouped together into the smallest group of assets that generates cash inflows from continuing use that are largely independent of the cash inflows of other assets or cash generating units.
The recoverable amount of an asset or cash generating unit is the greater of its value in use and its fair value less costs to sell. Value in use is based on the estimated future cash flows, discounted to their present value using a pre-tax discount rate that reflects current market assessment of the time value of money and the risk specific to the asset or the cash generating unit.
An impairment loss is recognised if the carrying amount of an asset or cash generating unit exceeds its recoverable amount. Impairment losses are recognised in profit or loss.
An impairment loss is reversed only to the extent that the asset’s carrying amount does not exceed the carrying amount that would have been determined, net of depreciation or amortisation, if no impairment loss had been recognised.
(g) Foreign Currency
(i) Foreign currency transactions
Transactions in foreign currencies are translated to the functional currency of the Group companies at exchange rates at the dates of the transactions.
Monetary assets and liabilities denominated in foreign currencies at the reporting date are translated to the functional currency at the exchange rate at the reporting date. Non-monetary assets and liabilities that are measured at fair value in a foreign currency are translated into the functional currency at the exchange rate when the fair value was determined. Non-monetary items that are measured based on historical cost in a foreign currency are translated at the exchange rate at the date of the transaction. Foreign currency differences are generally recognised in profit or loss.
Foreign currency differences on translation are recognised in profit or loss net of foreign exchange gain/loss, except for those arising on financial instruments at fair value through profit or loss, which are recognised as net gain from financial instrument at fair value through profit or loss.
(ii) Foreign operations
The assets and liabilities of foreign operations, including goodwill and fair value adjustments arising on acquisition, are translated into US$ at exchange rates at the reporting date. The income and expenses of foreign operations are translated into US$ at the exchange rates at the dates of the transactions.
Foreign exchange differences are recognised in other comprehensive income and accumulated in the translation reserve, except to the extent that the translation difference is allocated to the non-controlling interest.
When a foreign operation is disposed of in its entirety or partially such that control, significant influence or joint control is lost, the cumulative amount in the translation reserve related to that foreign operation is reclassified to profit or loss as part of the gain or loss on disposal. If the Group disposes of part of its interest in a subsidiary but retains control, then the relevant proportion of the cumulative amount is reattributed to non-controlling interests. When the Group disposes of only part of an associate or joint venture while retaining significant influence or joint control, the relevant proportion of the cumulative amount is reclassified to profit or loss.
52 2015 Annual Report
Notes to the consolidated and separate financial statements for the year ended 31 December 2015
(h) Revenue recognition
(i) Dividend income
Dividend income is recorded when the Group’s right to receive the payment is established.
(ii) Net gain from financial instruments at fair value through profit and loss
The net gain from financial instruments held at fair value through profit or loss includes all realised and unrealised fair value changes, but excludes interest and dividend income on short positions. The Group uses the first-in, first-out method to determine the gain on disposal. Fair value adjustments on the financial instruments are presented and disclosed separately from gains and losses on disposals.
(iii) Revenue from oil distribution and logistics
Revenue from oil and logistics arises from the sales of fuel, oil products and services is recognised when the Group has transferred the significant risks and rewards of ownership to the buyer and it is probable that the economic benefits associated with the transaction will flow to the entity and the amount of revenue can be measured reliably. These criteria are considered to be met when the goods are delivered to the buyer or when service has been provided to the customer in full.
(iv) Fee income
Fees are earned on advisory services and income is recognised when the service has been rendered.
(v) Share of associate income
The share of associate income is recognised net of associate expenses only to the extent of the Group’s interest.
(vi) Interest
Interest income and expense, are recognised in profit or loss using the effective interest method. The effective interest rate is the rate that exactly discounts the estimated future cash payments and receipts through the expected life of the financial asset or liability (or, where appropriate, a shorter period) to the carrying amount of the financial asset or liability. When calculating the effective interest rate, the Group estimates future cash flows considering all contractual terms of the financial instrument, but not future credit losses. The calculation of the effective interest rate includes all fees that are an integral part of the effective interest rate. Transaction costs include incremental costs that are directly attributable to the acquisition or issue of a financial asset or liability.
Interest is presented in the following lines in the statement of profit or loss and other comprehensive income:
• Interest income in "interest income" line; and • Interest expense in "finance costs" line.
(vii) Rental income
Rental income from operating leases is recognised in the accounting period in which the property is occupied by the tenant.
532015 Annual Report
Notes to the consolidated and separate financial statements for the year ended 31 December 2015
(viii) Revenue from valuation and consultancy services
Revenue from valuation and consultancy is recognised in the accounting period in which the property valuation, management and consultancy services are rendered, by reference to the stage of completion of the specific transaction and assessed on the basis of the actual service provided as a proportion of the total services to be provided.
(ix) Revenue from sale of goods
Sale of room nights, food and beverages
Revenue from sale of goods is primarily derived from the sale of room nights, sale of food and beverages and sale of shop merchandise. Revenue is recognised when room nights, food, beverages and shop merchandise are sold.
Casino/gaming revenue
Revenue from gaming (casinos) comprises the net table and slot machine wins derived by casino operations from gambling patrons. In terms of IFRS, betting transactions concluded under gaming operations meet the definition of derivatives and therefore income from gaming operations represents the net position arising from financial instruments. The net gaming win is measured as the net cash received from betting transactions from casino operations. Due to the short-term nature of the casino operations, all income is recognised in profit or loss immediately, at fair value.
Timeshare revenue
The extended reservations system involves the sale of timeshare weeks owned by the Group and management fees earned from running the administration for the timeshare associations. Revenue is accounted when timeshare weeks are sold and management fees are earned.
Premium income
Premiums and annuity considerations on long-term insurance contracts are recognised when due in terms of the contract. Premiums receivable in respect of corporate schemes are recognised when there is a reasonable assurance of collection in terms of the policy contract. Premiums in respect of individual policies are recognised as premiums when received as failure to pay a premium will result in the lapse of the policy.
(i) Taxation
Income Tax
Income tax expense comprises current and deferred tax. Income tax expense is recognised in profit or loss except to the extent that it relates to a business combination or items recognised directly in equity or other comprehensive income.
Current tax comprises the expected tax payable or receivable on the taxable income or loss for the year and any adjustment to the tax payable or receivable in respect of previous years. The amount of current tax payable or receivable is the best estimate of the tax amount expected to be paid or received that reflects uncertainty related to income taxes, if any. It is measured using tax rates enacted or substantively enacted at the reporting date.
Current tax assets and liabilities are offset only if certain criteria are met.
54 2015 Annual Report
Notes to the consolidated and separate financial statements for the year ended 31 December 2015
Deferred Tax
Deferred tax is recognised in respect of temporary differences between the carrying amounts of assets and liabilities for financial reporting purposes and the amounts used for taxation purposes.
Deferred tax is not recognised for:
• Temporary differences on the initial recognition of assets or liabilities in a transaction that is not a business combination and that affects neither accounting nor taxable profit or loss temporary differences related to investments in subsidiaries and jointly controlled entities to the extent that it is probable that they will not reverse in the foreseeable future; and
• Taxable temporary differences arising on the initial recognition of goodwill.
A deferred tax asset is recognised for unused tax losses, unused tax credits and deductible temporary differences to the extent that it is probable that future taxable profits will be available against which they can be utilised. Future taxable profits are determined based on business plan for individual subsidiaries in the Group.
Deferred tax assets are reviewed at each reporting date and are reduced to the extent that it is no longer probable that the related tax benefit will be realised; such reductions are reversed when the probability of future taxable profits improves.
Deferred tax is measured at the tax rates that are expected to be applied to temporary differences when they reverse, using the tax rates enacted or substantively enacted at the reporting date. The measurement of deferred tax reflects the tax consequences that would follow from the manner in which the Group and Company expect at the reporting date, to recover or settle the carrying amount of its assets and liabilities.
Deferred tax assets and deferred tax liabilities are offset only if the following criteria are met:
(a) The deferred tax assets and the deferred tax liabilities relate to income taxes levied by the same taxation authority on either.(b) The entity has a legally enforceable right to set off current tax assets against current tax liabilities; and (i) The same taxable entity; or (ii) Different taxable entities which intend either to settle current tax liabilities and assets on a net basis, or to realise the assets and settle the liabilities simultaneously, in each future period in which significant amounts of deferred tax liabilities or assets are expected to be settled or recovered.
(j) Leases
Lease payments – lessee
Payments made under operating leases are recognised in profit or loss on a straight-line basis over the term of the lease. Lease incentives received are recognised as an integral part of the total lease expense, over the term of the lease.
Minimum lease payments made under finance leases are apportioned between the finance expense and the reduction of the outstanding liability. The finance expense is allocated to each period during the lease term so as to produce a constant periodic rate of interest on the remaining balance of the liability.
Contingent lease payments are accounted for by revising the minimum lease payments over the remaining term of the lease when the lease adjustment is confirmed.
552015 Annual Report
Notes to the consolidated and separate financial statements for the year ended 31 December 2015

(k) Employee benefits
Post-employment benefits
The Group’s employees are on a defined contribution plan. Obligations for contributions to the defined contribution plan are recognised as an employee benefit expense in profit or loss in the periods during which related services are rendered by employees.
Short-term benefits
Short-term employee benefit obligations are measured on an undiscounted basis and are expensed as the relevant service is provided. A liability is recognised for the amount expected to be paid under short-term cash bonus or profit-sharing plans if the Group has a present legal or constructive obligation to pay this amount as a result of past service provided by the employee and the obligation can be estimated reliably.
(l) Inventories
Inventory is stated at the lower of cost and net realisable value. Cost is determined on the weighted average cost method. Net realisable value is the estimated selling price in the ordinary course of business less the estimated costs necessary to make the sale.
(m) Related parties
• A person or a close member of that person’s family is related party to the Group if that person has control or joint control, significant influence or is a member of the key management personnel of the Group.
• An entity is a related party to the Group if that entity is part of Brainworks Limited and / or related to a significant non-controlling interest as a subsidiary, associate, joint venture or post-employment benefit plan.
The Company has related party relationships. Transactions and balances are reflected in Note 28.
A related party transaction is a transfer of resources, services or obligations between a reporting entity and a related party, regardless of whether a price is charged.
(n) Common control transaction
The Company elected the book value method of accounting for a business combination under common control. The Companyelectedto restate the financial information in the financial statements for periods to the combination under common control, to reflect the combination as if it had occurred from the beginning of the earliest period presented in the financial statements, regardless of the actual date of the combination. The financial information in the financial statements for periods to the combination is restated only for the period that the entities were under common control. Any difference between the consideration paid and the capital of the acquired entity is recognised in equity as a merger reserve.
(o) Adoption of new and revised financial reporting standards
The The following revisions, issues and amendments set out below became effective for the current year:
Amendments to IAS 19 Defined Benefit Plan – employee contributions.
IAS 24 Related Party Disclosures – The definition of a ‘related party’ is extended to include a management entity that provides key management personnel services to the reporting entity, either directly or through a group entity.
56 2015 Annual Report
Notes to the consolidated and separate financial statements for the year ended 31 December 2015

The adoption of the revised standards in the current year has not led to any changes in the Group’s accounting policies. The amendments do not have a material financial effect on the recognition or measurement of transactions and events, nor the financial position or performance of the Group.
Standards and interpretation not yet adopted
A number of new standards, amendments to standards and interpretations are effective for annual periods beginning after 1 January 2015, and have not been applied in preparing these financial statements. Those that may be relevant to the Group are set out below. The Group does not plan to adopt these standards early.
Accounting for Acquisitions of Interests in Joint Operations (Amendments to IFRS 11)
The amendments require business combination accounting to be applied to acquisitions of interests in a joint operation that constitutes a business.
Business combination accounting also applies to the acquisition of additional interests in a joint operation while the joint operator retains joint control. The additional interest acquired will be measured at fair value. The previously held interest in the joint operation will not be remeasured. As a consequence of these amendments, the Group will amend its accounting policy with effect from 1 January 2016 for acquisitions of interests in a joint operation.
The amendments apply prospectively for annual periods beginning on or after 1 January 2016 and early adoption is permitted.
Clarification of Acceptable Methods of Depreciation and Amortisation(Amendments to IAS 16 and IAS 38)
The amendments to IAS 16 Property, Plant and Equipment explicitly state that revenue-based methods of depreciation cannot be used for property, plant and equipment.
The amendments to IAS 38 Intangible Assets introduce a rebuttable presumption that the use of revenue-based amortisation methods for intangible assets is inappropriate. The presumption can be overcome only when revenue and the consumption of the economic benefits of the intangible asset are ‘highly correlated’, or when the intangible asset is expressed as a measure of revenue.
The Group currently has several intangible assets and plants that are amortised or depreciated using a revenue-based method. The Group cannot overcome the rebuttable presumption above for its intangible assets, and consequently will have to change the amortisation and depreciation method for these items. The Group has assessed that the straight-line method is the most appropriate method and has early adopted these amendments for the current year ending 31 December 2015. The amendments apply prospectively for annual periods beginning on or after 1 January 2016 and early adoption is permitted.
Standard/Interpretation Effective date Periods beginning on after
Il2FRS 11 Accounting for Acquisitions of Interests in Joint Operations 1 January 2016
IAS 16 and IAS 38 Clarification of Acceptable Methods of Depreciation and Amortisation 1 January 2016
IFRS 15 Revenue from contracts with customers 1 January 2018
IAS 16 and IAS 41 Agriculture: Bearer Plants 1 January 2016
IFRS 9 Financial Instruments 1 January 2018
IAS 27 Equity Method in Separate Financial Statements 1 January 2016
IFRS 10 and IAS 28 Sale or Contribution of Assets between an Investor and its Associate or Join Venture 1 January 2016
IAS 1 Disclosure Initiative 1 January 2016
IFRS 16 Leases 1 January 2019
572015 Annual Report
Notes to the consolidated and separate financial statements for the year ended 31 December 2015

IFRS 15 Revenue from contracts with customers
This standard replaces IAS 11 Construction Contracts, IAS 18 Revenue, IFRIC 13 Customer Loyalty Programmes, IFRIC 15 Agreements for the Construction of Real Estate, IFRIC 18 Transfer of Assets from Customers and SIC-31 Revenue – Barter of Transactions Involving Advertising Services.
The standard contains a single model that applies to contracts with customers and two approaches to recognising revenue: at a point in time or over time. The model features a contract-based five-step analysis of transactions to determine whether, how much and when revenue is recognised.
This new standard will most likely have a significant impact on the Group, which will include a possible change in the timing of when revenue is recognised and the amount of revenue recognised. The Group is currently in the process of performing a more detailed assessment of the impact of this standard on the Group and will provide more information in the year ending 31 December 2016 financial statements.
The standard is effective for annual periods beginning on or after 1 January 2018, with early adoption permitted.
Agriculture: Bearer Plants (Amendments to IAS 16 and IAS 41)
The amendments to IAS 16 Property, Plant and Equipment and IAS 41 Agriculture require a bearer plant (which is a living plant used solely to grow produce over several periods) to be accounted for as property, plant and equipment in accordance with IAS 16 Property, Plant and Equipment instead of IAS 41 Agriculture. The produce growing on bearer plants will remain within the scope of IAS 41.
The amendments apply prospectively for annual periods beginning on or after 1 January 2016 and early adoption is permitted.
IFRS 9 Financial Instruments
On 24 July 2014, the IASB issued the final IFRS 9 Financial Instruments Standard, which replaces earlier versions of IFRS 9 and completes the IASB’s project to replace IAS 39 Financial Instruments: Recognition and Measurement.
This standard will have a significant impact on the Group, which will include changes in the measurement bases of the Group’s financial assets to amortised cost, fair value through other comprehensive income or fair value through profit or loss. Even though these measurement categories are similar to IAS 39, the criteria for classification into these categories are significantly different. In addition, the IFRS 9 impairment model has been changed from an "incurred loss" model from IAS 39 to an "expected credit loss" model, which is expected to increase the provision for bad debts recognised in the Group.
The standard is effective for annual periods beginning on or after 1 January 2018 with retrospective application, early adoption is permitted.
Equity Method in Separate Financial Statements (Amendments to IAS 27)
The amendments allow an entity to apply the equity method in its separate financial statements to account for its investments in subsidiaries, associates and joint ventures.
The amendments apply retrospectively for annual periods beginning on or after 1 January 2016 and early adoption is permitted.
58 2015 Annual Report
Notes to the consolidated and separate financial statements for the year ended 31 December 2015
Sale or Contribution of Assets between an Investor and its Associate or Joint Venture (Amendments to IFRS 10 and IAS 28)
The amendments require the full gain to be recognised when assets transferred between an investor and its associate or joint venture meet the definition of a ‘business’ under IFRS 3 Business Combinations. Where the assets transferred do not meet the definition of a business, a partial gain to the extent of unrelated investors’ interests in the associate or joint venture is recognised. The definition of a business is key in determining the extent of the gain to be recognised.
The amendments apply prospectively for annual periods beginning on or after 1 January 2016 and early adoption is permitted.
Disclosure Initiative (Amendments to IAS 1)
The amendments provide additional guidance on the application of materiality and aggregation when preparing financial statements. The amendments also clarify presentation principles applicable to of the order of notes, OCI of equity accounted investees and subtotals presented in the statement of financial position and statement of profit or loss and other comprehensive income.
The amendments apply for annual periods beginning on or after 1 January 2016 and early application is permitted.
IFRS 16 Leases
IFRS 16 was published in January 2016. It sets out the principles for the recognition, measurement, presentation and disclosure of leases for both parties to a contract, i.e. the customer (‘lessee’) and the supplier (‘lessor’). IFRS 16 replaces the previous leases Standard, IAS 17 Leases, and related Interpretations. IFRS 16 has one model for lessees which will result in almost all leases being included on the Statement of Financial position. No significant changes have been included for lessors.
The standard is effective for annual periods beginning on or after 1 January 2019, with early adoption permitted only if the entity also adopts IFRS 15. The transitional requirements are different for lessees and lessors. The group and company are assessing the potential impact on the financial statements resulting from the application of IFRS 16.
4. Determination of fair values
A number of the Group's accounting policies and disclosures require the determination of fair value, for both financial and non-financial assets and liabilities. Fair values have been determined for measurement and/or disclosure purposes based on the following methods. When applicable, further information about the assumptions made in determining fair values is disclosed in the notes specific to the assets or liability.
4.1 Equity securities
The fair value of equity securities is determined by reference to their quoted closing bid price at the reporting date, or if unquoted, determined using a valuation technique. Valuation techniques employed included market multiples and discounted cash flow analyses using expected future cash flows and a market-related discount rate.
The Group's financial assets and liabilities include financial assets at fair value through profit or loss, other receivables, cash and cash equivalents, borrowings and trade and other payables. The carrying amounts of trade and other receivables, cash and cash equivalents, borrowings and trade and other payables approximate their fair values.
592015 Annual Report
Notes to the consolidated and separate financial statements for the year ended 31 December 2015
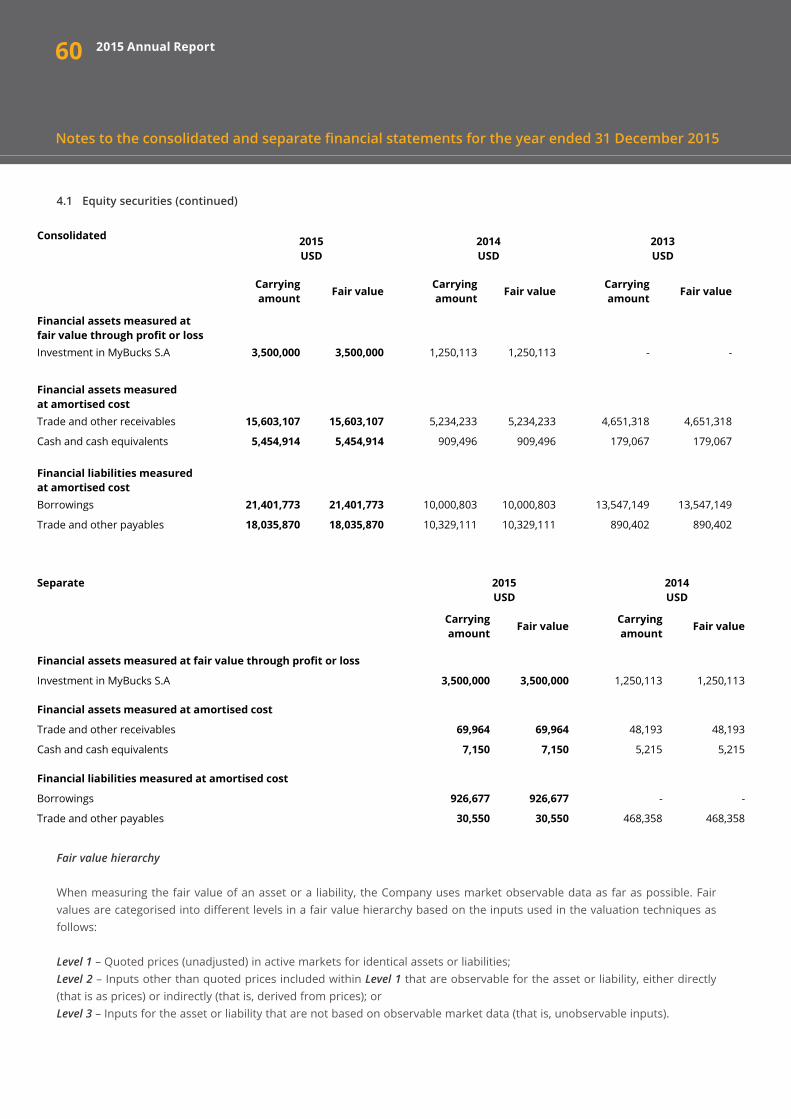
4.1 Equity securities (continued)
Fair value hierarchy
When measuring the fair value of an asset or a liability, the Company uses market observable data as far as possible. Fair values are categorised into different levels in a fair value hierarchy based on the inputs used in the valuation techniques as follows:
Level 1 – Quoted prices (unadjusted) in active markets for identical assets or liabilities;Level 2 – Inputs other than quoted prices included within Level 1 that are observable for the asset or liability, either directly (that is as prices) or indirectly (that is, derived from prices); orLevel 3 – Inputs for the asset or liability that are not based on observable market data (that is, unobservable inputs).
60
Consolidated
2015 USD
2014 USD
2013 USD
Carrying amount Fair value
Carrying amount Fair value
Carrying amount Fair value
Financial assets measured at fair value through profit or loss
Investment in MyBucks S.A
3,500,000 3,500,000
1,250,113 1,250,113
- -
Financial assets measured at amortised cost
Trade and other receivables
15,603,107 15,603,107
5,234,233 5,234,233
4,651,318 4,651,318
Cash and cash equivalents
5,454,914 5,454,914
909,496 909,496
179,067 179,067 Financial liabilities measured at amortised cost
Borrowings
21,401,773 21,401,773
10,000,803 10,000,803
13,547,149 13,547,149
Trade and other payables
18,035,870 18,035,870
10,329,111 10,329,111
890,402 890,402
Separate
2015 USD
2014 USD
Carrying amount
Fair value
Carrying amount
Fair value
Financial assets measured at fair value through profit or loss Investment in MyBucks S.A
3,500,000 3,500,000
1,250,113 1,250,113
Financial assets measured at amortised cost
Trade and other receivables
69,964 69,964 48,193 48,193
Cash and cash equivalents
7,150 7,150 5,215 5,215 Financial liabilities measured at amortised cost
Borrowings
926,677 926,677 - -
Trade and other payables
30,550 30,550 468,358 468,358
2015 Annual Report
Notes to the consolidated and separate financial statements for the year ended 31 December 2015

61
4.1 Equity securities (continued)
The following table presents the Group's financial assets and liabilities at fair value at 31 December 2015:
2015 Annual Report
Notes to the consolidated and separate financial statements for the year ended 31 December 2015
Consolidated
31 December 2015
Quoted prices
Level 1
Observable inputs
Level 2
Unobservable inputs
Level 3
Total at fair value
Investment in MyBucks S.A - - 3,500,000 3,500,000
Total assets at fair value - - 3,500,000 3,500,000 The fair value was based on the valuation of the business which was performed prior to the listing of MyBucks S.A. This resulted in a fair value adjustment of US$2,249,887 in the statement of comprehensive income. 31 December 2014
Quoted prices
Level 1
Observable inputs
Level 2
Unobservable inputs
Level 3
Total at fair value
Investment in MyBucks S.A - - 1,250,113 1,250,113
Total assets at fair value - - 1,250,113 1,250,113
His fair value was based on the valuation of the business. This resulted in a fair value adjustment of US$1,349,112 in the statement of comprehensive income. 31 December 2013
Quoted prices
Level 1
Observable inputs
Level 2
Unobservable inputs
Level 3
Total at fair value
Investment in ABC Holdings Limited 7,243,986 - - 7,243,986
Total assets at fair value 7,243,986 - - 7,243,986 Separate 31 December 2015 Quoted
prices Level 1
Observable inputs
Level 2
Unobservable inputs
Level 3
Total at fair value
Investment in MyBucks S.A - 3,500,000 3,500,000
Total assets at fair value - - 3,500,000 3,500,000 31 December 2014 Quoted
prices Level 1
Observable inputs
Level 2
Unobservable inputs
Level 3
Total at fair value
Investment in MyBucks S.A - - 1,250,113 1,250,113
Total assets at fair value - - 1,250,113 1,250,113
The fair value was based on the valuation of the business which was performed prior to the listing of MyBucks S.A. This resulted in a fair value adjustment of US$2,249,887 in the statement of comprehensive income.
The fair value was based on the valuation of the business. This resulted in a fair value adjustment of US$1,349,112 in the statement of comprehensive income.

62
Included in cash and cash equivalents is a restricted balance of US$104,602 held in an offshore account by Africa Export- Import Bank Limited as part of security for a loan granted to African Sun Limited.
5. Cash and cash equivalents
7. Trade and other receivables
6. Inventories
The property under construction comprises a block of flats that are currently being developed in Marlborough, Harare, Zimbabwe with a view to sale. The units are expected to be completed within the next financial reporting year.
Included in other receivables is an investment of US$7,8 million with Ecobank Asset Management Company (Private) Limited.
The carrying amount of the receivables approximates fair values.
2015 Annual Report
Notes to the consolidated and separate financial statements for the year ended 31 December 2015
Consolidated Separate
2015
US$ 2014
US$ 2013
US$ 2015
US$ 2014
US$
Bank balance 5,454,914
909,496
179,067
7,150
5,215
5,454,914 909,496 179,067 7,150 5,215
Consolidated
2015
US$
Food and beverage 686,040 Shop merchandise 51,403 Consumable stocks 533,794 Maintenance stocks 367,841 Property under construction 883,125 Stationery and other office consumables 16,414
2,538,617
Property under construction
Land value (transferred from property and equipment) 400,000 Construction expenses incurred to date 483,125
883,125
Consolidated Separate
2015
US$ 2014
US$ 2013
US$ 2015
US$ 2014
US$
Trade receivables 6,462,966
-
-
-
-
Less: allowance for impairment (3,828,391) - - - -
2,634,575 - - - -
Other receivables 11,429,303 825,670 3,711,139 69,964 -
Receivables from related parties 2,357,326 4,417,963 1,031,638 - 48,193
16,421,204 5,243,633 4,742,777 69,964 48,193
Consolidated Separate
2015
US$ 2014
US$ 2013
US$ 2015
US$ 2014
US$
Bank balance 5,454,914
909,496
179,067
7,150
5,215
5,454,914 909,496 179,067 7,150 5,215
Consolidated
2015
US$
Food and beverage 686,040 Shop merchandise 51,403 Consumable stocks 533,794 Maintenance stocks 367,841 Property under construction 883,125 Stationery and other office consumables 16,414
2,538,617
Property under construction
Land value (transferred from property and equipment) 400,000 Construction expenses incurred to date 483,125
883,125
Consolidated Separate
2015
US$ 2014
US$ 2013
US$ 2015
US$ 2014
US$
Trade receivables 6,462,966
-
-
-
-
Less: allowance for impairment (3,828,391) - - - -
2,634,575 - - - -
Other receivables 11,429,303 825,670 3,711,139 69,964 -
Receivables from related parties 2,357,326 4,417,963 1,031,638 - 48,193
16,421,204 5,243,633 4,742,777 69,964 48,193

63
8. Financial assets at fair value through profit or loss
On 14th December 2015, GetBucks (Proprietary) Limited (South Africa) and GetBucks Limited (Mauritius) were merged into MyBucks S.A. by the existing shareholders of the two companies and as such as at 31 December 2015, the Company holds investment in MyBucks S.A.
9. Investment in subsidiary
5. Financial assets at fair value through profit or loss
Consolidated Separate
2015
2014
2013
2015
2014
US$
US$
US$
US$
US$
Cost
Balance at beginning and end of the year 1,250,113 1,250,113 7,259,234 1,250,113
1,250,113
Fair value adjustment
Balance at beginning of year - - - -
-
Net change in fair value 2,249,887 - (15,248) 2,249,887 -
Balance at end of year 2,249,887 - (15,248) 2,249,887 -
Fair value 3,500,000 1,250,113 7,243,986 3,500,000 1,250,113
Name of entity Year Country of
incorporation % holding
MyBucks S.A. ABC Holdings Limited
2014/2015 2013
Luxemburg Botswana
2.5% 2.6%
On 14th December 2015, GetBucks (Proprietary) Limited (South Africa) and GetBucks Limited (Mauritius) were merged into MyBucks by the existing shareholders of the two companies and as such as at 31 December 2015, the Company holds investment in MyBucks S.A.R.L. 6. Investment in subsidiary
Separate
2015
2014
US$
US$
At 1 January
-
- Addition
86,306,195
-
At 31 December
86,306,195
-
Details of the investment in subsidiary for the year ended 31 December 2015 is as follows:
Name of entity Country of incorporation % holding
No. of equity shares
Brainworks Capital Management (Private) Limited Zimbabwe
100%
863,061,948
As at 30 June 2015, the Group was re-organised by way of a share swap between Brainworks Limited, a company having its registered office at C/o FiduceForte Management Services, Level 2, Alexander House, Silicon Avenue, 35 Ebène Cybercity, Republic of Mauritius and Brainworks Capital Management (Private) Limited, a company having its registered office at 4 Arden Road, Newlands in Harare, Zimbabwe. The share swap was made to the ratio 1:1. In the reporting year 31 December 2014, the Company was considered as a subsidiary of Brainworks Capital Management (Private) Limited. The Company adopted the book value method of accounting for a business combination under common control for the share swap.
As at 30 June 2015, the Group was re-organised by way of a share swap between Brainworks Limited, a company having its registered office at C/o FiduceForte Management Services, Level 2, Alexander House, Silicon Avenue, 35 Ebène Cybercity, Republic of Mauritius and Brainworks Capital Management (Private) Limited, a company having its registered office at 4 Arden Road, Newlands in Harare, Zimbabwe. The share swap was made to the ratio 1:1. In the reporting year 31 December 2014, the Company was considered as a subsidiary of Brainworks Capital Management (Private) Limited.
The Company adopted the book value method of accounting for a business combination under common control for the share swap.
2015 Annual Report
Notes to the consolidated and separate financial statements for the year ended 31 December 2015
5. Financial assets at fair value through profit or loss
Consolidated Separate
2015
2014
2013
2015
2014
US$
US$
US$
US$
US$
Cost
Balance at beginning and end of the year 1,250,113 1,250,113 7,259,234 1,250,113
1,250,113
Fair value adjustment
Balance at beginning of year - - - -
-
Net change in fair value 2,249,887 - (15,248) 2,249,887 -
Balance at end of year 2,249,887 - (15,248) 2,249,887 -
Fair value 3,500,000 1,250,113 7,243,986 3,500,000 1,250,113
Name of entity Year Country of
incorporation % holding
MyBucks S.A. ABC Holdings Limited
2014/2015 2013
Luxemburg Botswana
2.5% 2.6%
On 14th December 2015, GetBucks (Proprietary) Limited (South Africa) and GetBucks Limited (Mauritius) were merged into MyBucks by the existing shareholders of the two companies and as such as at 31 December 2015, the Company holds investment in MyBucks S.A.R.L. 6. Investment in subsidiary
Separate
2015
2014
US$
US$
At 1 January
-
- Addition
86,306,195
-
At 31 December
86,306,195
-
Details of the investment in subsidiary for the year ended 31 December 2015 is as follows:
Name of entity Country of incorporation % holding
No. of equity shares
Brainworks Capital Management (Private) Limited Zimbabwe
100%
863,061,948
As at 30 June 2015, the Group was re-organised by way of a share swap between Brainworks Limited, a company having its registered office at C/o FiduceForte Management Services, Level 2, Alexander House, Silicon Avenue, 35 Ebène Cybercity, Republic of Mauritius and Brainworks Capital Management (Private) Limited, a company having its registered office at 4 Arden Road, Newlands in Harare, Zimbabwe. The share swap was made to the ratio 1:1. In the reporting year 31 December 2014, the Company was considered as a subsidiary of Brainworks Capital Management (Private) Limited. The Company adopted the book value method of accounting for a business combination under common control for the share swap.

• The associates are all incorporated in Zimbabwe and the principal place of business for all the associates is in Harare, Zimbabwe.
• The 29% interest held in Ecobank Zimbabwe Limited was disposed of on 30 June 2015. The investment was sold for US$12,5 million and a loss on disposal of US$3,9 million was realised. At the date of disposal, the carrying amount was US$16,4 million.
• The investment in Africa Sun Limited, a hotel company listed on the ZSE, ceased to be an associate on 30 April 2015 when Brainworks Capital acquired a controlling stake in the company. As at 31 December 2015, the interest held in African Sun was 58% (31 December 2014: 43%) and Brainworks exercises control over the company.
• The investment in Dawn Properties Limited a property company listed on the ZSE, ceased to be an associate on 31 March 2015 when Brainworks Capital Management acquired a controlling stake in the company. As at 31 December 2015, the interest held in Dawn Properties was 67% (31 December 2014: 29%) and Brainworks exercises control over the company.
• The shareholding in GetBucks Financial Services Limited (a microfinance company), an unlisted investment, was 34% (2014: 45%) on 31 December 2015. The investment is accounted for as associate due to significant influence arising from having three members out of seven on its Board of Directors representing Brainworks Capital’s interests. Brainworks Capital declared a dividend in specie in the form of GetBucks Financial Services Limited shares which resulted in the reduction of its shareholding from 45% to 34%.
64
10. Investment in associates
2015 Annual Report
Notes to the consolidated and separate financial statements for the year ended 31 December 2015
5. Investment in associates Consolidated
2015 2014
2013
US$
US$
US$
Investment in Ecobank Zimbabwe Limited - 15,959,270 15,290,714 Investment in GetBucks Financial Services Limited 3,110,544 2,000,006 670,072 Investment in African Sun Limited - 10,561,449 12,106,510
Investment in Dawn Properties Limited - 12,494,545 5,402,303
3,110,544 41,015,270 33,469,599
Reconciliation of carrying amount of associates
As at 1 January 41,015,270 33,469,599 15,312,014 Additions - 7,352,018 17,549,394 Disposals (16,435,005) - - Dividends received (450,000) (480,259) -- Revaluation to fair value of GetBucks Financial Services Limited 3,301,393 - - Transfer to subsidiary of Dawn Properties and African Sun (23,055,994) - - Dividend paid in specie (3,740,591) - - Share of associates profit 2,475,471 1,430,801 608,191 Share of associates other comprehensive income (OCI) - (756,889) -
3,110,544 41,015,270 33,469,599
Consolidated Separate
2015
US$ 2014
US$ 2013
US$ 2015
US$ 2014
US$
Bank balance 5,454,914
909,496
179,067
7,150
5,215
5,454,914 909,496 179,067 7,150 5,215
Consolidated
2015
US$
Food and beverage 686,040 Shop merchandise 51,403 Consumable stocks 533,794 Maintenance stocks 367,841 Property under construction 883,125 Stationery and other office consumables 16,414
2,538,617
Property under construction
Land value (transferred from property and equipment) 400,000 Construction expenses incurred to date 483,125
883,125
Consolidated Separate
2015
US$ 2014
US$ 2013
US$ 2015
US$ 2014
US$
Trade receivables 6,462,966
-
-
-
-
Less: allowance for impairment (3,828,391) - - - -
2,634,575 - - - -
Other receivables 11,429,303 825,670 3,711,139 69,964 -
Receivables from related parties 2,357,326 4,417,963 1,031,638 - 48,193
16,421,204 5,243,633 4,742,777 69,964 48,193
Consolidated Separate
2015
US$ 2014
US$ 2013
US$ 2015
US$ 2014
US$
Bank balance 5,454,914
909,496
179,067
7,150
5,215
5,454,914 909,496 179,067 7,150 5,215
Consolidated
2015
US$
Food and beverage 686,040 Shop merchandise 51,403 Consumable stocks 533,794 Maintenance stocks 367,841 Property under construction 883,125 Stationery and other office consumables 16,414
2,538,617
Property under construction
Land value (transferred from property and equipment) 400,000 Construction expenses incurred to date 483,125
883,125
Consolidated Separate
2015
US$ 2014
US$ 2013
US$ 2015
US$ 2014
US$
Trade receivables 6,462,966
-
-
-
-
Less: allowance for impairment (3,828,391) - - - -
2,634,575 - - - -
Other receivables 11,429,303 825,670 3,711,139 69,964 -
Receivables from related parties 2,357,326 4,417,963 1,031,638 - 48,193
16,421,204 5,243,633 4,742,777 69,964 48,193
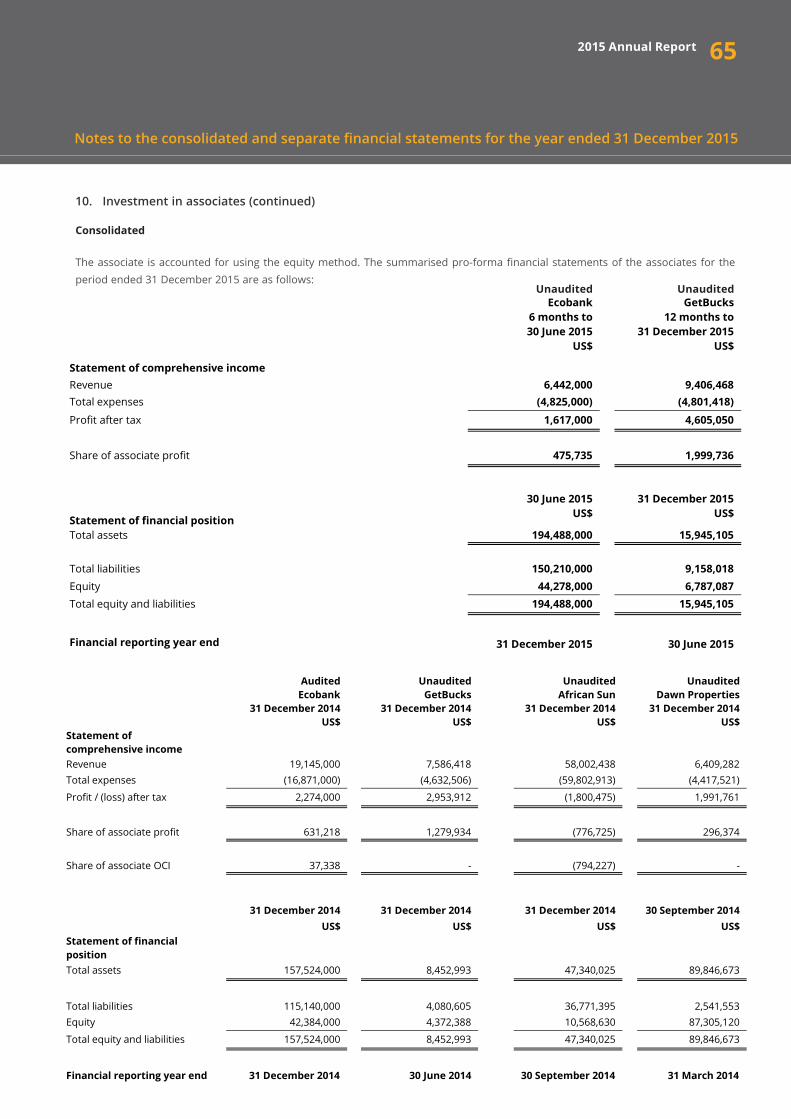
65
10. Investment in associates (continued)
Unaudited Ecobank
6 months to 30 June 2015
US$
Unaudited
GetBucks 12 months to
31 December 2015 US$
Statement of comprehensive income
Revenue 6,442,000 9,406,468 Total expenses (4,825,000) (4,801,418) Profit after tax 1,617,000 4,605,050
Share of associate profit 475,735 1,999,736
Statement of financial position
30 June 2015 US$
31 December 2015 US$
Total assets 194,488,000 15,945,105
Total liabilities 150,210,000 9,158,018 Equity 44,278,000 6,787,087 Total equity and liabilities 194,488,000 15,945,105
Financial reporting year end 31 December 2015 30 June 2015
Audited
Ecobank 31 December 2014
US$
Unaudited
GetBucks 31 December 2014
US$
Unaudited
African Sun 31 December 2014
US$
Unaudited
Dawn Properties 31 December 2014
US$
Statement of comprehensive income
Revenue 19,145,000 7,586,418 58,002,438 6,409,282 Total expenses (16,871,000) (4,632,506) (59,802,913) (4,417,521)
Profit / (loss) after tax 2,274,000 2,953,912 (1,800,475) 1,991,761
Share of associate profit 631,218 1,279,934 (776,725) 296,374
Share of associate OCI 37,338 - (794,227) -
31 December 2014
31 December 2014
31 December 2014
30 September 2014
US$ US$
US$
US$
Statement of financial position
Total assets 157,524,000 8,452,993 47,340,025 89,846,673
Total liabilities 115,140,000 4,080,605 36,771,395 2,541,553 Equity 42,384,000 4,372,388 10,568,630 87,305,120
Total equity and liabilities 157,524,000 8,452,993 47,340,025 89,846,673
Financial reporting year end 31 December 2014
30 June 2014
30 September 2014
31 March 2014
Consolidated
The associate is accounted for using the equity method. The summarised pro-forma financial statements of the associates for the period ended 31 December 2015 are as follows:
Unaudited Ecobank
6 months to 30 June 2015
US$
Unaudited
GetBucks 12 months to
31 December 2015 US$
Statement of comprehensive income
Revenue 6,442,000 9,406,468 Total expenses (4,825,000) (4,801,418) Profit after tax 1,617,000 4,605,050
Share of associate profit 475,735 1,999,736
Statement of financial position
30 June 2015 US$
31 December 2015 US$
Total assets 194,488,000 15,945,105
Total liabilities 150,210,000 9,158,018 Equity 44,278,000 6,787,087 Total equity and liabilities 194,488,000 15,945,105
Financial reporting year end 31 December 2015 30 June 2015
Audited
Ecobank 31 December 2014
US$
Unaudited
GetBucks 31 December 2014
US$
Unaudited
African Sun 31 December 2014
US$
Unaudited
Dawn Properties 31 December 2014
US$
Statement of comprehensive income
Revenue 19,145,000 7,586,418 58,002,438 6,409,282 Total expenses (16,871,000) (4,632,506) (59,802,913) (4,417,521)
Profit / (loss) after tax 2,274,000 2,953,912 (1,800,475) 1,991,761
Share of associate profit 631,218 1,279,934 (776,725) 296,374
Share of associate OCI 37,338 - (794,227) -
31 December 2014
31 December 2014
31 December 2014
30 September 2014
US$ US$
US$
US$
Statement of financial position
Total assets 157,524,000 8,452,993 47,340,025 89,846,673
Total liabilities 115,140,000 4,080,605 36,771,395 2,541,553 Equity 42,384,000 4,372,388 10,568,630 87,305,120
Total equity and liabilities 157,524,000 8,452,993 47,340,025 89,846,673
Financial reporting year end 31 December 2014
30 June 2014
30 September 2014
31 March 2014
Unaudited Unaudited
2015 Annual Report
Notes to the consolidated and separate financial statements for the year ended 31 December 2015

66
10. Investment in associates (continued)
ConsolidatedThe summarised pro-forma financial statements of the associates for the period ended 31 December 2013 are as follows:
Audited Ecobank
31 December 2013 US$
Reviewed GetBucks
31 December 2013 US$
Unaudited
African Sun 31 December 2013
US$
Unaudited
Dawn Properties 31 December 2013
US$
Statement of comprehensive income
Revenue 17,147,000 2,073,398 55,703,222 5,510,476 Total expenses (14,749,000) (1,417,978) (62,888,142) (5,663,222)
Profit / (loss) after tax 2,398,000 655,420 (7,184,920) (152,746)
31 December 2013
US$ 31 December 2013
US$ 31 December 2013
US$ 31 December 2013
US$
Statement of financial position Total assets 127,597,000 3,961,230 57,424,124 88,012,516
Total liabilities 87,104,000 2,488,263 41,111,090 2,724,806 Equity 40,493,000 1,472,967 16,313,034 85,287,710
Total equity and liabilities 127,597,000 3,961,230 57,424,124 88,012,516
Financial reporting year end 31 December 2013
30 June 2013
30 September 2013
31 March 2013
2015 Annual Report
Notes to the consolidated and separate financial statements for the year ended 31 December 2015
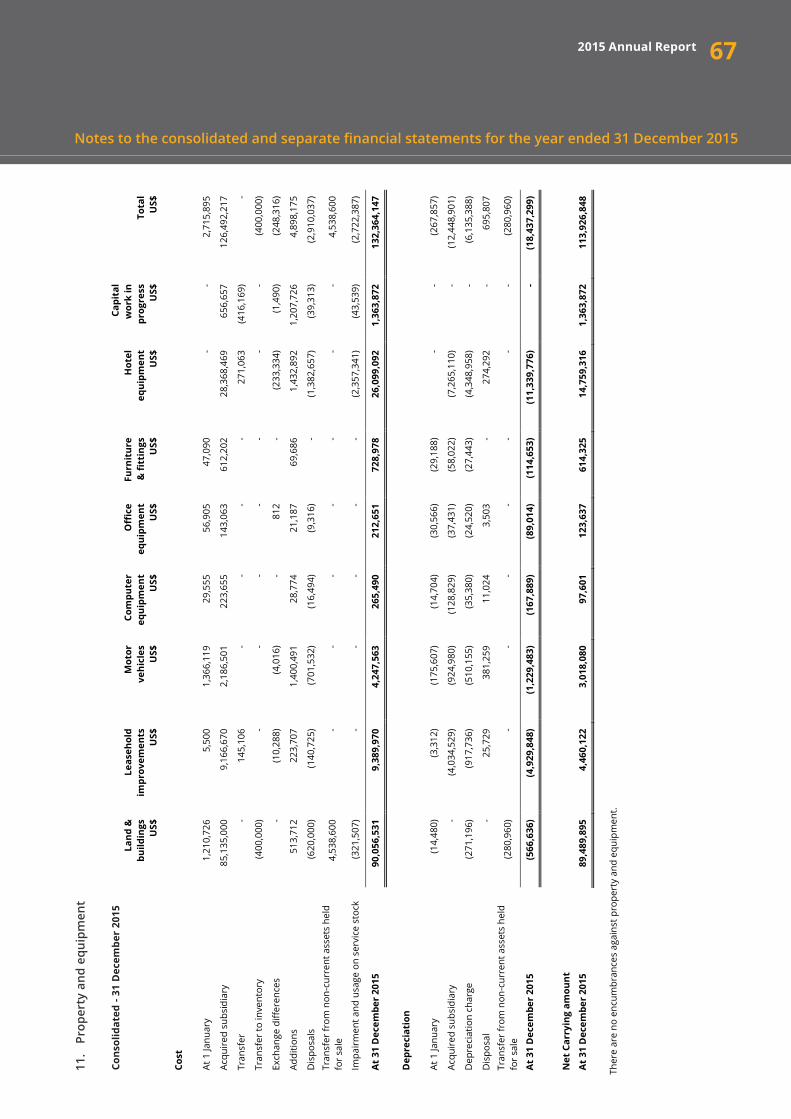
672015 Annual Report
Notes to the consolidated and separate financial statements for the year ended 31 December 2015
11
. P
rope
rty
and
equi
pmen
t
Cons
olid
ated
– 3
1 D
ecem
ber
2015
Cons
olid
ated
La
nd &
bu
ildin
gs
US$
Leas
ehol
d im
prov
emen
ts
US$
Mot
or
vehi
cles
U
S$
Com
pute
r eq
uipm
ent
US$
Off
ice
equi
pmen
t U
S$
Furn
itur
e &
fitt
ings
U
S$
Hot
el
equi
pmen
t U
S$
Capi
tal
wor
k in
pr
ogre
ss
US$
Tota
l U
S$
Cost
At 1
Janu
ary
1,
210,
726
5,50
0 1,
366,
119
29,5
55
56,9
05
47,0
90
- -
2,71
5,89
5
Acqu
ired
subs
idia
ry
85,1
35,0
00
9,16
6,67
0 2,
186,
501
223,
655
143,
063
612,
202
28,3
68,4
69
656,
657
126,
492,
217
Tran
sfer
-
145,
106
- -
- -
271,
063
(416
,169
) -
Tran
sfer
to in
vent
ory
(400
,000
) -
- -
- -
- -
(400
,000
)
Exch
ange
diff
eren
ces
- (1
0,28
8)
(4,0
16)
- 81
2 -
(233
,334
) (1
,490
) (2
48,3
16)
Addi
tions
51
3,71
2 22
3,70
7 1,
400,
491
28,7
74
21,1
87
69,6
86
1,43
2,89
2 1,
207,
726
4,89
8,17
5
Dis
posa
ls
(620
,000
) (1
40,7
25)
(701
,532
) (1
6,49
4)
(9,3
16)
- (1
,382
,657
) (3
9,31
3)
(2,9
10,0
37)
Tran
sfer
from
non
-cur
rent
ass
ets
held
fo
r sal
e 4,
538,
600
- -
- -
- -
- 4,
538,
600
Impa
irmen
t and
usa
ge o
n se
rvic
e st
ock
(321
,507
) -
- -
- -
(2,3
57,3
41)
(43,
539)
(2
,722
,387
)
At
31 D
ecem
ber
2015
90
,056
,531
9,
389,
970
4,24
7,56
3 26
5,49
0 21
2,65
1 72
8,97
8 26
,099
,092
1,
363,
872
132,
364,
147
Dep
reci
atio
n
At 1
Janu
ary
(14,
480)
(3
,312
) (1
75,6
07)
(14,
704)
(3
0,56
6)
(29,
188)
-
- (2
67,8
57)
Acqu
ired
subs
idia
ry
- (4
,034
,529
) (9
24,9
80)
(128
,829
) (3
7,43
1)
(58,
022)
(7
,265
,110
) -
(12,
448,
901)
Dep
reci
atio
n ch
arge
(2
71,1
96)
(917
,736
) (5
10,1
55)
(35,
380)
(2
4,52
0)
(27,
443)
(4
,348
,958
) -
(6,1
35,3
88)
Dis
posa
l -
25,7
29
381,
259
11,0
24
3,50
3 -
274,
292
- 69
5,80
7 Tr
ansf
er fr
om n
on-c
urre
nt a
sset
s he
ld
for s
ale
(280
,960
) -
- -
- -
- -
(280
,960
)
At
31 D
ecem
ber
2015
(5
66,6
36)
(4,9
29,8
48)
(1,2
29,4
83)
(167
,889
) (8
9,01
4)
(114
,653
) (1
1,33
9,77
6)
- (1
8,43
7,29
9)
Net
Car
ryin
g am
ount
At
31 D
ecem
ber
2015
89
,489
,895
4,
460,
122
3,01
8,08
0 97
,601
12
3,63
7 61
4,32
5 14
,759
,316
1,
363,
872
113,
926,
848
Ther
e ar
e no
enc
umbr
ance
s ag
ains
t pro
pert
y an
d eq
uipm
ent.
Cons
olid
ated
- 31
Dec
embe
r 20
15

68 2015 Annual Report
Notes to the consolidated and separate financial statements for the year ended 31 December 2015
Cons
olid
ated
– 3
1 D
ecem
ber
2014
Prop
erty
U
S$
Mot
or
vehi
cles
U
S$
Com
pute
r eq
uipm
ent
US$
Off
ice
eq
uipm
ent
US$
Furn
itur
e &
fi
ttin
gs
US$
Capi
tal w
ork
in p
rogr
ess
US$
Tota
l U
S$
Co
st
At
1 Ja
nuar
y 1,
216,
226
24
2,12
3
30,7
09
69
,805
49,5
84
1,
291,
333
2,
899,
780
Addi
tions
-
-
1,
311
1,
100
-
48
,704
51,1
15
Tran
sfer
to w
ork
in p
rogr
ess
-
1,17
7,81
9
-
-
-
(1,1
77,8
19)
-
Reco
ver i
nput
VAT
-
(5
2,76
6)
-
-
-
(1
62,2
18)
(2
14,9
84)
Dis
posa
l
(1
,000
)
(2,4
65)
(1
4,00
0)
(2
,494
)
-
(19,
959)
At
31 D
ecem
ber
2014
1,
216,
226
1,
366,
176
29
,555
56,9
05
47
,090
-
2,71
5,95
2
Dep
reci
atio
n
At 1
Janu
ary
8,67
4
45,4
79
9,
863
26
,141
20,0
66
-
11
0,22
3
Dep
reci
atio
n ch
arge
9,
118
13
0,62
8
5,87
3
11,4
25
9,
546
-
16
6,59
0
Dis
posa
l -
(5
00)
(1
,032
)
(7,0
00)
(4
24)
-
(8
,956
)
At
31 D
ecem
ber
2014
17
,792
175,
607
14
,704
30,5
66
29
,188
-
267,
857)
Carr
ying
am
ount
At
31 D
ecem
ber
2014
1,
198,
434
1,
190,
569
14
,851
26,3
39
17
,902
-
2,44
8,09
5
Ther
e ar
e no
enc
umbr
ance
s ag
ains
t pro
pert
y an
d eq
uipm
ent.
11
. P
rope
rty
and
equi
pmen
t (c
onti
nued
)
Cons
olid
ated
- 31
Dec
embe
r 20
14
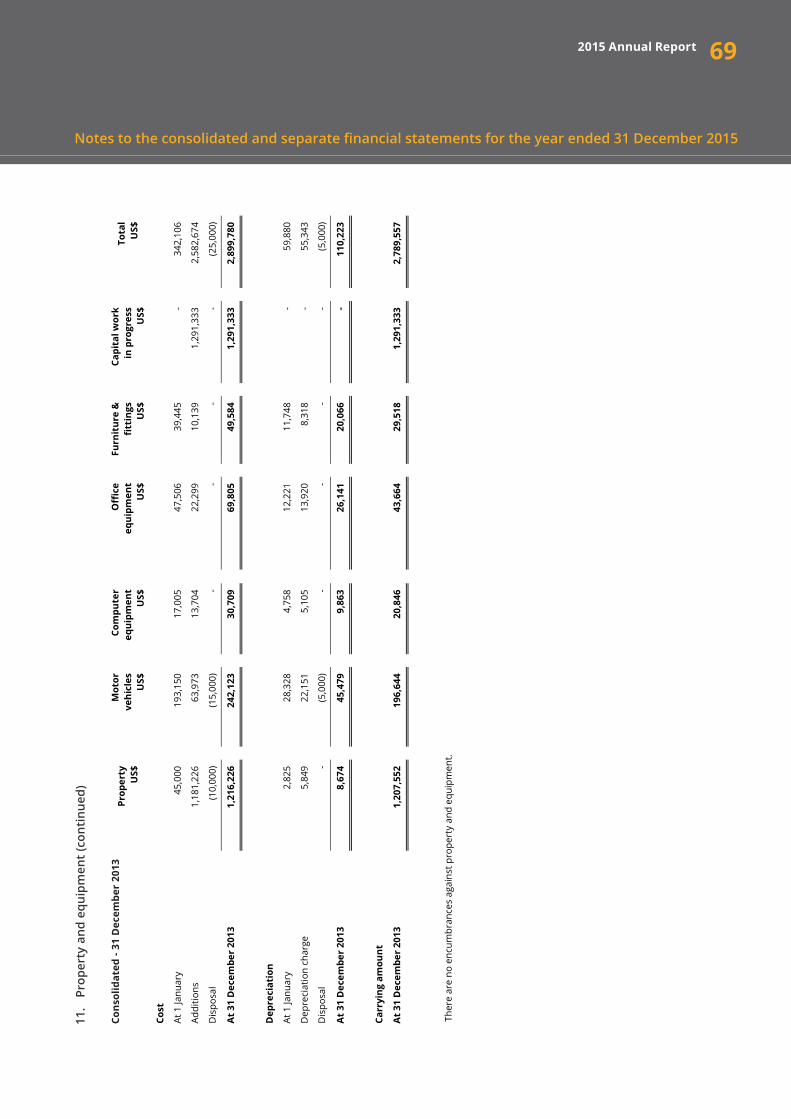
692015 Annual Report
Notes to the consolidated and separate financial statements for the year ended 31 December 2015
Not
es to
the
cons
olid
ated
and
sep
arat
e fin
anci
al s
tate
men
ts
For
the
year
end
ed 3
1 D
ecem
ber
2015
11
. Pro
pert
y an
d eq
uipm
ent (
Cont
inue
d)
Cons
olid
ated
– 3
1 D
ecem
ber
2013
Prop
erty
U
S$
M
otor
ve
hicl
es
US$
Com
pute
r eq
uipm
ent
US$
Off
ice
equi
pmen
t U
S$
Fu
rnit
ure
&
fitt
ings
U
S$
Ca
pita
l wor
k in
pro
gres
s U
S$
To
tal
US$
Cost
At 1
Janu
ary
45,0
00
19
3,15
0
17,0
05
47
,506
39,4
45
-
34
2,10
6
Addi
tions
1,
181,
226
63
,973
13,7
04
22
,299
10,1
39
1,
291,
333
2,
582,
674
Dis
posa
l (1
0,00
0)
(1
5,00
0)
-
-
-
-
(2
5,00
0)
At
31 D
ecem
ber
2013
1,
216,
226
24
2,12
3
30,7
09
69
,805
49,5
84
1,
291,
333
2,
899,
780
Dep
reci
atio
n
At 1
Janu
ary
2,82
5
28,3
28
4,
758
12
,221
11,7
48
-
59
,880
Dep
reci
atio
n ch
arge
5,
849
22
,151
5,10
5
13,9
20
8,
318
-
55
,343
Dis
posa
l -
(5
,000
)
-
-
-
-
(5,0
00)
At
31 D
ecem
ber
2013
8,
674
45
,479
9,86
3
26,1
41
20
,066
-
110,
223
Carr
ying
am
ount
At
31 D
ecem
ber
2013
1,
207,
552
19
6,64
4
20,8
46
43
,664
29,5
18
1,
291,
333
2,
789,
557
Ther
e ar
e no
enc
umbr
ance
s ag
ains
t pro
pert
y an
d eq
uipm
ent.
11
. P
rope
rty
and
equi
pmen
t (c
onti
nued
)
Cons
olid
ated
- 31
Dec
embe
r 20
13

70
12. Biological assets
African Sun Limited owns biological assets in the form of a timber plantation. Timber is held mainly for sale as raw timber on maturity. The total area under the timber plantation as at 31 December 2015 is approximately 454.8 hectares.
13. Deferred tax assets
Consolidated
Consolidated
31 Dec 15 US$
Recognised in profit/loss
US$ 31 Dec 14
US$
Recognised in profit/loss
US$ 31 Dec 13
US$ The movement on the deferred tax account is shown below:
Fair value on listed investments 17,743 - 17,743 49,452 (31,709) Fair value on unlisted investments (559,357) - (559,357) (533,190) (26,167) Provision for credit losses 87,167 - 87,167 87,167 - Leasehold improvements (563) - (563) (69) (494) Property and equipment (158,184) (76,654) (81,530) (254,082) 172,552 Prepayments (11,199) (3,503) (7,696) (7,696) - Estimated tax loss 1,620,905 187,206 1,433,699 85,808 1,347,891
Unconsolidated subsidiary loss - - - 13,625 -
Deferred tax asset 996,512 107,049 889,463 (558,985) 1,462,073
11. Share capital
Issued and fully paid
Restated
2014 US$
Restated 2013 US$
2015 US$
At 1 January
86,307 86,307 48,193
Additions - - 38,114
At 31 December 86,307 86,307 86,307
Deferred tax assets have been recognised in respect of tax losses and other temporary differences giving rise to deferred tax assets where the Directors believe that it is probable that these assets will be recovered. The Directors believe that sufficient taxable profits will be generated to utilise the tax benefits.
Consolidated
31 Dec 15 US$
Recognised in profit/loss
US$ 31 Dec 14
US$
Recognised in profit/loss
US$ 31 Dec 13
US$ The movement on the deferred tax account is shown below:
Fair value on listed investments 17,743 - 17,743 49,452 (31,709) Fair value on unlisted investments (559,357) - (559,357) (533,190) (26,167) Provision for credit losses 87,167 - 87,167 87,167 - Leasehold improvements (563) - (563) (69) (494) Property and equipment (158,184) (76,654) (81,530) (254,082) 172,552 Prepayments (11,199) (3,503) (7,696) (7,696) - Estimated tax loss 1,620,905 187,206 1,433,699 85,808 1,347,891
Unconsolidated subsidiary loss - - - 13,625 -
Deferred tax asset 996,512 107,049 889,463 (558,985) 1,462,073
11. Share capital
Issued and fully paid
Restated
2014 US$
Restated 2013 US$
2015 US$
At 1 January
86,307 86,307 48,193
Additions - - 38,114
At 31 December 86,307 86,307 86,307
14. Share capital
All shares rank equally with regard to the Company’s residual assets and dividends. The holders of ordinary shares are entitled to one vote per share at meetings of the Company. The unissued shares are under the control of the Directors.
14.1 Change in degree of control
The change in degree of control in the subsidiary Dawn Properties Limited from 62% to 67% resulted in a gain of US$2 million being realised. The additional interest was acquired pursuant to the mandatory offer to minority shareholders.
An additional 3.55% was acquired from minority shareholders in African Sun Limited and this change in degree of control resulted in a loss of US$0,5 million being realised.
2015 Annual Report
Notes to the consolidated and separate financial statements for the year ended 31 December 2015

71
15. Non-controlling interest
The following table summarises the information relating to each of the Group’s subsidiaries that has material non-controlling interests (NCI) before any intragroup eliminations:
31 December 2015
Dawn Properties 33% US$
African Sun 42% US$
Non-Controlling Interest (NCI) percentage
Non-current assets
85,563,756
24,534,052
Current assets 3,251,686 8,851,240
Non-current liabilities 3,787,498 7,071,908
Current liabilities 1,525,582 23,780,108
Net assets 83,502,362 2,533,276
Book value of NCI 27,555,780 1,063,976
Dawn Properties
33% US$
African Sun 42% US$
Non-Controlling Interest (NCI) percentage
Revenue 3,355,833 25,669,683
Loss before tax (226,222) (6,307,640)
Loss allocated to NCI 74,653 (2,649,209)
Cash flows from operating activities (780,380) 5,556,523
Cash flows from investing activities (442,174) 4,004,677
Cash flows from financing activities - (8,127,841)
Net (decrease)/increase in cash and cash equivalents (1,222,554) 1,433,359 Reconciliation of carrying amount of NCI 2015
US$ At beginning of the year -
Acquisition of subsidiary 37,553,867
Change in degree of shareholding (4,278,533)
Share of profit/ (loss) (4,768,386)
Share of other comprehensive income (27,153)
At 31 December 2015 28,479,795
2015 Annual Report
Notes to the consolidated and separate financial statements for the year ended 31 December 2015

72
15. Non-controlling interest (continued)
Non-Controlling Interest (NCI) percentage
Lengrah Investments
44% 31 Dec 2014
US$
FML Oil
49% 31 Dec 2014
US$
Book value of NCI - -
Revenue (480,351) 543,433
Loss before tax (939,050) (920,504)
Loss allocated to NCI (755,362) (460,448)
Cash flows from operating activities (258,108) (798,003)
Cash flows from investing activities - 174,208
Cash flows from financing activities 250,000 526,100
Net increase in cash and cash equivalents (8,108) (97,695)
Lengrah Investments
44% 31 Dec 2013
US$
FML Oil
49% 31 Dec 2013
US$
Non-Controlling Interest (NCI) percentage
Total assets 17,558,603 2,409,221
Total liabilities 1,817,180 1,442,389
Net assets 15,741,723 966,832
Book value of NCI 6,926,226 473,748
Revenue (40,581) 164,025
Loss before tax (275,319) (246,437)
Loss allocated to NCI (119,984) (120,754)
Cash flows from operating activities 1,500,536 (1,230,786)
Cash flows from investing activities (17,508,812) (1,388,220)
Cash flows from financing activities 16,016,742 2,713,730
Net increase in cash and cash equivalents 8,466 94,724
The non-controlling interest pertaining to Lengrah Investments (Private) Limited and FML Logistics (Private) Limited were eliminated as at 31 December 2014 following the buyout of minorities in both subsidiaries.
Non-Controlling Interest (NCI) percentage
Lengrah Investments
44% 31 Dec 2014
US$
FML Oil
49% 31 Dec 2014
US$
Book value of NCI - -
Revenue (480,351) 543,433
Loss before tax (939,050) (920,504)
Loss allocated to NCI (755,362) (460,448)
Cash flows from operating activities (258,108) (798,003)
Cash flows from investing activities - 174,208
Cash flows from financing activities 250,000 526,100
Net increase in cash and cash equivalents (8,108) (97,695)
Lengrah Investments
44% 31 Dec 2013
US$
FML Oil
49% 31 Dec 2013
US$
Non-Controlling Interest (NCI) percentage
Total assets 17,558,603 2,409,221
Total liabilities 1,817,180 1,442,389
Net assets 15,741,723 966,832
Book value of NCI 6,926,226 473,748
Revenue (40,581) 164,025
Loss before tax (275,319) (246,437)
Loss allocated to NCI (119,984) (120,754)
Cash flows from operating activities 1,500,536 (1,230,786)
Cash flows from investing activities (17,508,812) (1,388,220)
Cash flows from financing activities 16,016,742 2,713,730
Net increase in cash and cash equivalents 8,466 94,724
2015 Annual Report
Notes to the consolidated and separate financial statements for the year ended 31 December 2015
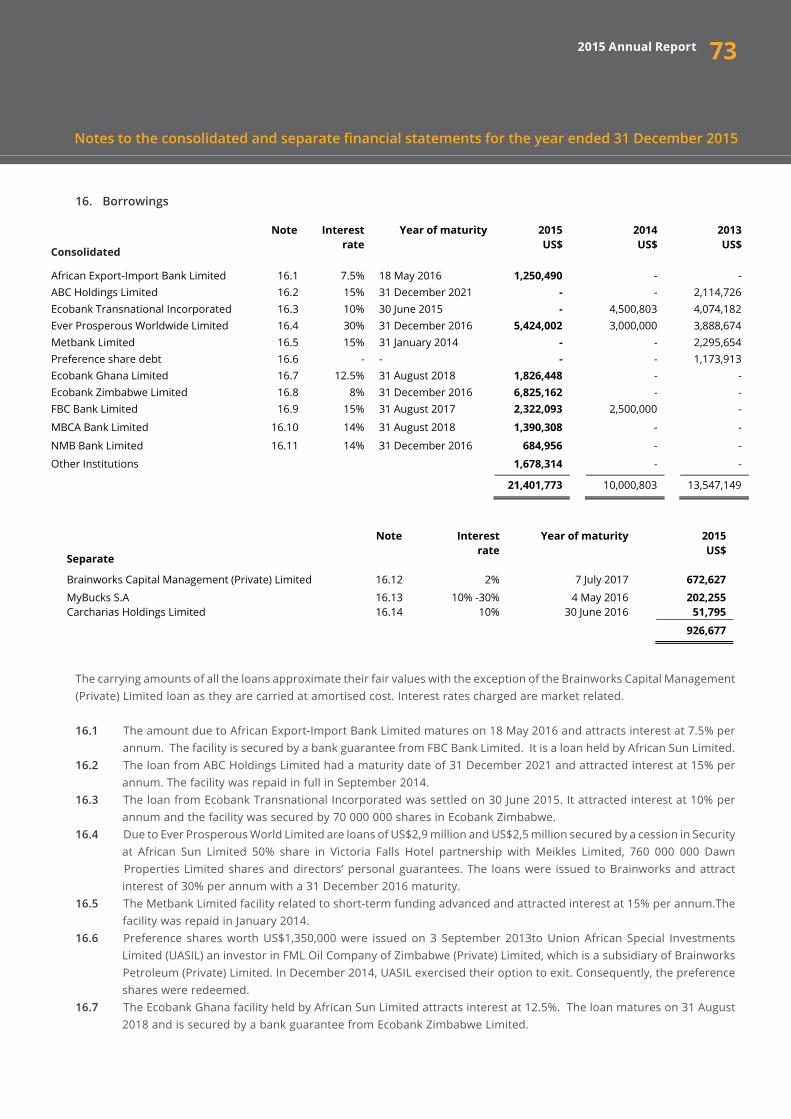
73
16. Borrowings
The carrying amounts of all the loans approximate their fair values with the exception of the Brainworks Capital Management (Private) Limited loan as they are carried at amortised cost. Interest rates charged are market related.
16.1 The amount due to African Export-Import Bank Limited matures on 18 May 2016 and attracts interest at 7.5% per annum. The facility is secured by a bank guarantee from FBC Bank Limited. It is a loan held by African Sun Limited.16.2 The loan from ABC Holdings Limited had a maturity date of 31 December 2021 and attracted interest at 15% per annum. The facility was repaid in full in September 2014.16.3 The loan from Ecobank Transnational Incorporated was settled on 30 June 2015. It attracted interest at 10% per annum and the facility was secured by 70 000 000 shares in Ecobank Zimbabwe.16.4 Due to Ever Prosperous World Limited are loans of US$2,9 million and US$2,5 million secured by a cession in Security at African Sun Limited 50% share in Victoria Falls Hotel partnership with Meikles Limited, 760 000 000 Dawn Properties Limited shares and directors’ personal guarantees. The loans were issued to Brainworks and attract interest of 30% per annum with a 31 December 2016 maturity.16.5 The Metbank Limited facility related to short-term funding advanced and attracted interest at 15% per annum.The facility was repaid in January 2014.16.6 Preference shares worth US$1,350,000 were issued on 3 September 2013to Union African Special Investments Limited (UASIL) an investor in FML Oil Company of Zimbabwe (Private) Limited, which is a subsidiary of Brainworks Petroleum (Private) Limited. In December 2014, UASIL exercised their option to exit. Consequently, the preference shares were redeemed.16.7 The Ecobank Ghana facility held by African Sun Limited attracts interest at 12.5%. The loan matures on 31 August 2018 and is secured by a bank guarantee from Ecobank Zimbabwe Limited.
Note Interest
rate Year of maturity 2015
US$ 2014
US$ 2013
US$
African Export-Import Bank Limited 16.1 7.5% 18 May 2016 1,250,490 - - ABC Holdings Limited 16.2 15% 31 December 2021 - - 2,114,726 Ecobank Transnational Incorporated 16.3 10% 30 June 2015 - 4,500,803 4,074,182 Ever Prosperous Worldwide Limited 16.4 30% 31 December 2016 5,424,002 3,000,000 3,888,674 Metbank Limited 16.5 15% 31 January 2014 - - 2,295,654 Preference share debt 16.6 - - - - 1,173,913 Ecobank Ghana Limited 16.7 12.5% 31 August 2018 1,826,448 - - Ecobank Zimbabwe Limited 16.8 8% 31 December 2016 6,825,162 - - FBC Bank Limited 16.9 15% 31 August 2017 2,322,093 2,500,000 -
MBCA Bank Limited 16.10 14% 31 August 2018 1,390,308 - -
NMB Bank Limited 16.11 14% 31 December 2016 684,956 - -
Other Institutions 1,678,314 - -
21,401,773 10,000,803 13,547,149
Note Interest
rate Year of maturity 2015
US$ Separate Brainworks Capital Management (Private) Limited 16.12
2%
7 July 2017
672,627
MyBucks S.A 16.13
10% -30%
4 May 2016
202,255 Carcharias Holdings Limited 16.14
10%
30 June 2016
51,795
926,677
Consolidated
2015 Annual Report
Notes to the consolidated and separate financial statements for the year ended 31 December 2015

74
16.8 The Ecobank Zimbabwe facility held by African Sun Limited of US$0,9 million is unsecured and attracts interest at 13% per annum. The facility matures on 18 June 2018. The facility held by Brainworks Capital Management of US$5,9 million is secured by 100 000 000 African Sun Limited shares. It attracts interest at 8% per annum and matures on 31 December 2015.16.9 The FBC Bank facility held by African Sun Limited is unsecured and attracts interest at 15% per annum. The facility matures on 31 August 2017.16.10 The MBCA Bank facility held by African Sun Limited matures on 31 August 2018. It attracts interest at 14% per annum and is not secured.16.11 The NMB Bank facility held by FML Oil Company of Zimbabwe is secured by 32 200 000 African Sun Limited shares and 45 000 000 Dawn Properties Limited shares. The facility attracts interest at 14% per annum and matures on 31 December 2016.
Separate
16.12 The loan payable to Brainworks Capital Management (Private) Limited is unsecured and payable on demand. It attracts interest at 2% per annum.16.13 The loan payable to MyBucks S.A is unsecured and payable on demand. It attracts interest between 10% - 30% per annum.16.14 The loan payable to Carcharias Holdings Limited is unsecured and payable on demand. It attracts interest at 10% per annum.
17. (a) Trade and other payables
17.1 Other payables
Other payables mainly comprises of payables by African Sun of US$8,3 million and other payables of Brainworks Capital Management (Private) Limited of US$1,1 million. The remaining balance is made up of payables attributable to Dawn Properties Limited, FML Logistics (Private) Limited and GetSure Life Assurance Company (Private) Limited.
17.2 Statutory liabilities
Statutory liabilities comprise of amounts payable by African Sun Limited. The statutory liabilities relate to Pay As You Earn, pension obligations, Value Added Tax and tourism levies. There are payment plans in place to settle these obligations.
Consolidated Separate
2015 US$
2014 US$
2013 US$
2015 US$
2014 US$
Payable to Union African Special Investments Limited - 2,375,000
-
- - Payable to Mudhut (Jersey) Limited and Wallal Superannuation Fund
- 7,358,627
-
- -
Payroll accruals 256,844 34,302
49,236
- - Other payables (note 17.1) 10,440,007 561,182
841,166
30,550 468,358
Statutory liabilities (note 17.2) 7,339,019
-
-
-
-
18,035,870 10,329,111
890,402
30,550 468,358
Consolidated 2013
US$ Movement 2014
US$ Movement 2015
US$
Leave pay - -
-
944,269 944,269 Contractual claims -
-
-
391,813
391,813
Victoria Falls Hotel dismissed employees -
-
-
835,787
835,787 Audit costs for foreign operations - -
-
909,300 909,300
Audit fees 30,000 7,250
37,250
197,051 234,301 Restructuring costs -
-
-
291,000
291,000
Staff bonus -
-
-
180,838
180,838 Legal cost - -
-
60,000 60,000
30,000
7,250
37,250
3,810,058
3,847,308
Provisions mainly comprise of African Sun Limited provisions amounting to US$3.5 million
2015 Annual Report
Notes to the consolidated and separate financial statements for the year ended 31 December 2015

75
17. (b) Provisions
Provisions mainly comprise of African Sun Limited provisions amounting to US$3,5 million. These primarily pertain to provisions for restructuring costs, audit fees, leave pay and costs for dismissed employees.
18. Deferred tax liability
The deferred tax liability is derived from balances held by Dawn Properties Limited ("Dawn Properties") and African Sun Limited ("African Sun") of US$3,8 million and US$3,6 million respectively as at 31 December 2015. These subsidiaries were acquired during 2015 as reflected in note 21. The movement in the deferred tax liability of the two subsidiaries since acquisition resulted in a deferred tax movement of US$2,3 million.
Consolidated Separate
2015 US$
2014 US$
2013 US$
2015 US$
2014 US$
Payable to Union African Special Investments Limited - 2,375,000
-
- - Payable to Mudhut (Jersey) Limited and Wallal Superannuation Fund
- 7,358,627
-
- -
Payroll accruals 256,844 34,302
49,236
- - Other payables (note 17.1) 10,440,007 561,182
841,166
30,550 468,358
Statutory liabilities (note 17.2) 7,339,019
-
-
-
-
18,035,870 10,329,111
890,402
30,550 468,358
Consolidated 2013
US$ Movement 2014
US$ Movement 2015
US$
Leave pay - -
-
944,269 944,269 Contractual claims -
-
-
391,813
391,813
Victoria Falls Hotel dismissed employees -
-
-
835,787
835,787 Audit costs for foreign operations - -
-
909,300 909,300
Audit fees 30,000 7,250
37,250
197,051 234,301 Restructuring costs -
-
-
291,000
291,000
Staff bonus -
-
-
180,838
180,838 Legal cost - -
-
60,000 60,000
30,000
7,250
37,250
3,810,058
3,847,308
Provisions mainly comprise of African Sun Limited provisions amounting to US$3.5 million
Consolidated 2015 US$
The movement on the deferred tax account is shown below: Accelerated depreciation 7,465,010
Fair value gains or losses 1,137,964
Provisions (295,261)
Others (937,227)
7,370,486
Consolidated
2015 US$
2014 US$
Revenue from sale of goods - room nights, food and beverages 33,631,186 -
Revenue from sale of goods - casino/gaming revenue 739,308 -
Revenue from gross premiums 120,756 -
Revenue from oil distribution and logistics 1,845,486 1,502,480
Rental income 1,395,979 -
Revenue from valuation and consultation services 1,550,096 -
Fee Income 20,265 2,794,685
39,303,076 4,297,165
Consolidated
2015 US$
2014 US$
Sale of goods - room nights, food and beverages 9,811,044 - Sale of goods - casino/gaming revenue 85,946 - Gross premiums 23,453 - Oil distribution and logistics 811,635 959,047
10,732,078 959,047
2015 Annual Report
Notes to the consolidated and separate financial statements for the year ended 31 December 2015

19. Revenue
20. Cost of sales
21. Acquisition of controlling interests in African Sun Limited and Dawn Properties Limited
21.1 African Sun Limited ("African Sun") acquisition
A controlling interest was acquired in African Sun on 30 April 2015 resulting in a total voting interest of 56% on acquisition date.
African Sun was acquired through a business combination achieved in stages. The primary reason for the acquisition was to gain a significant foothold in the hospitality industry in Zimbabwe. African Sun controls key assets in most of Zimbabwe’s premier tourist destinations.
The total cash consideration paid for the additional interest acquired that resulted in control was US$3,2 million. The total consideration paid inclusive of the previously held interest was US$14 million. Goodwill of US$8,3 million was recognised on acquisition. This goodwill was impaired in full. The acquisition date fair value of the investment in African Sun was US$10,8 million and this resulted in a loss on remeasurement to fair value of US$1,4 million.
76
Consolidated 2015 US$
The movement on the deferred tax account is shown below: Accelerated depreciation 7,465,010
Fair value gains or losses 1,137,964
Provisions (295,261)
Others (937,227)
7,370,486
Consolidated
2015 US$
2014 US$
Revenue from sale of goods - room nights, food and beverages 33,631,186 -
Revenue from sale of goods - casino/gaming revenue 739,308 -
Revenue from gross premiums 120,756 -
Revenue from oil distribution and logistics 1,845,486 1,502,480
Rental income 1,395,979 -
Revenue from valuation and consultation services 1,550,096 -
Fee Income 20,265 2,794,685
39,303,076 4,297,165
Consolidated
2015 US$
2014 US$
Sale of goods - room nights, food and beverages 9,811,044 - Sale of goods - casino/gaming revenue 85,946 - Gross premiums 23,453 - Oil distribution and logistics 811,635 959,047
10,732,078 959,047
2015 Annual Report
Notes to the consolidated and separate financial statements for the year ended 31 December 2015
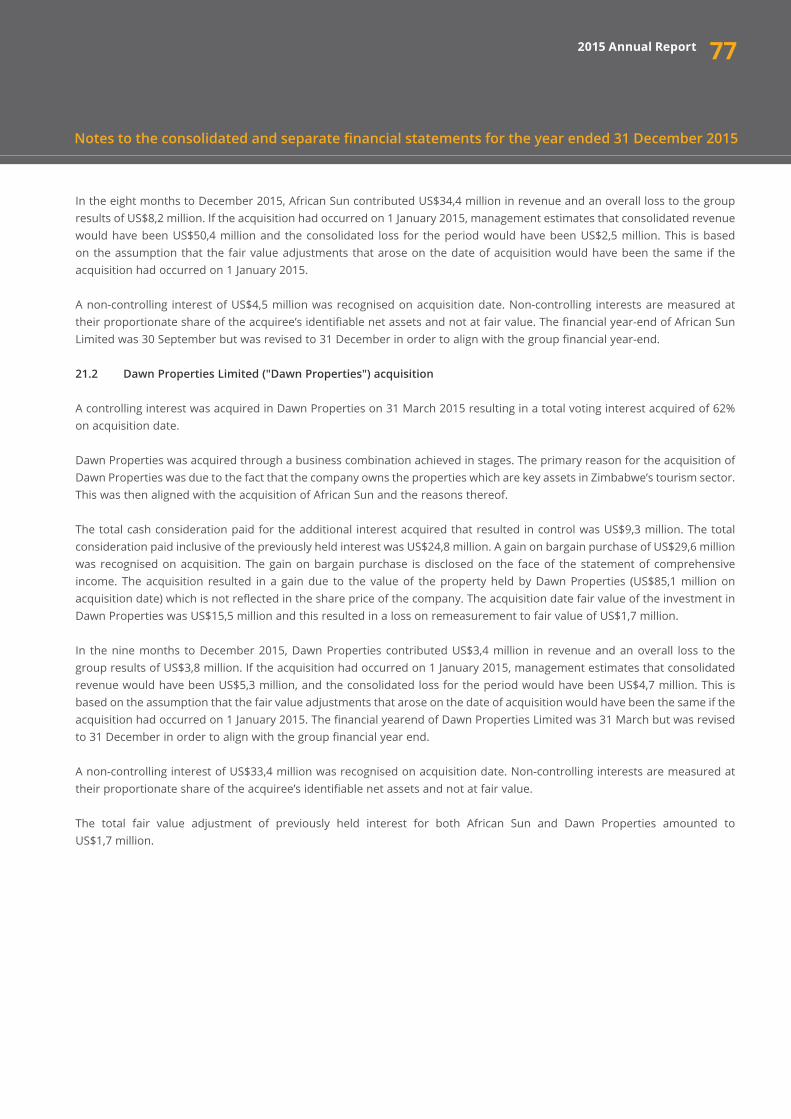
77
In the eight months to December 2015, African Sun contributed US$34,4 million in revenue and an overall loss to the group results of US$8,2 million. If the acquisition had occurred on 1 January 2015, management estimates that consolidated revenue would have been US$50,4 million and the consolidated loss for the period would have been US$2,5 million. This is based on the assumption that the fair value adjustments that arose on the date of acquisition would have been the same if the acquisition had occurred on 1 January 2015.
A non-controlling interest of US$4,5 million was recognised on acquisition date. Non-controlling interests are measured at their proportionate share of the acquiree’s identifiable net assets and not at fair value. The financial year-end of African Sun Limited was 30 September but was revised to 31 December in order to align with the group financial year-end.
21.2 Dawn Properties Limited ("Dawn Properties") acquisition
A controlling interest was acquired in Dawn Properties on 31 March 2015 resulting in a total voting interest acquired of 62% on acquisition date.
Dawn Properties was acquired through a business combination achieved in stages. The primary reason for the acquisition of Dawn Properties was due to the fact that the company owns the properties which are key assets in Zimbabwe’s tourism sector. This was then aligned with the acquisition of African Sun and the reasons thereof.
The total cash consideration paid for the additional interest acquired that resulted in control was US$9,3 million. The total consideration paid inclusive of the previously held interest was US$24,8 million. A gain on bargain purchase of US$29,6 million was recognised on acquisition. The gain on bargain purchase is disclosed on the face of the statement of comprehensive income. The acquisition resulted in a gain due to the value of the property held by Dawn Properties (US$85,1 million on acquisition date) which is not reflected in the share price of the company. The acquisition date fair value of the investment in Dawn Properties was US$15,5 million and this resulted in a loss on remeasurement to fair value of US$1,7 million.
In the nine months to December 2015, Dawn Properties contributed US$3,4 million in revenue and an overall loss to the group results of US$3,8 million. If the acquisition had occurred on 1 January 2015, management estimates that consolidated revenue would have been US$5,3 million, and the consolidated loss for the period would have been US$4,7 million. This is based on the assumption that the fair value adjustments that arose on the date of acquisition would have been the same if the acquisition had occurred on 1 January 2015. The financial yearend of Dawn Properties Limited was 31 March but was revised to 31 December in order to align with the group financial year end.
A non-controlling interest of US$33,4 million was recognised on acquisition date. Non-controlling interests are measured at their proportionate share of the acquiree’s identifiable net assets and not at fair value.
The total fair value adjustment of previously held interest for both African Sun and Dawn Properties amounted to US$1,7 million.
2015 Annual Report
Notes to the consolidated and separate financial statements for the year ended 31 December 2015

21.3 Identifiable assets acquired and liabilities assumed
The following is a summary of the recognised amounts of assets acquired and liabilities assumed at the dates of acquisition for African Sun and Dawn Properties:
21.4 Revaluation of investments
The revaluation with respect to Lengrah Investments (Private) Limited ("Lengrah") pertained to the shares it held in African Sun Limited and Dawn Properties Limited. Lengrah is a wholly owned dormant subsidiary of Brainworks Capital.
78
African Sun US$
Dawn Properties
US$
Property, plant and equipment 26,227,287 1,230,815 Investment property - 85,135,000 Trade and other receivables 6,271,037 1,014,960
Inventory 1,670,547 27,138
Deferred tax assets 1,063,468 -
Cash and cash equivalents 2,853,543 2,241,090
Non-current assets held for sale 4,176,091 -
Loans and borrowings (9,717,355) -
Trade and other payables (17,858,408) (626,566)
Deferred tax liabilities (4,369,265) (1,169,301)
Total identifiable net assets acquired 10,316,945 87,853,136
2015 US$
2014 US$
African Sun Limited 1,427,185 - Dawn Properties Limited 1,676,668 - Lengrah Investments (Private) Limited 1,446,970 -
4,550,823 -
2015 Annual Report
Notes to the consolidated and separate financial statements for the year ended 31 December 2015
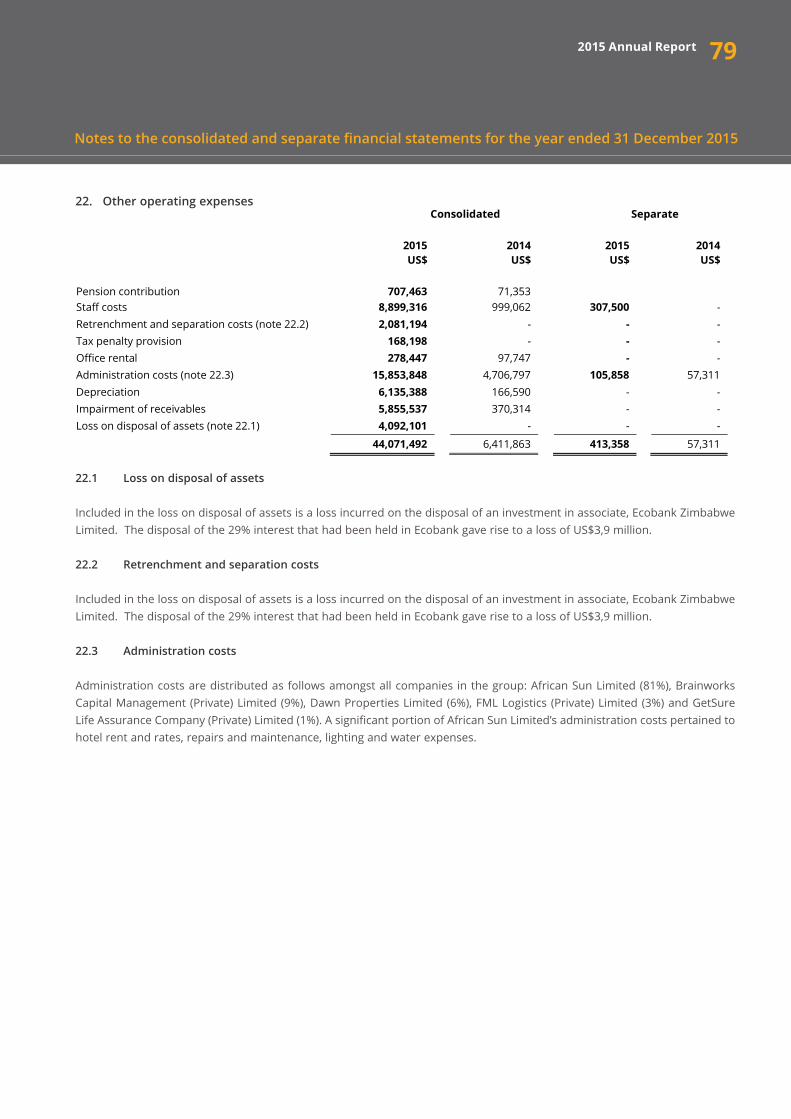
79
22. Other operating expenses
22.1 Loss on disposal of assets
Included in the loss on disposal of assets is a loss incurred on the disposal of an investment in associate, Ecobank Zimbabwe Limited. The disposal of the 29% interest that had been held in Ecobank gave rise to a loss of US$3,9 million.
22.2 Retrenchment and separation costs
Included in the loss on disposal of assets is a loss incurred on the disposal of an investment in associate, Ecobank Zimbabwe Limited. The disposal of the 29% interest that had been held in Ecobank gave rise to a loss of US$3,9 million.
22.3 Administration costs
Administration costs are distributed as follows amongst all companies in the group: African Sun Limited (81%), Brainworks Capital Management (Private) Limited (9%), Dawn Properties Limited (6%), FML Logistics (Private) Limited (3%) and GetSure Life Assurance Company (Private) Limited (1%). A significant portion of African Sun Limited’s administration costs pertained to hotel rent and rates, repairs and maintenance, lighting and water expenses.
Consolidated
Separate
2015 US$
2014 US$
2015 US$
2014 US$
Pension contribution 707,463 71,353 Staff costs 8,899,316 999,062 307,500 - Retrenchment and separation costs (note 22.2) 2,081,194 - - - Tax penalty provision 168,198 - - - Office rental 278,447 97,747 - - Administration costs (note 22.3) 15,853,848 4,706,797 105,858 57,311 Depreciation 6,135,388 166,590 - - Impairment of receivables 5,855,537 370,314 - - Loss on disposal of assets (note 22.1) 4,092,101 - - -
44,071,492 6,411,863 413,358 57,311
Consolidated
Separate
2015 US$
2014 US$
2015 US$
2014 US$
NMB Bank Limited facility 55,124 - - - MBCA Bank Limited facility 151,342 - - - ZB Bank Limited facility 70,184 - - - FBC Bank Limited facility 231,888 - - - African Export-Import Bank Limited facility 123,735 - - - African Century Limited finance lease facility 29,752 - - - ABC Holdings Limited facility - 238,459 Ecobank Transnational Incorporated facility 46,754 426,620 Metbank Limited facility - (117,365) - - Ever Prosperous Worldwide Limited facility 1,494,869 464,449 - - Interest on Ecobank Zimbabwe Limited facility 94,874 305,266 Interest on other payables 94,252 8,405 47,544 - Imputed interest on preference shares - 176,087 - - Interest on statutory obligations 248,577 - - -
2,641,351 1,501,921 47,544 -
2015 Annual Report
Notes to the consolidated and separate financial statements for the year ended 31 December 2015

23. Finance costs
24. Income tax
The Company is subject to income tax in Mauritius under the Income Tax Act 1995 at the rate of 15%. However, it is entitled to a tax credit equivalent to the higher of the actual foreign tax suffered and 80% of the Mauritian tax on its foreign source income. The maximum effective tax rate is thus reduced to 3%. Unrelieved losses carried forward are available to set-off against future income derived in the following 5 income years. The time limit of 5 years shall not apply for the carry forward of any amount of loss that is attributable to annual allowance claimed in respect of capital expenditure.
Consolidated
Separate
2015 US$
2014 US$
2015 US$
2014 US$
Pension contribution 707,463 71,353 Staff costs 8,899,316 999,062 307,500 - Retrenchment and separation costs (note 22.2) 2,081,194 - - - Tax penalty provision 168,198 - - - Office rental 278,447 97,747 - - Administration costs (note 22.3) 15,853,848 4,706,797 105,858 57,311 Depreciation 6,135,388 166,590 - - Impairment of receivables 5,855,537 370,314 - - Loss on disposal of assets (note 22.1) 4,092,101 - - -
44,071,492 6,411,863 413,358 57,311
Consolidated
Separate
2015 US$
2014 US$
2015 US$
2014 US$
NMB Bank Limited facility 55,124 - - - MBCA Bank Limited facility 151,342 - - - ZB Bank Limited facility 70,184 - - - FBC Bank Limited facility 231,888 - - - African Export-Import Bank Limited facility 123,735 - - - African Century Limited finance lease facility 29,752 - - - ABC Holdings Limited facility - 238,459 Ecobank Transnational Incorporated facility 46,754 426,620 Metbank Limited facility - (117,365) - - Ever Prosperous Worldwide Limited facility 1,494,869 464,449 - - Interest on Ecobank Zimbabwe Limited facility 94,874 305,266 Interest on other payables 94,252 8,405 47,544 - Imputed interest on preference shares - 176,087 - - Interest on statutory obligations 248,577 - - -
2,641,351 1,501,921 47,544 -
80
Consolidated
Separate
2015
US$ 2014 US$
2015 US$
2014 US$
Current year expense Current year charge 1,019,903 24,417 19,929 24,417 Under provisions of prior year tax 17,618 - 17,618 - Capital gain tax expense - 73,385 - - Withholding tax 509,536 - 509,536 - Deferred tax 2,228,269 558,985 - -
3,775,326 656 787 547,083 24,417
2015 US$
2014 US$
2015 US$
2014 US$
Profit / (loss) before taxation 10,890,834 (2,400,548) 7,083,472 831,949
Tax at applicable rates 2,042,916 (707,576) 1,062,521 124,792
Other deductible items (1,058,571) 1,272,535 (320,812) (2,709) Deferred tax asset not recognised 2,056,799 189,494 - Settlement of prior year tax dispute 928,808 - - Foreign tax credit (194,626) (97,666) (194,626) (97,666) 3,775,326 656,787 547,083 24,417
2015 Annual Report
Notes to the consolidated and separate financial statements for the year ended 31 December 2015
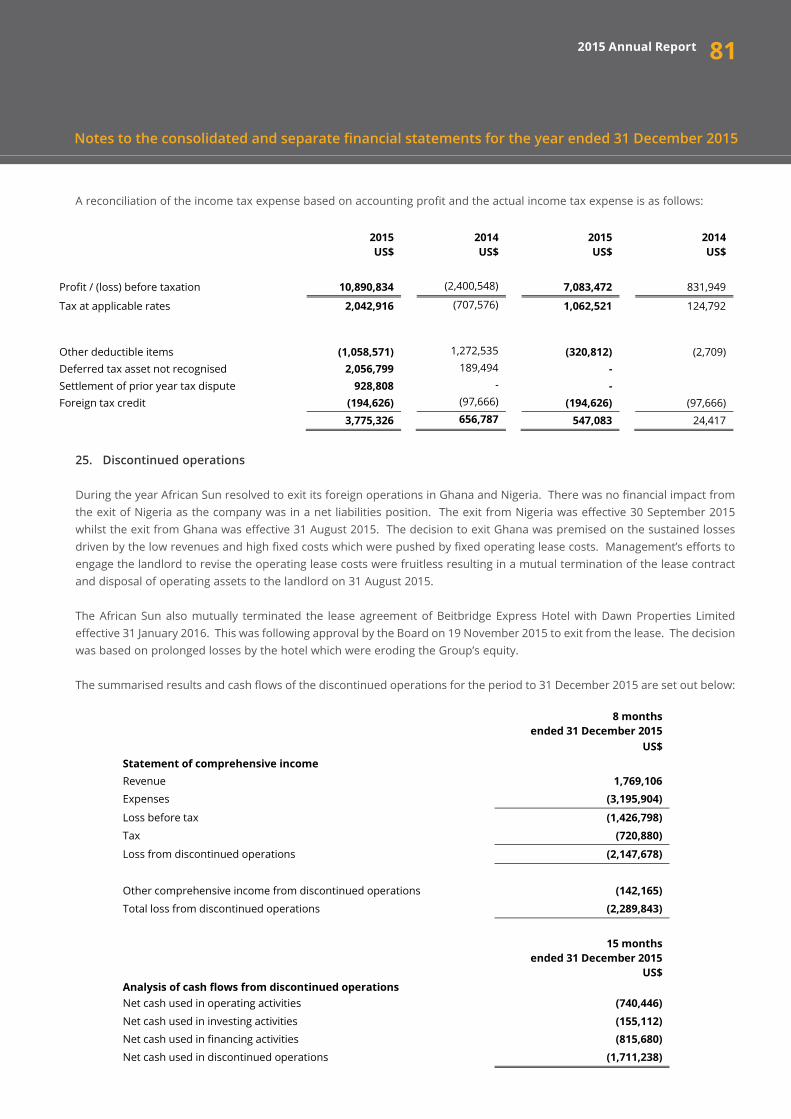
81
A reconciliation of the income tax expense based on accounting profit and the actual income tax expense is as follows:
25. Discontinued operations
During the year African Sun resolved to exit its foreign operations in Ghana and Nigeria. There was no financial impact from the exit of Nigeria as the company was in a net liabilities position. The exit from Nigeria was effective 30 September 2015 whilst the exit from Ghana was effective 31 August 2015. The decision to exit Ghana was premised on the sustained losses driven by the low revenues and high fixed costs which were pushed by fixed operating lease costs. Management’s efforts to engage the landlord to revise the operating lease costs were fruitless resulting in a mutual termination of the lease contract and disposal of operating assets to the landlord on 31 August 2015.
The African Sun also mutually terminated the lease agreement of Beitbridge Express Hotel with Dawn Properties Limited effective 31 January 2016. This was following approval by the Board on 19 November 2015 to exit from the lease. The decision was based on prolonged losses by the hotel which were eroding the Group’s equity.
The summarised results and cash flows of the discontinued operations for the period to 31 December 2015 are set out below:
Consolidated
Separate
2015
US$ 2014 US$
2015 US$
2014 US$
Current year expense Current year charge 1,019,903 24,417 19,929 24,417 Under provisions of prior year tax 17,618 - 17,618 - Capital gain tax expense - 73,385 - - Withholding tax 509,536 - 509,536 - Deferred tax 2,228,269 558,985 - -
3,775,326 656 787 547,083 24,417
2015 US$
2014 US$
2015 US$
2014 US$
Profit / (loss) before taxation 10,890,834 (2,400,548) 7,083,472 831,949
Tax at applicable rates 2,042,916 (707,576) 1,062,521 124,792
Other deductible items (1,058,571) 1,272,535 (320,812) (2,709) Deferred tax asset not recognised 2,056,799 189,494 - Settlement of prior year tax dispute 928,808 - - Foreign tax credit (194,626) (97,666) (194,626) (97,666) 3,775,326 656,787 547,083 24,417
8 months ended 31 December 2015
US$
Statement of comprehensive income Revenue 1,769,106 Expenses (3,195,904)
Loss before tax (1,426,798) Tax (720,880)
Loss from discontinued operations (2,147,678)
Other comprehensive income from discontinued operations (142,165) Total loss from discontinued operations (2,289,843)
15 months ended 31 December 2015
US$ Analysis of cash flows from discontinued operations Net cash used in operating activities (740,446) Net cash used in investing activities (155,112) Net cash used in financing activities (815,680) Net cash used in discontinued operations (1,711,238)
2015 Annual Report
Notes to the consolidated and separate financial statements for the year ended 31 December 2015

82
26. Financial risk management
26.1 Liquidity risk
DefinitionLiquidity risk arises in the general funding of the Group's activities and in the management of positions. It includes the risk of being unable to fund assets at appropriate maturities and the risk of being unable to liquidate an asset at a reasonable price and in an appropriate time frame.
Identification techniquesThis risk is identified through gap and maturity analysis.
Measurement methodsLiquidity risk is measured using the gap analysis techniques and the term structure of assets and liabilities.
Monitoring and controlling mechanismsThe funding gap is monitored through a number of management reports, including maturity profiles. The Group continually assesses risk by identifying and monitoring changes in funding required to meet business objectives and targets set in terms of the overall Group strategy.
Adequacy and effectiveness of risk management systemsThe liquidity risk management and control mechanisms in place are adequate, effective and are adhered to by all staff members.
Consolidated
Liquidity gap analysis
Up to 1 month
US$
2 to 6 months
US$
7 to 12 months
US$
Above 12 months
US$ Total
US$ As at 31 December 2015
Liabilities
Borrowings - 1,250,490 12,886,687 7,264,596 21,401,773
- 1,250,490 12,886,687 7,264,596 21,401,773
Up to 1 month
US$
2 to 6 months
US$
7 to 12 months
US$
Above 12 months
US$ Total
US$ As at 31 December 2014
Liabilities
Borrowings - 10,000,803 - - 10,000,803
- 10,000,803 - - 10,000,803
Up to 1
month US$
2 to 6 months
US$
7 to 12 months
US$
Above 12 months
US$ Total
US$ As at 31 December 2013
Liabilities
Borrowings - - 7,358,241 6,188,908 13,547,149
- - 7,358,241 6,188,908 13,547,149
Separate Liquidity gap analysis
Up to 1 month
US$
2 to 6 months
US$
7 to 12 months
US$
Above 12 months
US$ Total
US$ As at 31 December 2015
Liabilities
Borrowings - - - 926,677 926,677 - - - 926,677 926,677 Up to 1
month US$
2 to 6 months
US$
7 to 12 months
US$
Above 12 months
US$ Total
US$ As at 31 December 2014
Liabilities
Borrowings - - - - -
- - - - -
2015 Annual Report
Notes to the consolidated and separate financial statements for the year ended 31 December 2015

83
26.1 Liquidity risk (continued)
26.2 Market risk
Market risk arises from adverse movements in the market place which cause interest rate, foreign exchange rate and equity price fluctuations in the markets that the Group operates.
Interest rate risk
DefinitionThe Group's operations are subject to the risk of interest rate fluctuations to the extent that interest-earning assets and interest bearing liabilities mature or reprice at different times or in differing amounts.
Identification techniquesInterest risk is identified using the term structure of assets and liabilities.
Measurement methodsRate sensitive assets and liabilities are analysed and a maturity profile exhibited.
Impact evaluationThe Group has evaluated this risk as low. At present it does not have any variable rate assets or liabilities.
Strategies for management/mitigationThe Board of Directors reviews the gap analyses and appropriate action is taken to keep risk within set limits.
Consolidated
Liquidity gap analysis
Up to 1 month
US$
2 to 6 months
US$
7 to 12 months
US$
Above 12 months
US$ Total
US$ As at 31 December 2015
Liabilities
Borrowings - 1,250,490 12,886,687 7,264,596 21,401,773
- 1,250,490 12,886,687 7,264,596 21,401,773
Up to 1 month
US$
2 to 6 months
US$
7 to 12 months
US$
Above 12 months
US$ Total
US$ As at 31 December 2014
Liabilities
Borrowings - 10,000,803 - - 10,000,803
- 10,000,803 - - 10,000,803
Up to 1
month US$
2 to 6 months
US$
7 to 12 months
US$
Above 12 months
US$ Total
US$ As at 31 December 2013
Liabilities
Borrowings - - 7,358,241 6,188,908 13,547,149
- - 7,358,241 6,188,908 13,547,149
Separate Liquidity gap analysis
Up to 1 month
US$
2 to 6 months
US$
7 to 12 months
US$
Above 12 months
US$ Total
US$ As at 31 December 2015
Liabilities
Borrowings - - - 926,677 926,677 - - - 926,677 926,677 Up to 1
month US$
2 to 6 months
US$
7 to 12 months
US$
Above 12 months
US$ Total
US$ As at 31 December 2014
Liabilities
Borrowings - - - - -
- - - - -
2015 Annual Report
Notes to the consolidated and separate financial statements for the year ended 31 December 2015

84
Interest rate sensitivity analysis
ConsolidatedA 5% increase in the average borrowing rates of the Group for the year ended 31 December 2015 would have resulted in a decrease/increase in the Group’s recorded profit of US$161,412.
SeparateA 5% increase in the average borrowing rates of the Company for the year ended 31 December 2015 would have resulted in a decrease/increase in the Company’s recorded profit of US$23,167.
26.3 Foreign exchange risk
DefinitionForeign exchange risk is the risk that arises from adverse changes in foreign exchange rates and emanates from a mismatch between foreign currency inflows and outflows.
Identification and measurement techniquesThe risk is identified through the analysis of the Group's open foreign exchange positions.
Impact evaluationThe Group has evaluated this risk as low in view of the fact that the foreign operations that increased the Group’s foreign exchange risk have been discontinued. Consequently, the foreign exchange risk sensitivity has not been disclosed.
Strategies for management/mitigationThe risk is managed through market analysis techniques.
Monitoring and controlling mechanismsThe risk is controlled through the use of limits set by the board on the overall foreign exchange position.
Adequacy and effectiveness of risk management systemManagement is confident that the foreign exchange risk management systems in place are adequate, effective and are complied with in all material respects by all staff members.
2015 Annual Report
Notes to the consolidated and separate financial statements for the year ended 31 December 2015
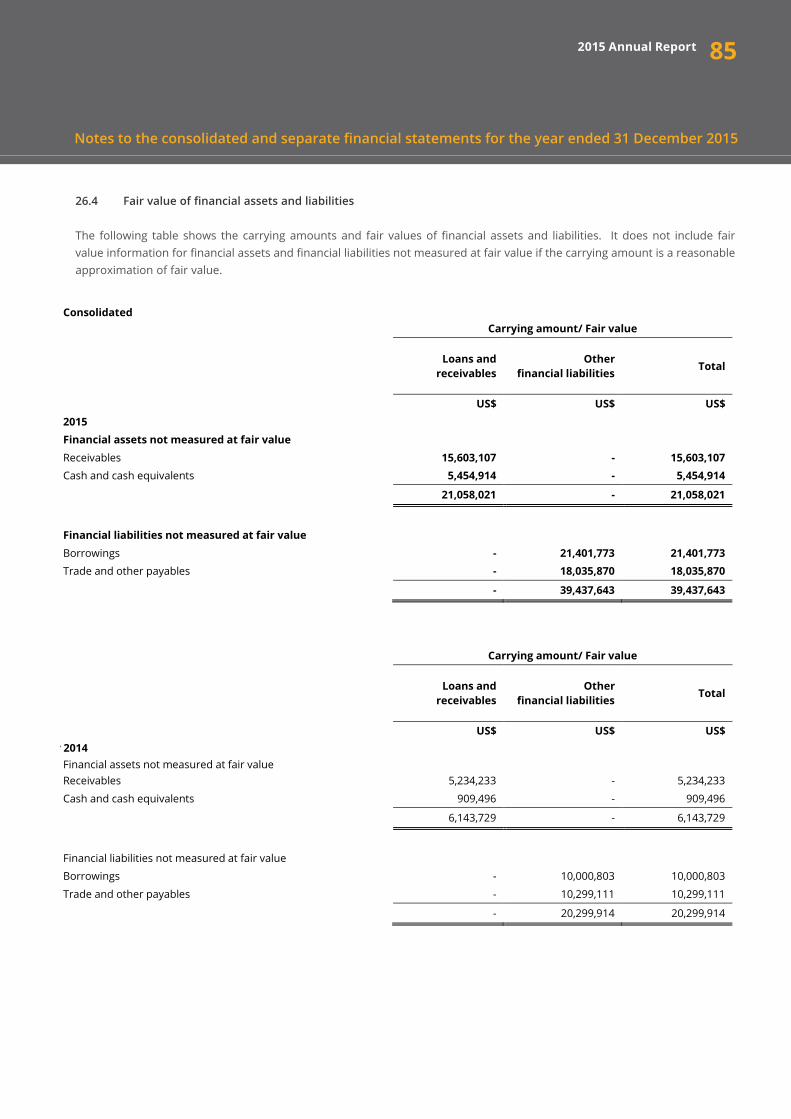
26.4 Fair value of financial assets and liabilities
The following table shows the carrying amounts and fair values of financial assets and liabilities. It does not include fair value information for financial assets and financial liabilities not measured at fair value if the carrying amount is a reasonable approximation of fair value.
852015 Annual Report
Notes to the consolidated and separate financial statements for the year ended 31 December 2015
Consolidated
Carrying amount/ Fair value
Loans and receivables
Other financial liabilities Total
US$ US$ US$
2015 Financial assets not measured at fair value
Receivables 15,603,107 - 15,603,107 Cash and cash equivalents
5,454,914 - 5,454,914
21,058,021 - 21,058,021
Financial liabilities not measured at fair value
Borrowings - 21,401,773 21,401,773 Trade and other payables
- 18,035,870 18,035,870
- 39,437,643 39,437,643
Carrying amount/ Fair value
Loans and
receivables Other
financial liabilities Total
US$ US$ US$
2014
Financial assets not measured at fair value
Receivables
5,234,233 - 5,234,233
Cash and cash equivalents
909,496 - 909,496
6,143,729 - 6,143,729
Financial liabilities not measured at fair value
Borrowings
- 10,000,803 10,000,803
Trade and other payables
- 10,299,111 10,299,111
- 20,299,914 20,299,914
Consolidated
Liquidity gap analysis
Up to 1 month
US$
2 to 6 months
US$
7 to 12 months
US$
Above 12 months
US$ Total
US$ As at 31 December 2015
Liabilities
Borrowings - 1,250,490 12,886,687 7,264,596 21,401,773
- 1,250,490 12,886,687 7,264,596 21,401,773
Up to 1 month
US$
2 to 6 months
US$
7 to 12 months
US$
Above 12 months
US$ Total
US$ As at 31 December 2014
Liabilities
Borrowings - 10,000,803 - - 10,000,803
- 10,000,803 - - 10,000,803
Up to 1
month US$
2 to 6 months
US$
7 to 12 months
US$
Above 12 months
US$ Total
US$ As at 31 December 2013
Liabilities
Borrowings - - 7,358,241 6,188,908 13,547,149
- - 7,358,241 6,188,908 13,547,149
Separate Liquidity gap analysis
Up to 1 month
US$
2 to 6 months
US$
7 to 12 months
US$
Above 12 months
US$ Total
US$ As at 31 December 2015
Liabilities
Borrowings - - - 926,677 926,677 - - - 926,677 926,677 Up to 1
month US$
2 to 6 months
US$
7 to 12 months
US$
Above 12 months
US$ Total
US$ As at 31 December 2014
Liabilities
Borrowings - - - - -
- - - - -
Consolidated
Carrying amount/ Fair value
Loans and receivables
Other financial liabilities Total
US$ US$ US$
2015 Financial assets not measured at fair value
Receivables 15,603,107 - 15,603,107 Cash and cash equivalents
5,454,914 - 5,454,914
21,058,021 - 21,058,021
Financial liabilities not measured at fair value
Borrowings - 21,401,773 21,401,773 Trade and other payables
- 18,035,870 18,035,870
- 39,437,643 39,437,643
Carrying amount/ Fair value
Loans and
receivables Other
financial liabilities Total
US$ US$ US$
2014
Financial assets not measured at fair value
Receivables
5,234,233 - 5,234,233
Cash and cash equivalents
909,496 - 909,496
6,143,729 - 6,143,729
Financial liabilities not measured at fair value
Borrowings
- 10,000,803 10,000,803
Trade and other payables
- 10,299,111 10,299,111
- 20,299,914 20,299,914
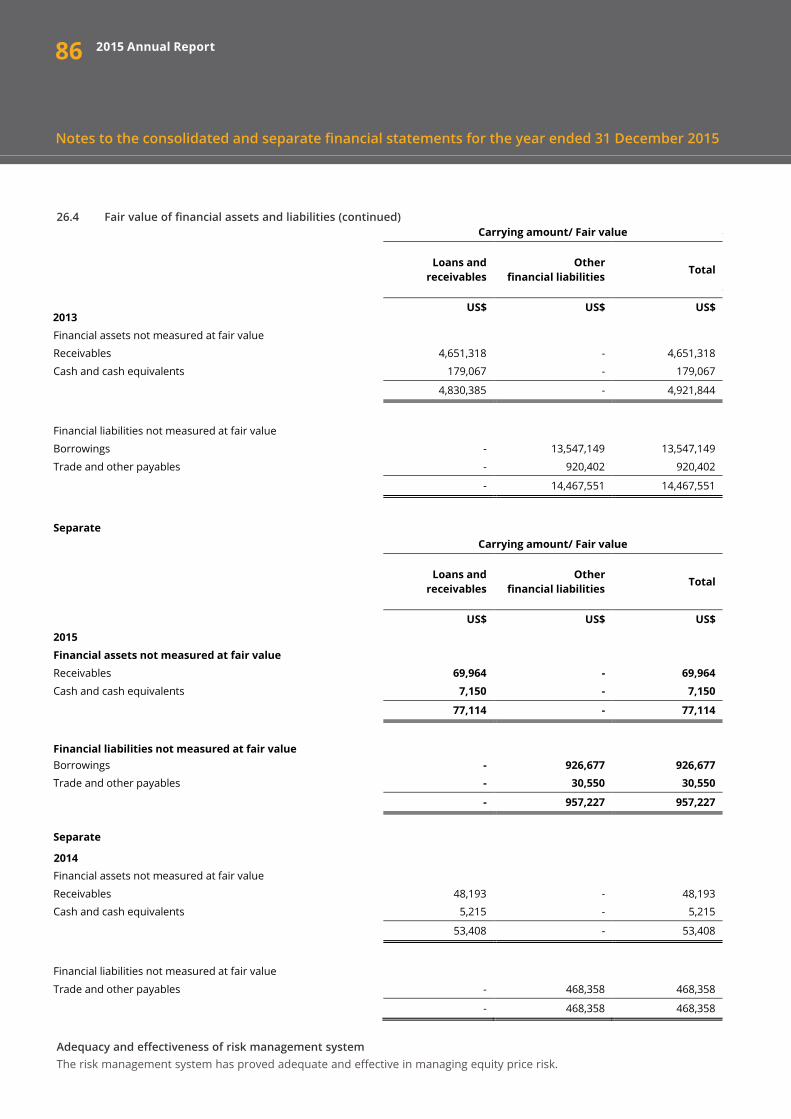
86 2015 Annual Report
Notes to the consolidated and separate financial statements for the year ended 31 December 2015
26.4 Fair value of financial assets and liabilities (continued)
Adequacy and effectiveness of risk management systemThe risk management system has proved adequate and effective in managing equity price risk.
Carrying amount/ Fair value
Loans and
receivables Other
financial liabilities Total
US$ US$ US$
2013
Financial assets not measured at fair value
Receivables
4,651,318 - 4,651,318
Cash and cash equivalents
179,067 - 179,067
4,830,385 - 4,921,844
Financial liabilities not measured at fair value
Borrowings
- 13,547,149 13,547,149
Trade and other payables
- 920,402 920,402
- 14,467,551 14,467,551
Separate
Carrying amount/ Fair value
Loans and
receivables Other
financial liabilities Total
US$ US$ US$
2015
Financial assets not measured at fair value Receivables
69,964 - 69,964
Cash and cash equivalents 7,150 - 7,150
77,114 - 77,114
Financial liabilities not measured at fair value Borrowings - 926,677 926,677 Trade and other payables
- 30,550 30,550
- 957,227 957,227
Separate
2014
Financial assets not measured at fair value
Receivables
48,193 - 48,193
Cash and cash equivalents
5,215 - 5,215
53,408 - 53,408
Financial liabilities not measured at fair value
Trade and other payables
- 468,358 468,358
- 468,358 468,358
Carrying amount/ Fair value
Loans and
receivables Other
financial liabilities Total
US$ US$ US$
2013
Financial assets not measured at fair value
Receivables
4,651,318 - 4,651,318
Cash and cash equivalents
179,067 - 179,067
4,830,385 - 4,921,844
Financial liabilities not measured at fair value
Borrowings
- 13,547,149 13,547,149
Trade and other payables
- 920,402 920,402
- 14,467,551 14,467,551
Separate
Carrying amount/ Fair value
Loans and
receivables Other
financial liabilities Total
US$ US$ US$
2015
Financial assets not measured at fair value Receivables
69,964 - 69,964
Cash and cash equivalents 7,150 - 7,150
77,114 - 77,114
Financial liabilities not measured at fair value Borrowings - 926,677 926,677 Trade and other payables
- 30,550 30,550
- 957,227 957,227
Separate
2014
Financial assets not measured at fair value
Receivables
48,193 - 48,193
Cash and cash equivalents
5,215 - 5,215
53,408 - 53,408
Financial liabilities not measured at fair value
Trade and other payables
- 468,358 468,358
- 468,358 468,358
Consolidated
Liquidity gap analysis
Up to 1 month
US$
2 to 6 months
US$
7 to 12 months
US$
Above 12 months
US$ Total
US$ As at 31 December 2015
Liabilities
Borrowings - 1,250,490 12,886,687 7,264,596 21,401,773
- 1,250,490 12,886,687 7,264,596 21,401,773
Up to 1 month
US$
2 to 6 months
US$
7 to 12 months
US$
Above 12 months
US$ Total
US$ As at 31 December 2014
Liabilities
Borrowings - 10,000,803 - - 10,000,803
- 10,000,803 - - 10,000,803
Up to 1
month US$
2 to 6 months
US$
7 to 12 months
US$
Above 12 months
US$ Total
US$ As at 31 December 2013
Liabilities
Borrowings - - 7,358,241 6,188,908 13,547,149
- - 7,358,241 6,188,908 13,547,149
Separate Liquidity gap analysis
Up to 1 month
US$
2 to 6 months
US$
7 to 12 months
US$
Above 12 months
US$ Total
US$ As at 31 December 2015
Liabilities
Borrowings - - - 926,677 926,677 - - - 926,677 926,677 Up to 1
month US$
2 to 6 months
US$
7 to 12 months
US$
Above 12 months
US$ Total
US$ As at 31 December 2014
Liabilities
Borrowings - - - - -
- - - - -
Consolidated
Liquidity gap analysis
Up to 1 month
US$
2 to 6 months
US$
7 to 12 months
US$
Above 12 months
US$ Total
US$ As at 31 December 2015
Liabilities
Borrowings - 1,250,490 12,886,687 7,264,596 21,401,773
- 1,250,490 12,886,687 7,264,596 21,401,773
Up to 1 month
US$
2 to 6 months
US$
7 to 12 months
US$
Above 12 months
US$ Total
US$ As at 31 December 2014
Liabilities
Borrowings - 10,000,803 - - 10,000,803
- 10,000,803 - - 10,000,803
Up to 1
month US$
2 to 6 months
US$
7 to 12 months
US$
Above 12 months
US$ Total
US$ As at 31 December 2013
Liabilities
Borrowings - - 7,358,241 6,188,908 13,547,149
- - 7,358,241 6,188,908 13,547,149
Separate Liquidity gap analysis
Up to 1 month
US$
2 to 6 months
US$
7 to 12 months
US$
Above 12 months
US$ Total
US$ As at 31 December 2015
Liabilities
Borrowings - - - 926,677 926,677 - - - 926,677 926,677 Up to 1
month US$
2 to 6 months
US$
7 to 12 months
US$
Above 12 months
US$ Total
US$ As at 31 December 2014
Liabilities
Borrowings - - - - -
- - - - -
Carrying amount/ Fair value
Loans and
receivables Other
financial liabilities Total
US$ US$ US$
2013
Financial assets not measured at fair value
Receivables
4,651,318 - 4,651,318
Cash and cash equivalents
179,067 - 179,067
4,830,385 - 4,921,844
Financial liabilities not measured at fair value
Borrowings
- 13,547,149 13,547,149
Trade and other payables
- 920,402 920,402
- 14,467,551 14,467,551
Separate
Carrying amount/ Fair value
Loans and
receivables Other
financial liabilities Total
US$ US$ US$
2015
Financial assets not measured at fair value Receivables
69,964 - 69,964
Cash and cash equivalents 7,150 - 7,150
77,114 - 77,114
Financial liabilities not measured at fair value Borrowings - 926,677 926,677 Trade and other payables
- 30,550 30,550
- 957,227 957,227
Separate
2014
Financial assets not measured at fair value
Receivables
48,193 - 48,193
Cash and cash equivalents
5,215 - 5,215
53,408 - 53,408
Financial liabilities not measured at fair value
Trade and other payables
- 468,358 468,358
- 468,358 468,358
Carrying amount/ Fair value
Loans and
receivables Other
financial liabilities Total
US$ US$ US$
2013
Financial assets not measured at fair value
Receivables
4,651,318 - 4,651,318
Cash and cash equivalents
179,067 - 179,067
4,830,385 - 4,921,844
Financial liabilities not measured at fair value
Borrowings
- 13,547,149 13,547,149
Trade and other payables
- 920,402 920,402
- 14,467,551 14,467,551
Separate
Carrying amount/ Fair value
Loans and
receivables Other
financial liabilities Total
US$ US$ US$
2015
Financial assets not measured at fair value Receivables
69,964 - 69,964
Cash and cash equivalents 7,150 - 7,150
77,114 - 77,114
Financial liabilities not measured at fair value Borrowings - 926,677 926,677 Trade and other payables
- 30,550 30,550
- 957,227 957,227
Separate
2014
Financial assets not measured at fair value
Receivables
48,193 - 48,193
Cash and cash equivalents
5,215 - 5,215
53,408 - 53,408
Financial liabilities not measured at fair value
Trade and other payables
- 468,358 468,358
- 468,358 468,358

87
26.5 Credit risk
DefinitionCredit risk is the risk that a counter party will not honour its obligations to the Group as and when they become due.
Identification techniquesThe Group assesses prospective customers or investees prior to granting credit facilities to them.
Measurement methodsThe risk is measured through assessing the risk of default through investigations of the counterparty’s credit worthiness.
Impact evaluationCredit risk is rated low in the Group as the systems for identification measurement and controlling the risk are effective.
Strategies for management/mitigationThe Group has a credit risk management process which operates through authorisation limits.
Exposure to credit riskThe carrying amounts of the financial assets represent the maximum credit exposure. The maximum exposure at reporting date was as follows:
Consolidated
Separate
31 December 2015
Carrying Value
US$ Fair Value
US$ Carrying Value
US$ Fair Value
US$
Financial assets held through profit or loss 3,500,000 3,500,000 3,500,000 3,500,000 Receivables
16,421,204 16,421,204 69,964 69,964 Cash and cash equivalents
5,454,914 5,454,914 7,150 7,150
25,376,118 25,376,118 3,577,114 3,577,114
Consolidated
Separate
31 December 2014
Carrying Value
US$
Fair Value US$
Carrying
Value US$
Fair Value US$
Financial assets held through profit or loss 1,250,113 1,250,113 1,250,113 1,250,113
Receivables
5,243,633 5,243,633 48,193 48,193
Cash and cash equivalents
909,496 909,496 5,215 5,215
7,403,242 7,403,242 1,303,521 1,303,521
Consolidated
31 December 2013
Carrying Value
Fair Value US$
US$
Financial assets held through profit or loss 7,243,986 7,243,986
Receivables
4,742,777 4,742,777
Cash and cash equivalents
179,067 179,067
12,165,830 12,165,830
2015 Annual Report
Notes to the consolidated and separate financial statements for the year ended 31 December 2015

88
26.5 Credit risk (continued)
As at 31 December 2015, trade receivables of US$2,634,575 (2014: nil) were past due but not impaired. These relate to a number of independent customers from whom there is no recent history of default. The Group extends credit to reputable tour operators with whom the Group has transacted with for years.
The ageing analysis of these trade receivables is as follows:
26.6 Capital management risk
The Group's objectives when managing capital are to safeguard the Group's ability to continue as a going concern in order to provide returns for shareholders and benefits for other stakeholders and to maintain an optimal capital structure to reduce the cost of capital. In order to maintain or adjust the capital structure, the Group may adjust the amount of dividends paid to shareholders, return capital to shareholders, issue new shares or sell assets to reduce debt.
The Group monitors capital using a ratio of adjusted net debt to adjusted equity. For this purpose, adjusted net debt is defined as total liabilities, comprising interest-bearing loans and borrowings less cash and cash equivalents. Equity comprises all components of equity. The Group’s policy is to keep the ratio below 1.00. The Group’s adjusted net debt to equity ratio at 31 December was as follows:
Consolidated
Carrying Value
US$
Fair Value US$
Financial assets held through profit or loss 7,243,986 7,243,986
Receivables
4,742,777 4,742,777
Cash and cash equivalents
179,067 179,067
12,165,830 12,165,830
Consolidated
2015 US$
2014 US$
2013 US$
Neither past due nor impaired 1,003,941 - - Up to 30 days 509,629 - - 30 to 60 days 287,394 - - Over 60 days 833,611 - -
2,634,575 - -
Consolidated
2015 US$
2014 US$
2013 US$
Total borrowings 21,401,773 10,000,803 13,547,149 Less: cash and cash equivalents (5,454,914) (909,496) (179,067)
Net debt 15,946,859 9,091,307 13,368,082
Total equity 94,213,630 31,388,906 35,419,508
Net debt to adjusted equity ratio 0.16 0.28 0.37 27. Capital commitments Consolidated
2015 US$
2014 US$
Authorised and contracted for 2,356,571 2,000,000
Authorised and not contracted for 14,565,782 2,500,000
16,922,353 4,500,000
Consolidated
Carrying Value
US$
Fair Value US$
Financial assets held through profit or loss 7,243,986 7,243,986
Receivables
4,742,777 4,742,777
Cash and cash equivalents
179,067 179,067
12,165,830 12,165,830
Consolidated
2015 US$
2014 US$
2013 US$
Neither past due nor impaired 1,003,941 - - Up to 30 days 509,629 - - 30 to 60 days 287,394 - - Over 60 days 833,611 - -
2,634,575 - -
Consolidated
2015 US$
2014 US$
2013 US$
Total borrowings 21,401,773 10,000,803 13,547,149 Less: cash and cash equivalents (5,454,914) (909,496) (179,067)
Net debt 15,946,859 9,091,307 13,368,082
Total equity 94,213,630 31,388,906 35,419,508
Net debt to adjusted equity ratio 0.16 0.28 0.37 27. Capital commitments Consolidated
2015 US$
2014 US$
Authorised and contracted for 2,356,571 2,000,000
Authorised and not contracted for 14,565,782 2,500,000
16,922,353 4,500,000
2015 Annual Report
Notes to the consolidated and separate financial statements for the year ended 31 December 2015

27. Capital commitments
US$12 million was authorised by the Directors of African Sun Limited but not contracted for towards the acquisition of property and equipment in line with the refurbishment exercise being undertaken. The balance pertains to property under construction by Dawn Properties Limited.
28. Related party transactions
28.1 Key management personnel compensation
Key management personnel compensation comprised the following:
Compensation of the key management personnel includes salaries, allowances and contributions to a defined contribution plan.
89
Consolidated
Carrying Value
US$
Fair Value US$
Financial assets held through profit or loss 7,243,986 7,243,986
Receivables
4,742,777 4,742,777
Cash and cash equivalents
179,067 179,067
12,165,830 12,165,830
Consolidated
2015 US$
2014 US$
2013 US$
Neither past due nor impaired 1,003,941 - - Up to 30 days 509,629 - - 30 to 60 days 287,394 - - Over 60 days 833,611 - -
2,634,575 - -
Consolidated
2015 US$
2014 US$
2013 US$
Total borrowings 21,401,773 10,000,803 13,547,149 Less: cash and cash equivalents (5,454,914) (909,496) (179,067)
Net debt 15,946,859 9,091,307 13,368,082
Total equity 94,213,630 31,388,906 35,419,508
Net debt to adjusted equity ratio 0.16 0.28 0.37 27. Capital commitments Consolidated
2015 US$
2014 US$
Authorised and contracted for 2,356,571 2,000,000
Authorised and not contracted for 14,565,782 2,500,000
16,922,353 4,500,000
Consolidated Separate
2015
US$ 2014
US$ 2015
US$ 2014
US$
Short-term employee benefits 428,000 347,500 37,000 - Post-employment pension 39,352 41,622 - -
467,352 389,122 37,000 -
Consolidated
2015 US$
2014 US$ Related party transactions for the year
Nature of relationship
Nature of Transactions
Brainworks Capital Management (Private) Limited Subsidiary Dividend income 4,740,759 - GetBucks Financial Services Limited Associate Finance cost 32,205 -
GetBucks Financial Services Limited Associate Interest income - 183,507 ABC Holdings Limited Indirect shareholder Finance cost - 238,459 Ecobank Transnational Incorporated Parent of associate Finance cost 46,754 426,620 Ecobank Zimbabwe Limited Associate Finance cost 94,874 305,266
Balance at year end
Meikles Limited Joint control Receivables 242,221 -
Brainworks Capital Private Equity Managers (Private) Limited Management Receivables 298,407 - African Development Corporation Shareholder Receivables - 2,400,000
GetBucks Financial Services Limited Associate Receivables - 2,017,963 GetBucks Financial Services Limited Associate Other liabilities 961,432 - Staff loans Management Receivables 1,760,362 -
Ecobank Transnational Incorporated Parent of associate Borrowings - 4,500,803 Ecobank Zimbabwe Limited Associate Borrowings 6,825,162 2,500,000
Related party transactions for the year Nature of
relationship Nature of
Transactions 2015 US$
2014 US$
Brainworks Capital Management (Private) Limited Subsidiary Finance cost 47,544 -
Balance at year end: Brainworks Capital Management (Private) Limited Subsidiary Borrowings 672,627 -
MyBucks S.A Parent of associate Investment 3,500,000 1,250,113
Restated
Previously disclosed
Movement
2014 US$
2013 US$
2014 US$
2013 US$
2014 US$
2013 US$
Share capital
86,307 86,307 53,192 45,692 33,115 40,615 Share premium
86,219,889 86,219,889 33,095,500 25,603,000 53,124,389 60,616,889
Merger reserve
(53,109,311) (60,609,311) - - (53,109,311) (60,609,311)
2015 Annual Report
Notes to the consolidated and separate financial statements for the year ended 31 December 2015

90
28.2 Other related party transactions
The details of other related party transactions were as follows:
Nature of relationships with related parties:
• African Development Corporation – in 2014 held a 16.39% shareholding in Brainworks Capital Management (Private) Limited.
• GetBucks Financial Services Limited - associate of Brainworks Capital Management (Private) Limited as a result of a 34% shareholding in the company.
• Ecobank Transnational Incorporated - holds a 70% interest in Ecobank Zimbabwe Limited. Brainworks Capital Management (Private) Limited held a 29.4% interest in the company prior to its disposal on 30 June 2015.
• Brainworks Limited – holding company of Brainworks Capital Management (Private) Limited through a shareholding of 100%.
• Meikles Limited – African Sun has 50% joint control with Meikles Limited in the Victoria Falls Hotel partnership.• Brainworks Capital Private Equity Managers (Private) Limited – wholly owned by the management and staff of
Brainworks Capital Management (Private) Limited.
The terms and conditions of the payables due to related parties are as follows:
• GetBucks Financial Services Limited - is payable by 30 June 2016 and attracts interest at 18% per annum.
Consolidated Separate
2015
US$ 2014
US$ 2015
US$ 2014
US$
Short-term employee benefits 428,000 347,500 37,000 - Post-employment pension 39,352 41,622 - -
467,352 389,122 37,000 -
Consolidated
2015 US$
2014 US$ Related party transactions for the year
Nature of relationship
Nature of Transactions
Brainworks Capital Management (Private) Limited Subsidiary Dividend income 4,740,759 - GetBucks Financial Services Limited Associate Finance cost 32,205 -
GetBucks Financial Services Limited Associate Interest income - 183,507 ABC Holdings Limited Indirect shareholder Finance cost - 238,459 Ecobank Transnational Incorporated Parent of associate Finance cost 46,754 426,620 Ecobank Zimbabwe Limited Associate Finance cost 94,874 305,266
Balance at year end
Meikles Limited Joint control Receivables 242,221 -
Brainworks Capital Private Equity Managers (Private) Limited Management Receivables 298,407 - African Development Corporation Shareholder Receivables - 2,400,000
GetBucks Financial Services Limited Associate Receivables - 2,017,963 GetBucks Financial Services Limited Associate Other liabilities 961,432 - Staff loans Management Receivables 1,760,362 -
Ecobank Transnational Incorporated Parent of associate Borrowings - 4,500,803 Ecobank Zimbabwe Limited Associate Borrowings 6,825,162 2,500,000
Related party transactions for the year Nature of
relationship Nature of
Transactions 2015 US$
2014 US$
Brainworks Capital Management (Private) Limited Subsidiary Finance cost 47,544 -
Balance at year end: Brainworks Capital Management (Private) Limited Subsidiary Borrowings 672,627 -
MyBucks S.A Parent of associate Investment 3,500,000 1,250,113
Restated
Previously disclosed
Movement
2014 US$
2013 US$
2014 US$
2013 US$
2014 US$
2013 US$
Share capital
86,307 86,307 53,192 45,692 33,115 40,615 Share premium
86,219,889 86,219,889 33,095,500 25,603,000 53,124,389 60,616,889
Merger reserve
(53,109,311) (60,609,311) - - (53,109,311) (60,609,311)
2015 Annual Report
Notes to the consolidated and separate financial statements for the year ended 31 December 2015
Consolidated Separate
2015
US$ 2014
US$ 2015
US$ 2014
US$
Short-term employee benefits 428,000 347,500 37,000 - Post-employment pension 39,352 41,622 - -
467,352 389,122 37,000 -
Consolidated
2015 US$
2014 US$ Related party transactions for the year
Nature of relationship
Nature of Transactions
Brainworks Capital Management (Private) Limited Subsidiary Dividend income 4,740,759 - GetBucks Financial Services Limited Associate Finance cost 32,205 -
GetBucks Financial Services Limited Associate Interest income - 183,507 ABC Holdings Limited Indirect shareholder Finance cost - 238,459 Ecobank Transnational Incorporated Parent of associate Finance cost 46,754 426,620 Ecobank Zimbabwe Limited Associate Finance cost 94,874 305,266
Balance at year end
Meikles Limited Joint control Receivables 242,221 -
Brainworks Capital Private Equity Managers (Private) Limited Management Receivables 298,407 - African Development Corporation Shareholder Receivables - 2,400,000
GetBucks Financial Services Limited Associate Receivables - 2,017,963 GetBucks Financial Services Limited Associate Other liabilities 961,432 - Staff loans Management Receivables 1,760,362 -
Ecobank Transnational Incorporated Parent of associate Borrowings - 4,500,803 Ecobank Zimbabwe Limited Associate Borrowings 6,825,162 2,500,000
Related party transactions for the year Nature of
relationship Nature of
Transactions 2015 US$
2014 US$
Brainworks Capital Management (Private) Limited Subsidiary Finance cost 47,544 -
Balance at year end: Brainworks Capital Management (Private) Limited Subsidiary Borrowings 672,627 -
MyBucks S.A Parent of associate Investment 3,500,000 1,250,113
Restated
Previously disclosed
Movement
2014 US$
2013 US$
2014 US$
2013 US$
2014 US$
2013 US$
Share capital
86,307 86,307 53,192 45,692 33,115 40,615 Share premium
86,219,889 86,219,889 33,095,500 25,603,000 53,124,389 60,616,889
Merger reserve
(53,109,311) (60,609,311) - - (53,109,311) (60,609,311)

28.2 Other related party transactions (continued)
The terms and conditions of the receivables due from related parties with the exception of staff loans disclosed below have no fixed repayment period, attract no interest and is payable on demand.
Staff loans
Included in staff loans is a balance of US$1,2 million payable by the executive management of Brainworks Capital Management (Private) Limited. These loans are charged interest at 7% per annum. These loans were assumed upon the Company’s disposal of its shareholding in Ecobank Zimbabwe and are expected to be settled in 2016.
The receivables due from related parties with the exception of staff loans have no fixed repayment period and attract no interest.
29. Subsequent events
GetBucks Financial Services Limited ("GetBucks")
GetBucks listed on the ZSE on 15 January 2016 and raised US$3,2 million which will enable it to underwrite its lending activities and to continue on its current growth trajectory. The company’s shareholding was resultantly diluted to 31% from the 45% held as at 31 December 2015.
African Sun Limited ("African Sun")
African Sun closed Beitbridge Express Hotel on 31 January 2016. The closure followed an approval by the board on 19 November 2015.
Dawn Properties Limited ("Dawn Properties")
Dawn Properties entered into a transaction to acquire the entire issued shares of Makasa Sun (Private) Limited ("Makasa") from Barclays Bank of Zimbabwe Limited and Barclays Bank Pension Fund. Makasa owns a hotel property in Victoria Falls. A detailed circular and notice convening an Extraordinary General Meeting to shareholders of Dawn Properties shall be issued once all processes have been finalised.
91
Consolidated Separate
2015
US$ 2014
US$ 2015
US$ 2014
US$
Short-term employee benefits 428,000 347,500 37,000 - Post-employment pension 39,352 41,622 - -
467,352 389,122 37,000 -
Consolidated
2015 US$
2014 US$ Related party transactions for the year
Nature of relationship
Nature of Transactions
Brainworks Capital Management (Private) Limited Subsidiary Dividend income 4,740,759 - GetBucks Financial Services Limited Associate Finance cost 32,205 -
GetBucks Financial Services Limited Associate Interest income - 183,507 ABC Holdings Limited Indirect shareholder Finance cost - 238,459 Ecobank Transnational Incorporated Parent of associate Finance cost 46,754 426,620 Ecobank Zimbabwe Limited Associate Finance cost 94,874 305,266
Balance at year end
Meikles Limited Joint control Receivables 242,221 -
Brainworks Capital Private Equity Managers (Private) Limited Management Receivables 298,407 - African Development Corporation Shareholder Receivables - 2,400,000
GetBucks Financial Services Limited Associate Receivables - 2,017,963 GetBucks Financial Services Limited Associate Other liabilities 961,432 - Staff loans Management Receivables 1,760,362 -
Ecobank Transnational Incorporated Parent of associate Borrowings - 4,500,803 Ecobank Zimbabwe Limited Associate Borrowings 6,825,162 2,500,000
Related party transactions for the year Nature of
relationship Nature of
Transactions 2015 US$
2014 US$
Brainworks Capital Management (Private) Limited Subsidiary Finance cost 47,544 -
Balance at year end: Brainworks Capital Management (Private) Limited Subsidiary Borrowings 672,627 -
MyBucks S.A Parent of associate Investment 3,500,000 1,250,113
Restated
Previously disclosed
Movement
2014 US$
2013 US$
2014 US$
2013 US$
2014 US$
2013 US$
Share capital
86,307 86,307 53,192 45,692 33,115 40,615 Share premium
86,219,889 86,219,889 33,095,500 25,603,000 53,124,389 60,616,889
Merger reserve
(53,109,311) (60,609,311) - - (53,109,311) (60,609,311)
2015 Annual Report
Notes to the consolidated and separate financial statements for the year ended 31 December 2015
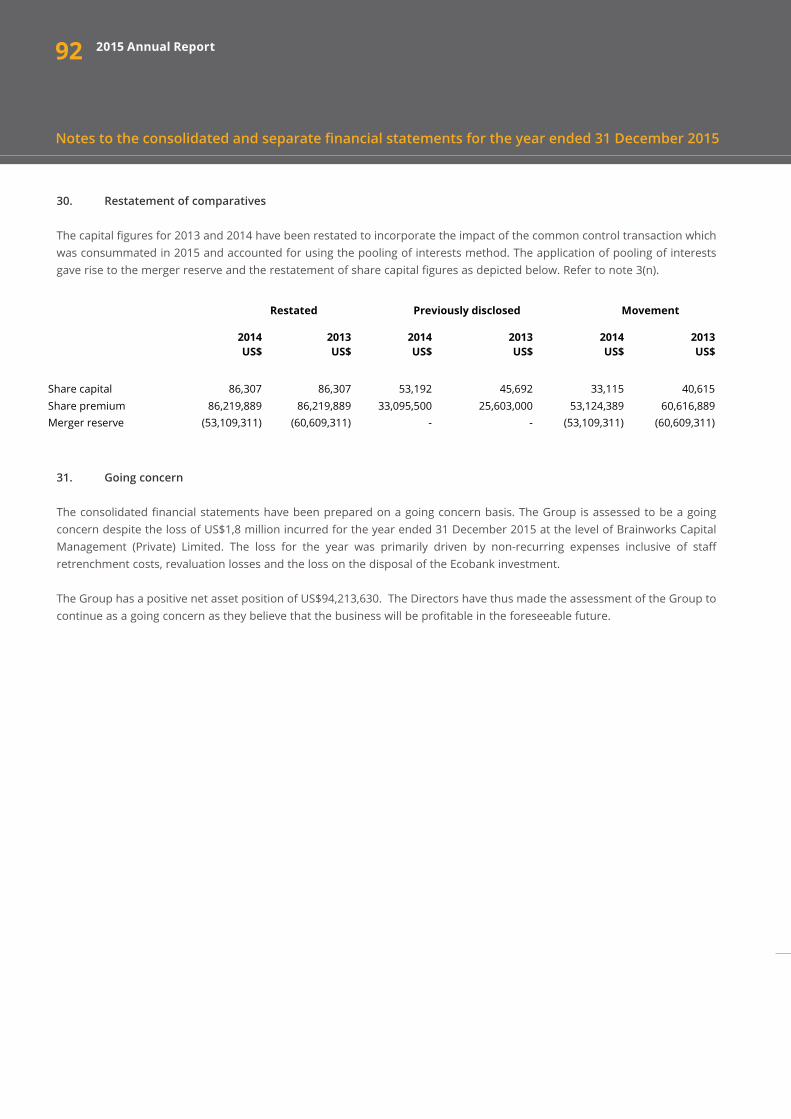
92 2015 Annual Report
30. Restatement of comparatives
The capital figures for 2013 and 2014 have been restated to incorporate the impact of the common control transaction which was consummated in 2015 and accounted for using the pooling of interests method. The application of pooling of interests gave rise to the merger reserve and the restatement of share capital figures as depicted below. Refer to note 3(n).
31. Going concern
The consolidated financial statements have been prepared on a going concern basis. The Group is assessed to be a going concern despite the loss of US$1,8 million incurred for the year ended 31 December 2015 at the level of Brainworks Capital Management (Private) Limited. The loss for the year was primarily driven by non-recurring expenses inclusive of staff retrenchment costs, revaluation losses and the loss on the disposal of the Ecobank investment.
The Group has a positive net asset position of US$94,213,630. The Directors have thus made the assessment of the Group to continue as a going concern as they believe that the business will be profitable in the foreseeable future.
Notes to the consolidated and separate financial statements for the year ended 31 December 2015
Consolidated Separate
2015
US$ 2014
US$ 2015
US$ 2014
US$
Short-term employee benefits 428,000 347,500 37,000 - Post-employment pension 39,352 41,622 - -
467,352 389,122 37,000 -
Consolidated
2015 US$
2014 US$ Related party transactions for the year
Nature of relationship
Nature of Transactions
Brainworks Capital Management (Private) Limited Subsidiary Dividend income 4,740,759 - GetBucks Financial Services Limited Associate Finance cost 32,205 -
GetBucks Financial Services Limited Associate Interest income - 183,507 ABC Holdings Limited Indirect shareholder Finance cost - 238,459 Ecobank Transnational Incorporated Parent of associate Finance cost 46,754 426,620 Ecobank Zimbabwe Limited Associate Finance cost 94,874 305,266
Balance at year end
Meikles Limited Joint control Receivables 242,221 -
Brainworks Capital Private Equity Managers (Private) Limited Management Receivables 298,407 - African Development Corporation Shareholder Receivables - 2,400,000
GetBucks Financial Services Limited Associate Receivables - 2,017,963 GetBucks Financial Services Limited Associate Other liabilities 961,432 - Staff loans Management Receivables 1,760,362 -
Ecobank Transnational Incorporated Parent of associate Borrowings - 4,500,803 Ecobank Zimbabwe Limited Associate Borrowings 6,825,162 2,500,000
Related party transactions for the year Nature of
relationship Nature of
Transactions 2015 US$
2014 US$
Brainworks Capital Management (Private) Limited Subsidiary Finance cost 47,544 -
Balance at year end: Brainworks Capital Management (Private) Limited Subsidiary Borrowings 672,627 -
MyBucks S.A Parent of associate Investment 3,500,000 1,250,113
Restated
Previously disclosed
Movement
2014 US$
2013 US$
2014 US$
2013 US$
2014 US$
2013 US$
Share capital
86,307 86,307 53,192 45,692 33,115 40,615 Share premium
86,219,889 86,219,889 33,095,500 25,603,000 53,124,389 60,616,889
Merger reserve
(53,109,311) (60,609,311) - - (53,109,311) (60,609,311)

Supplementary Information
93
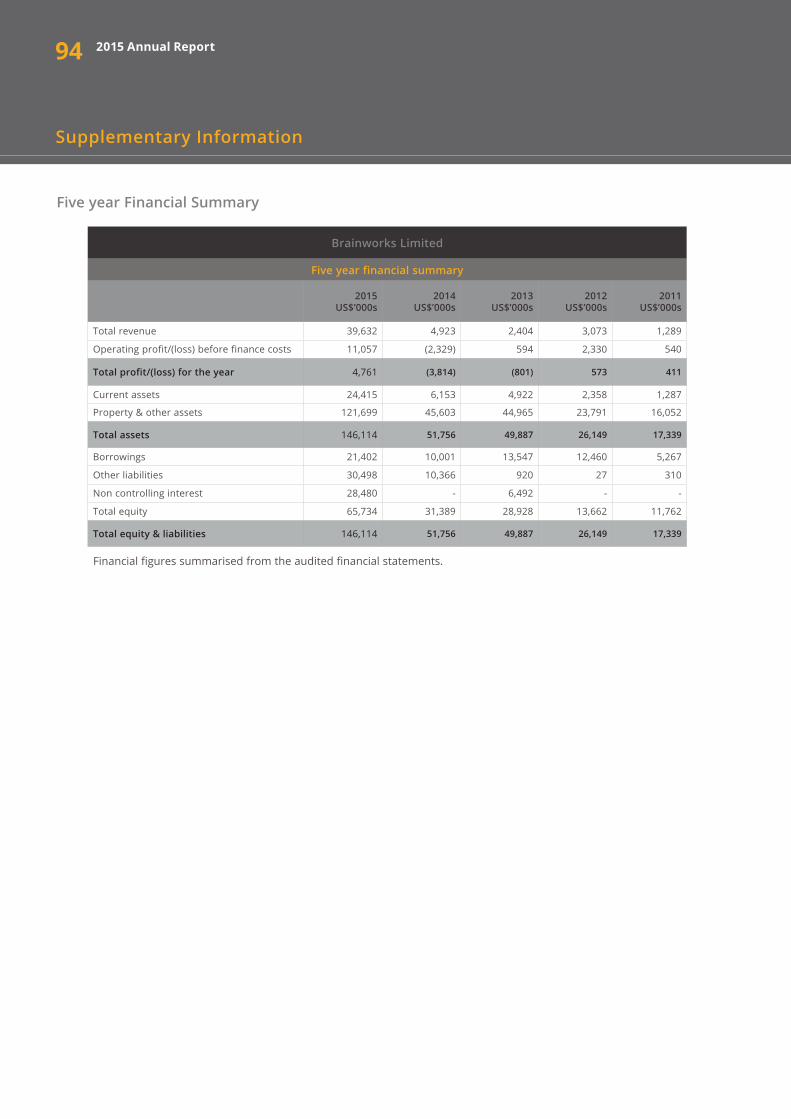
94 2015 Annual Report
Supplementary Information
Five year Financial Summary
Financial figures summarised from the audited financial statements.
Brainworks Limited
Five year financial summary
2015US$’000s
2014US$’000s
2013US$’000s
2012US$’000s
2011US$’000s
Total revenue 39,632 4,923 2,404 3,073 1,289
Operating profit/(loss) before finance costs 11,057 (2,329) 594 2,330 540
Total profit/(loss) for the year 4,761 (3,814) (801) 573 411
Current assets 24,415 6,153 4,922 2,358 1,287
Property & other assets 121,699 45,603 44,965 23,791 16,052
Total assets 146,114 51,756 49,887 26,149 17,339
Borrowings 21,402 10,001 13,547 12,460 5,267
Other liabilities 30,498 10,366 920 27 310
Non controlling interest 28,480 - 6,492 - -
Total equity 65,734 31,389 28,928 13,662 11,762
Total equity & liabilities 146,114 51,756 49,887 26,149 17,339

952015 Annual Report
Supplementary Information
Annual General Meeting Notice
Notice is hereby given that, the 3rd Annual General Meeting ("AGM") of the Shareholders of Brainworks Limited ("the Company" or "the Group" or "Brainworks") will be held on 30 June 2016 at 12h00 hours at the Registered Office of the Company at: Level 2, Alexander House, Ebène Cybercity, 72201, Republic of Mauritius, for the purposes stated below.
Ordinary Business
1. Statutory Financial StatementsTo receive and adopt the financial statements for the year ended 31 December 2015, together with the Report of the Directors and Auditors therein.
2. Re-election of Directors To re-elect the existing directors to hold office until the next AGM, and take note of the director fees approved by the Remuneration and Nomination Committee for non-executive directors.
3. Appointment of AuditorsTo approve the harmonisation of auditors for all the Group entities and the Company to PricewaterhouseCoopers following the re-organisation of the Group; the approval of a rotation policy of auditors by the board for PricewaterhouseCoopers to hold office until the next AGM; and to authorise the directors to fix the remuneration of the auditors. By order of the Board.
__________________________________________________________________________________________________________________________________FiducieForte Management Services LimitedCompany SecretaryLevel 2, Alexander House, Silicone Avenue, Ebène Cybercity, 72201Republic of Mauritius30 May 2016
96
Supplementary Information
(Brainworks Limited, Incorporated in Mauritius)
Level 2, Alexander House, Silicon Avenue, Ebène Cybercity, 72201, Republic of Mauritius
("Brainworks" or "the Company")
(Brainworks Limited, Incorporated in Mauritius)
Level 2, Alexander House, Silicon Avenue, Ebène Cybercity, 72201, Republic of Mauritius
(“Brainworks” or “the Company”)
Proxy Form
I/ We
of
Being member/members of the above Company, hereby appoint:
Mr/Mrs/Ms/Dr
or failing him/her
of
as my/our proxy to vote for me/us on my/our behalf at the third Annual General Meeting of the Company to be held at Level 2, Alexander House, Silicone Avenue, Ebène Cybercity, 72201 on Thursday, 30 June 2016 at 12h00 hours and any adjournment thereof. Signature ….........................................…………… Signed this …… day of ..................... 2016 Notes 1. A member entitled to attend and vote at this meeting is entitled to appoint a proxy to attend, and speak in his/her stead.
The person appointed need not be a member. 2. In terms of section 11.6 of the Company’s Constitution, proxy forms should be lodged at the registered office of the
Company no later than 24 hours before the time of the meeting. 3. Any alterations or corrections made to this form of proxy (including the deletion of alternatives) must be initialled by the
signatory/signatories. 4. Shareholders are requested to submit key questions in writing at least five days before the date of the meeting to enable
comprehensive answers to be prepared. This will not preclude them from raising questions from the floor.
Private Equity Investments Advisory
Annual General Meeting Proxy Form
Proxy Form
2015 Annual Report


Brainworks LimitedLevel 2, Alexander House, Silicon Avenue, Ebène Cybercity, 72201
Republic of Mauritius Tel +230 464 8452 Fax +230 468 1267
Email [email protected] www.brainworkscapital.com
Design, Typesetting, Editing & Proofreading www.mantaraydesign.co.za