year 13 summer homework - the hazeley academy · a level biology summer homework . ... focus on...
TRANSCRIPT

Year 13 Summer Homework
Deadline: Monday 12th
September 2016
Biology
Hazeley Academy
Page 1
A level Biology Summer homework
DUE DATE: WEEK BEGINNING 12 SEPTEMBER 2016
Objectives:
1. To be able to successfully produce a set of notes that can be used as an overview for photosynthesis and apply this knowledge to a set of exam questions (Task 1 and 4-specification point : 3.5.1 Photosynthesis)
2. To be able to describe a practical to identify biological molecules (Task 2-specification point 3.1.2 Biological molecules)
3. To develop confidence in writing up a practical, using research skills and utilising the Harvard referencing system (Task 3 -Specification skills criteria)
Tasks
Task 1:
Produce a set of revision notes on photosynthesis and the pathways including the structure and specific role of ATP. This can be done as a mind map or as revision cards.
(2 hours)
Task 2:
To write up a practical method for using biochemical tests to identify different carbohydrates. You should focus on Benedict's solution for reducing sugars and non-reducing sugars, and iodine/potassium iodide for starch.
You should also include:
• Equipment list • Risk assessment • What your expected results would be
(2 hours)
Task 3:
Write a research project on “Mitochondrial Disease”. This should include:
• Aim • Introduction • Signs and symptoms • Epidemiology-how is it spread? • Causes • Treatments
The research project must be written in your own words. You must reference all your sources using the Harvard Referencing method.
(2 hours)
Hazeley Academy
Page 2
Task 4-PLC’s-see page 5 -21
Time taken to complete exam questions: (3 Hours)
This work covers all three assessment objectives (AO1,2 and 3) and will link into your first progress report as the revision required for your first test in September. The work you are completing will not be given a grade but will contribute to your attitude to learning mark.
Resources/Research
Useful books to use for this homework:
Nelson Thorne A level Biology
www.biologyguide.net
www.biology-online.org
www.biochem4schools.org
The AQA A level specification (use new one on the AQA website) also contains many excellent links to information websites, practical work and mini-tutorials.
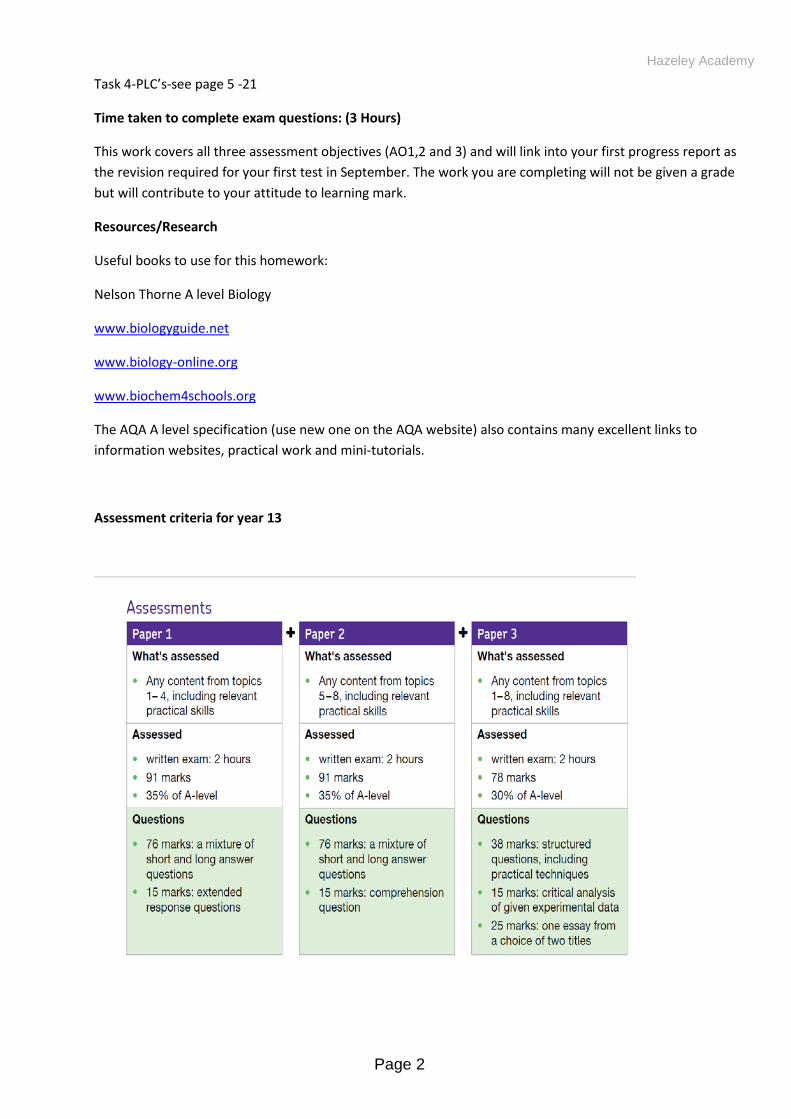
Assessment criteria for year 13

Hazeley Academy
Page 3
Wider reading:
The websites below contain many links to the topics we will learn in September. The advanced Biology will provide good additional knowledge.
Hazeley Academy
Page 4
Specification points covered in these PLC’s are: Please note: Task 4 exam questions will contribute to your PR1 in September
My SMART target to improve my knowledge is……
3.5.1 Photosynthesis
3.6.1.1 Survival and response
3.6.1.2 Receptors
3.6.2.1 Nerve impulses

Hazeley Academy
Page 5
PLC’s
Q1.A biologist investigated the stimulation of a Pacinian corpuscle in the skin of a fingertip. She used microelectrodes to measure the maximum membrane potential of a Pacinian corpuscle and its sensory neurone when different pressures were applied to the fingertip.
The figure below shows the Pacinian corpuscle, its sensory neurone and the position of the microelectrodes.
The table below shows some of the biologist’s results.
Pressure applied to the fingertip
Membrane potential at P / millivolts
Membrane potential at Q / millivolts
None –70 –70
Light –50 –70
Medium +30 +40
Heavy +40 +40
(a) Explain how the resting potential of –70 mV is maintained in the sensory neurone when no pressure is applied.
........................................................................................................................
........................................................................................................................
........................................................................................................................
........................................................................................................................ (2)
(b) Explain how applying pressure to the Pacinian corpuscle produces the changes in membrane potential recorded by microelectrode P.
........................................................................................................................
........................................................................................................................

Hazeley Academy
Page 6
........................................................................................................................
........................................................................................................................
........................................................................................................................
........................................................................................................................
........................................................................................................................
........................................................................................................................
(Extra space) ................................................................................................
........................................................................................................................
........................................................................................................................ (3)
(c) The membrane potential at Q was the same whether medium or heavy pressure was applied to the finger tip. Explain why.
........................................................................................................................
........................................................................................................................
........................................................................................................................
........................................................................................................................ (2)
(d) Multiple sclerosis is a disease in which parts of the myelin sheaths surrounding neurones are destroyed. Explain how this results in slower responses to stimuli.
........................................................................................................................
........................................................................................................................
........................................................................................................................
........................................................................................................................ (2)
(Total 9 marks)
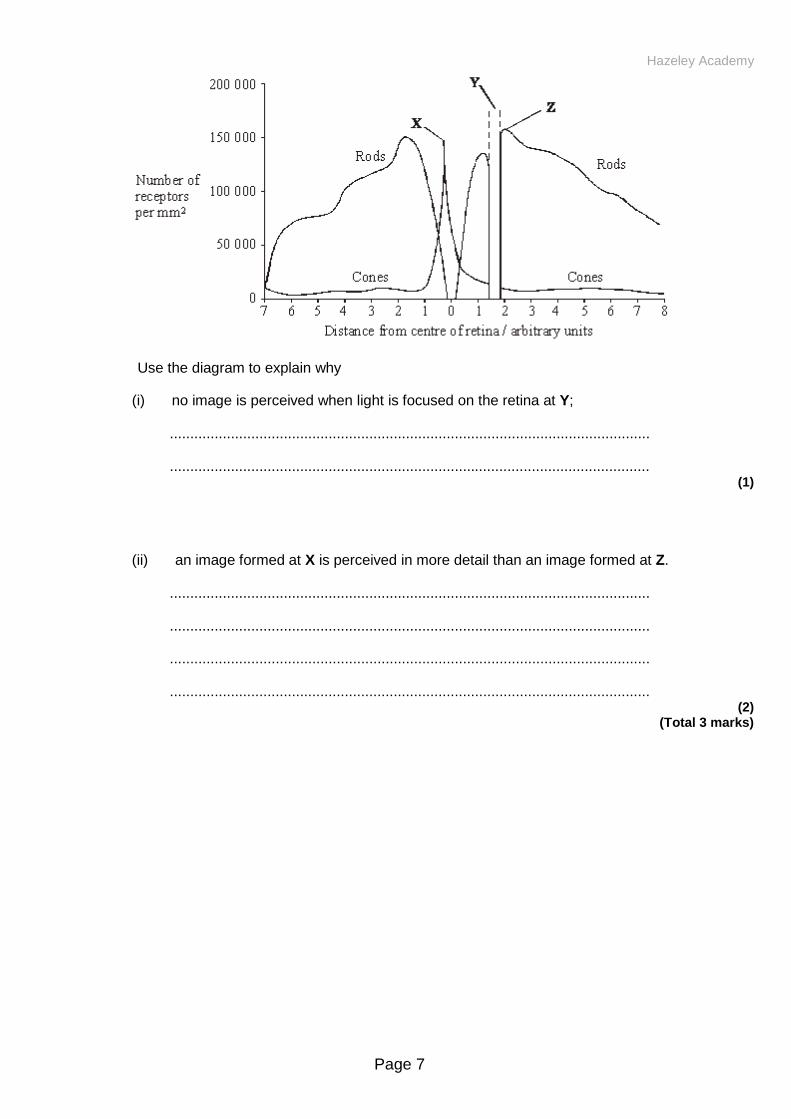
Q2. The graph shows the distribution of rod cells and cone cells across the retina of a human eye.
Hazeley Academy
Page 7
Use the diagram to explain why
(i) no image is perceived when light is focused on the retina at Y;
......................................................................................................................
...................................................................................................................... (1)
(ii) an image formed at X is perceived in more detail than an image formed at Z.
......................................................................................................................
......................................................................................................................
......................................................................................................................
...................................................................................................................... (2)
(Total 3 marks)
Hazeley Academy
Page 8
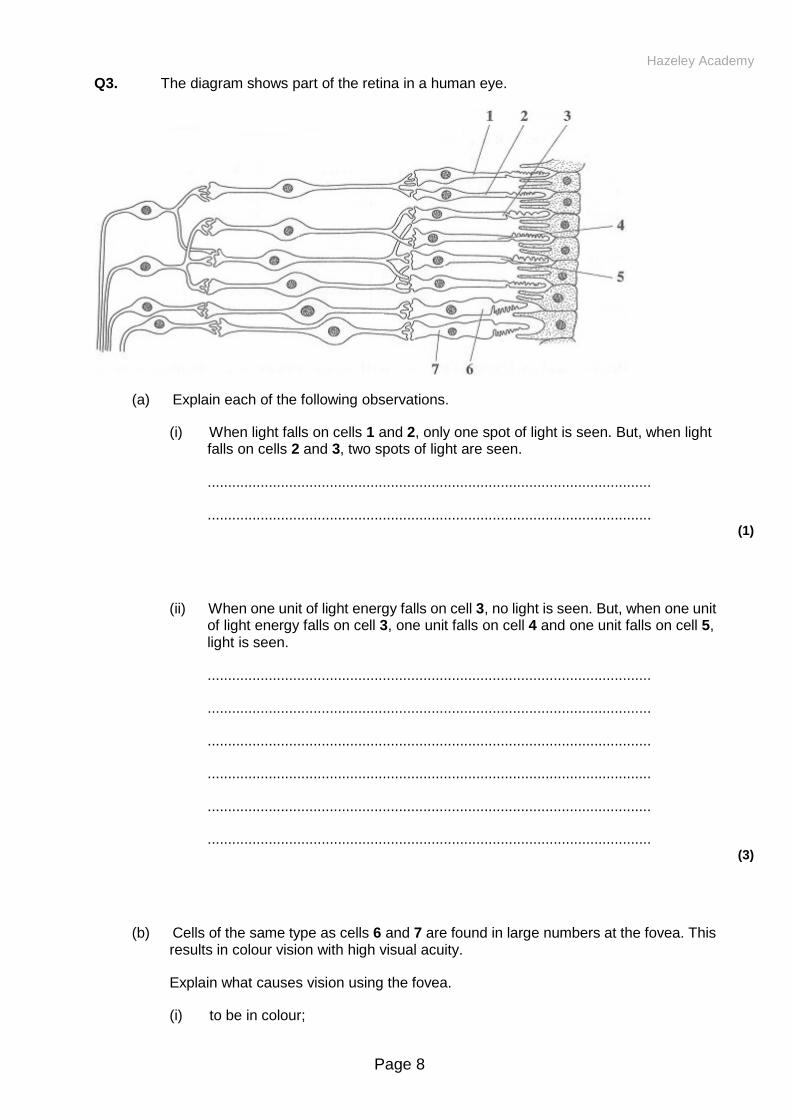
Q3. The diagram shows part of the retina in a human eye.
(a) Explain each of the following observations.
(i) When light falls on cells 1 and 2, only one spot of light is seen. But, when light falls on cells 2 and 3, two spots of light are seen.
.............................................................................................................
............................................................................................................. (1)
(ii) When one unit of light energy falls on cell 3, no light is seen. But, when one unit of light energy falls on cell 3, one unit falls on cell 4 and one unit falls on cell 5, light is seen.
.............................................................................................................
.............................................................................................................
.............................................................................................................
.............................................................................................................
.............................................................................................................
............................................................................................................. (3)
(b) Cells of the same type as cells 6 and 7 are found in large numbers at the fovea. This results in colour vision with high visual acuity.
Explain what causes vision using the fovea.
(i) to be in colour;
Hazeley Academy
Page 9
.............................................................................................................
............................................................................................................. (1)
(ii) to have high visual acuity.
.............................................................................................................
............................................................................................................. (1)
(Total 6 marks)
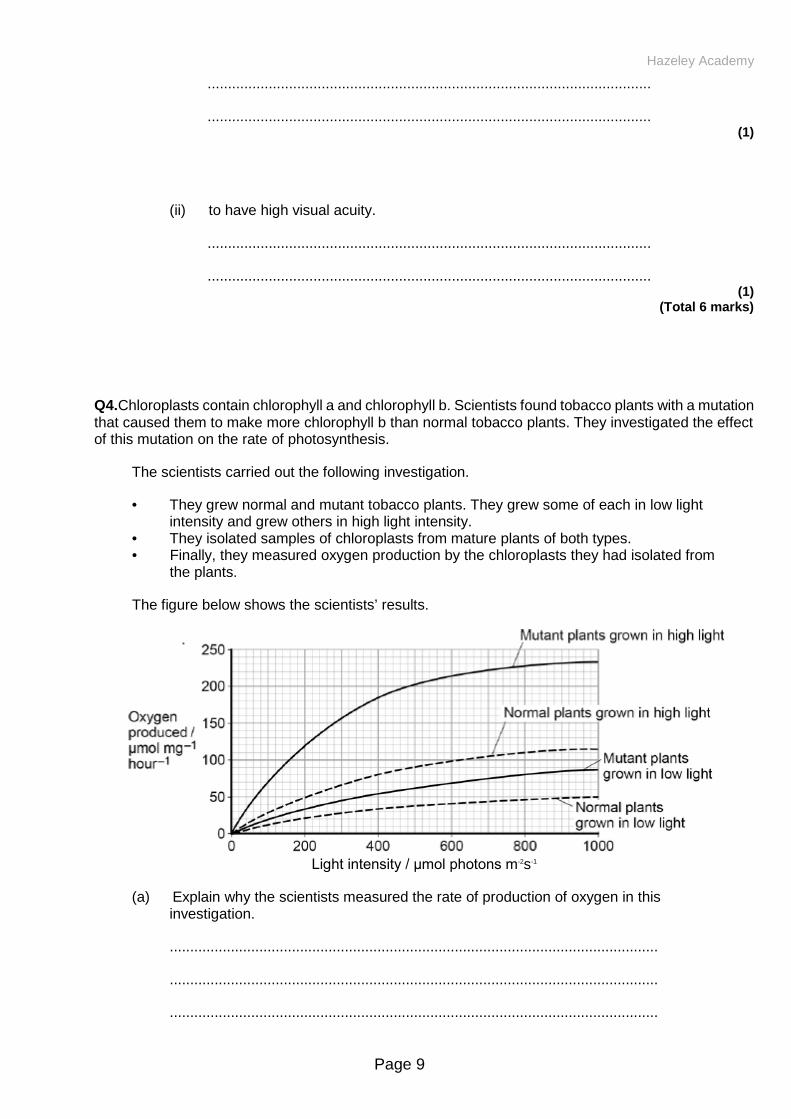
Q4.Chloroplasts contain chlorophyll a and chlorophyll b. Scientists found tobacco plants with a mutation that caused them to make more chlorophyll b than normal tobacco plants. They investigated the effect of this mutation on the rate of photosynthesis.
The scientists carried out the following investigation.
• They grew normal and mutant tobacco plants. They grew some of each in low light intensity and grew others in high light intensity.
• They isolated samples of chloroplasts from mature plants of both types. • Finally, they measured oxygen production by the chloroplasts they had isolated from
the plants.
The figure below shows the scientists’ results.
Light intensity / μmol photons m-2s-1
(a) Explain why the scientists measured the rate of production of oxygen in this investigation.
........................................................................................................................
........................................................................................................................
........................................................................................................................
Hazeley Academy
Page 10
........................................................................................................................
In each trial, the scientists collected oxygen for 15 minutes. (2)
(b) Calculate the difference in the oxygen produced by the chloroplasts from mutant plants grown in low and high light intensities at a light intensity of 500 μmol photons m–
2 s–1 during these trials.
Show your working.
Difference .................................................................... μmol O2 mg–1
(2)
(c) The scientists suggested that mutant plants producing more chlorophyll b would grow faster than normal plants in all light intensities.
Explain how these data support this suggestion.
........................................................................................................................
........................................................................................................................
........................................................................................................................
........................................................................................................................
........................................................................................................................
........................................................................................................................
........................................................................................................................
........................................................................................................................
(Extra space) ................................................................................................
........................................................................................................................
........................................................................................................................
........................................................................................................................ (4)
(Total 8 marks)
Hazeley Academy
Page 11
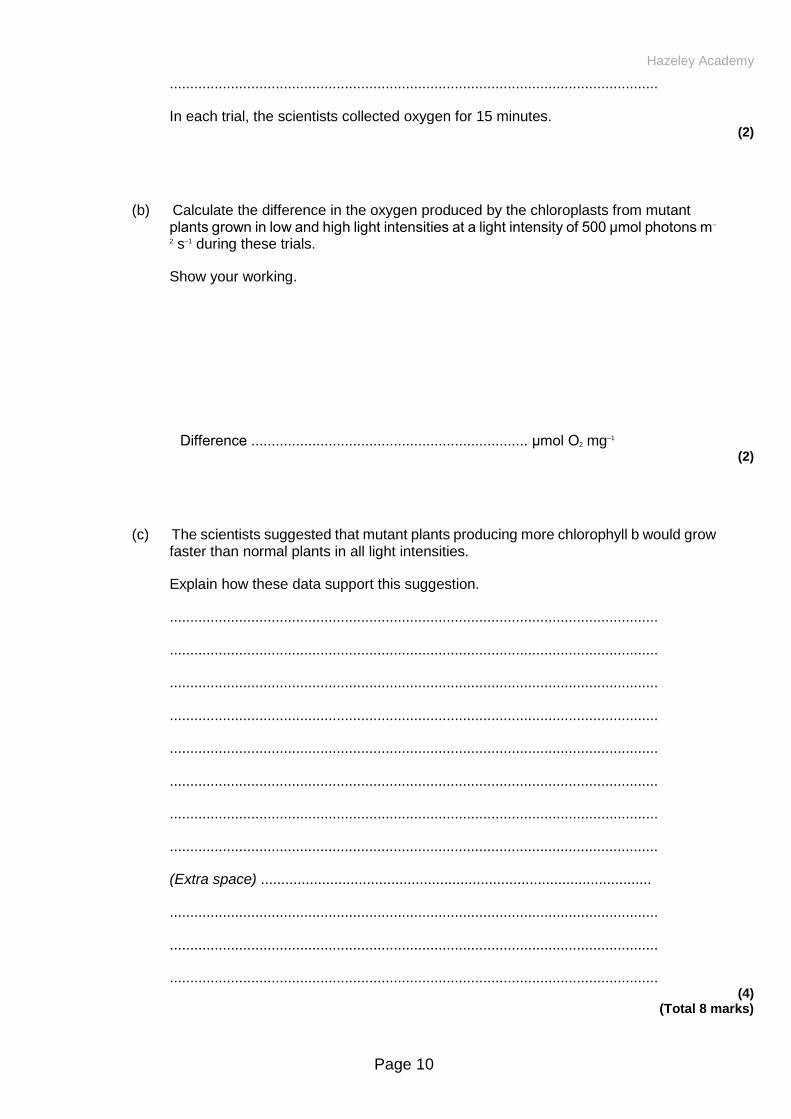
Q5. S In an investigation by a student into the responses of maggots, the bottom of a large box was marked with six coloured segments, as shown in the diagram.
30 maggots were placed on each segment in the box. A transparent cover was put on the box and light bulbs were positioned so that the segments were evenly illuminated. The positions of the maggots were recorded after one hour. The intensity of the light reflected by each segment was measured.
The experiment was repeated three more times. The total number of maggots in each segment from the four experiments is shown in the table.
Colour of segment
Intensity of reflected light / arbitrary units Total number of maggots
Black 4 154
Red 25 229
Blue 10 178
White 44 47
Green 25 48
Yellow 40 64
(a) Give one conclusion about the responses of maggots which is supported by these results.
......................................................................................................................
......................................................................................................................
Hazeley Academy
Page 12
Give the evidence from the table for your conclusion.
......................................................................................................................
...................................................................................................................... (2)
(b) The chi-squared test was used to analyse the data. For the results obtained, suggest one null hypothesis which might be analysed by a chi-squared test.
......................................................................................................................
...................................................................................................................... (1)
(c) It was suggested that the movement of the maggots might have been influenced by the Earth’s magnetic field. Suggest one simple way of repeating the investigation which would avoid this possibility.
......................................................................................................................
...................................................................................................................... (1)
(Total 4 marks)
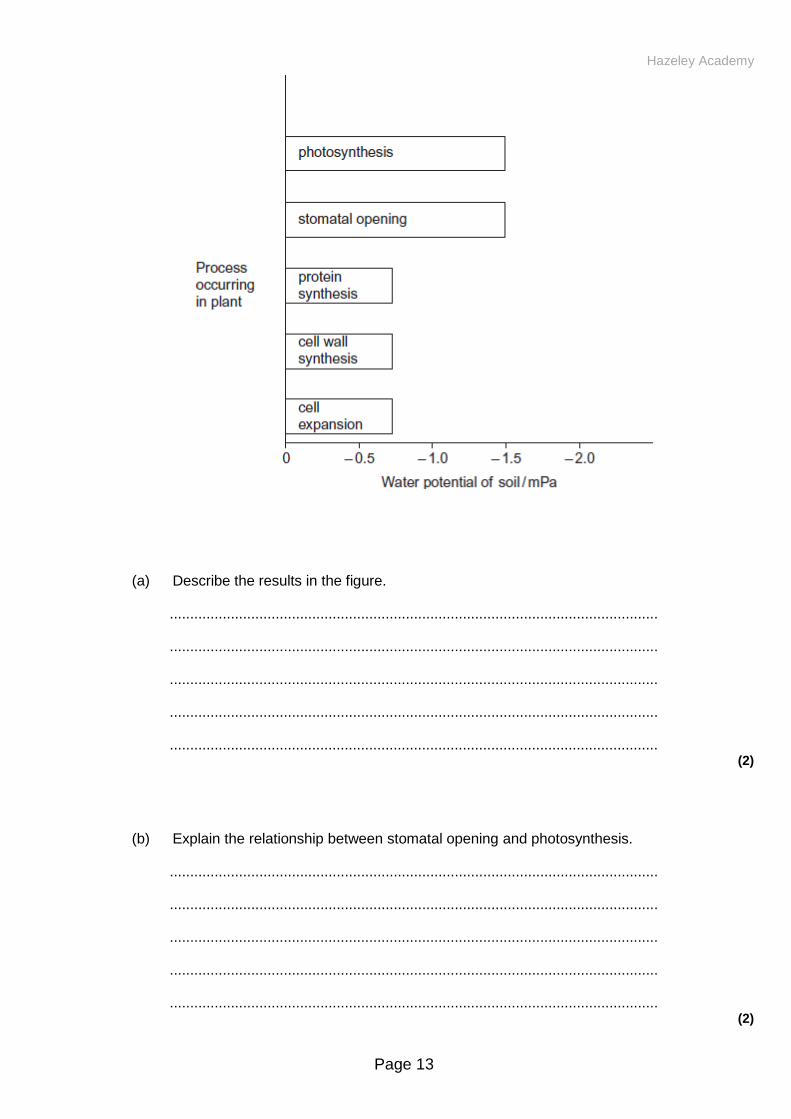
Q6.Scientists investigated the effect of the water potential of soil water on plant growth. They investigated the effect of this water potential on several plant processes.
The figure below shows their results in the form they were presented. The bars show whether or not each process was occurring.
The plants stopped growing when the water potential of the soil water was below –0.7 mPa. All of the changes in the plants were related to the ability of the roots to take up water from the soil.
Hazeley Academy
Page 13
(a) Describe the results in the figure.
........................................................................................................................
........................................................................................................................
........................................................................................................................
........................................................................................................................
........................................................................................................................ (2)
(b) Explain the relationship between stomatal opening and photosynthesis.
........................................................................................................................
........................................................................................................................
........................................................................................................................
........................................................................................................................
........................................................................................................................ (2)
Hazeley Academy
Page 14
(c) Although photosynthesis is still occurring, plants stop growing when the soil water potential falls below –0.7 mPa.
Use information from the figure above to suggest two reasons why.
........................................................................................................................
........................................................................................................................
........................................................................................................................
........................................................................................................................
........................................................................................................................
........................................................................................................................ (3)
(d) Most of the water uptake in a root takes place in the region just behind the root tip. Explain why.
........................................................................................................................
........................................................................................................................ (2)
(e) In a root, water passes through the endodermis and enters the xylem. Explain how.
........................................................................................................................
........................................................................................................................
........................................................................................................................
........................................................................................................................
........................................................................................................................
........................................................................................................................
(Extra space) .................................................................................................
........................................................................................................................
........................................................................................................................ (4)
(Total 13 marks)
Hazeley Academy
Page 15
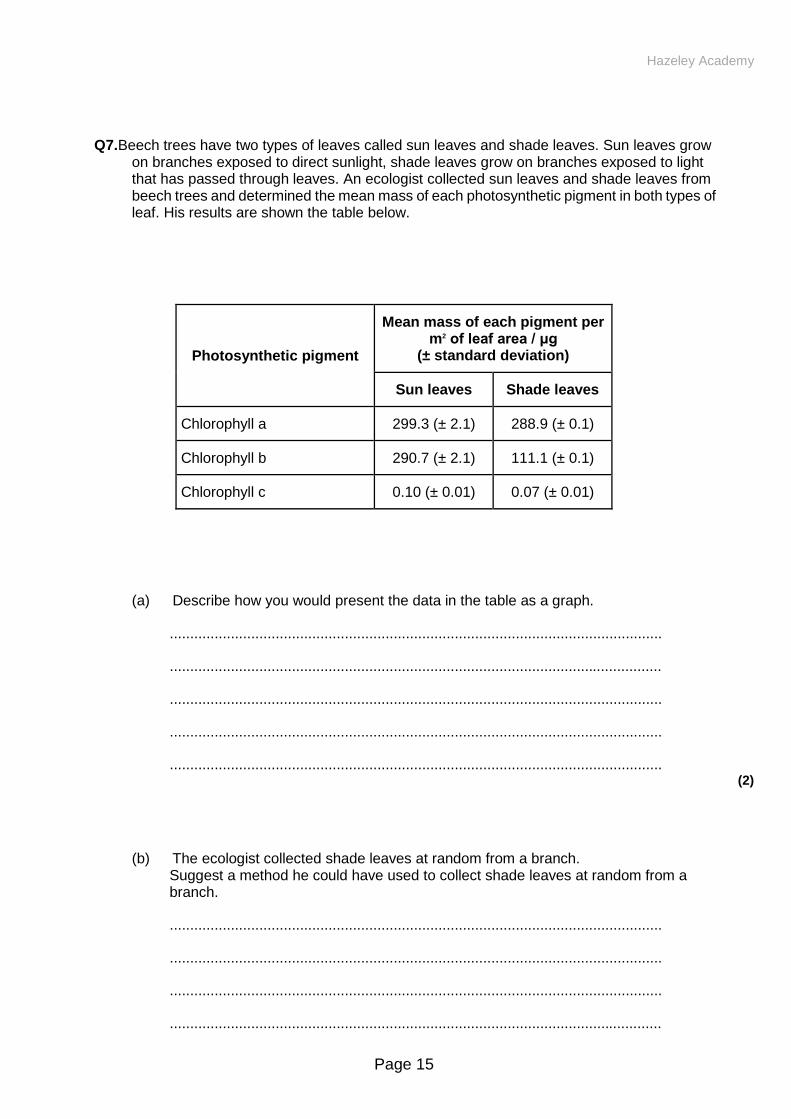
Q7.Beech trees have two types of leaves called sun leaves and shade leaves. Sun leaves grow on branches exposed to direct sunlight, shade leaves grow on branches exposed to light that has passed through leaves. An ecologist collected sun leaves and shade leaves from beech trees and determined the mean mass of each photosynthetic pigment in both types of leaf. His results are shown the table below.
Photosynthetic pigment
Mean mass of each pigment per m2 of leaf area / μg
(± standard deviation)
Sun leaves Shade leaves
Chlorophyll a 299.3 (± 2.1) 288.9 (± 0.1)
Chlorophyll b 290.7 (± 2.1) 111.1 (± 0.1)
Chlorophyll c 0.10 (± 0.01) 0.07 (± 0.01)
(a) Describe how you would present the data in the table as a graph.
.........................................................................................................................
.........................................................................................................................
.........................................................................................................................
.........................................................................................................................
......................................................................................................................... (2)
(b) The ecologist collected shade leaves at random from a branch. Suggest a method he could have used to collect shade leaves at random from a branch.
.........................................................................................................................
.........................................................................................................................
.........................................................................................................................
.........................................................................................................................

Hazeley Academy
Page 16
......................................................................................................................... (2)
(c) The ecologist concluded that there is a significant difference between the amounts of chlorophyll b in sun leaves and shade leaves of beech trees.
Do you agree with this conclusion?
.........................................................................................................................
.........................................................................................................................
.........................................................................................................................
.........................................................................................................................
......................................................................................................................... (2)
(d) Each type of chlorophyll is produced by a specific enzyme-controlled pathway. Use this information to suggest how the same beech tree can produce more chlorophyll b in some leaf cells than others.
.........................................................................................................................
.........................................................................................................................
.........................................................................................................................
.........................................................................................................................
......................................................................................................................... (2)
(Total 8 marks)
Q8.Tomato plants were grown in two glasshouses, each with an area of 2000 m2. The table shows the mean number of hours of sunshine per month during fruit production.
1995 – 1997 (no extra carbon dioxide
1998 – 2000 (extra carbon dioxide)
Mean number of hours of sunshine per month 148.91 147.00
• The scientists used heating to maintain the tempera ture inside the glasshouses
Hazeley Academy
Page 17
above 18 °C. They opened the windows to keep the tempera ture below 30 °C.
• From 1998 to 2000 they maintained the carbon dioxide concentration between 0.06 % and 0.08 % when the windows were closed and between 0.04 % and 0.05 % when the windows were open.
• The carbon dioxide concentra tion in the air outside the glasshouse was 0.04 %.
(a) The scientists monitored the number of hours of sunshine per month. Explain why they monitored the number of hours of sunshine.
........................................................................................................................
........................................................................................................................
........................................................................................................................
........................................................................................................................
........................................................................................................................
........................................................................................................................ (2)
(b) The temperature, the use of fertiliser and the number of insect pests were controlled during this investigation. Name one other factor which should have been controlled during the investigation. Explain why variation in this factor would affect yield.
Factor .............................................................................................................
Explanation .....................................................................................................
........................................................................................................................ (2)
(Total 4 marks)
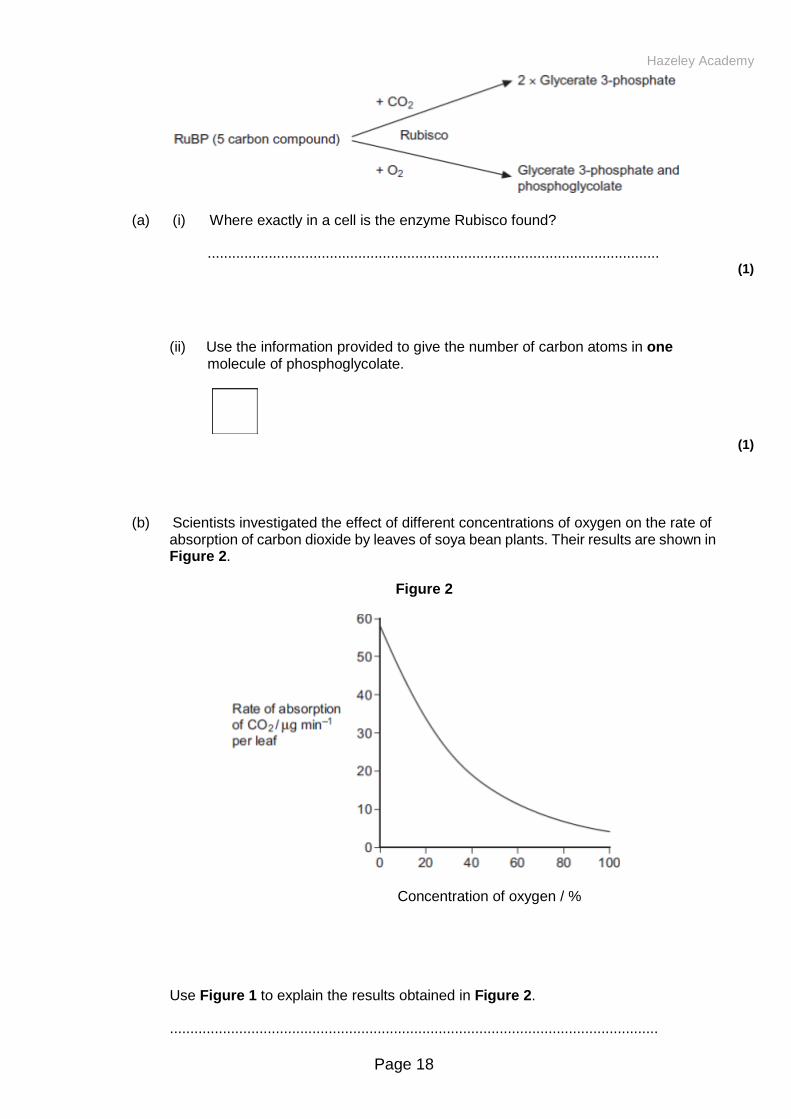
Q9.During photosynthesis, carbon dioxide reacts with ribulose bisphosphate (RuBP) to form two molecules of glycerate 3-phosphate (GP). This reaction is catalysed by the enzyme Rubisco. Rubisco can also catalyse a reaction between RuBP and oxygen to form one molecule of GP and one molecule of phosphoglycolate. Both the reactions catalysed by Rubisco are shown in Figure 1.
Figure 1
Hazeley Academy
Page 18
(a) (i) Where exactly in a cell is the enzyme Rubisco found?
............................................................................................................... (1)
(ii) Use the information provided to give the number of carbon atoms in one molecule of phosphoglycolate.
(1)
(b) Scientists investigated the effect of different concentrations of oxygen on the rate of absorption of carbon dioxide by leaves of soya bean plants. Their results are shown in Figure 2.
Figure 2
Concentration of oxygen / %
Use Figure 1 to explain the results obtained in Figure 2.
........................................................................................................................

Hazeley Academy
Page 19
........................................................................................................................
........................................................................................................................
........................................................................................................................
........................................................................................................................ (2)
(c) Use the information provided and your knowledge of the light-independent reaction to explain why the yield from soya bean plants is decreased at higher concentrations of oxygen. Phosphoglycolate is not used in the light-independent reaction.
........................................................................................................................
........................................................................................................................
........................................................................................................................
........................................................................................................................
........................................................................................................................
(Extra space)..................................................................................................
........................................................................................................................
........................................................................................................................ (3)
(Total 7 marks)
Q10.Students investigated the effect of removing leaves from a plant shoot on the rate of water uptake. Each student set up a potometer with a shoot that had eight leaves. All the shoots came from the same plant. The potometer they used is shown in the diagram.

Hazeley Academy
Page 20
(a) Describe how the students would have returned the air bubble to the start of the capillary tube in this investigation.
........................................................................................................................
........................................................................................................................
........................................................................................................................ (1)
(b) Give two precautions the students should have taken when setting up the potometer to obtain reliable measurements of water uptake by the plant shoot.
1......................................................................................................................
2...................................................................................................................... (2)
(c) A potometer measures the rate of water uptake rather than the rate of transpiration. Give two reasons why the potometer does not truly measure the rate of transpiration.
1......................................................................................................................
2...................................................................................................................... (2)
(d) The students’ results are shown in the table.

Hazeley Academy
Page 21
Number of leaves removed
from the plant shoot Mean rate of water uptake /
cm3 per minute
0 0.10
2 0.08
4 0.04
6 0.02
8 0.01
Explain the relationship between the number of leaves removed from the plant shoot and the mean rate of water uptake.
........................................................................................................................
........................................................................................................................
........................................................................................................................
........................................................................................................................
........................................................................................................................
........................................................................................................................
(Extra space)..................................................................................................
........................................................................................................................
........................................................................................................................ (3)
(Total 8 marks)