· xls file · web view · 2015-11-13dam/plant name beilfuss 2001 vol 4...
TRANSCRIPT

Historical Reservoir and Hydropower Data Value units Sources
Mozambique - plants with reservoirsCahora BassaOwner HCBGenerator dataDate of commissioning (generator) 1976-77 year HCB; Euroconsult Mott McDonald 2008 says 1975Average annual production 14,729 GWh HCBCurrent installed capacity 2,075 MW HCB; Euroconsult MotDate of major refurbishment 2003-2006 yearInstalled capacity prior to refurbishment 2,075 MWAvailability (net of planned and forced outages) 96% % HCBGenerating efficiency 96 % based on average flow, tailwater rating and average storage levelMaximum turbine flow (if relevant) 2,000 cms to match rated capacity and pers comm Gaule ( note HCB reports 2520 and Beilfuss 200Reservoir dataDate of commissioning (reservoir) 1975 year HCBReservoir storage capacity 65,000 mcm HCB; Beilfuss 2001 Vol 4 Table 4-5; Yamba et al has 63,000Surface area 2,665 km2 HCB; Beilfuss 2001 VoVolume-elevation curve see table HCB; Beilfuss 2001 Vol 4 Table 4-5Maximum hydraulic flow 16,250 cms Beilfuss 2001 Vol 2 p22Reservoir elevation when full 326 m HCB; Beilfuss 2001 VoReservoir net evaporation (net of rainfall) see table mm/mo Beilfuss 2001 WP2 Table 2-16/ HMN 2012 ReportOperating zones (top of conservation, buffer, inactive) see table % or mcmHCB; Beilfuss 2001 VoTailwater elevation 202 m HCB; Beilfuss 2001 Vol 4 Table 4-5; Yamba et al report head as 103.5mTime series data (to be supplied in spreadsheets)Monthly historical production (1960-2012) GWh HCBObserved volume or resevoir height (1960-2012) m HCBQualitative dataOperating guidelines see Design Rule Flood Curve
Zambia plants + Kariba South (Zim) still need LHPC
Kariba NorthOwner ZESCODate of commissioning (generator) 1959 year Beilfuss & Brown 2010Average annual production 2,859 GWh ZESCOCurrent installed capacity 720 MW MEWD (2010) Zambia Power Development Master PlanDate of major refurbishment N/A yearInstalled capacity prior to refurbishment N/A MWAvailability (net of planned and forced outages) 93% % Nexant 2007Generating efficiency 88% % Beilfuss 2001 Vol 4 Table 4-1Maximum turbine flow (if relevant) 879 cms estimated from 1794 cms total for Kariba dam in WB ModelDate of commissioning (reservoir) 1,959 year Beilfuss & Brown 2010Reservoir storage capacity 64,798 mcm Beilfuss 2001 Vol 4 Table 4-1Surface area 5,577 km2 Beilfuss 2001 Vol 4 Table 4-1Volume-elevation curve see table Beilfuss Table and Yamba et al from ZRAMaximum hydraulic flow 9515 cms Beilfuss 2010; Yamba Reservoir elevation when full 488.5 m Beilfuss 2001 Vol 4 Table 4-1Reservoir net evaporation (net of rainfall) mm/moOperating zones (top of conservation, buffer, inactive) see table % or mcmBeilfuss 2001 Vol 4 Table 4-1Tailwater elevation 384-405 m Beilfuss 2001 Vol 4 Table 4-1Time series data (to be supplied in spreadsheets)Monthly historical production (1960-2012) separate sheetGWh ZESCO

Observed volume or resevoir height (1960-2012) mQualitative dataOperating guidelines see Design Flood Rule Beilfuss 2001 Vol 4 Table 4-1
Kariba South - ZimbabweOwner ZESADate of commissioning (generator) 1958 year Euroconsult Mott McDonald 2007Average annual production 3,584 GWh IEACurrent installed capacity 750 MW Burian et al 2012 SAPP Grid Emissions FactorDate of major refurbishment N/A yearInstalled capacity prior to refurbishment N/A MWAvailability (net of planned and forced outages) 93% % Nexant 2007Generating efficiency 88% % Beilfuss 2001 Vol 4 Table 4-1Maximum turbine flow (if relevant) 915 cms estimated from 1794 cms total for Kariba dam in WB Model
Kafue Gorge UpperOwner ZESCODate of commissioning (generator) 1968 year Burian et al 2012 SAPP Grid Emissions FactorAverage annual production 5,160 GWh ZESCOCurrent installed capacity 990 MW MEWD (2010) Zambia Power Development Master PlanAvailability (net of planned and forced outages) 93% % Nexant 2007Generating efficiency 88% % Beilfuss 2001 Vol 4 Table 4-4Maximum turbine flow 252 cms Beilfuss 2001 Vol 2 p18Time series data (to be supplied in spreadsheets)Date of commissioning (reservoir) 1968 year as aboveReservoir storage capacity 785 mcm Beilfuss 2001 Vol 4 Table 4-4Surface area 805 km2 Beilfuss 2001 Vol 4 Table 4-4Volume-elevation curve see table Beilfuss 2001 Vol 4 Table 4-4Maximum hydraulic flow N/A cmsReservoir elevation when full 976.6 m Beilfuss 2001 Vol 4 Table 4-4Reservoir net evaporation (net of rainfall) mm/moOperating zones (top of conservation, buffer, inactive) 100 % or mcmBeilfuss 2001 Vol 4 TaTailwater elevation 582 m Beilfuss 2001 Vol 4 Table 4-4Time series data (to be supplied in spreadsheets)Monthly historical production (1960-2012) separate sheetGWh ZESCOObserved volume or resevoir height (1960-2012) mQualitative dataOperating guidelines (i.e. how decisions to release are made) none providedVictoria FallsOwner ZESCODate of commissioning (generator) 1972 year MEWD (2010) Zambia Power Development Master PlanAverage annual production 612 GWh ZESCOCurrent installed capacity 108 MW MEWD (2010) Zambia Power Development Master PlanDate of major refurbishment 1968 year MEWD (2010) Zambia Power Development Master PlanInstalled capacity prior to refurbishment 68 MW MEWD (2010) Zambia Power Development Master PlanAvailability (net of planned and forced outages) 93% % Nexant 2007Generating efficiency 88% % assumed to be same as KaribaMaximum turbine flow 117.2 cms MEWD (2010) Zambia Power Development Master PlanFixed head height 112.7 m MEWD (2010) Zambia Power Development Master PlanMonthly historical production (1960-2012) separate sheetGWh ZESCOLunsemfwaOwner LHPCDate of commissioning (generator) 1944 year Euroconsult Mott McD 2007Average annual production 113 GWh Euroconsult Mott McD 2007Current installed capacity 18 MW MEWD (2010) Zambia Power Development Master PlanDate of commissioning (reservoir) 1944 year

Reservoir storage capacity mcmSurface area 45 km2 Euroconsult Mott McD 2007Reservoir elevation when full mNet Head 380 m Euroconsult Mott McD 2007MulungushiOwner LHPCDate of commissioning (generator) 1955 year Burian et al 2012 SAPP Grid Emissions FactorAverage annual production 80 GWh Euroconsult Mott McD 2007Current installed capacity 20 MW MEWD (2010) Zambia Power Development Master PlanReservoir storage capacity mcmSurface area 31 km2 Euroconsult Mott McD 2007Reservoir elevation when full mNet Head 325 mCombined Lunsemfwa-Mulungushi for modelOwner LHPCDate of commissioning (generator) 1944 yearAverage annual production 193 GWhCurrent installed capacity 38 MWAvailability (net of planned and forced outages) 93% %Generating efficiency 90% %Reservoir storage capacity 1,143 mcmSurface area 76 km2Volume-elevation curve see tableReservoir elevation when full 1,029.5 mTailwater elevation 649.5Net Head 380 m
Itezhi-tezhiOwner ZESCO/TATAEstimated date of commissioning 1977 year Beilfuss 2001 Vol 2Reservoir storage capacity 5,624.0 mcm Beilfuss 2001 Vol 4 Table 4-2; Beilfuss 2010 - but use live storage for modelSurface area 374 km2Volume-elevation curve see table Beilfuss 2001 Vol 4 Table 4-2Maximum hydraulic flow not specified cmsReservoir elevation when full 1,029.5 mReservoir net evaporation (net of rainfall) mm/moOperating zones (top of conservation, buffer, inactive) see comment % or mcmTailwater elevation 986 mAverage head 40 m Euroconsult Mott MdD 2007Qualitative dataOperating guidelines (i.e. how decisions to release are made) see comment Beilfuss 2010
Malawi
Nkula Falls AOwner ESCOMDate of commissioning (generator) 1966 year Euroconsult Mott McDonald 2007Average annual production 161 GWh Escom pers commCurrent installed capacity 24 MW Euroconsult Mott McDonald 2007Availability (net of planned and forced outages) 93% % Nexant 2007Generating efficiency 90% %Maximum turbine flow 48 cms WB MSIOAFixed head height 52 m Euroconsult Mott McDonald 2007 (Annex 2)Nkula Falls BOwner ESCOMDate of commissioning (generator) 1981 year Euroconsult Mott McDonald 2007

Average annual production 575 GWh Escom pers commCurrent installed capacity 100 MW Euroconsult Mott McDonald 2007Availability (net of planned and forced outages) 93% % Nexant 2007Generating efficiency 90% %Maximum turbine flow 198 cms WB MSIOAFixed head height 57 m Euroconsult Mott McDonald 2007 (Annex 2)Tedzani I&IIOwner ESCOMDate of commissioning (generator) 1977 year Euroconsult Mott McDAverage annual production 276 GWh Escom pers commCurrent installed capacity 40 MW Euroconsult Mott McDonald 2007Availability (net of planned and forced outages) 93% % Nexant 2007Generating efficiency 90% %Maximum turbine flow 119 cms WB MSIOAFixed head height 37 m
Tedzani IIIOwner ESCOMDate of commissioning (generator) 1995 year Euroconsult Mott McDonald 2007Average annual production 312 GWh Escom pers commCurrent installed capacity 53 MW Euroconsult Mott McDonald 2007Availability (net of planned and forced outages) 93% % Nexant 2007Generating efficiency 90% %Maximum turbine flow 157 cms WB MSIOAFixed head height 37 m
Kapichira IOwner ESCOMDate of commissioning (generator) 2000 year Escom websiteAverage annual production 427 GWh Escom pers commCurrent installed capacity 64 MW Euroconsult Mott McDonald 2007Availability (net of planned and forced outages) 91% % Nexant 2007Generating efficiency 90% %Maximum turbine flow 134 cmsFixed head height 54 m
http://www.escom.mw/station-tedzani.php
http://www.escom.mw/station-tedzani.php
http://www.escom.mw/station-kapichira.phphttp://www.escom.mw/station-kapichira.php

Comment
Turbine efficencynet head (m) 90 95efficiency 89.3% 92.7%
HCB; Euroconsult Mott McDonald 2008 says 1975 Volume Elevation curveAverage 2004-2012; HCB says 15,500 in future 0.8103 volume (mcm) 0 47455 turbines, usually only run 4 elevation (m amsl) 295 3001981-1998 civil war disrupted operation of reservoir 838 1065
spillway (cms) 6760 7990After refurbishement , average from 2008 up to 2011 Source: HCB; Beilfuss
based on average flow, tailwater rating and average storage level Design Flood Rule Curve (end of month levels)to match rated capacity and pers comm Gaule ( note HCB reports 2520 and Beilfuss 200Month Jan Feb
Level (m amsl) 321.7 323.6commissioned in 1974, operational in model in 1975 volume (mcm) 41185 45833
HCB; Beilfuss 2001 Vol 4 Table 4-5; Yamba et al has 63,000 Source: Kling/ZDSS based on observation in 2000s (differs from Beilfuss)at 326 m Operating Zones (mcm)
HCB; Beilfuss 2001 Vol 4 Table 4-5 Top of Storage 65991Beilfuss 2001 Vol 2 p22 Top of Conservation 41185 45833
top of conservation Top of Buffer 0Beilfuss 2001 WP2 Table 2-16/ HMN 2012 Report Top of Inactive 0
based on Design Flood Rule Curve Tailwater rating curv 197.17 198.708HCB; Beilfuss 2001 Vol 4 Table 4-5; Yamba et al report head as 103.5m Discharge (cms) 0 500
Discharge (mcm) 0 1296in separate file Level (m amsl) 193.98 198.89in separate file Historical net evaporation ( Jan
Evaporation 176Rainfall 169Net evaporation Beilfuss 7Net evaporation HCB 44Net evaporation WEAP -34
Beilfuss & Brown 2010 238.25 friction head loss 0.7 mAverage 1993-2012 45%
MEWD (2010) Zambia Power Development Master Plan Volume Elevation cuMinif plant was upgraded volume (mcm) 54 2272
elevation (m amsl) 475.5 4764354 4405
Beilfuss 2001 Vol 4 Table 4-1 spillway (cms)estimated from 1794 cms total for Kariba dam in WB ModelBeilfuss & Brown 2010 Design Flood Rule Curve (end of month levels) - revised 2005Beilfuss 2001 Vol 4 Table 4-1 Month Jan FebBeilfuss 2001 Vol 4 Table 4-1 Level (m amsl) 485.15 484.15Beilfuss Table and Yamba et al from ZRA
for both power plants (North and South) Source: ZRA pers comm, Dam Synchronisation Study Annex 2 p72Beilfuss 2001 Vol 4 Table 4-1 Operating Zones (m amsl)
Top of StorageBeilfuss 2001 Vol 4 Table 4-1 Top of Conservation 485 484Beilfuss 2001 Vol 4 Table 4-1 Top of Buffer 0
Top of Inactivereceived from ZESCO for 1993-2012 Tailwater rating curve
area (km2)
area (km2)
volume (109 m3)
Discharge (cms) 0 479Level (m amsl) 379.95 383.7
Beilfuss 2001 Vol 4 Table 4-1
6,443Euroconsult Mott McDonald 2007
Average 1993-2012 55%Burian et al 2012 SAPP Grid Emissions Factor
if plant was upgraded
this is availability and not load factorBeilfuss 2001 Vol 4 Table 4-1estimated from 1794 cms total for Kariba dam in WB Model
friction head loss 1 m
Volume Elevation cuMinBurian et al 2012 SAPP Grid Emissions Factor 430 volume (mcm) 0 20
Average 1993-2012 0.595 elevation (m amsl) 972.3 973MEWD (2010) Zambia Power Development Master Plan 20 35
spillway (cms) 780 1076Beilfuss 2001 Vol 4 Table 4-4Beilfuss 2001 Vol 2 p18
Operating Zones (mcm)Beilfuss 2001 Vol 4 Table 4-4 Top of Storage 785Beilfuss 2001 Vol 4 Table 4-4 Top of ConservationBeilfuss 2001 Vol 4 Table 4-4 Top of Buffer 0
Top of Inactive 0Beilfuss 2001 Vol 4 Table 4-4
no buffer zone or inactive zone Beilfuss 2001 Vol 4 Table 4-4
received from ZESCO for 1993-2012
MEWD (2010) Zambia Power Development Master PlanAverage 1993-2012 65%
MEWD (2010) Zambia Power Development Master PlanMEWD (2010) Zambia Power Development Master PlanMEWD (2010) Zambia Power Development Master Plan
assumed to be same as KaribaMEWD (2010) Zambia Power Development Master PlanMEWD (2010) Zambia Power Development Master Plan
received from ZESCO for 1993-2012
Euroconsult Mott McD 2007Euroconsult Mott McD 2007MEWD (2010) Zambia Power Development Master Plan
area (km2)
Euroconsult Mott McD 2007
Euroconsult Mott McD 2007
Burian et al 2012 SAPP Grid Emissions FactorEuroconsult Mott McD 2007MEWD (2010) Zambia Power Development Master Plan
Euroconsult Mott McD 2007
scaling factor 0.2032similar to Lunsumfwa Volume Elevation cuMincombined for both volume (mcm) 142 182combined for both elevation (m amsl) 1006 1008default from Nexant 2007 18 21default from USBR 2005 All estimated from scaling Itezhi-tezhiscaled from Itezhi-tezhi Note: Lunsemfwa and Mulungushi are also about 1100 m amslcombined for bothscaled from Itezhi-tezhithis is for model; actual is roughly at 1100m amslcalculatedusing Lunsemfwa head
Dec-76 Volume Elevation cuMinBeilfuss 2001 Vol 4 Table 4-2; Beilfuss 2010 - but use live storage for model volume (mcm) 699 894
elevation (m amsl) 1006 1008Beilfuss 2001 Vol 4 Table 4-2 90 105
spillway (cms) 300 300Live storage 0 195Design Flood Rule CJan Feb
inactive below 699 mcm/1006m elevation 1023.5 1025.9calculated from mean surface level and net head (CEEEZ data) volume
Euroconsult Mott MdD 2007
must have 300 cms flood in month of March; but not happening often
Euroconsult Mott McDonald 2007average of 2005-2012
Euroconsult Mott McDonald 2007 77%default assumptionas per USBR 2005total Nkula Falls is 246 cms, so weighted by capacity
Euroconsult Mott McDonald 2007 (Annex 2)
Euroconsult Mott McDonald 2007
area (km2)
area (km2)

average of 2005-2012Euroconsult Mott McDonald 2007 66%
default assumptionas per USBR 2005total Nkula Falls is 246 cms, so weighted by capacity
Euroconsult Mott McDonald 2007 (Annex 2)
note that I was commissioned in 1973average of 2005-2012
Euroconsult Mott McDonald 2007 0.7877default assumptionas per USBR 2005MSIOA has 276cms, so weighted by capacityEuronconsult has same value
Euroconsult Mott McDonald 2007average of 2005-2012
Euroconsult Mott McDonald 2007 0.6758default assumptionas per USBR 2005MSIOA has 276cms, so weighted by capacityEurconsult has 42m
average of 2005-2012 76%Euroconsult Mott McDonald 2007
actaul for this plantas per USBR 2005MSIOA has same valueEurconsult has same value

100 105 110 115 120 125 125 13095.8% 95.6% 95.6% 95.9% 95.6% 95.2% 94.2% 92.9%
10689 17963 26699 37026 51704 62977 65991305 310 315 320 326 330 331 36
1317 1597 1902 2233 2665 2974 30549060 10020 10890 11700 12600 14173 15683
Design Flood Rule Curve (end of month levels)Mar Apr May Jun Jul Aug Sep Oct Nov Dec
325.6 325.7 325.4 325.1 324.5 324 323.1 322.2 321.3 320.650576.7 50858.5 50013 49167.6 40206.2 40206.2 40206.2 40206.2 40206 38494 calculated from volume e
Source: Kling/ZDSS based on observation in 2000s (differs from Beilfuss)
50577 50859 50013 49168 40206 40206 40206 40206 40206 38494no distinction made for buffer zone
200.213 203.122 205.897 211.042 217.753 222.422 228.709 233.0811000 2000 3000 5000 8000 10500 15000 220002592 5184 7776 12960 20736 27216 38880 57024
201.08 204.29 206.86 211.05 216.05 221.5 226.14 232 Source: HCB; Beilfuss 2001 vol 4Feb Mar Apr May Jun Jul Aug Sep Oct Nov Dec
146 169 156 147 128 142 190 245 281 234 185145 97 20 7 4 2 1 0 7 49 145
1 72 136 140 124 140 189 245 274 185 4016 95 137 139 118 119 164 218 269 181 62
-31 24 102 114 100 107 138 179 196 122 -29
6706 11278 15911 20613 25962 30408 35427 40568 45778 51088 56507477 478 479 480 481 482 483 484 485 486 487
4507 4608 4709 4811 4901 4991 5081 5171 5261 5350 54407528 7751 7973 8168 8381 8584 8786 8974 9161
Design Flood Rule Curve (end of month levels) - revised 2005Mar Apr May Jun Jul Aug Sep Oct Nov Dec
485.7 487.5 487.5 487.5 487.5 487.5 487 486.5 486 485.5 calculated from volume elevation curve
Source: ZRA pers comm, Dam Synchronisation Study Annex 2 p72
486 488 488 488 488 488 487 487 486 486no distinction made for buffer zone
2001 Vol 4 Table
-10001000
30005000
70009000
1100013000
15000365370375380385390395400405410
f(x) = − 0.0000001082568 x² + 0.003018525 x + 382.7291047R² = 0.975284655608974
Kariba Tailwater Rating Curve
Discharge (cms)
Leve
l (m
am
sl)
0 20000 40000 60000170180190200210220230240
f(x) = − 0.00000000965606 x² + 0.00115136 x + 197.174
Jan Feb Mar AprMay Jun Jul
AugSep Oct Nov
Dec0
10000
20000
30000
40000
50000
60000

719 959 1319 1518 3000 9000 12000 15000384.86 386.19 387.67 388.48 391.96 399.87 402.55 404.55
69 170 423 785 1178 2845974 975 976 976.6 977 978
70 142 430 805 1175 21601420 1804 2220 2496 2668 3132
-10001000
30005000
70009000
1100013000
15000365370375380385390395400405410
f(x) = − 0.0000001082568 x² + 0.003018525 x + 382.7291047R² = 0.975284655608974
Kariba Tailwater Rating Curve
Discharge (cms)
Leve
l (m
am
sl)
972 973 974 975 976 977 978 9790
500
1000
1500
2000
2500
3000
Kafue Upper Volume-Elevation
Reservoir elevation (m amsl)
Rese
rvoi
r vol
ume
(mcm
)

227 280 340 408 485 572 669 722 837 964 11051010 1012 1014 1016 1018 1020 1022 1024 1026 1028 1029
24 28 32 36 41 46 51 58 64 70 74
Note: Lunsemfwa and Mulungushi are also about 1100 m amsl
1119 1377 1673 2008 2387 2814 3291 3551 4118 4746 54391010 1012 1014 1016 1018 1020 1022 1024 1026 1028 1029
120 138 158 177 203 224 253 284 314 346 364300 300 300 300 300 402 690 1125 1674 2355 2700420 678 974 1309 1688 2115 2592 2852 3419 4047 4740
Mar Apr May Jun Jul Aug Sep Oct Nov Dec1027.5 1028.5 1028.6 1028.2 1027.6 1026.8 1025.7 1024.5 1023.2 1022.5
Jan Feb Mar AprMay Jun Jul
AugSep Oct Nov
Dec1018.0
1020.0
1022.0
1024.0
1026.0
1028.0
1030.0

Month Jan Feb Mar Apr May Jun Jul Aug321.4 324.7 328.4 329 329 328 326 326
calculated from volume e -0.3 1.1 2.8 3.3 3.6 2.9 1.5 2
no distinction made for buffer zone
Source: HCB; Beilfuss 2001 vol 4SourceBeilfuss 2001 WP2 Table 2-16/ HMN 2012 Report
WEAP
Max 600 MW Yamba et al book64798 76854488.5 489.55577 56719445 9515
calculated from volume elevation curve
no distinction made for buffer zone
from literature
Level (m amsl)
-10001000
30005000
70009000
1100013000
15000365370375380385390395400405410
f(x) = − 0.0000001082568 x² + 0.003018525 x + 382.7291047R² = 0.975284655608974
Kariba Tailwater Rating Curve
Discharge (cms)
Leve
l (m
am
sl)
474 476 478 480 482 484 486 488 490 4920
100002000030000400005000060000700008000090000
Kariba Volume-Elevation Curve
Reservoir Elevation (m amsl)
Rese
rvoi
r vol
ume
(mcm
)
Jan Feb Mar Apr May Jun Jul Aug Sep Oct Nov Dec-50
0
50
100
150
200
250
300
BeilfussHCBWEAP
Jan Feb Mar AprMay Jun Jul
AugSep Oct Nov
Dec0
10000
20000
30000
40000
50000
60000

-10001000
30005000
70009000
1100013000
15000365370375380385390395400405410
f(x) = − 0.0000001082568 x² + 0.003018525 x + 382.7291047R² = 0.975284655608974
Kariba Tailwater Rating Curve
Discharge (cms)
Leve
l (m
am
sl)
972 973 974 975 976 977 978 9790
500
1000
1500
2000
2500
3000
Kafue Upper Volume-Elevation
Reservoir elevation (m amsl)
Rese
rvoi
r vol
ume
(mcm
)

Max1143 1432
1029.5 103576 91
Max5624 7049
1029.5 1035374 446
2910 44504925 6350 matches CEEEZ analysis
Jan Feb Mar AprMay Jun Jul
AugSep Oct Nov
Dec1018.0
1020.0
1022.0
1024.0
1026.0
1028.0
1030.0
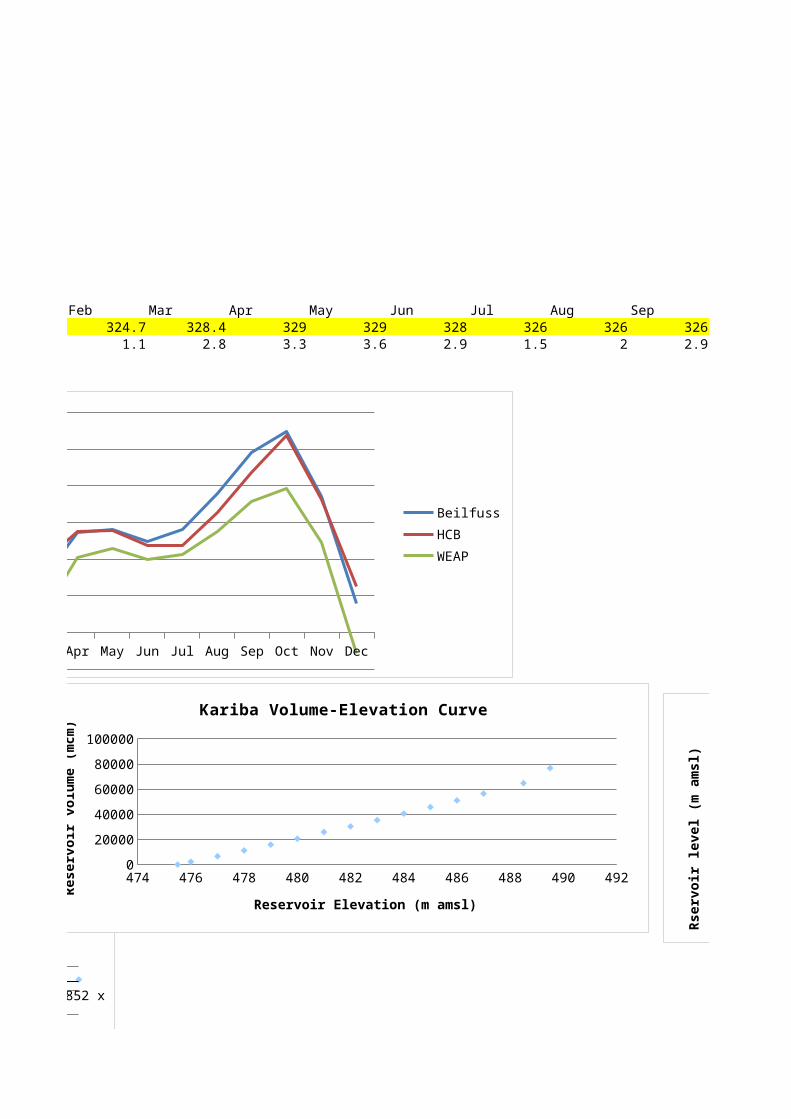
Sep Oct Nov Dec326 326 323 320.82.9 3.8 1.7 0.2
474 476 478 480 482 484 486 488 490 4920
100002000030000400005000060000700008000090000
Kariba Volume-Elevation Curve
Reservoir Elevation (m amsl)
Rese
rvoi
r vol
ume
(mcm
)
Jan Feb Mar Apr May Jun Jul Aug Sep Oct Nov Dec482
483
484
485
486
487
488
Kariba Design Flood Rule Curve
Rser
voir
leve
l (m
am
sl)

Future Reservoir and Hydropower Data Value Units
Mozambique
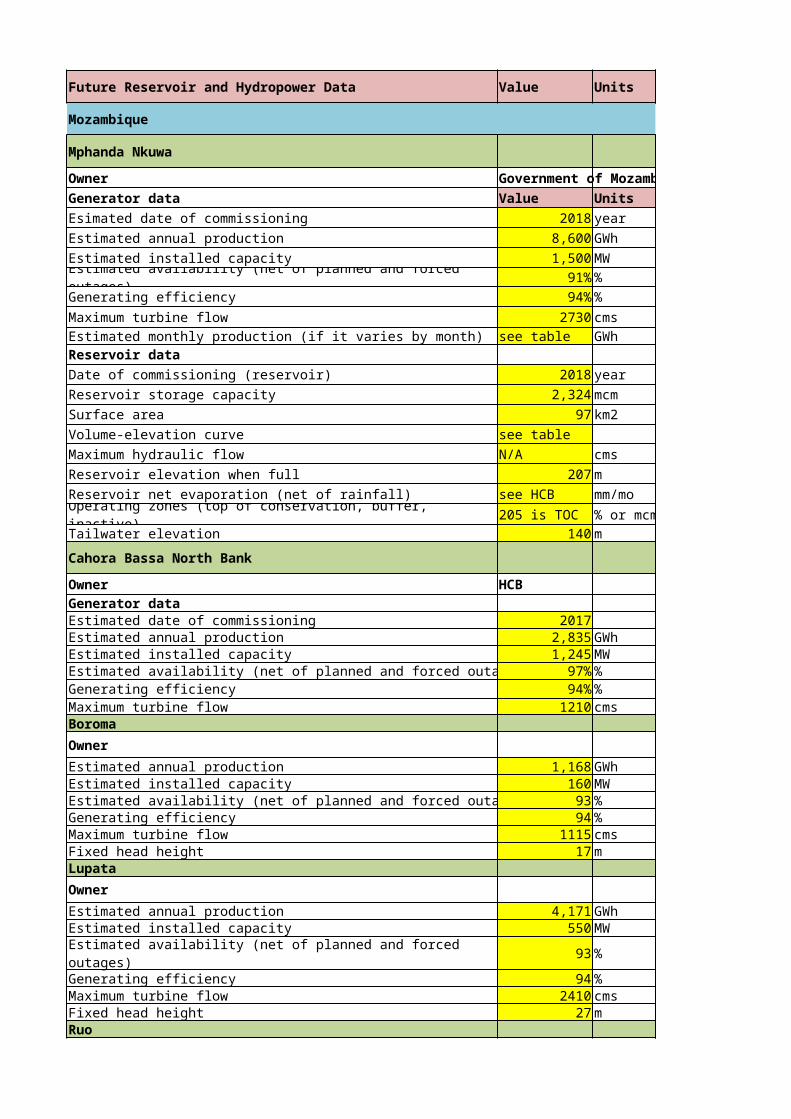
Mphanda Nkuwa
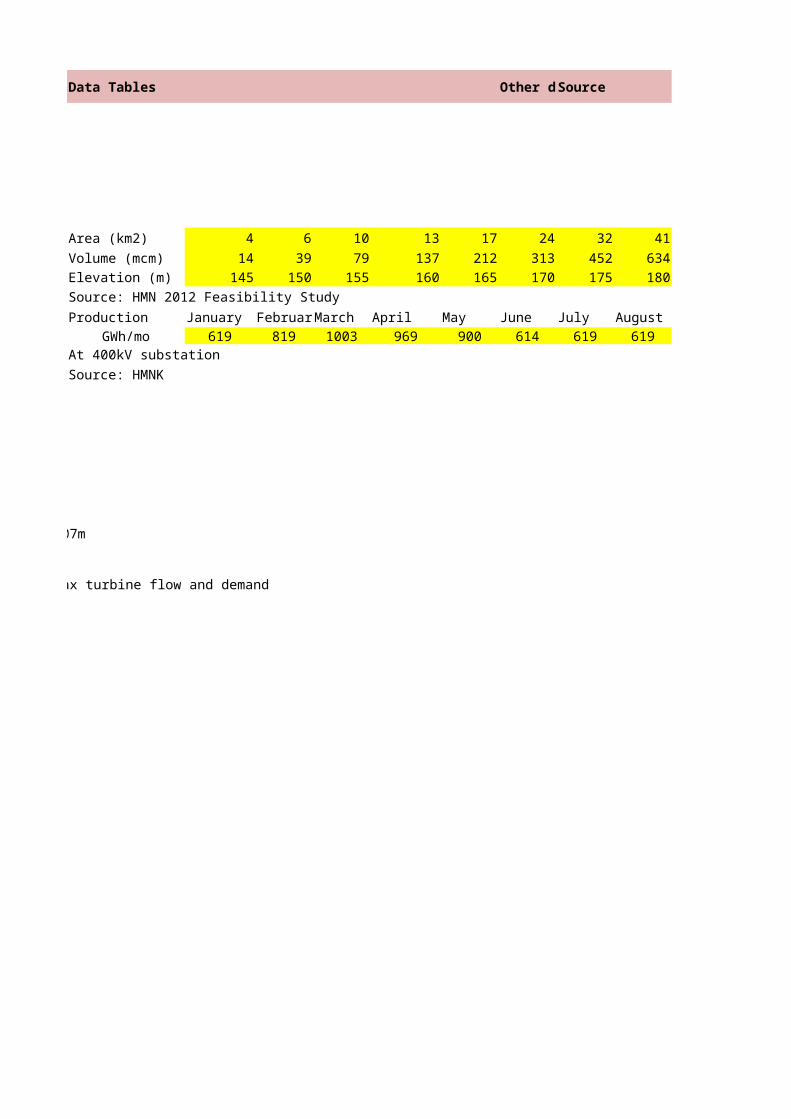
Owner Government of MozambiqueGenerator data Value UnitsEsimated date of commissioning 2018 yearEstimated annual production 8,600 GWhEstimated installed capacity 1,500 MWEstimated availability (net of planned and forced outages) 91% %Generating efficiency 94% %Maximum turbine flow 2730 cmsEstimated monthly production (if it varies by month) see table GWhReservoir dataDate of commissioning (reservoir) 2018 yearReservoir storage capacity 2,324 mcmSurface area 97 km2Volume-elevation curve see tableMaximum hydraulic flow N/A cmsReservoir elevation when full 207 mReservoir net evaporation (net of rainfall) see HCB mm/moOperating zones (top of conservation, buffer, inactive) 205 is TOC % or mcTailwater elevation 140 m
Cahora Bassa North Bank
Owner HCBGenerator dataEstimated date of commissioning 2017Estimated annual production 2,835 GWhEstimated installed capacity 1,245 MWEstimated availability (net of planned and forced outages) 97% %Generating efficiency 94% %Maximum turbine flow 1210 cmsBoromaOwnerEstimated annual production 1,168 GWhEstimated installed capacity 160 MWEstimated availability (net of planned and forced outages) 93 %Generating efficiency 94 %Maximum turbine flow 1115 cmsFixed head height 17 m LupataOwnerEstimated annual production 4,171 GWhEstimated installed capacity 550 MW
Estimated availability (net of planned and forced outages) 93 %
Generating efficiency 94 %Maximum turbine flow 2410 cmsFixed head height 27 m Ruo

Owner EDM
Estimated annual production GWhEstimated installed capacity 100 MWEstimated availability (net of planned and forced outages) 93 %Generating efficiency 94 %Maximum turbine flow cmsFixed head height m ChembaOwnerGenerator dataEstimated annual production 8,760 GWhEstimated installed capacity 1,040 MWEsatimted availability (net of planned and forced outages) 93 %Generating efficiency 94 %Maximum turbine flow (if relevant) cmsReservoir dataProjected reservoir storage capacity 20,080 mcmSurface area 1,400 km2Volume-elevation curve Reservoir elevation when full 98 mEsimated reservoir net evaporation (net of rainfall) mm/moHead 43 mAncuaze-Sinjal IOwnerEstimated annual production 2,230 GWhEstimated installed capacity 330 MWEstimated availability (net of planned and forced outages) 93 %Generating efficiency 94 %Maximum turbine flow cmsFixed head height 13 m Ancuaze-Sinjal IIOwnerEstimated annual production 4,460 GWhEstimated installed capacity 600 MWEstimated availability (net of planned and forced outages) 93 %Generating efficiency 94 %Maximum turbine flow cmsFixed head height 27 m Luia River Hydro (7.6)OwnerEstimated annual production 600 GWhEstimated installed capacity 267 MWEstimated availability (net of planned and forced outages) 93 %Generating efficiency 94 %Maximum turbine flow cmsFixed head height 90 m Capoche River Hydro (7.11)OwnerEstimated annual production 250 GWhEstimated installed capacity 60 MWEstimated availability (net of planned and forced outages) 93 %Generating efficiency 94 %Maximum turbine flow cmsFixed head height 88 m

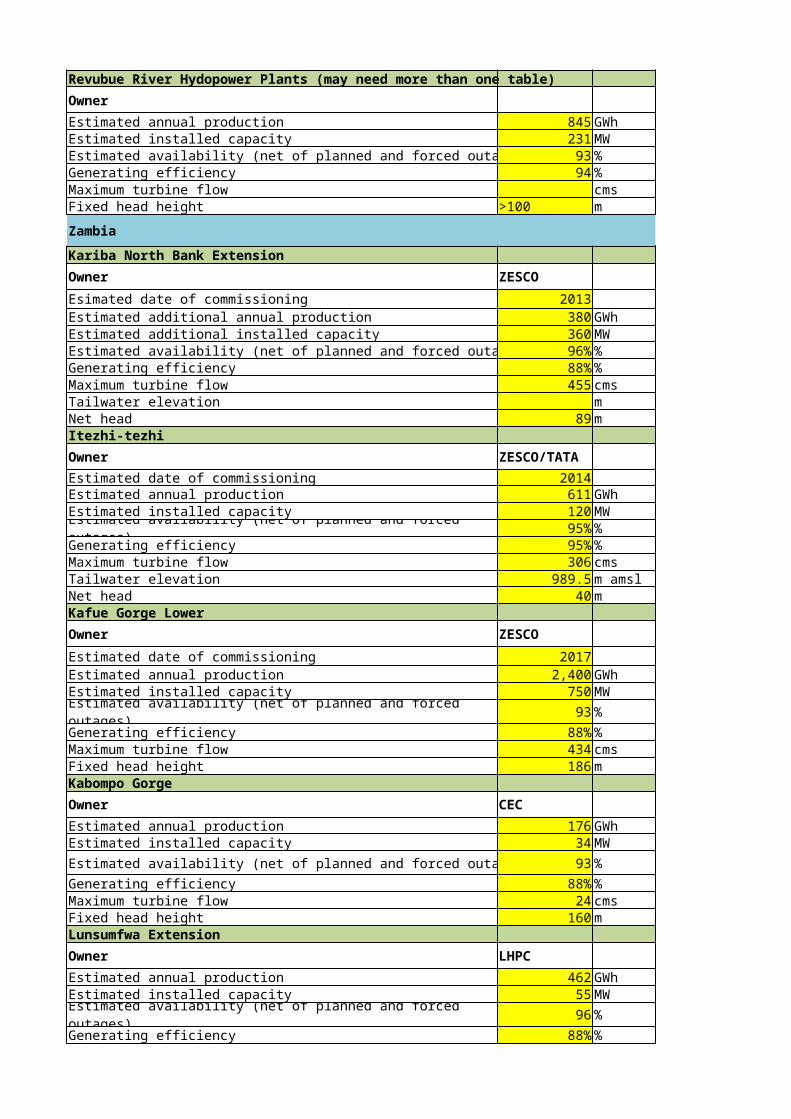
Revubue River Hydopower Plants (may need more than one table)OwnerEstimated annual production 845 GWhEstimated installed capacity 231 MWEstimated availability (net of planned and forced outages) 93 %Generating efficiency 94 %Maximum turbine flow cmsFixed head height >100 m
Zambia
Kariba North Bank ExtensionOwner ZESCOEsimated date of commissioning 2013Estimated additional annual production 380 GWhEstimated additional installed capacity 360 MWEstimated availability (net of planned and forced outages) 96% %Generating efficiency 88% %Maximum turbine flow 455 cmsTailwater elevation m Net head 89 mItezhi-tezhiOwner ZESCO/TATAEstimated date of commissioning 2014Estimated annual production 611 GWhEstimated installed capacity 120 MWEstimated availability (net of planned and forced outages) 95% %Generating efficiency 95% %Maximum turbine flow 306 cmsTailwater elevation 989.5 m amslNet head 40 mKafue Gorge LowerOwner ZESCOEstimated date of commissioning 2017Estimated annual production 2,400 GWhEstimated installed capacity 750 MWEstimated availability (net of planned and forced outages) 93 %Generating efficiency 88% %Maximum turbine flow 434 cmsFixed head height 186 m Kabompo GorgeOwner CECEstimated annual production 176 GWhEstimated installed capacity 34 MWEstimated availability (net of planned and forced outages) 93 %Generating efficiency 88% %Maximum turbine flow 24 cmsFixed head height 160 m Lunsumfwa ExtensionOwner LHPCEstimated annual production 462 GWhEstimated installed capacity 55 MWEstimated availability (net of planned and forced outages) 96 %Generating efficiency 88% %
Maximum turbine flow 19 cmsFixed head height 330.5 m MkushiOwner CECEstimated annual production 223 GWhEstimated installed capacity 65 MWEstimated availability (net of planned and forced outages) 93 %Generating efficiency 88% %Maximum turbine flow 21 cmsFixed head height 357 m Batoka GorgeOwner/Developer ZRA Estimated date of commissioning 2018Estimated annual production 8,728 GWhEstimated installed capacity 1,600 MWEstimated availability (net of planned and forced outages) 93%Generating efficiency 88 %Maximum turbine flow 1,220 cmsProjected reservoir storage capacity 1,680 mcmSurface area 25.6 km2Volume-elevation curve see tableReservoir elevation when full 762 mTailwater elevation 596 mNet head 166 mDevil's GorgeOwner/Developer ZRA Estimated date of commissioning 2017Estimated annual production 5,604 GWhEstimated installed capacity 1,240 MWAvailability 93 %Generating efficiency 88 %Maximum turbine flow 1,515 mcmProjected reservoir storage capacity 31,200 mcmSurface area 710 km2Volume-elevation curve see tableReservoir elevation when full 592 mTailwater elevation 488.5 mNet head 103.5Mupata - NOT USEDOwner/Developer ZRA Estimated date of commissioning 2018Estimated annual production 7,570 GWhEstimated installed capacity 1,000 MWAvailability 93 %Generating efficiency 88 %Projected reservoir storage capacity 20,400 mcmSurface area 1,250 km2Volume-elevation curve see tableReservoir elevation when full 381 mTailwater elevation 326 mNet head 55 mZimbabweKariba South Bank ExtensionOwner

Estimated date of commissioning 2015Estimated additional annual production 1,183 GWhEstimated additional installed capacity 300 MWEstimated availability (net of planned and forced outages) 93% %Generating efficiency 88% %Maximum turbine flow 425 cmsTailwater elevation m MalawiTanzania
Source Comment Data Tables
Government of MozambiqueSource CommentHMNKHMNK net of own consumption and step up loss 0.654 Area (km2)HMNK SAPP CC Aug 2012 concurs Volume (mcm)HMNK Elevation (m)HMNK Source: HMN 2012 Feasibility StudyHMNK necessary to meet capacity rating (HMNK 622 cms) ProductionHMNK GWh/mo
At 400kV substationSource: HMNK
HMN 2012 Feasibility Study at 205m amslHMN 2012 Feasibility Study at 205m amslHMN 2012 Feasibility Study
HMN 2012 Feasibility Study this is top of conservationHMN 2012 Feasibility Study same as Cahora BassaHMN 2012 Feasibility StudyHMN 2012 Feasibility Study estimate from rated head of 67m and normal top of 207m
treated as expansion of existing plant - increase max turbine flow and demanduses existing reservoir at Cahora Bassa
SAPP TW2 inputNexant (2007) in peak use configuration 0.26SAPP CC report on new projects (Aug 2012)HCB
as per HCB originalestimated to match rated capacity
estimated from EuroConsultant Mott McDonald load factor (3240 GWh for 444MW) 0.833SAPP 2012 hydro; and EDM
default value from Nexant 2007as per Mphanda Nkuwaestimated to match rated capacity
Euroconsult Mott McDonald (20142m amsl
estimated from EuroConsultant Mott McDonald load factor (4960 GWh for 654 MW) 0.866EDM and SAPP 2012 hydro
default value from Nexant 2007
as per Mphanda Nkuwaestimated to match rated capacity
Euroconsult Mott McDonald (20125m amsl

0EDM powerpoint slide
default value from Nexant 2007as per Mphanda Nkuwa
it appears that Chemba and Ancuaze Sinjal may be mutually exclusive
0.962Euroconsult Mott McDonald 2007Nexant (2007) default value from Nexant 2007
as per Mphanda Nkuwamaximum reservoir outflow due to hydraulic constraints, if appropriate
est using GRandD database equationEuroconsult Mott McDonald 2007
reservoir depth est using HCB characteristicsEuroconsult Mott McDonald 20 full supply level is 98m
3052 mcm/yr in Euroconsult main reportEuroconsult Mott McDonald 200dam height 50m
Euroconsult Mott McDonald (2007) 0.771Euroconsult Mott McDonald (2007)
default value from Nexant 2007as per Mphanda Nkuwa
98m amsl
Euroconsult Mott McDonald (2007) 0.849Euroconsult Mott McDonald (2007)
default value from Nexant 2007as per Mphanda Nkuwa
98m amsl
Euroconsult Mott McDonald (2007) 0.257Euroconsult Mott McDonald (2007)
default value from Nexant 2007as per Mphanda Nkuwamaximum flow possible through the turbines from design
0.476Euroconsult Mott McDonald (2007)
default value from Nexant 2007as per Mphanda Nkuwamaximum flow possible through the turbines from design

231 MW over 3 plants according to Euroconsult Mott McDdefault value from Nexant 2007as per Mphanda Nkuwamaximum flow possible through the turbines from design
SAPP TW2 inputMEWD (2010)MEWD (2010) 0.12
to match max turbine flow to MW capacity
MEWD (2010) note that this is far more than necessary for very low production levelsas per Kariba North original
MEWD (2010)
SAPP TW2 inputMEWD (2010) 58%Nexant (2007); MEWD (2010)MEWD (2010) plant factor is 95% so availability must be this or greater
set to match rated capacity and max flowMEWD (2010) maximum flow possible through the turbines from design
reservoir when full less net headMEWD (2010)
SAPP TW2 inputMEWD (2010)MEWD (2010) 0.365
default value from Nexant 2007as per Kafue Upper
MEWD (2010) maximum flow possible through the turbines from designMEWD (2010)
small (289 MCM) reservoir not modelled
MEWD (2010)MEWD (2010) 0.591
default value from Nexant 2007as per Kafue Upper
MEWD (2010)MEWD (2010)
MEWD (2010)MEWD (2010) 0.959MEWD (2010)
as per Kafue Upper

MEWD (2010)MEWD (2010)
MEWD (2010)MEWD (2010) 0.392
default value from Nexant 2007as per Kafue Upper
MEWD (2010)MEWD (2010)
SAPP TW2 inputZRA 727ZRA 800 MW on each side (MEWD concurs) 62% Area (km2)
ZRA Volume (mcm)necessary to meet capacity rating Elevation (m)
ZRAZRA
ZRA Eurconsult has same headZRA
SAPP TW2 inputZRA 467ZRA 620 MW on each side (MEWD says 500) 0.516
Volume (mcm)ZRA Elevation (m)
ZRA Area (km2)ZRA Euroconsult says 762
ZRAZRA
Eurconsult has head of 110m
SAPP TW2 inputZRA 3785ZRA 500 MW each side (MEWD says 543) 0.864
ZRAZRAZRA Elevation (m)
Area (km2)ZRA Volume (mcm)ZRA

SAPP TW2 inputNexant (2007)Euroconsult and SAPP 2012 hydro 0.45
default value from Nexant 2007as per Kariba South originalestimated to match rated capacityas per Kariba South existing

Other dSource
4 6 10 13 17 24 32 41 51 62 73 84 9714 39 79 137 212 313 452 634 863 1,144 1,480 1,872 2,324
145 150 155 160 165 170 175 180 185 190 195 200 205Source: HMN 2012 Feasibility Study
January FebruarMarch April May June July August SeptembOctoberNovembDecembTotal619 819 1003 969 900 614 619 619 600 619 600 619 8600
At 400kV substation
treated as expansion of existing plant - increase max turbine flow and demand

surface headHCB est est avg
storage 52000 27266 20327.27 23797surface 2670head 110res depth 36 18.876 14.07273 13.902
surface head est storage est
Using GRanD equation 20,080

full1.30 3.80 5.65 9.22 12.48 16.15 20.24 25.07 30.72 37.31
0 51 146 294 511 798 1161 1615 2172 2853620 640 660 680 700 720 740 760 780 800
83.6 153.5 384.2 760 1001.8 2040 2995.1 4182.3 5643.2 7443.1 9662.7 12218 15853468 476 484 492 500 508 516 524 532 540 548 556 564
8.8 21.5 37 56.8 80 104.3 132.7 165.4 203.1 246.7 297.3 352.9 424.6
full350 354 358 362 366 370 372 374 376 378 380 406
90 170 295 460 620 785 865 940 1025 1105 1190 2630800 1600 2800 4300 6400 8800 10300 11900 13800 16000 18500 64700
109 123 1362,838 3,418 4,065
210 215 220

full at 59219560 23268 28547 33947 83.6 468
572 580 588 596 153.5 476384.2 484
497 570 666 762 760 4921001.8 500
2040 5082995.1 5164182.3 5245643.2 5327443.1 5409662.7 548
12218.2 55615853.3 56419560.4 57223267.5 580
28547 58833947 596
Note - detailed sources given in "existing" and "future" sheets
Plant Name Country River Status Type OwnerMW GWh
Cahora Bassa Mozambique Zambezi Existing Storage HCB 2075 15500Kafue Gorge UppeZambia Kafue Existing Storage ZESCO 990 5034Kariba North BankZambia Zambezi Existing Storage ZESCO 720 3282Victoria Falls Zambia Zambezi Existing RoR ZESCO 108 662Mulungushi Zambia Mulungushi Existing Storage LHPC 20 80Lunsemfwa Zambia Lunsemfwa Existing Storage LHPC 18 113Itezhi-tezhi ReservZambia Kafue Existing Storage ZESCOKariba South Zimbabwe Zambezi Existing Storage ZESA 750 4000Nkula Falls A Malawi Shire Existing RoR ESCOM 24 161Nkula Falls B Malawi Shire Existing RoR ESCOM 100 575Tedzani I & II Malawi Shire Existing RoR ESCOM 40 276Tedzani III Malawi Shire Existing RoR ESCOM 52 312Kapichira I Malawi Shire Existing RoR ESCOM 64 427Mphanda Nkuwa Mozambique Zambezi Planned RoR Mozambiqu 1,500 8,600Cahora Bassa NorMozambique Zambezi Planned Storage HCB 1,245 2,835Boroma Mozambique Zambezi Studied RoR EdM 160 1168Lupata Mozambique Zambezi Studied RoR EdM 550 4171Ancuaze-Sinjal Mozambique Zambezi Studied RoR EdM 330 2230Ancuaze-Sinjal Mozambique Zambezi Studied RoR EdM 600 4460Chemba Mozambique Zambezi Studied Storage EdM 1,040 8,760Kariba South Ext Zimbabwe Zambezi Planned Storage ZESA 300 1,183Kariba North BankZambia Zambezi Planned Storage ZESCO 360 380Kafue Gorge LoweZambia Kafue Planned RoR ZESCO 750 2,400Itezhi-Tezhi Zambia Kafue Studied Storage ZESCO/TA 120 611Mkushi Zambia Mkushi Storage LHPC 65 223Batoka Gorge Zam/Zim Zambezi Planned RoR ZRA 1,600 8,728Devil's Gorge Zam/Zim Zambezi Studied Storage ZRA 1,240 5,604Mupata Zam/Zim Zambezi Storage ZRA 1,000 7,570Lunsemfwa Ext Zambia Lunsemfwa Planned Storage LHPC 55 462Kabompo Gorge Zambia Kabompo Planned Storage CEC 34 176Kapichira II Malawi Shire Planned RoR ESCOM 64 469Kholombidzo Malawi Shire Planned RoR ESCOM 100Nachimbeya Malawi Shire Planned RoR ESCOM ?Mpatamanga Malawi Shire Planned RoR ESCOM 3105.8 Mozambique Revubue Studied Storage EdM 36 1555.9 Mozambique Revubue Studied RoR EdM 110 3105.13 Mozambique Revubue Studied Storage EdM 85 3807.6 Mozambique Luia Studied Storage EdM 267 6007.11 Mozambique Capoche Studied Storage EdM 60 250Ruo Mozambique Ruo/Shire Concept EdM 100Lower Fufu Malawi South Rukuru Planned RoR ESCOM 90 570Masigira Tanzania Ruhuhu Studied RoR TANESCO 118 630Rumakali Tanzania Rumakali Studied Storage TANESCO 222 1,320North Rumphi Malawi North Rumphi Studied ESCOMSongwe Malawi Songwe Identified ESCOM 150 930Upper Fufu Malawi South Rukuru Identified RoR 70-145Henga Valley Malawi South Rukuru Identified RoR 20-40
Sources (incidated by the color of the text)
Installed capacity
Average annual generation
Euroconsult, and Mott MacDonald. Integrated Water Resources Management Strategy and Implementation Plan for the Zambezi River Basin. Final Report, Rapid AssessmentBurian, Martin, Peter Zhou, Francis Masawi, Francis Yamba, and Florian Baumgard. Analysis of Grid Emission Factors for the Electricity Sector in Sub-Saharan Africa

SAPP 2012 Hydropower supply and demand as at 2011 (May 2012 from SAPP CC - Maviya)Nexant 2007 StudyMEWD 2010 Zambia Power Development Master Plan 2010-2030SAPP Input to Second Team Workshop Aug 2012Malawi HPP presentationEDM Statistical Summary Report 2011Beilfuss 2001 Vol 4ZRA Combined Plants in Modelling
HPP 5.8-9-13 Mozambique Revubue Studied7.6-11 Mozambique Luia & CapochStudiedLuns_Mulung Zambia Lunsemfwa Existing combines Lunsemfwa and Mulugushi
Small Plants not included in analysisLusiwasi Zambia Lusiwasi Existing Storage ZESCO 12Lusiwasi Ext Zambia Lusiwasi Planned Storage ZESCO 40Wovwe Malawi Wovwe Existing RoR ESCOM 5
Plants outside Zambezi River Basin
Kalungwishi 218Kabwelume Falls Zambia Kalungwishi/Congo Storage Lunzua Powe 62Kundabwika FallsZambia Kalungwishi/Congo Storage Lunzua Powe 101Mumbotuta Falls Zambia Luapula/Congo RoR? CEC? 301Corumana Mozambique Incomati storage 12 37Mavuzi Mozambique Buzi storage 50 237Chicamba Mozambique Buzi Storage 50 79Massingir Mozambique Limpopo Planned storgage Agua Imara 27Lurio Mozambique Lurio Feasibility RoR EdM 120 no firm powerMoamba Major Mozambique Southern Moz Feasibility Storage EdM <10Alto Malema Mozambique Malema/Lurio Feasibility Storage Agua Imara 60
Fossil Fuel plantsNgana Malawi Planned 300
includes two sub-projects

Net evap Longm M m3 km2 m amsl m amsl % % mm/mo deg E
116 65000 2670 326 202 32.755394 785 805 976.6 582
95 64798 5577 488.5 384-405 29113 N/A N/A N/A325 31 28.833380 45 29.1
40 5624 374 1029.595 64798 5577 488.5 2952 N/A N/A N/A 34.83357 N/A N/A N/A 34.83337 N/A N/A N/A 34.76742 N/A N/A N/A 34.76754 N/A N/A N/A 34.7567 2324 97 207 140 33.25
116 existing storage 32.75517 N/A N/A 33.4527 N/A N/A 3413 N/A N/A 34.8527 N/A N/A 34.8543 20,080 1,400 98 55 34.86795 existing storage 2995 existing storage
186 N/A80 existing storage 26.037
357166 1,680 25.6 762 596 26.15
103.5 31,200 710 592 488.5 26.8555 20,400 1,250 381 326
113 existing storage160 289 28
54 N/A 2 N/A 34.75N/A N/A N/A 34.9N/A N/A N/A 34.867N/A N/A N/A 34.733
71 33.917155 N/A N/A 33.917
99 33.7590 32.91788 32.8
336 N/A N/A N/A 90 34.25238 N/A N/A N/A 34.15
N/A N/A N/A 3434.217
33.46
Average Head
Reservoir capacity
Surface area when full
Reservoir elevation when full
Tail elevation
Availa-bility
Gen effici-ency
Integrated Water Resources Management Strategy and Implementation Plan for the Zambezi River Basin. Final Report, Rapid Assessment. Gaborone, Botswana and Lusaka, Zambia: South African Development Community Water Division and Zambezi River Authority, December 2007. Table A3.1 p. 173Analysis of Grid Emission Factors for the Electricity Sector in Sub-Saharan Africa. Roskilde, Denmark: UNEP Risoe Centre, 2012
530 8 31.1530 8 31.1510 N/A N/A N/A 34.15
no firm power

Latitude Avg flowsdeg S m m km2 cms year-15.588 171 303 900000 2,4,13 2800 1976-77
1968-17 128 617 663800 6,8,13 1959
1972-14.717 40 50 5 1955-14.483 80 500 5 1944
1977-17 128 617 663800 6,8,13 1730 1958
-15.517 21 360 136200 3 420 1966-15.517 21 360 136200 3 420 1981
-15.55 136200 3 420 1977-15.55 136200 3 420 1995
-15.883 26 380 136200 3 420 2000-15.8 85 400 929000 2,4,13 3370 2018
-15.588 171 303 900000 2,4,13 2800 2017-16 38 280 938000 2,4-13 3370
-16.633 47 350 1017000 2,4-13 3600-17.017 20 1000 1017000 2,4-13 3600-17.017 20 1000 1017000 2,4-13 3600
-17.01 50 9500 1025000 2,4-13 3600-17 128 617 663800 6,8,12 1730 2015
20132017
-15.8 65 1800 105620 7 284 2014
-17.867 6,8,13 2018-17.983 6,8-13 2017
2018
2300-15.883 26 380 136200 3 420 2013-15.383 30 3-15.433 3-15.717 60 3 2018-15.417 90 450 8245 2 32-15.583 35 300 8380 2 33-15.917 65 660 14555 2 62
-15.5 110 480 27111 2 138-15.25 100 400 12453 2 53
-10.7 17 160 11993 3 37.1 2015-9.717 35 700 2680 3 40.3-9.317 70 770 414 3 13.1
-10.633 8 60 690 3 12.9-9.62 3
Dam Height
Dam Length
Catch-ment area
MSIOA sub-basin
Commis-sion
. Gaborone, Botswana and Lusaka, Zambia: South African Development Community Water Division and Zambezi River Authority, December 2007. Table A3.1 p. 173. Roskilde, Denmark: UNEP Risoe Centre, 2012

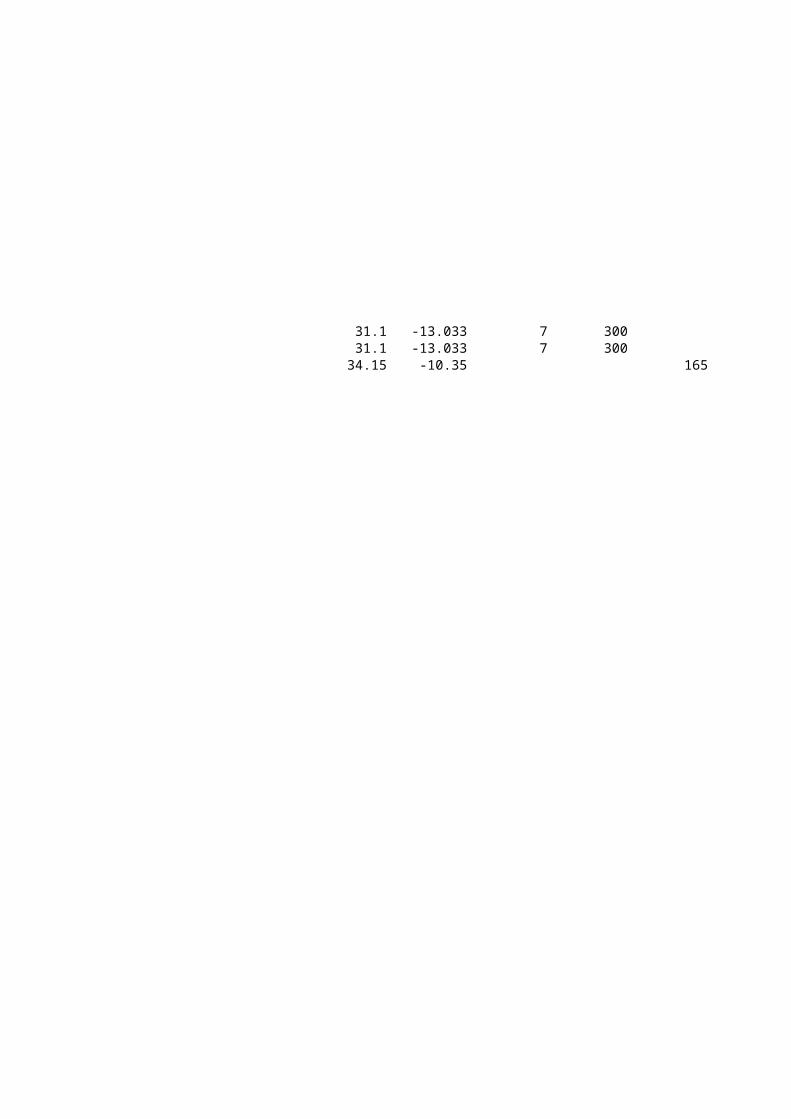
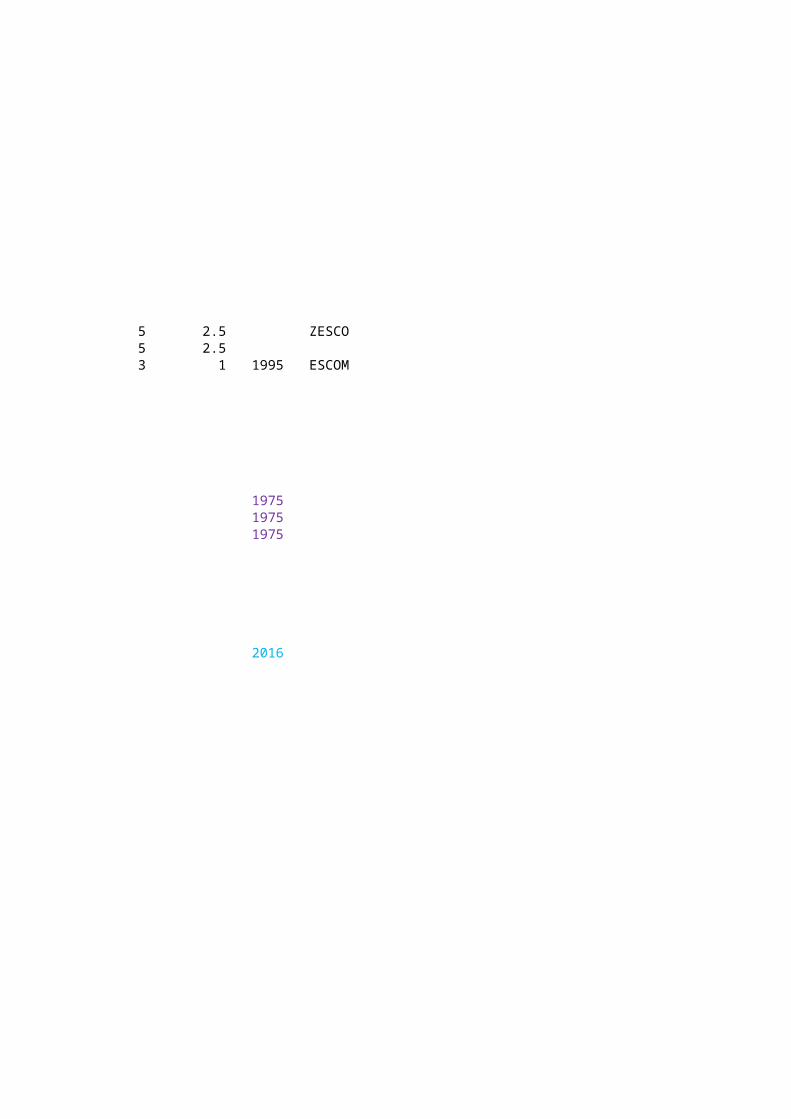
-13.033 7 300 5 2.5 ZESCO-13.033 7 300 5 2.5
-10.35 165 3 1 1995 ESCOM
197519751975
2016

. Gaborone, Botswana and Lusaka, Zambia: South African Development Community Water Division and Zambezi River Authority, December 2007. Table A3.1 p. 173

Zambia Hydropower Facilities 2010
Plant Name River/ Location TypeMW
ZESCOKafue Gorge Upper Kafue RoR 990.000Kariba North Bank Zambezi Storage 720.000Victoria Falls Zambezi RoR 108.000Lusiwasi Lusiwasi Storage 12.000Musonda Falls Luapula RoR 5.000Chishimba Falls N. Province RoR 6.000Lunzua River N. Province RoR 0.750LunsemfwaMulungushi Mulungushi Storage 20.000Lusemfwa Lunsemfwa Storage 18.000Total 1879.750
Diesel facilities owned by ZESCO
Plant Name Installed capacityMW
Mwinilunga 1.360Kabompo 1.160Zambezi 0.960Mufumbwe 0.400Luangwa 1.280Lukulu 0.512Chama 0.263Kaputa 0.550Chavuma 0.800Total 7.285
SAPP 2011 Report (May 2012 from SAPP CC)Nexant StudyMEWD 2010 Zambia Power Development Master Plan 2010-2030SAPP Input to Second Team Workshop
Plant Name River/ Location Owner Type
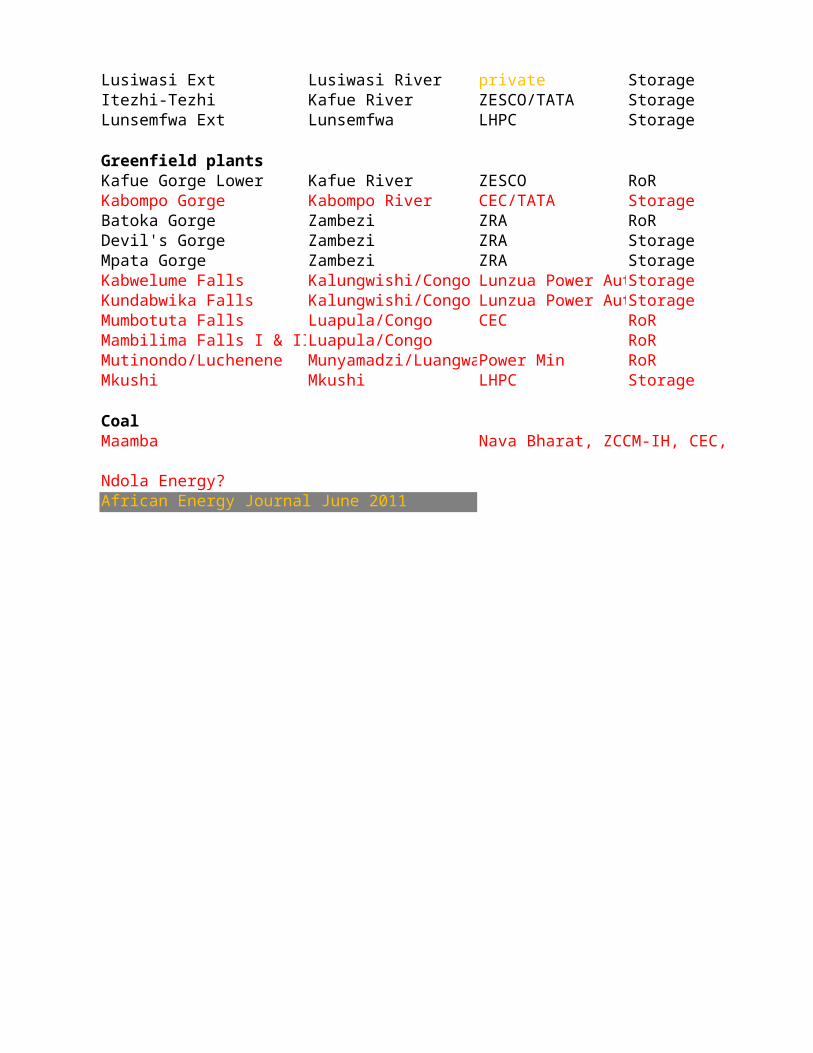
Extensions/BrownfieldKariba North Bank ExtenZambezi ZESCO StorageLusiwasi Ext Lusiwasi River private StorageItezhi-Tezhi Kafue River ZESCO/TATA StorageLunsemfwa Ext Lunsemfwa LHPC Storage
Installed capacity
Euroconsult, and Mott MacDonald. Integrated Water Resources Management Strategy and Implementation Plan for the Zambezi River Basin. Final Report, Rapid AssessmentBurian, Martin, Peter Zhou, Francis Masawi, Francis Yamba, and Florian Baumgard.

Greenfield plantsKafue Gorge Lower Kafue River ZESCO RoRKabompo Gorge Kabompo River CEC/TATA StorageBatoka Gorge Zambezi ZRA RoRDevil's Gorge Zambezi ZRA StorageMpata Gorge Zambezi ZRA StorageKabwelume Falls Kalungwishi/Congo Lunzua Power AutStorageKundabwika Falls Kalungwishi/Congo Lunzua Power AutStorageMumbotuta Falls Luapula/Congo CEC RoRMambilima Falls I & II Luapula/Congo RoRMutinondo/Luchenene Munyamadzi/Luang Power Min RoRMkushi Mkushi LHPC Storage
CoalMaamba Nava Bharat, ZCCM-IH, CEC,
Ndola Energy?African Energy Journal June 2011

2010
Generation commisionGWh year
6788 19682766 1976
722 1968-72
329 19551944
MW
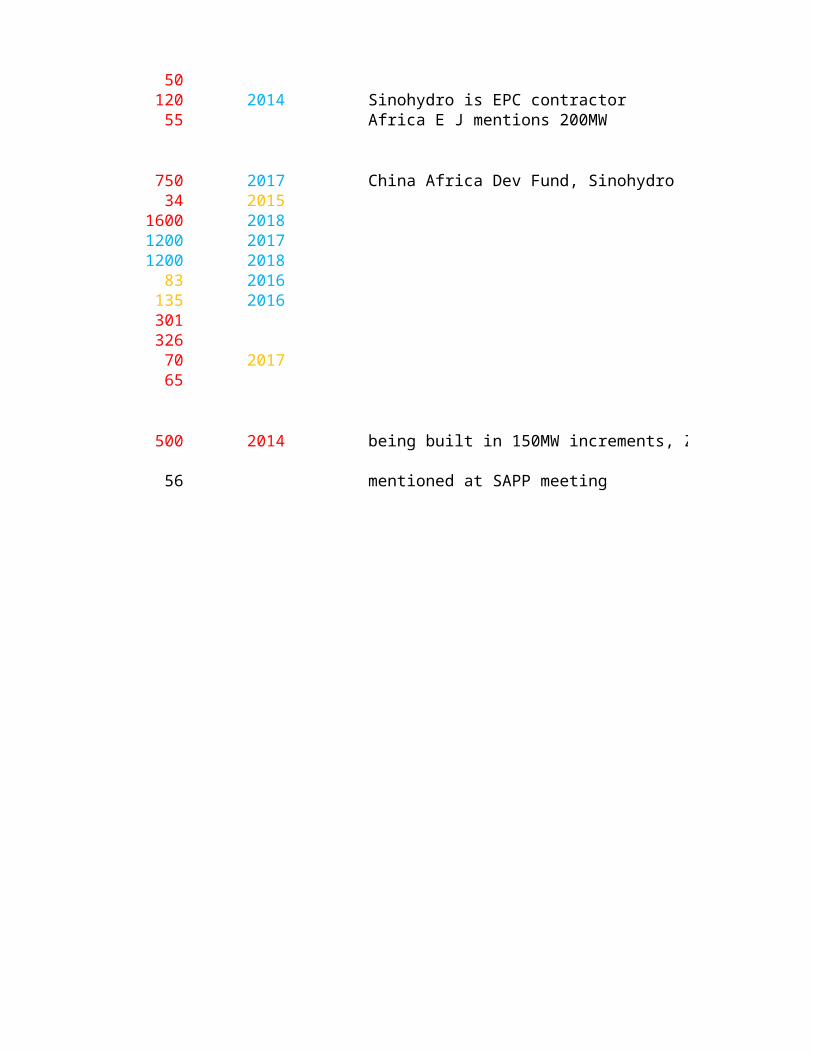
360 2013 China Ex-Im Bank, Sinohydro is EPC contractor50
120 2014 Sinohydro is EPC contractor55 Africa E J mentions 200MW
Integrated Water Resources Management Strategy and Implementation Plan for the Zambezi River Basin. Final Report, Rapid AssessmentBurian, Martin, Peter Zhou, Francis Masawi, Francis Yamba, and Florian Baumgard. Analysis of Grid Emission Factors for the Electricity Sector in Sub-Saharan Africa. Roskilde, Denmark: UNEP Risoe Centre, 2012
Additional capacity
Est. start year
750 2017 China Africa Dev Fund, Sinohydro34 2015
1600 20181200 20171200 2018
83 2016135 2016301326
70 201765
500 2014 being built in 150MW increments, ZESCO reducing share
56 mentioned at SAPP meeting

Integrated Water Resources Management Strategy and Implementation Plan for the Zambezi River Basin. Final Report, Rapid Assessment . Gaborone, Botswana and Lusaka, Zambia: South African Development Community Water Division and Zambezi River Authority, December 2007. Table A3.1 p. 173Analysis of Grid Emission Factors for the Electricity Sector in Sub-Saharan Africa. Roskilde, Denmark: UNEP Risoe Centre, 2012
being built in 150MW increments, ZESCO reducing share

. Gaborone, Botswana and Lusaka, Zambia: South African Development Community Water Division and Zambezi River Authority, December 2007. Table A3.1 p. 173

Mozambique Hydropower Facilities 2010
Plant Name River/ Location TypeMW
EdMCorumana Incomati storage 12Mavuzi Buzi storage 50Chicamba Buzi Storage 50HCBCahora Bassa Zambezi Storage 2,075Total 2,187
Thermal facilities Plant Name Year installed FuelAggreko/ShandukaRessano Garcia 107.0 2012 GasEdMOperationalTemane 3.9 2006 GasEmergency use onlyBeira 12.0 1983 GasIbane Nova 2.2 1999 DieselMaputo 30.0 1973 GasMaputo 23.0 1991 Gas Nampula 5.2 1965 DieselQuelimane 6.8 1980 Diesel
EdM Statistical Report 2009
SAPP 2011 Report (May 2012 from SAPP CC)news article on Aggreko
New power plants for Mozambique
Plant Name River/ Location Developer Type
Extensions/BrownfieldCahora Bassa North Zambezi HCB StorageMavuzi 2&3 Mavuzi EdM storageGreenfield plantsMphanda Nkuwa Zambezi Government of Mo RoRMassingir Limpopo Agua Imara/EdM storgageLurio Lurio EdM+private RoRMoamba Major Southern Moz EdM StorageAlto Malema Malema/Lurio Agua Imara/EdM StorageBoroma Zambezi EdM+private RoRLupata Zambezi EdM+private RoR
Installed capacity
Capacity (MW)
http://www.hcb.co.mz/eng/Empresa/Datas-Relevantes + personal comm Suleiman Combo
Euroconsult, and Mott MacDonald. Integrated Water Resources Management Strategy and Implementation Plan for the Zambezi River Basin. Final Report, Rapid Assessment. Gaborone, Botswana and Lusaka, Zambia: South African Development Community Water Division and Zambezi River Authority, December 2007. Table A3.1 p. 173Burian, Martin, Peter Zhou, Francis Masawi, Francis Yamba, and Florian Baumgard. Analysis of Grid Emission Factors for the Electricity Sector in Sub-Saharan Africa. Roskilde, Denmark: UNEP Risoe Centre, 2012
Ruo EdMAncuaze-Sinjal Zambezi EdM RoRAncuaze-Sinjal Zambezi EdM RoRGas LocationRessano Garcia Ressano Garcia, MapuSasol New Energy/EdMKuvaninga Chokwe, Gaza Enventure/ShandukaCoalMoatize Tete Province Vale (Brazil)Benga Tete Province Rio TintoJSPL Tete Province Jindal Steel & PowerNcondezi Tete Province Ncondezi Coal
EDM Statistical Report 2011 + personal communicationEdM personal communication
SAPP 2011 hydropower supply and demand
Euroconsult, and Mott MacDonald. Integrated Water Resources Management Strategy and Implementation Plan for the Zambezi River Basin. Final Report, Rapid Assessment. Gaborone, Botswana and Lusaka, Zambia: South African Development Community Water Division and Zambezi River Authority, December 2007. Table A3.1 p. 173http://www.gasandoil.com/oilaround/2011/10/mozambique-government-approves-jspls-coal-fired-power-plant (Oct 2011)http://www.esi-africa.com/node/14995 (July 2012)

2010
Generation CommisionGWh year
37 1975 Not in Zambezi237 1975 Not in Zambezi
79 1975 Not in Zambezi
16,290 1977 source of GWh?
http://africa.aggreko.com/news-events/press-releases/power-station-mozambique/
Status from SAPPfrom SAPP 2008MW
1245 Planned >2019 2018 201560 Concept
1500 Planned 2018 2017 201527 Planned N.D. 2009
120 Feasibility N.D. 2015 2012<10 Feasibility
60 Feasibility N.D.200 Feasibility N.D. 2018600 Feasibility N.D. 2017
http://www.hcb.co.mz/eng/Empresa/Datas-Relevantes + personal comm Suleiman Combo
Integrated Water Resources Management Strategy and Implementation Plan for the Zambezi River Basin. Final Report, Rapid Assessment. Gaborone, Botswana and Lusaka, Zambia: South African Development Community Water Division and Zambezi River Authority, December 2007. Table A3.1 p. 173Burian, Martin, Peter Zhou, Francis Masawi, Francis Yamba, and Florian Baumgard. Analysis of Grid Emission Factors for the Electricity Sector in Sub-Saharan Africa. Roskilde, Denmark: UNEP Risoe Centre, 2012
Additional capacity
date from EDM

100 Concept N.D. 2017330 Concept600 Concept
140 Planned 201344.0 under contruction http://enventurepartners.com/portfolio/in-construction/kuvaninga-mozambique/
300 Planned 2015 2015 2000 larger capacity cited in http://www.gasandoil.com/oilaround/2011/10/mozambique-government-approves-jspls-coal-fired-power-plant (2011)500 Planned 2017 2012 2000 and in http://www.esi-africa.com/node/14995 (2012)
2640 2015 maybe only first units by 2015300/1800 2017 for 300
Integrated Water Resources Management Strategy and Implementation Plan for the Zambezi River Basin. Final Report, Rapid Assessment. Gaborone, Botswana and Lusaka, Zambia: South African Development Community Water Division and Zambezi River Authority, December 2007. Table A3.1 p. 173http://www.gasandoil.com/oilaround/2011/10/mozambique-government-approves-jspls-coal-fired-power-plant (Oct 2011)

Integrated Water Resources Management Strategy and Implementation Plan for the Zambezi River Basin. Final Report, Rapid Assessment. Gaborone, Botswana and Lusaka, Zambia: South African Development Community Water Division and Zambezi River Authority, December 2007. Table A3.1 p. 173Analysis of Grid Emission Factors for the Electricity Sector in Sub-Saharan Africa. Roskilde, Denmark: UNEP Risoe Centre, 2012
http://enventurepartners.com/portfolio/in-construction/kuvaninga-mozambique/
larger capacity cited in http://www.gasandoil.com/oilaround/2011/10/mozambique-government-approves-jspls-coal-fired-power-plant (2011)and in http://www.esi-africa.com/node/14995 (2012)maybe only first units by 2015
Integrated Water Resources Management Strategy and Implementation Plan for the Zambezi River Basin. Final Report, Rapid Assessment. Gaborone, Botswana and Lusaka, Zambia: South African Development Community Water Division and Zambezi River Authority, December 2007. Table A3.1 p. 173

. Gaborone, Botswana and Lusaka, Zambia: South African Development Community Water Division and Zambezi River Authority, December 2007. Table A3.1 p. 173

larger capacity cited in http://www.gasandoil.com/oilaround/2011/10/mozambique-government-approves-jspls-coal-fired-power-plant (2011)
. Gaborone, Botswana and Lusaka, Zambia: South African Development Community Water Division and Zambezi River Authority, December 2007. Table A3.1 p. 173

Plant Name Country River OwnerMW GWh M m3 km2 m amsl m m amsl year
Cahora Bassa North Mozambique Zambezi HCB 1245 2835 existing storage 0 0 116 0 2017Mphanda Nkuwa Mozambique Zambezi Mozambiqu 1500 8600 2324 97 207 67 140 2018Batoka Gorge Zam/Zim Zambezi ZRA 1600 8728 1680 25.6 762 166 596 2018Itezhi-Tezhi Zambia Kafue ZESCO/TA 120 611 existing storage 0 0 80 0 2014Devil's Gorge Zam/Zim Zambezi ZRA 1240 5604 31200 710 592 103.5 488.5 2017Mupata Zam/Zim Zambezi ZRA 1000 7570 20400 1250 381 55 326 2018Kariba South Ext Zimbabwe Zambezi ZESA 300 1183 existing storage 0 0 95 0 2015Kariba North Bank ExtensZambia Zambezi ZESCO 360 380 existing storage 0 0 95 0 2013Kafue Gorge Lower Zambia Kafue ZESCO 750 2400 N/A 0 0 186 0 2017Kabompo Gorge Zambia Kabompo CEC 34 176 289 28 0 160 0 Lunsemfwa Ext Zambia LunsemfwaLHPC 55 462 existing storage 0 0 113 0 Boroma Mozambique Zambezi EdM 160 1168 N/A 0 N/A 17 0 Lupata Mozambique Zambezi EdM 550 4171 N/A 0 N/A 27 0 Ancuaze-Sinjal Mozambique Zambezi EdM 330 2230 N/A 0 N/A 13 0 Ancuaze-Sinjal Mozambique Zambezi EdM 600 4460 N/A 0 N/A 27 0 Chemba Mozambique Zambezi EdM 1040 8760 20080 1400 98 43 55 5.9 Mozambique Revubue EdM 110 310 N/A 0 N/A 155 0 Masigira Tanzania Ruhuhu TANESCO 118 630 N/A N/A N/A 238 0 Kapichira II Malawi Shire ESCOM 64 469 N/A 2 N/A 54 0 2013Lower Fufu Malawi South RukuESCOM 90 570 N/A N/A N/A 336 90 2015Kholombidzo Malawi Shire ESCOM 100 N/A N/A N/A 0 0 Nachimbeya Malawi Shire ESCOM ? N/A N/A N/A 0 0 Mpatamanga Malawi Shire ESCOM 310 N/A N/A N/A 0 0 2018Mkushi Zambia Mkushi LHPC 65 223 0 0 0 357 0 Upper Fufu Malawi South Ruku 0 70-145 0 0 0 0 0 Henga Valley Malawi South Ruku 0 20-40 0 0 0 0 0
Installed capacity
Average annual
generationReservoir capacity
Surface area when
full
Reservoir elevation when full
Average Head
Tail elevatio
nCommis-
sion

Dam/Plant Name Country RiverMW year GWh M m3 km2 m amsl m m amsl
Cahora Bassa MozambiquZambezi 2075 1976-77 15500 65000 2670 326 116 202Kafue Gorge Upper Zambia Kafue 990 1968 5034 785 805 976.6 394 581.9Kariba South Zimbabwe Zambezi 750 1958 4000 64798 5577 488.5 95 0Kariba North Bank Zambia Zambezi 720 1959 3282 64798 5577 488.5 95 384-405Victoria Falls Zambia Zambezi 108 1972 662 N/A N/A N/A 112.7 0Mulungushi Zambia Mulungushi 20 1955 80 0 31 0 325 0Lunsemfwa Zambia Lunsemfwa 18 1944 113 0 45 0 380 0Itezhi-tezhi Reservoir Zambia Kafue N/A 1977 N/A 5624 374 1029.5 40 0Nkula Falls A Malawi Shire 24 1966 161 N/A N/A N/A 52 0Nkula Falls B Malawi Shire 100 1981 575 N/A N/A N/A 57 0Tedzani I & II Malawi Shire 40 1977 276 N/A N/A N/A 37 0Tedzani III Malawi Shire 52 1995 312 N/A N/A N/A 42 0Kapichira I Malawi Shire 64 2000 427 N/A N/A N/A 54 0
Installed capacity
Commis-sion
Average annual generation
Reservoir capacity
Surface area when full
Reservoir elevation when full
Average Head
Tail elevation

Plant
Business as UsualOptimisticCahora Bassa North 2022 2017Mphanda Nkuwa 2022 2017Kariba South Extension 2018 2015Kariba North Extension 2014 2013Kafue Gorge Lower 2022 2017Devil’s Gorge 2025 2017Batoka Gorge 2022 2018 yKapichira II 2016 2014Boroma 2025 2020 yLupata 2025 2020 y
Date inRef Scenario
Year of commissioning in each development future