kim banta & brennon sapp
DESCRIPTION
THE RIPPLE EFFECT OF PRINCIPAL BEHAVIOR: Improving Teacher Instructional Practices through Principal-Teacher Interactions. Kim Banta & Brennon Sapp - PowerPoint PPT PresentationTRANSCRIPT

THE RIPPLE EFFECT OF PRINCIPAL BEHAVIOR:Improving Teacher Instructional Practices
through Principal-Teacher Interactions
Kim Banta & Brennon Sapp
A Dissertation Defense presented to the University of Louisville
in partial fulfillment of the requirements of the Degree
of Doctor of Education

To discover how a specific set of principal-teacher interactions affect:
Teacher Instructional Practices Student Performance Frequency & Focus of Teacher Conversations
Page 11
Goal of the StudyKe
y Co
nstr
ucts

Research Questions
Page 11
RQ-1 How will the treatment of principal-teacher interactions affect teachers’ instructional practices?
RQ-2 How will changes in teachers’ instructional practices, initiated by the set of principal-teacher interactions, affect student performance?
RQ-3 How will changes in principal-teacher interactions affect the frequency and focus of teacher conversations with principals, students, and other teachers?

Conceptual Framework
Page 8-11, Figure 1

Organization of Methodology
Research Question Research Design Measures Analysis
1 Teacher Instructional Practices Pretest/Post test
Quality Instruction Rubric (4 Domains &
Overall)ANOVA
2 Student PerformanceSingle Cross-Sectional
Interrupted Time Series
Student Grades & Discipline Referrals
Linear Regression
3Freq & Focus of
Teacher Conversations
Pre-Mid-Post test Teacher & Student Surveys Chi Square

Teacher Instructional PracticesRQ-1
Research Question Research Design Measures Analysis
1 Teacher Instructional Practices Pretest/Post test
Quality Instruction Rubric (4 Domains & Overall)
ANOVA
Methodology
RQ 1 - How will the treatment of principal-teacher interactions affect teachers’ instructional practices?
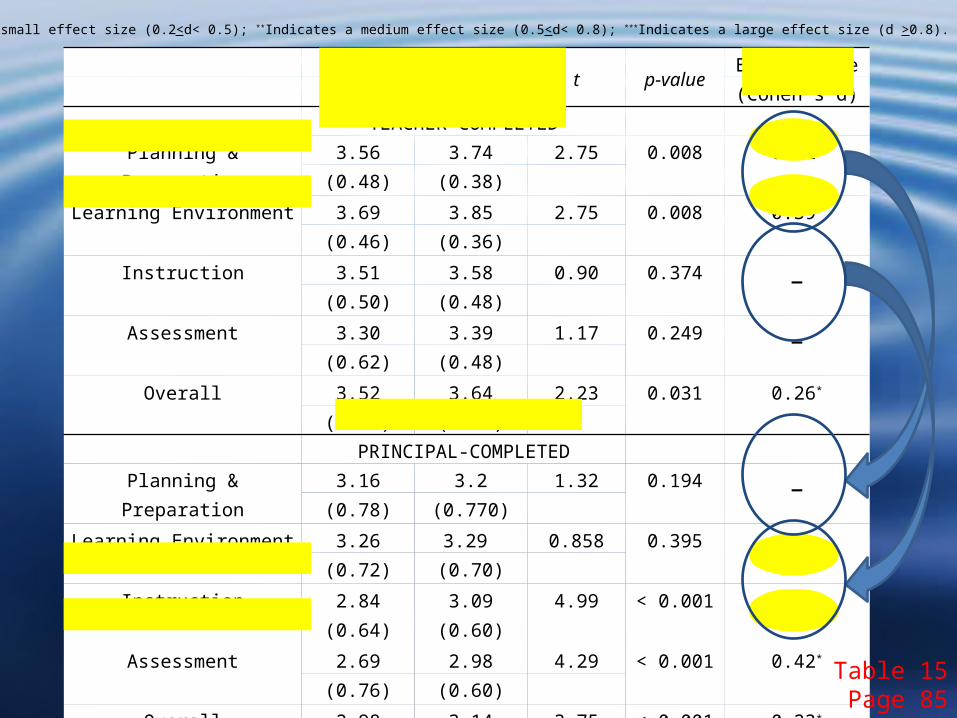
Pre Postt p-value
Effect size(SD) (SD) (Cohen’s d)
TEACHER-COMPLETEDPlanning & Preparation 3.56 3.74 2.75 0.008 0.42*
(0.48) (0.38)
Learning Environment 3.69 3.85 2.75 0.008 0.39*
(0.46) (0.36)
Instruction 3.51 3.58 0.90 0.374 –(0.50) (0.48)
Assessment 3.30 3.39 1.17 0.249 –(0.62) (0.48)
Overall 3.52 3.64 2.23 0.031 0.26*
(0.51) (0.42)
PRINCIPAL-COMPLETED Planning & Preparation 3.16 3.2 1.32 0.194 –
(0.78) (0.770)
Learning Environment 3.26 3.29 0.858 0.395 –(0.72) (0.70)
Instruction 2.84 3.09 4.99 < 0.001 0.40*
(0.64) (0.60)
Assessment 2.69 2.98 4.29 < 0.001 0.42*
(0.76) (0.60)
Overall 2.98 3.14 3.75 < 0.001 0.23*
(0.73) (0.67)
Table 15*Indicates a small effect size (0.2<d< 0.5); **Indicates a medium effect size (0.5<d< 0.8); ***Indicates a large effect size (d >0.8). (Cohen, 1988)
Table 15Page 85

Teacher Instructional Practices(Change in instructional practices)
• Teachers and principals differed in where they perceived improvement.
• According to teachers, instructional practices improved in two domains – Planning & Preparation and Learning Environment.
• According to principals, instructional practices improved in two domains – Instruction and Assessment
• It is more difficult for principals to observe Planning & Preparation. Teachers have closer personal knowledge of Planning & Preparation and Learning Environment.
Pages 110

Teacher Principalt p-value
Effect size
(SD) (SD) (Cohen’s d)
PRETEST Planning & Preparation 3.56 3.16 3.39 0.001 0.62***
(0.48) (0.78)
Learning Environment 3.69 3.26 3.95 < 0.001 0.71***
(0.46) (0.72)
Instruction 3.51 2.84 6.54 < 0.001 1.17***
(0.50) (0.64)
Assessment 3.3 2.69 4.78 < 0.001 0.88***
(0.62) (0.76)
Overall 3.52 2.98 5.03 < 0.001 0.86***
(0.51) (0.73)
POSTESTPlanning & Preparation 3.74 3.2 4.54 < 0.001 0.89***
(0.38) (0.770)
Learning Environment 3.85 3.29 5.42 < 0.001 1.01***
(0.36) (0.70)
Instruction 3.58 3.09 4.65 < 0.001 0.90***
(0.48) (0.60)
Assessment 3.39 2.98 3.95 < 0.001 0.75***
(0.48) (0.60)
Overall 3.64 3.14 5.18 < 0.001 0.89***
(0.42) (0.67) Table 16Page 86

Teacher Instructional Practices(Differences in the Ratings of Instructional Practices)
• Principals’ ratings of instructional practices were significantly different than teacher’s ratings of instructional practices in each domain.
• Principals’ ratings of instructional practices were lower than the teachers instructional practices ratings in each domain.
Page 87-89 & 112

• Principals’ ratings of instructional practices are hypothesized to be more valid and reliable than teachers ratings. – Extensive procedures were used throughout the study to increase the
reliability and validity of principal ratings – (see chapter three).– Principals are trained to be observers of instruction and therefore see
changes in instruction that the teacher may not signify as improvement. (Fullan, 2005b)
– According to Ross, 1985, Schacter & Thum 2004, found that teachers over-rated their quality of instructional practices on effort.
• A review of the literature revealed that within other professions the validity of self evaluations vary depending on the actual quality of the individual performing the self-evaluation. (Dunning et al.,2003; Kruger & Dunning, 1999; and Yariv, 2009)
Page 87-89 & 112
Teacher Instructional Practices(Differences in the Ratings of Instructional Practices)

Grouping Teachers into Performance Levels

p-valueEffect size (Cohen’s d)
p-valueEffect size (Cohen’s d)
p-valueEffect size (Cohen’s d)
Teacher (SD)
Principal (SD)
Teacher (SD)
Principal (SD)
Teacher (SD)
Principal (SD)
PRETEST-HIGH PERFORMING TEACHERS
PRETEST-MEDIUM PERFORMING TEACHERS
PRETEST-LOW PERFORMING TEACHERS
Planning & Preparation
3.60 3.83 0.333 – 3.66 3.28 0.005 0.77** 3.43 2.41 < 0.001 2.52***
(0.56) (0.61) (0.51) (0.47) (0.35) (0.45)Learning
Environment3.68 3.79 0.583 – 3.77 3.47 0.023 0.75** 3.64 2.59 < 0.001 2.13***
(0.46) (0.64) (0.44) (0.35) (0.50) (0.49)Instruction 3.60 3.34 0.168 – 3.53 2.99 0.001 1.28*** 3.42 2.23 < 0.001 2.75***
(0.53) (0.55) (0.55) (0.23) (0.42) (0.45)Assessment 3.34 3.28 0.775 – 3.40 2.85 0.013 1.00*** 3.15 2.02 < 0.001 2.31***
(0.71) (0.66) (0.61) (0.48) (0.54) (0.44)
Overall 3.56 3.56 0.987 – 3.59 3.15 0.002 1.11*** 3.41 2.31 < 0.001 2.80***
(0.50) (0.57) (0.47) (0.31) (0.38) (0.41)
POSTTEST-HIGH PERFORMING TEACHERS
POSTTEST-MEDIUM PERFORMING TEACHERS
POSTTEST-LOW PERFORMING TEACHERS
Planning & Preparation
3.85 4.09 0.072 – 3.68 3.26 0.001 1.27*** 3.70 2.45 < 0.001 3.15***
(0.40) (0.380) (0.33) (0.33) (0.39) (0.40)Learning
Environment3.93 4.03 0.384 – 3.86 3.38 < 0.001 1.81*** 3.78 2.62 < 0.001 2.36***
(0.37) (0.33) (0.31) (0.21) (0.42) (0.56)Instruction 3.77 3.71 0.677 – 3.38 3.17 0.039 0.71** 3.60 2.52 < 0.001 2.22***
(0.51) (0.35) (0.35) (0.23) (0.51) (0.47)
Assessment3.48 3.56 0.642 – 3.32 3.01 0.013 1.03*** 3.37 2.41 < 0.001 2.07***
(0.38) (0.19) (0.52) (0.40)(0.53) (0.50)
Overall 3.76 3.85 0.423 – 3.56 3.21 < 0.001 1.73*** 3.61 2.50 < 0.001 2.87***
(0.39) (0.31) (0.25) (0.14) (0.40) (0.37)
Table 17Page 90

p-valueEffect size (Cohen’s d)
p-valueEffect size (Cohen’s d)
p-valueEffect size (Cohen’s d)
Teacher (SD)
Principal (SD)
Teacher (SD)
Principal (SD)
Teacher (SD)
Principal (SD)
PRETEST-HIGH PERFORMING TEACHERS
PRETEST-MEDIUM PERFORMING TEACHERS
PRETEST-LOW PERFORMING TEACHERS
Planning & Preparation
3.60 3.83 0.333 – 3.66 3.28 0.005 0.77** 3.43 2.41 < 0.001 2.52***
(0.56) (0.61) (0.51) (0.47) (0.35) (0.45)Learning
Environment3.68 3.79 0.583 – 3.77 3.47 0.023 0.75** 3.64 2.59 < 0.001 2.13***
(0.46) (0.64) (0.44) (0.35) (0.50) (0.49)Instruction 3.60 3.34 0.168 – 3.53 2.99 0.001 1.28*** 3.42 2.23 < 0.001 2.75***
(0.53) (0.55) (0.55) (0.23) (0.42) (0.45)Assessment 3.34 3.28 0.775 – 3.40 2.85 0.013 1.00*** 3.15 2.02 < 0.001 2.31***
(0.71) (0.66) (0.61) (0.48) (0.54) (0.44)
Overall 3.56 3.56 0.987 – 3.59 3.15 0.002 1.11*** 3.41 2.31 < 0.001 2.80***
(0.50) (0.57) (0.47) (0.31) (0.38) (0.41)
POSTTEST-HIGH PERFORMING TEACHERS
POSTTEST-MEDIUM PERFORMING TEACHERS
POSTTEST-LOW PERFORMING TEACHERS
Planning & Preparation
3.85 4.09 0.072 – 3.68 3.26 0.001 1.27*** 3.70 2.45 < 0.001 3.15***
(0.40) (0.380) (0.33) (0.33) (0.39) (0.40)Learning
Environment3.93 4.03 0.384 – 3.86 3.38 < 0.001 1.81*** 3.78 2.62 < 0.001 2.36***
(0.37) (0.33) (0.31) (0.21) (0.42) (0.56)Instruction 3.77 3.71 0.677 – 3.38 3.17 0.039 0.71** 3.60 2.52 < 0.001 2.22***
(0.51) (0.35) (0.35) (0.23) (0.51) (0.47)
Assessment3.48 3.56 0.642 – 3.32 3.01 0.013 1.03*** 3.37 2.41 < 0.001 2.07***
(0.38) (0.19) (0.52) (0.40)(0.53) (0.50)
Overall 3.76 3.85 0.423 – 3.56 3.21 < 0.001 1.73*** 3.61 2.50 < 0.001 2.87***
(0.39) (0.31) (0.25) (0.14) (0.40) (0.37)
Table 17Page 90
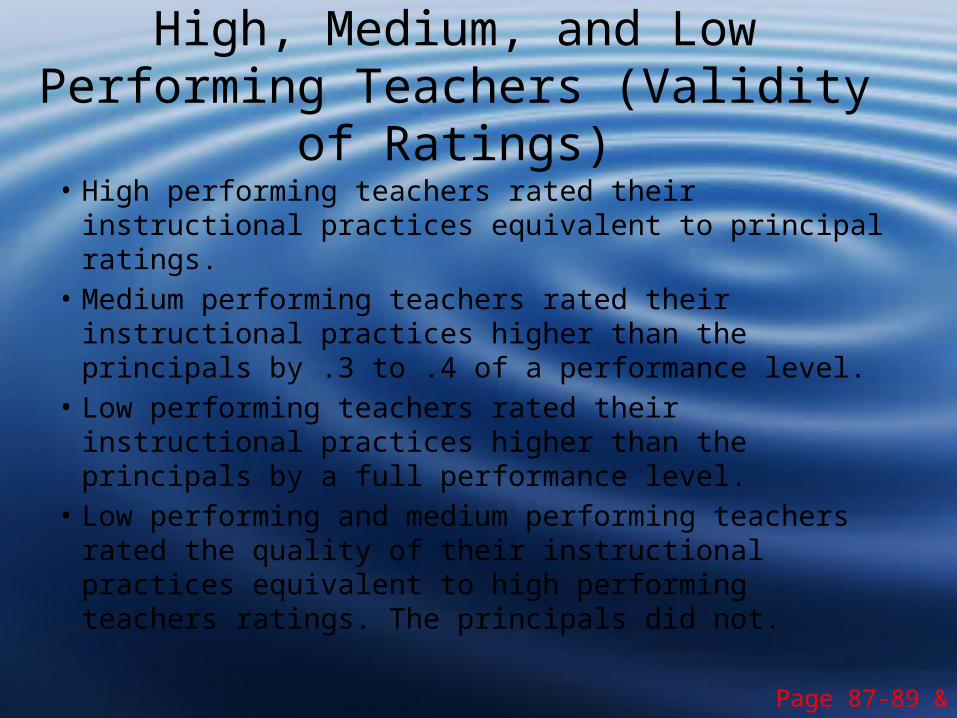
High, Medium, and Low Performing Teachers (Validity of Ratings)
• High performing teachers rated their instructional practices equivalent to principal ratings.
• Medium performing teachers rated their instructional practices higher than the principals by .3 to .4 of a performance level.
• Low performing teachers rated their instructional practices higher than the principals by a full performance level.
• Low performing and medium performing teachers rated the quality of their instructional practices equivalent to high performing teachers ratings. The principals did not.
Page 87-89 & 112

Pretest Posttest
t p-valueEffect size
(SD) (SD) (Cohen’s d)TEACHER-COMPLETED
Planning & Preparation 3.60 3.85 1.82 0.088 –(0.56) (0.40)
Learning Environment 3.68 3.93 4.05 0.001 0.60**
(0.46) (0.37)
Instruction 3.60 3.77 1.63 0.124 –(0.53) (0.51)
Assessment 3.34 3.48 0.96 0.351 –(0.71) (0.53)
Overall 3.56 3.76 2.18 0.046 0.45*
(0.50) (0.39)
PRINCIPAL-COMPLETED Planning & Preparation 3.83 4.09 2.04 0.060 –
(0.61) (0.380)
Learning Environment 3.79 4.03 2.35 0.033 0.47*
(0.64) (0.33)
Instruction 3.34 3.71 3.38 0.004 0.80***
(0.55) (0.35)
Assessment 3.28 3.56 2.42 0.029 0.48*
(0.66) (0.50)
Overall 3.56 3.85 3.18 0.006 0.63**
(0.57) (0.31)
Hig
h P
erfo
rmin
g Te
ache
rs(C
hang
e in
the
Qua
lity
of I
nstr
uctio
nal P
ract
ices
)
Table 18Page 91
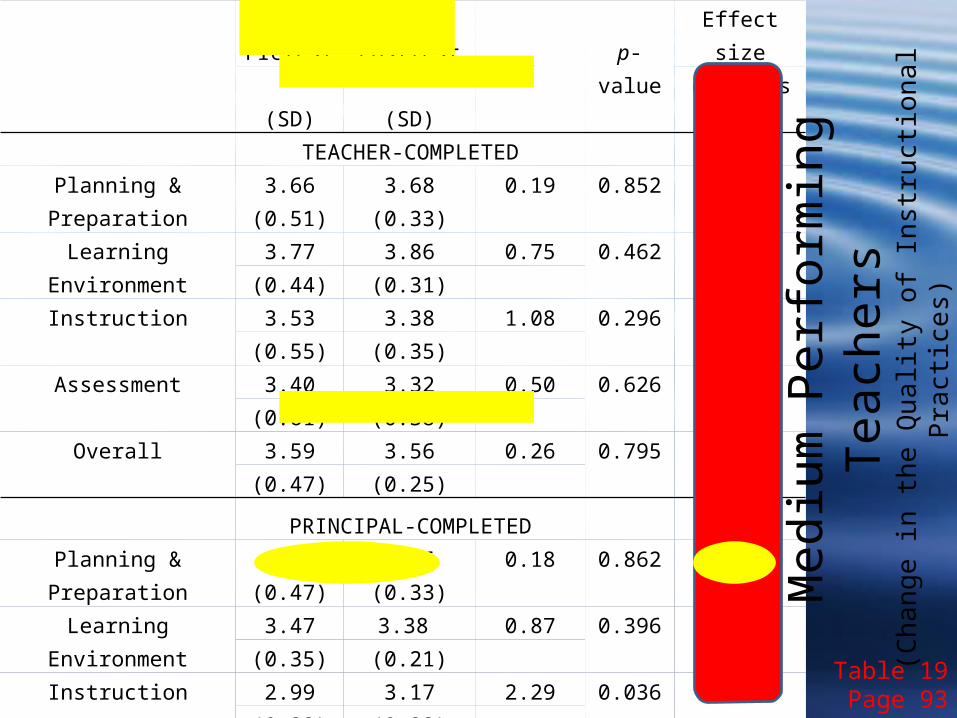
Pretest Posttestt p-value
Effect size
(SD) (SD) (Cohen’s d)TEACHER-COMPLETED
Planning & Preparation 3.66 3.68 0.19 0.852 –(0.51) (0.33)
Learning Environment 3.77 3.86 0.75 0.462 –(0.44) (0.31)
Instruction 3.53 3.38 1.08 0.296 –(0.55) (0.35)
Assessment 3.40 3.32 0.50 0.626 –(0.61) (0.38)
Overall 3.59 3.56 0.26 0.795 –(0.47) (0.25)
PRINCIPAL-COMPLETED Planning & Preparation 3.28 3.26 0.18 0.862 –
(0.47) (0.33)
Learning Environment 3.47 3.38 0.87 0.396 –(0.35) (0.21)
Instruction 2.99 3.17 2.29 0.036 0.78**
(0.23) (0.23)
Assessment 2.85 3.01 1.36 0.194 –(0.48) (0.19)
Overall 3.15 3.21 0.69 0.500 –(0.31) (0.14)
Med
ium
Per
form
ing
Teac
hers
(Cha
nge
in th
e Q
ualit
y of
Ins
truc
tiona
l Pra
ctic
es)
Table 19Page 93

Pretest Posttest
t p-valueEffect size
(SD) (SD) (Cohen’s d)TEACHER-COMPLETED
Planning & Preparation 3.43 3.70 2.83 0.012 0.72**
(0.35) (0.39)
Learning Environment 3.64 3.78 1.34 0.200 –(0.50) (0.42)
Instruction 3.42 3.60 1.50 0.152 –(0.42) (0.51)
Assessment 3.15 3.37 1.74 0.101 –(0.54) (0.52)
Overall 3.41 3.61 2.35 0.032 0.51**
(0.38) (0.40)
PRINCIPAL-COMPLETED Planning & Preparation 2.41 2.45 0.35 0.728 –
(0.45) (0.40)
Learning Environment 2.59 2.62 0.26 0.797 –(0.49) (0.56)
Instruction 2.23 2.52 2.88 0.011 0.63**
(0.45) (0.47)
Assessment 2.02 2.41 3.86 0.001 0.94***
(0.44) (0.40)
Overall 2.31 2.50 2.84 0.012 0.49*
(0.41) (0.37)
Low
Per
form
ing
Teac
hers
(Cha
nge
in th
e Q
ualit
y of
Ins
truc
tiona
l Pra
ctic
es)
Table 20Page 94

High, Medium, and Low Performing Teachers (Change in instructional practices)
• High Performing teachers improved according to teacher self-ratings (.2*) and principal ratings (.29**).
• Medium performing teachers perceived no change in the quality of their instructional practices and principals perceived essentially no change.
• Low performing teachers improved according to teacher self-ratings (.2**) and principals (.19*)
Page 113-116

Student PerformanceRQ-2
Research Question Research Design Measures Analysis
2 Student PerformanceSingle Cross-Sectional
Interrupted Time Series
Student Grades & Discipline Referrals
Linear Regression
RQ 2 -How will changes in teachers’ instructional practices, initiated by the set of principal-teacher interactions, affect student performance?

Figure 6Page 97

d
Figure 7Page 100

Figure 8Page 101

Figure 9Page 102

Classroom Grade Distributions and Discipline Referrals Improved
• Percentage of As were higher than expected.• Percentage of Ds were higher than expected• Percentage of Fs were lower than expected.• Discipline referrals were lower than expected.
– Mainly due to decreases in aggressive discipline and male discipline.
– Freshman and senior discipline were impacted more than other grades.
Page 116

Conceptual Framework
Page 8-11, Figure 1

Student Performance Indicators for High, Medium and Low Performing Teachers
• According to QIR ratings, high performing teachers, had the highest quality of instructional practices and improved them the most over the course of the year.
• According to QIR ratings, medium performing teachers fell in the middle of the spectrum of teacher quality and did not improve.
• According to QIR ratings, low performing teachers had the lowest quality of instructional practices according to the QIR and improved similarly to the high performing teachers.
Page 120-121

Student Performance Indicators for High, Medium and Low Performing Teachers
• If the overall quality of instructional practices were the main reason for improved grade distributions and discipline referrals then,
• High Performing teachers would have the best grade distributions and lowest discipline referral number.
• Medium Performing teachers would have the next best grade distributions and next lowest discipline referrals.
• Low Performing teachers would have the worst grade distributions and the highest discipline referrals.
• But according to data analysis, the classroom grade distributions and discipline referrals for high, medium and low performing teachers were equivalent.
Table 25 & Page 120-121
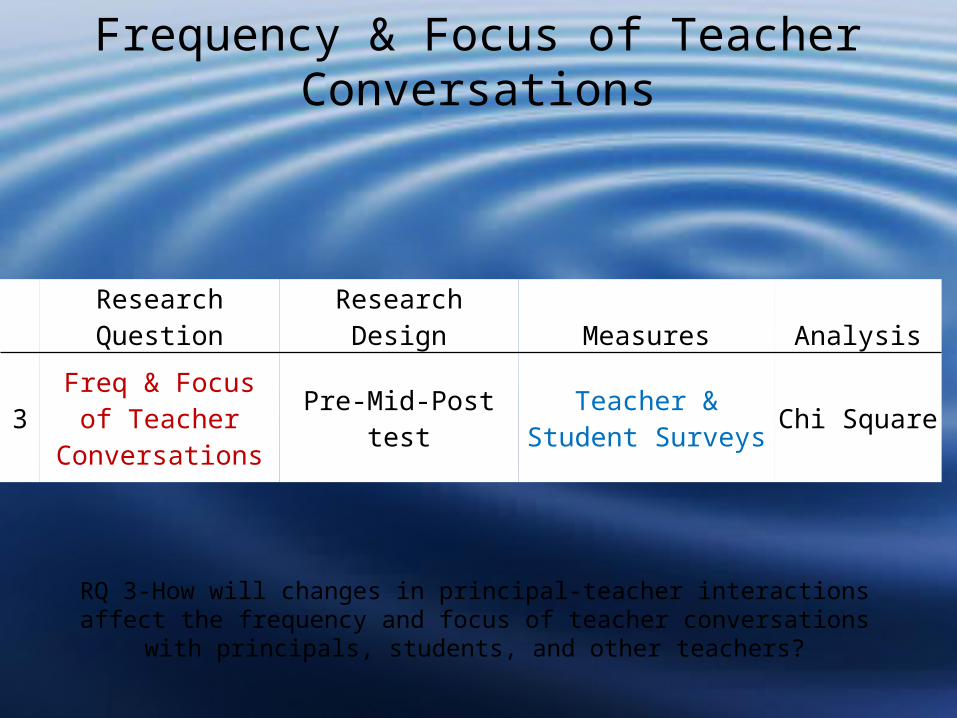
Frequency & Focus of Teacher Conversations
Research Question Research Design Measures Analysis
3Freq & Focus of
Teacher Conversations
Pre-Mid-Post test Teacher & Student Surveys Chi Square
RQ 3-How will changes in principal-teacher interactions affect the frequency and focus of teacher conversations with principals, students, and other teachers?

Frequency and Focus of Teacher Conversations
Question Response
Spring 071
Spring 081
Spring 091
χ2 (df=2)07/08
χ2 (df=2)08/09
Principal-Teacher Conversations
How often do you discuss curriculum issues with a principal?
Weekly or Daily 14 16 8
Monthly 21 24 24 0.44 3.14
Never or Annually 36 33 39
How often do you discuss discipline issues with a principal?
Weekly or Daily 25 28 22
Monthly 19 30 22 6.04* 5.35
Never or Annually 27 15 27
How often do you discuss teaching strategies with a principal?
Weekly or Daily 8 10 3
Monthly 19 20 27 0.23 4.83
Never or Annually 44 43 41
Table 26 & Page 122
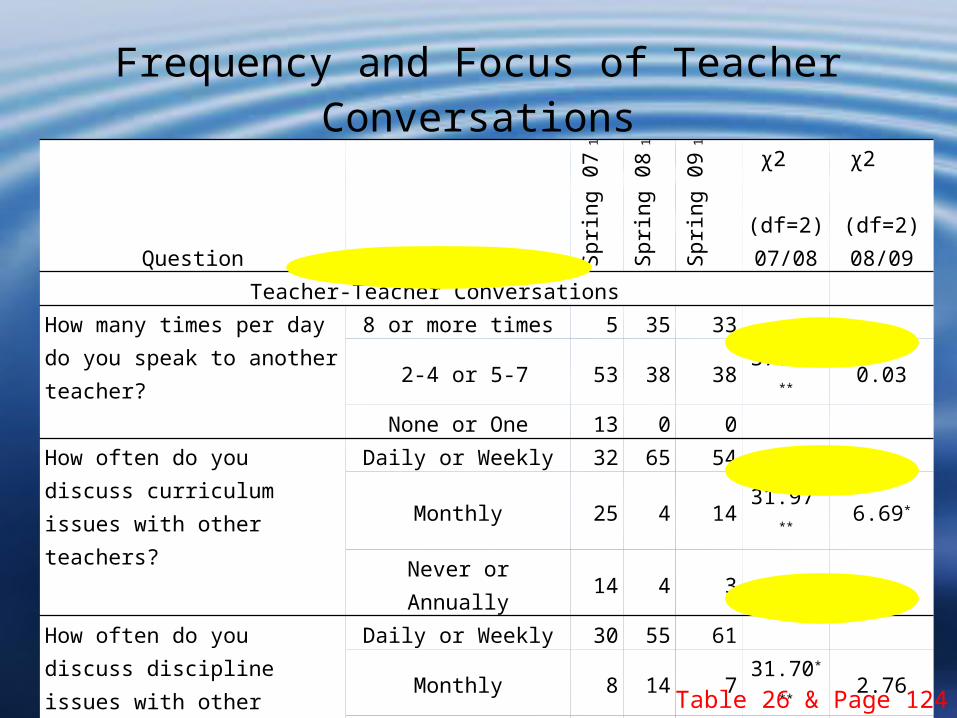
Question Response
Spring 071
Spring 081
Spring 091
χ2 (df=2)07/08
χ2 (df=2)08/09
Teacher-Teacher Conversations How many times per day do you speak to another teacher?
8 or more times 5 35 33
2-4 or 5-7 53 38 38 37.95*** 0.03
None or One 13 0 0 How often do you discuss curriculum issues with other teachers?
Daily or Weekly 32 65 54
Monthly 25 4 14 31.97*** 6.69*
Never or Annually 14 4 3 How often do you discuss discipline issues with other teachers?
Daily or Weekly 30 55 61
Monthly 8 14 7 31.70*** 2.76
Never or Annually 33 4 3
Frequency and Focus of Teacher Conversations
Table 26 & Page 124
Frequency and Focus of Teacher Conversations
• According to teacher surveys, the frequency of principal-teacher conversations improved, but the focus remained unchanged.
• According to teacher surveys, the frequency and focus of teacher-teacher conversations improved during the pilot year and maintained in the year of full implementation.
• According to student surveys, the frequency and focus of teacher-student conversations remain unchanged.
Pages 103-108 & 122

Findings
• Teacher instructional practices improved according analysis of QIR data.
• Student performance increased according to the analysis of student grade distributions and discipline.
• Freq & Focus of some teacher conversations changed according to analysis of teacher and student surveys.
Pages 109

Implications
• Principal Visits and Collaboration with Teachers
• Rubric Based Assessment of Instructional Practices
• Working with Teachers of Differing Qualities of Instructional Practices
Page 126-128

Unintended Outcomes
• Exiting Teachers• Principal-Student Relationships• Principal-Parent Discussions• Increased Job Satisfaction for the Principals
Page 130-132

Recommendations for Future Research
• Further research on particular treatment needed for teachers at various levels of performance
• How principal interactions in the classroom could strengthen and support the walk-through model currently used by many schools and districts
• Research on this treatment in other settings (generalizability)
• Individual effects of each of the four interventions used in this study
Page 133

This Study’s Resolutions to Central Dilemmas of Nearly all Principals
• How can I find time to get into classrooms?• How do I engage teachers in job related conversations about
instructional practices?• How do I get teachers to look at performance data of their
students?• How can I increase principal job satisfaction?• How can I reduce discipline referrals?• How can I decrease failure rates (improve student grades)
while increasing the quality of instructional practices?• How can I know the actual quality of instructional practices?
Table 28Page 135

Thank You
Brennon Sapp Kim Banta
www.bsapp.com/administrative_behavior/index.htm