xa.yimg.comxa.yimg.com/kq/groups/22453806/9748407/name/mr.doc · web view... closet competitor...
TRANSCRIPT
MARKETING RESEARCH
Chapter 1: INTRODUCTION TO MARKETING RESEARCH
I (a) Basic or Pure Research: The research which is done for knowledge enhancement, the research which does not have immediate commercial potential, the research which is done for human welfare, animal welfare and plant kingdom welfare is the basic or pure research.
Government of India, through Census, does research on population count to identify total population of India, no. of male, female, no. of families, no. of voters, etc. One of the major findings of census is, some rural areas, proportion of female is 10% less as compared to male. In some metros and mini metros, female count is marginally less than male. This situation might create problems in future. Govt. responded quickly to this trend and have implemented ad-campaign having punch line ‘a world without women’.
Discovery TV channel highlights the basic research done by Australia and US Governments

towards animal welfare and plant kingdom welfare. Some of the documentaries on animal rescue operations are quite remarkable.Sometimes social research may have commercial intention.Example: Jaago Re CampaignObjective- one billion voters by 2015.Intention was to get 4 million youth registered across 35 cities before general elections in May 13, 2009 &one billion by next elections in 2015.The young coordinator of the campaign Mr Jasmine Shah,along with 11 people approach voters at crowded places&appeals to get registered as voter&also says to use helpline www.jaagore.com for any assistance.Tata Tea has sponsored some part of this campaign.This is a successful campaign because by first week April, i.e. within 17 weeks of its launch, the website has managed to register 5.66 million youngsters.
(b) Applied Research: The research which has immediate commercial potential is called applied research. Applied research can further be classified as problem oriented and problem solving research.
Problem Oriented Research – This type of research is done by Industry Apex Body for sorting out problems faced by all the companies. For example NASSCOM regularly conducts problem oriented research for the benefit of all software companies. Similarly CII does the research for all types of companies. At global level, WTO does problem oriented research for developing countries. In India, APEDA (Agriculture and Processed Food Export Development Authority) conducts regular research for the benefit of agro industry.
Problem solving Research – This type of research is done by an individual company for the problem faced by it. For example if Videocon International conducts research to study customer satisfaction level, it will be problem solving research. The findings of problem solving research are unique and only true for that company which does the research and cannot be generalized. Whereas findings of the problem oriented research could be generalized.
Market Research and Marketing Research are the applied research.
II NATURE OF MARKETING RESEARCH

The nature of marketing research is very much linked with marketing as such. It deals with each and every decision which marketing also deals with. In nut and shell marketing research involves research related to nature and range of products, demand for the products, pricing, distribution and promotion, etc.; virtually every aspect of serving customer or clients right from idea generation till delivery, recovery of payment, installation and training.
III OBJECTIVES OF MARKETING RESEARCH
(a) To generate, refine, and evaluate marketing plan.e.g bottled water.
CURRENT MARKETING SITUATION (Bislerry)
(i) Market Size : Rs. 1700 Cr (2007)
(ii) Growth Rate : 17-20% P.A.
(iii) Target Market : Health conscious consumers
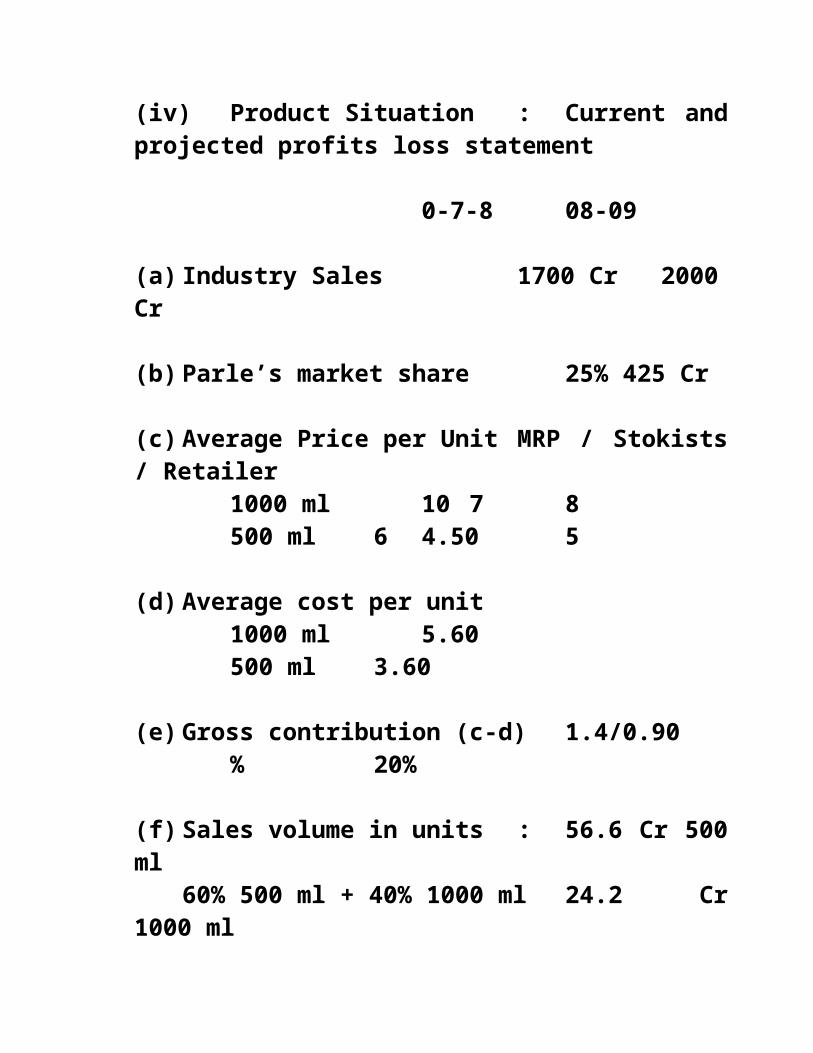
(iv) Product Situation : Current and projected profits loss statement
0-7-8 08-09
(a) Industry Sales 1700 Cr 2000 Cr
(b) Parle’s market share 25% 425 Cr
(c) Average Price per Unit MRP / Stokists / Retailer
1000 ml 10 7 8500 ml 6 4.50 5
(d) Average cost per unit1000 ml 5.60500 ml 3.60
(e) Gross contribution (c-d) 1.4/0.90% 20%
(f) Sales volume in units : 56.6 Cr 500 ml60% 500 ml + 40% 1000 ml 24.2 Cr 1000 ml
(g) Total Gross Margin 20% 85 Cr
(h) Depreciation, Interest & Tax50% of GM 42.5 Cr
(i) Net profit (g-h) 42.5 Cr (10%)

(j) Advertising & Promotion cost 3% of sales 10.5 Cr
(k) Sales Force management & Distribution cost 6% 21 Cr
(l) Marketing Research expenses 0.1% 3.15 Cr
(m) Net operating profit (i-j-k-l) Amount 7.85 Cr% 1.84%
(b) Monitor marketing performance to improve impact of marketing programme. (A)(Example of launching marketing/promotion of Hum Tum movie)(B)Launching of Rub Ne Bana Di Jodi by Yashraj Banner
(c) To identify market potential India`s direcr selling market potential/size is Rs 3500cr.# Growth rate is 30%p.a#Biggest players -- Amway, Oriflame,Avon,Tupperware&Modicare@ One million employement generated last year* Out of total consultantants, 68%are women&32%aremen.
[Case study of Reliance Petroleum for identifying market potential for petrol (8 million ton) diesel (40 million ton) and launching of value added petrol pumps]
NOKIA in India & GlobeNokia`s performance in IndiaYear Sales in Rs Cr2006 158522007 209282008 24942Market Share:- 65%Last year(2008) it sold 80 mn handsets.Its Chennai plant makes 200 mn handsets & exports to more than 50 countries.
Indian Mobile Handset Market SizeYear ValueRs cr Volume mn cost of HS 2007 26000 90 Rs 2900each2008 26500 108 Rs 24002009 27000 120 Rs 2200Global Mobile Handset Market SizeYear ValueRscr Volume mn Nokia`s ms 2008 6,50,000 330 38.6%Rs 245000 cr
d)Stress on innovation for market growth&profitability.

The most innovative firms define “innovation” broadly. They believe that innovation is not just about developing new products and services but, more fundamentally, about discovering new ways to create value. At Marico, for example, innovation is referred to as “uncommon sense”. According to Marico’, “Uncommon sense is a mindset that seeks to create and unlock new value by challenging prevailing rules of the market. According to ICIC: Innovation is the ability to identify opportunity and seek new growth horizons continually using people, processes and delivery mechanisms as the platform. A broad definition of innovation helps companies to think beyond R & D and to move to the next level of innovation: creating new processes, new distribution channels, new business models and new ventures.THE MARICO WAY
A FOUR-PRONGED STRATEGY FOR GROWTH
Strengthen existing brands like Parachute and Saffola by adding new brand extension, adding value by adopting a health positioning, and launching more variations. Example: Saffola atta mixes,Saffola Weight Management Rice and Parachute gels
Expand the international consumer business with key acquisitions in geographies like South Africa and Egypt. Also eying the booming African markets and strengthening its position in Bangladesh and West Asia.
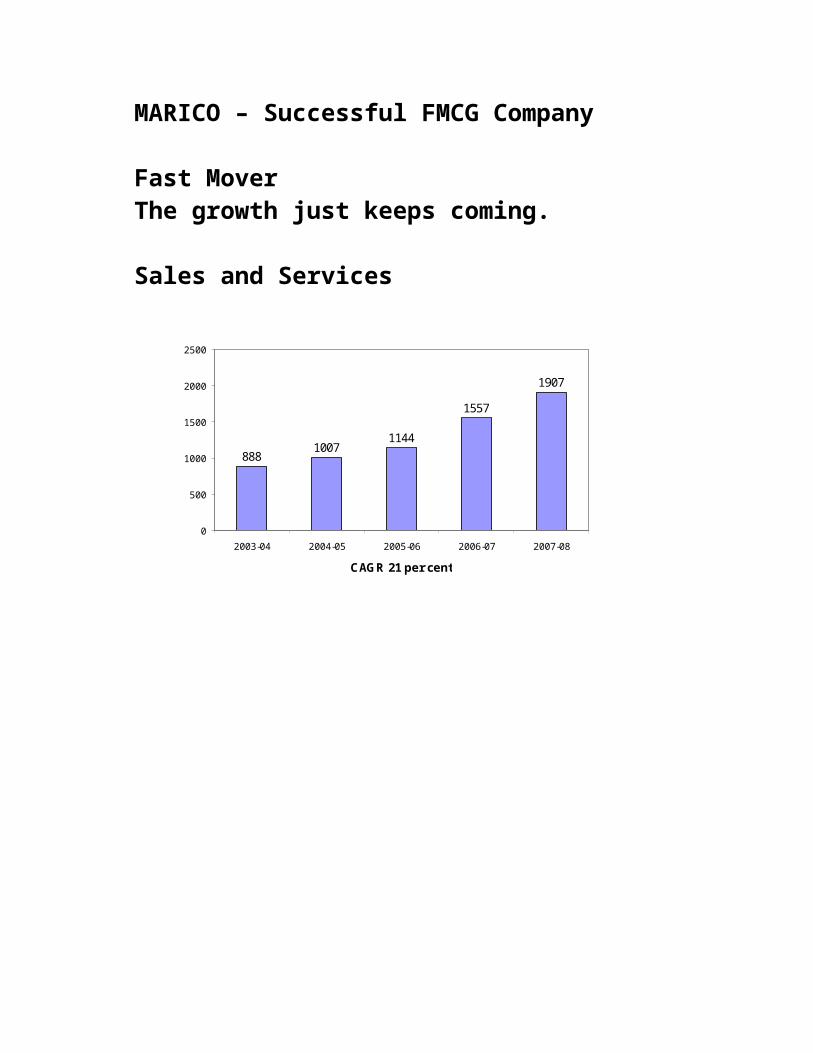
8881007
1144
1557
1907
0
500
1000
1500
2000
2500
2003-04 2004-05 2005-06 2006-07 2007-08
CAGR 21 per cent
A focus on health and wellness, with close to 65 Kaya Clinics. Kaya has got into the weight-loss space with kaya Life Clincs
Develop new products by prototyping them in small markets
MARICO – Successful FMCG Company
Fast MoverThe growth just keeps coming.
Sales and Services
5970
87
113
169
0
20
40
60
80
100
120
140
160
180
2003-04 2004-05 2005-06 2006-07 2007-08
CAGR 30 per cent
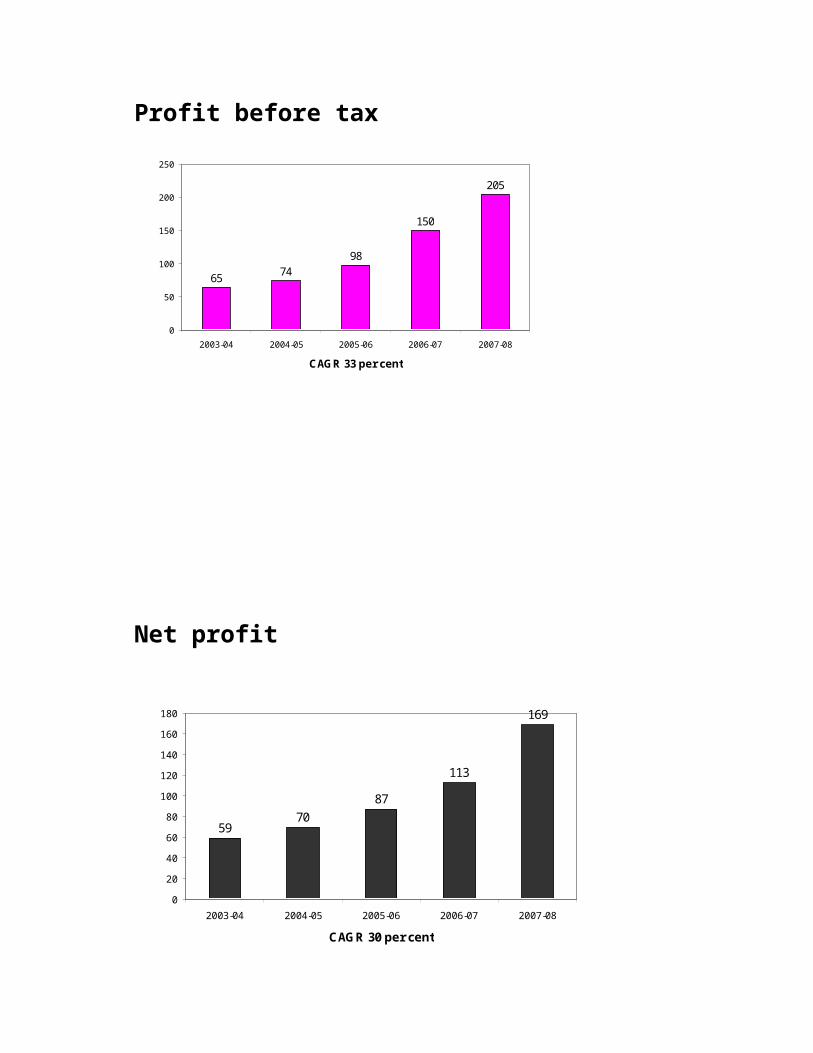
65 7498
150
205
0
50
100
150
200
250
2003-04 2004-05 2005-06 2006-07 2007-08
CAGR 33 per cent
Profit before tax
Net profit
During the year, Kaya clocked revenues of RS. 100 crore. But more than its increasing contribution to group revenues, Kaya holds the promise of boosting the company’s bottom lines, thanks to its distinct service model. Typically, kick-starting a Kaya a clinic takes Rs. 1-1.3 corre (including technology investments and interiors) in a metro city. The clinic breaks even in about nine months in ametro and takes a little bit longer in smaller cities.
To boost its product revenue stream, Kaya began prototyping its “shop-in-shop” model through kiosks at malls. “We are now present in about 36 locations like Shoppers’ Stop, Hypercity and Lifestyle.
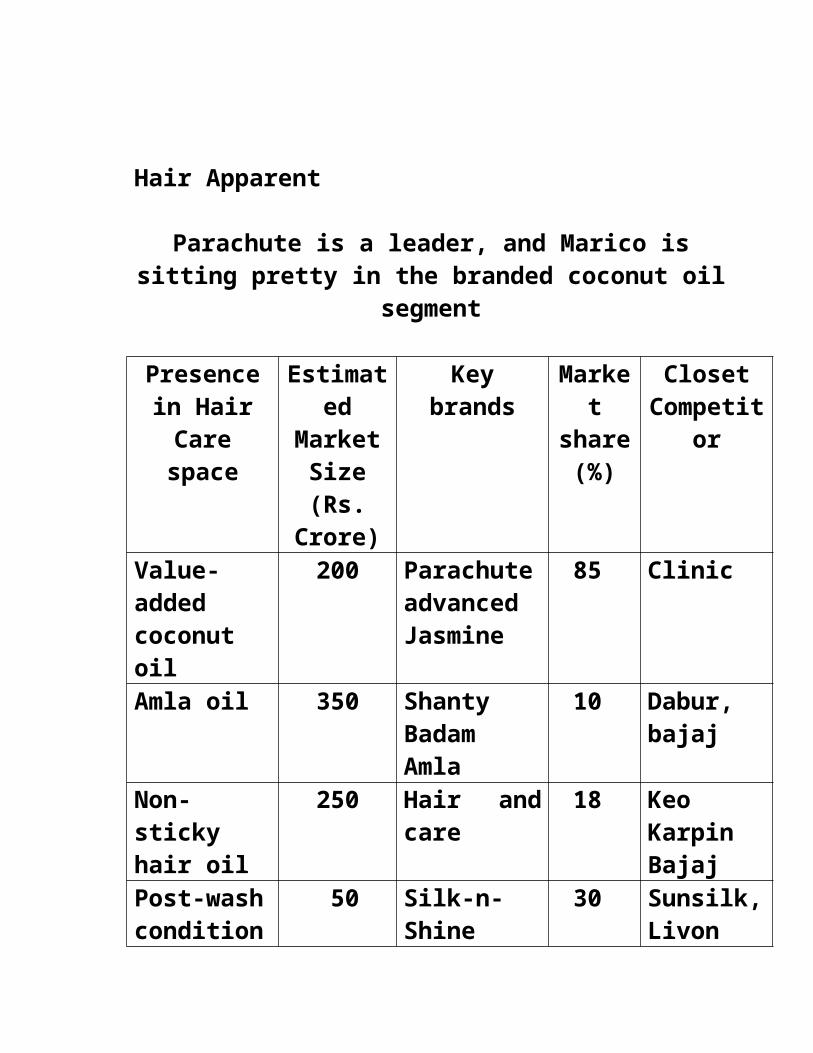
Hair Apparent
Parachute is a leader, and Marico is sitting pretty in the branded coconut oil segment
Presence in Hair Care
space
Estimated Market Size (Rs. Crore)
Key brands Market share (%)
Closet Competitor
Value-added coconut oil
200 Parachute advanced Jasmine
85 Clinic

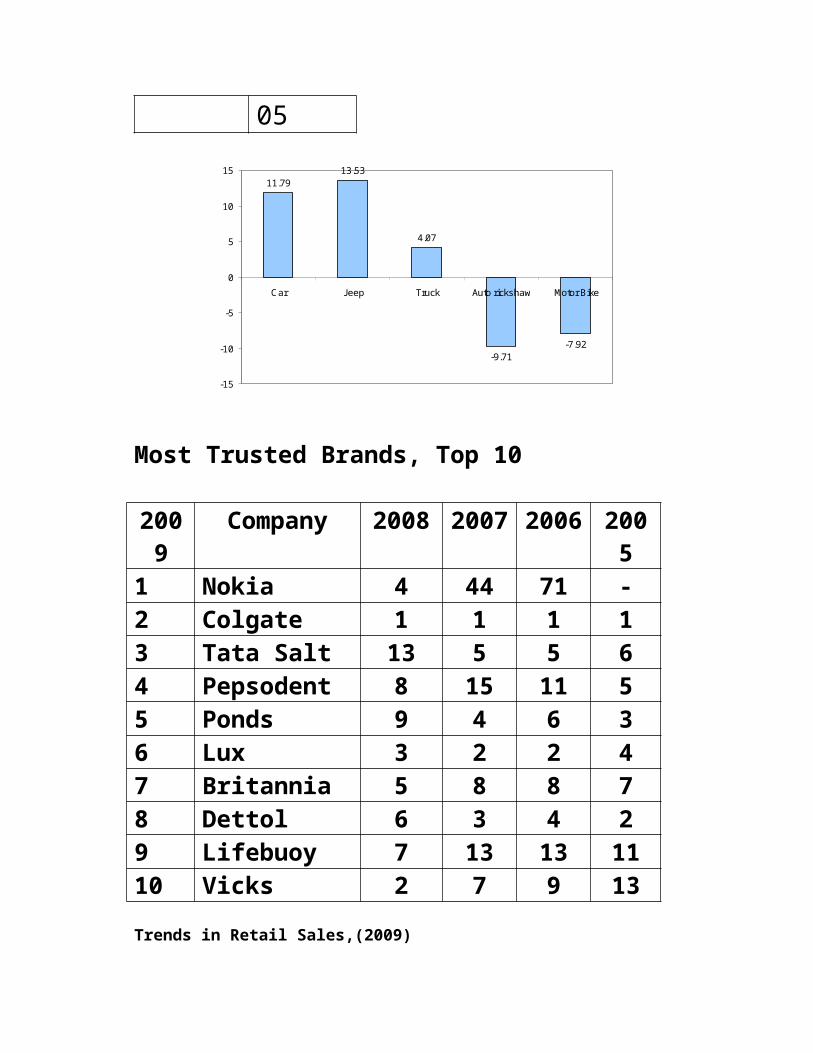
11.7913.53
4.07
-9.71-7.92
-15
-10
-5
0
5
10
15
Car Jeep Truck Auto rickshaw Motor Bike
Amla oil 350 Shanty Badam Amla
10 Dabur, bajaj
Non-sticky hair oil
250 Hair and care
18 Keo Karpin Bajaj
Post-wash conditioner
50 Silk-n-Shine 30 Sunsilk, Livon
Hair gel and creams
80 Parachute after shower
30 Brylcreem
Hair fall NA Parachute Hair Therapy
NA NA
e) To research trends.Trends in vehicle
Vehicles sales 07-08
cars 1203531U.V. 344454C.M. 486817Two.W. 7248600Three.W. 364703Total 9648105
Most Trusted Brands, Top 10
2009 Company 2008 2007 2006 20051 Nokia 4 44 71 -2 Colgate 1 1 1 13 Tata Salt 13 5 5 64 Pepsodent 8 15 11 55 Ponds 9 4 6 36 Lux 3 2 2 47 Britannia 5 8 8 78 Dettol 6 3 4 29 Lifebuoy 7 13 13 1110 Vicks 2 7 9 13Trends in Retail Sales,(2009)
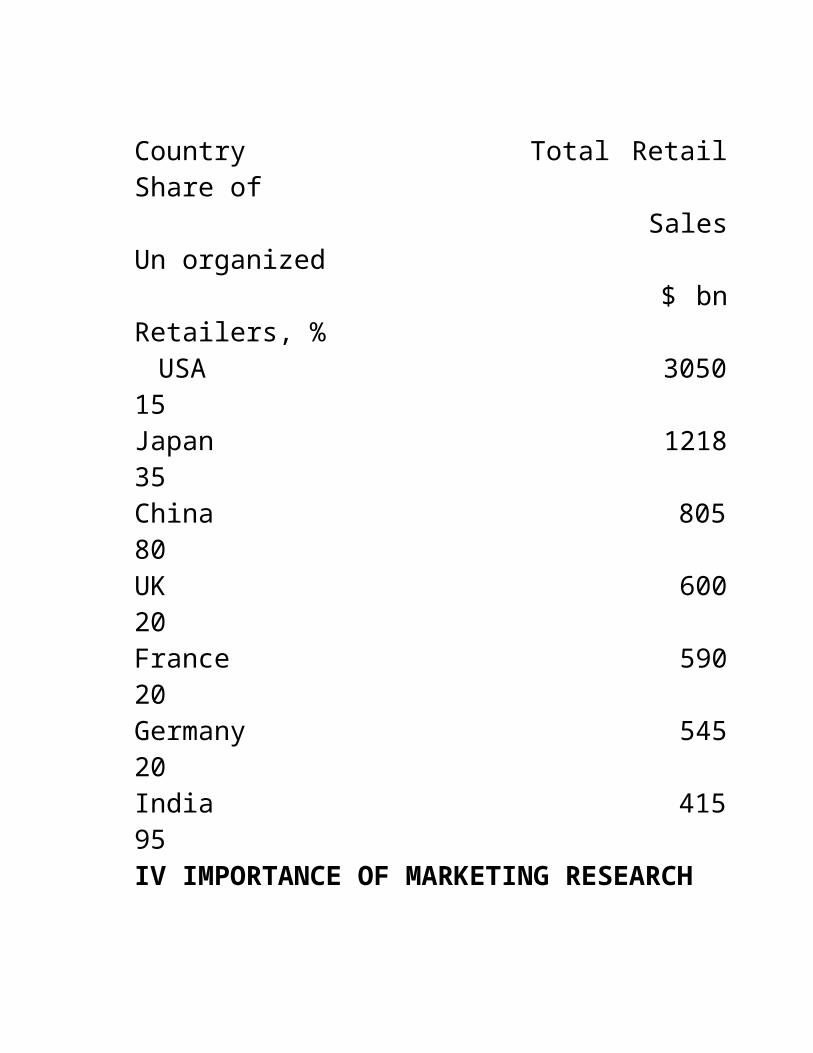
Country Total Retail Share of Sales Un organized $ bn Retailers, % USA 3050 15Japan 1218 35China 805 80UK 600 20France 590 20Germany 545 20India 415 95
IV IMPORTANCE OF MARKETING RESEARCH
Marketing Research helps the marketer in following decision areas:MR for designing strategies to face recession.1)Tata Housing:-Research indicated shortage of 25 million dwelling units across middle&low income families.Real Estate companies like DLF, Kumar Properties, etc could not market even Rs 10lacs worth properties in sufficient nos during last 12 months.Tata housing,after Nano success to group company, decided to target low& middle income families through SHUBH GRIHA PROJECT at BHOISAR near Mumbai,in which each flat is priced between RS 3.9lakh&Rs 6.7lakh.The project of 1000 flats is huge success because it recorded 75% booking within one month launch of project. Now Tata Housing wants to take same model all over India.2) Bajaj Auto:-Two wheeler automobile markets are passing through rough path. Demand for 100cc bike is steady. But 125cc, 150cc, 180cc, 200cc are in bad shape. To meet consumer expectations on power&Price, Bajaj is launching 125cc motorcycle at price Rs20, 000-24,000(made in china), which

is Rs8000 less than cheapest available bike CDDAWN.3) Aviation Industry:-During 2008-09,Private airlines like Jet Konnect& Kingfisher suffered 14% drop in passengers carried.As such it were compelled to launch low price offerings.4) Acer:-World`s third largest PC brand,Acer,already revised price of entry level desktopEL-1600, to RS 9999from Rs 12000,to meet affordability in recession of corporate&household customers.5) PETER England Fashion& Retail:-India’s branded apparel retail market size is Rs 26000cr.Madura Garments is Rs 1000cr worth company& Peter England is Rs 270cr worth brand. Peter England shirt prices are Rs 400 onwards. The company is planning to launch new MASS brands like Spinoff,Elysee,Byford&People at a price Rs 249-549.These shirts will be retailed through 100 different stores.6) Cadbury India:-Indian confectionery market is Rs 3500cr& Cadbury commands 72% market share. During early 2009 ,it launched CDM-Shots at price Rs2.Earlier Cadbury did have low price chocolate at Rs 2, like small pack of Perk & chocolate paste-
Chocki.But it did not market aggressively. Now Cadbury is serious about all low price chocolates, since it occupies 10% of its revenue.7) Titan Watches:-India’s watch market was flat last year(44 million units).Sonata brand is the leader& cash cow for Titan. The price range of sonata is Rs 400 onwards. To face recession successfully in 2009, Titan came up with sub brand of sonata--- SONATA-SUPER- FIBRE,in price range of Rs 275- 550.Recession research indicated that 25% of market exist below Rs 500/Titan’s move, therefore was timely& yielded much needed growth push to umbrella brand.
(a) Target MarketTo understand taste, preferences and choices of consumers, to understand market size, to measure market potential, to interpret consumer behavior, to study influence of life style on target market behavior.
(b) Products / Services To identify customer satisfaction, to identify customer service levels, to study and to augment product features, attributes as well as to identify service gaps
(c) Price

To study price affordability of target market, to study competitive pricing structure, etc.
(d) DistributionTo identify prevailing channels of distribution, emerging channels, channels of distribution by competitors and modification to be done in channels structures as per market requirement. (P&G introduce master wholesaler between stockiest and retailer to augment service level)
(e) PromotionTo design promotion mix, to identify promotion mix of competitors, to study emerging promo tools (road shows, pops and kiosks)
V BENEFITS OF MARKETING RESEARCH
(a) Conducting Marketing Management to identify strength and weaknesses of the marketer as well as the competitors.Also to research market shares.Example of HUL.
HUL as Winner in the Market?
Category: Fabric Wash
Market Size: Rs. 8875 Crore
Company Quarter ended 2008Mar. June Sept. Dec.
HUL 35.2 36.5 37 37.5P&G 7.5 7.4 7.7 7.4Nirma 13.4 13.1 13.2 13.6
Category: ShampooMarket Size: Rs. 2141 Crore
Company Quarter ended 2008Mar. June Sept. Dec.
HUL 46.9 47.5 47.7 47.8P&G 25 24.8 24.3 23.7CavinKare 12.6 12.4 12.4 12
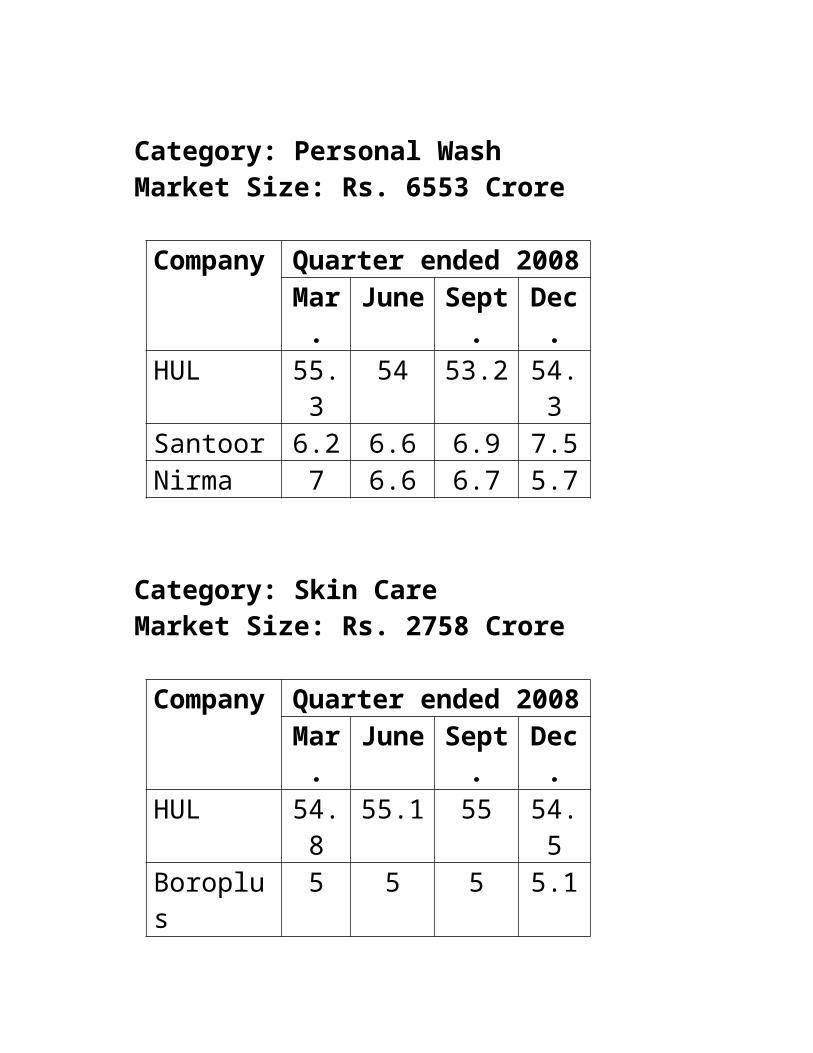
Category: Personal WashMarket Size: Rs. 6553 Crore
Company Quarter ended 2008Mar. June Sept. Dec.
HUL 55.3 54 53.2 54.3Santoor 6.2 6.6 6.9 7.5Nirma 7 6.6 6.7 5.7
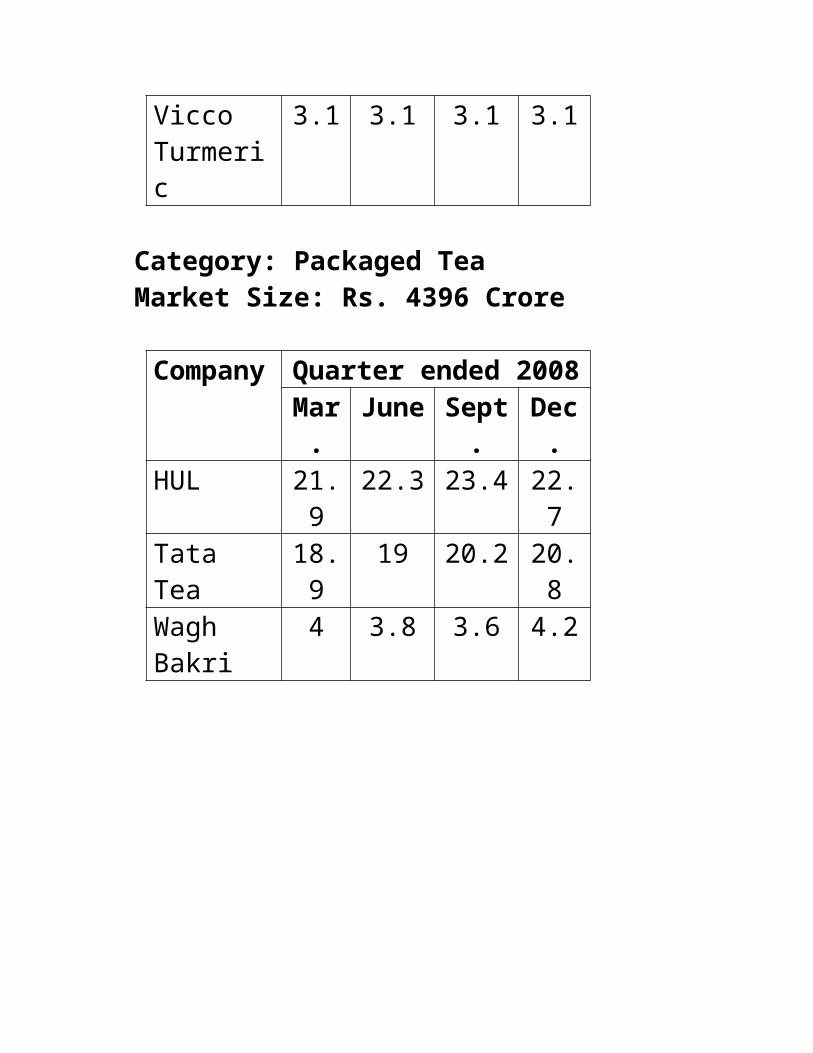
Category: Skin CareMarket Size: Rs. 2758 Crore
Company Quarter ended 2008Mar. June Sept. Dec.
HUL 54.8 55.1 55 54.5Boroplus 5 5 5 5.1Vicco Turmeric
3.1 3.1 3.1 3.1
Category: Packaged TeaMarket Size: Rs. 4396 Crore
Company Quarter ended 2008Mar. June Sept. Dec.
HUL 21.9 22.3 23.4 22.7Tata Tea 18.9 19 20.2 20.8Wagh Bakri
4 3.8 3.6 4.2
HUL as second-best in a couple of segments
Category: ToothpasteMarket Size: Rs. 2733 Crore
Company Quarter ended 2008Mar. June Sept. Dec.
Colgate 48.2 48.5 48.2 48.8HUL 30 30 30 29.5
Category: KetchupsMarket Size: Rs. 271 Crore
Company Quarter ended 2008Mar. June Sept. Dec.
Maggi 32.2 30.9 30.9 30.3HUL 26 25.5 26.9 28.1
(b) Determining whether economics of scale and economics of scope (e.g. retailing, insurance and telecom can be clubbed by organized retailer like Shopper’s stop, ICICI, etc.)

(c) Understanding needs wants and demands of target customers in India and abroad.
(d) To formulate sales and distributions strategies
(e) To avoid business recession by timely launching brand extension and or product variants (detail study of PLC or BCG matrix)
VI SCOPE OF MARKETING RESEARCH
(a) Type of consumers that comprise present and potential markets.
(b) Buying habits and pattern of consumption(c) Size and location of different markets, not
only in India but overseas also.(d) The prospects for growth or contraction
for the current markets being served.( dVD vsVCD, CDVs Flopy)
(e) New mantras of emerging segments.(f) The marketing and manufacturing
capabilities of competitors.(g) Most suitable entry timing(h) The current and prospective competitive
position w.r.t. price, quality, reputation, etc.
(i) Chances of improvement of current channels
(j) Optimum use of promo-tools(k) The macro environmental factors like
changes in government regulations, effect of technological innovations, urbanization, etc. that will have any effect on the market for the product under consideration. For example FDI in Retail Trade. The Govt. rules are as follows.
(l) Govt. allows FDI upto 51% with prior approval in retail trade of Single Brand products.This is aimed at attracting investment in production &marketing,improving the availabilityof such goods for consumers,encouraging increased sourcing of goods from India&enhancing competitiveness of Indian enterprises through access to global designs,technologies&management practices.
2) FDI upto 51% in retail of SINGLE BRAND products only.---- Products should be sold under same brand interbationally.

--- Single brand product retailing would cover only products which are branded during manufacturing.3) Cash&Carry- This is B2B format,where the retailer sells to shopping establishments&large institutional customers.Metro in Bangalore is cash-n-carry
VII LIMITATIONS OF MARKETING RESEARCH / OBSTACLES IN ACCEPTANCE OF MARKETING RESEARCH
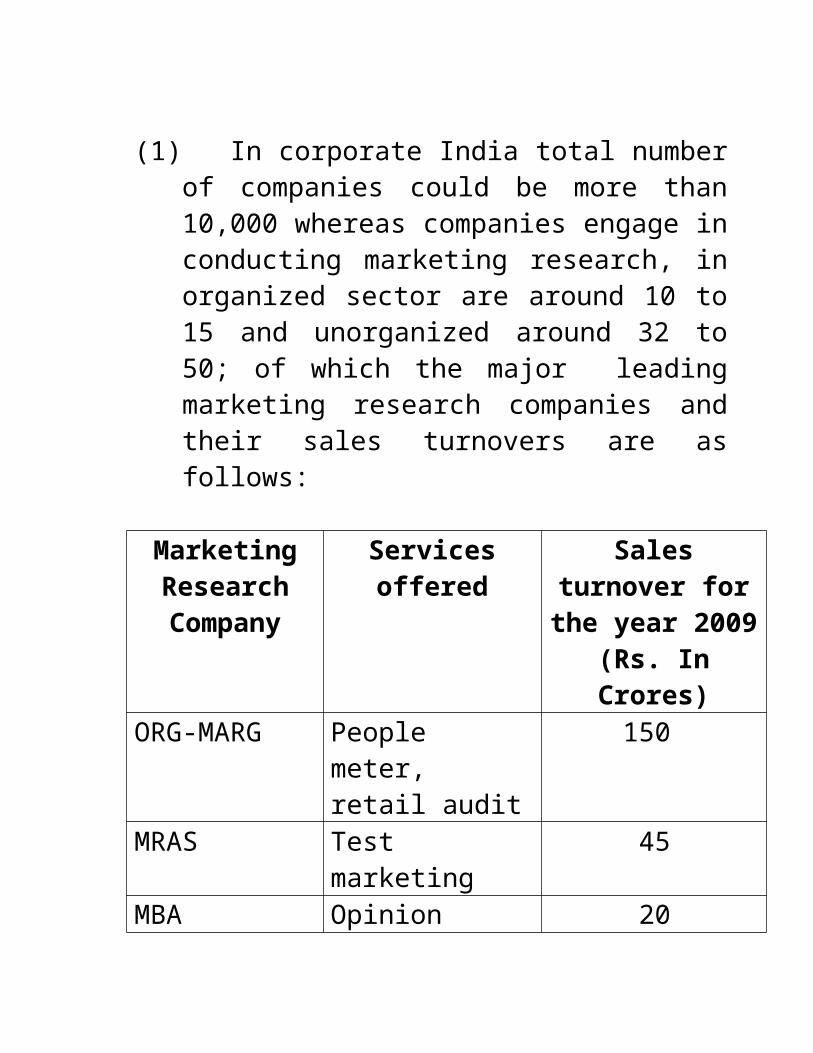
(1) In corporate India total number of companies could be more than 10,000 whereas companies engage in conducting marketing research, in organized sector are around 10 to 15 and unorganized around 32 to 50; of which the major leading marketing research companies and their sales turnovers are as follows:
Marketing Research Company
Services offered
Sales turnover for the year 2009 (Rs. In
Crores)ORG-MARG People meter,
retail audit150
MRAS Test marketing 45

MBA Opinion polls 20RCG Perceptual maps 22STANDARD RESEARCH
Customer satisfaction surveys
20
IMRB Advertising testing research
125
Total 382
Corporate India’s turnover is few billion $ whereas sales turnover of all marketing research companies (organized and unorganized) does not exceed more than Rs. 850 crores. This indicates that marketing research is not very popular with corporate India.
The big shots in consumer non-durables i.e. HLL and ITC hardly spend around Rs. 50 crores and 40 crores respectively annually on marketing research, which is not even 1 per cent of their sales turnover.(HUL`s sales till march 2009, was Rs16,476cr,GP Rs2115cr,NP Rs457cr) This fact confirms unpopularity of marketing research with corporate world. The reasons for unpopularity could be as follows:
(2) Narrow conceptions: MR is perceived as data collection activity only i.e. a clerical job. This
is because the marketer never comes in forward of respondents and explains to him the objectives of research or purpose of research. E.g. Times of India and Indian Express conduct research for estimating readership and viewer ship every six months. The boys recruited are under-graduates who do not know the purpose of the study. They just write down the answers on structured questionnaires and say that they are doing marketing research. Hence the respondents form perception that marketing research is clerical job.
(3) Improper orientation of the investigators – data collection activity is normally entrusted to first year management students without imparting any training to them. The respondents are just given quota i.e. they have to complete say 100 surveys in one week’s time and submit 100 questionnaires. Normally, the interviewer is not able to complete this work in one week’s time and to fulfill the quota on his own he fills up the questionnaire. This hampers the accuracy of the survey.
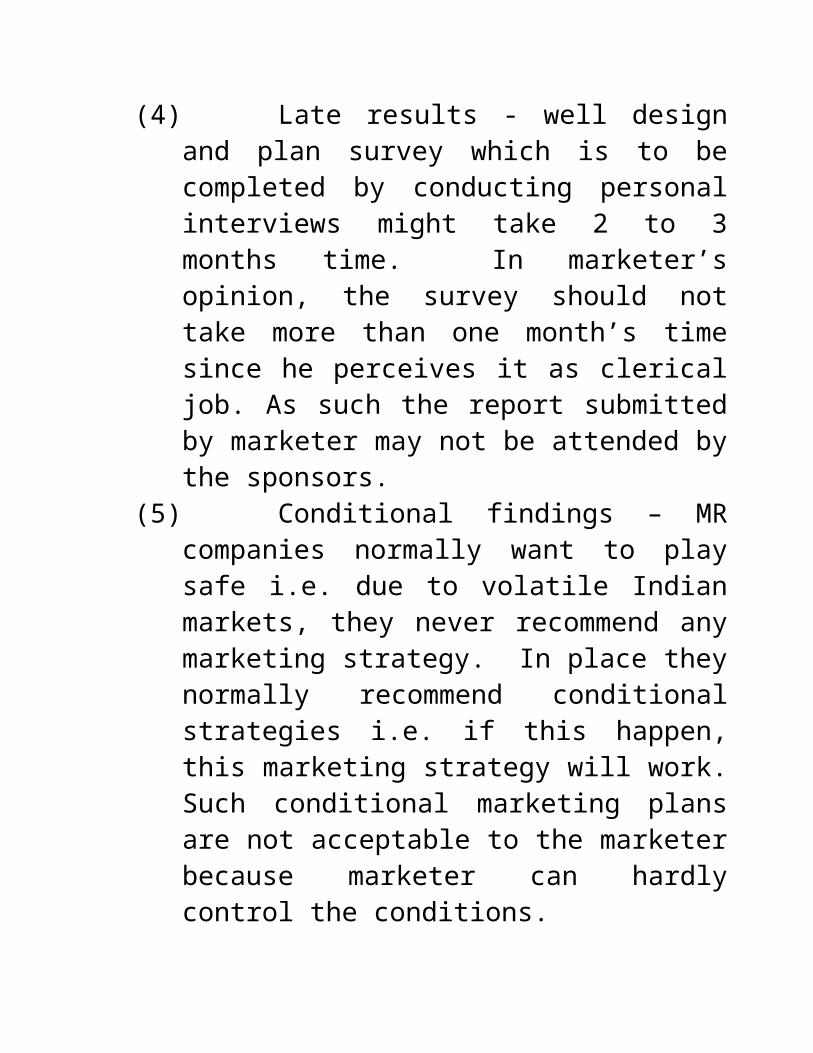
(4) Late results - well design and plan survey which is to be completed by conducting personal interviews might take 2 to 3 months

time. In marketer’s opinion, the survey should not take more than one month’s time since he perceives it as clerical job. As such the report submitted by marketer may not be attended by the sponsors.
(5) Conditional findings – MR companies normally want to play safe i.e. due to volatile Indian markets, they never recommend any marketing strategy. In place they normally recommend conditional strategies i.e. if this happen, this marketing strategy will work. Such conditional marketing plans are not acceptable to the marketer because marketer can hardly control the conditions.
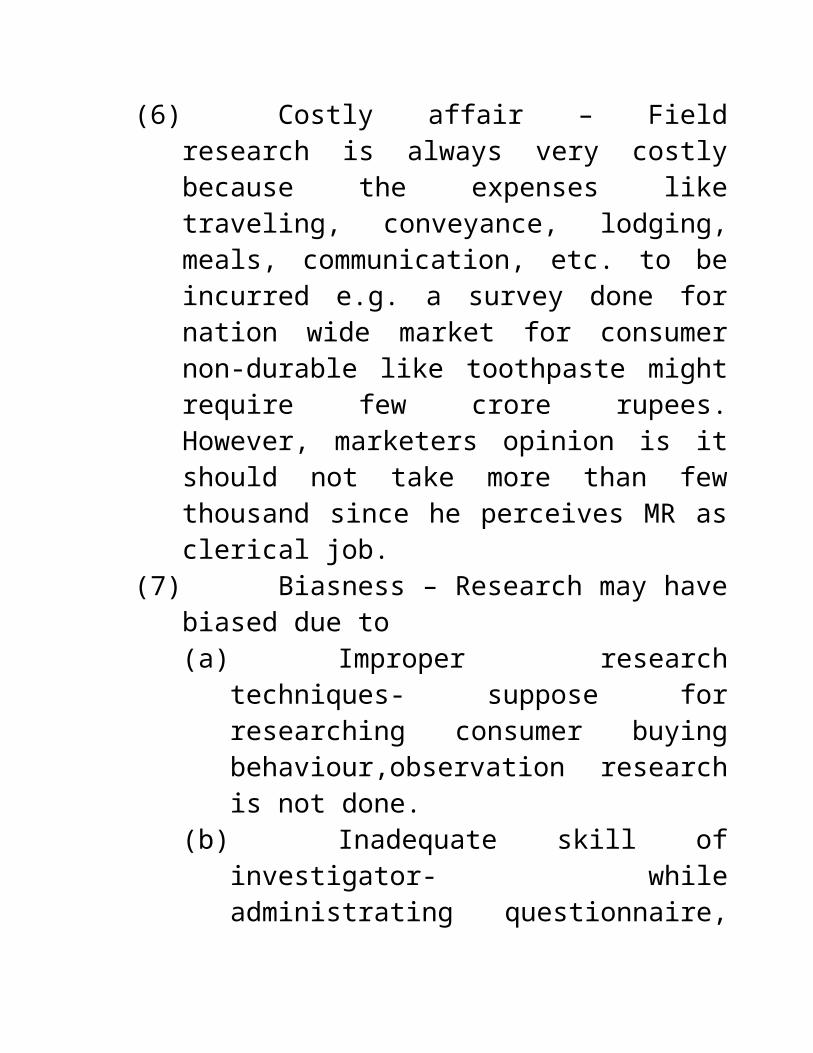
(6) Costly affair – Field research is always very costly because the expenses like traveling, conveyance, lodging, meals, communication, etc. to be incurred e.g. a survey done for nation wide market for consumer non-durable like toothpaste might require few crore rupees. However, marketers opinion is it should not take more than few thousand since he perceives MR as clerical job.
(7) Biasness – Research may have biased due to (a) Improper research techniques- suppose
for researching consumer buying behaviour,observation research is not done.
(b) Inadequate skill of investigator- while administrating questionnaire, mis interpretation of open ended questions is not handled carefully.
(c) Researcher inclined towards pre-determined results. – Research should not get carried away based on data published by one company.For example, Tata Motors says, Corporates for transportation now prefers four wheeler for small consignment upto 1.0 ton.Actual research indicated that today also Three wheeler command for transportation of small cargos.
vIII Definitions of MR1 MR is a tool for a study ---------
To measure →needs, wants, demands.To evaluate →consumer attitudesTo interpret →consumer behaviorOf various target markets.
2 MR is the systematic gathering recording &analyzing of data about problems relating to the marketing of goods &services.
3 MR is the objective & formal process of systematically obtaining, analyzing &interpreting the marketing data for actionable decision making.
IX MR &market research.

Chapter II. Sources & collection of Marketing data
SOURCES OF SECONDARY DATA—Internal Records & External sourcesInternal Records like Sales Records, Marketing data, Cost information,Distributor`s reports, Customer feed-back reports.External Sources:-Published Data Standardized sources
Of Marketing Data.Internet
Electronic Printed# Govt.# Trade Association# Periodicals# News Papers# Books # Annual Reports # Private Studies.
@ Store Audit@ Warehouse withdrawal services.@ Consumer Panels.@ Ac Nielson`s TVR@ Multimedia Services
Government Sources
Name of the Source Information provided1) Directorate General of
Supplies & Disposal (DGS&D)
Installed manufacturing capacities & actual utilized capacities for all manufacturers in India.2) Directorate General of
Trade & Disposal3) Reserve Bank of India (RBI)
Availability of foreign currencies.
4) Directorate General of Import-Export statistics

Commercial Intelligence & Statistics5) Centre for monitoring Indian Economy (CMIE)
Economic Growth, GDP
6) Census Population, no. of families, no.of voters
7) Geographic Survey of India Regionwise production of agri-produce
8) Horticulture Board of India Value-added fruits, vegetables & flowers and markets

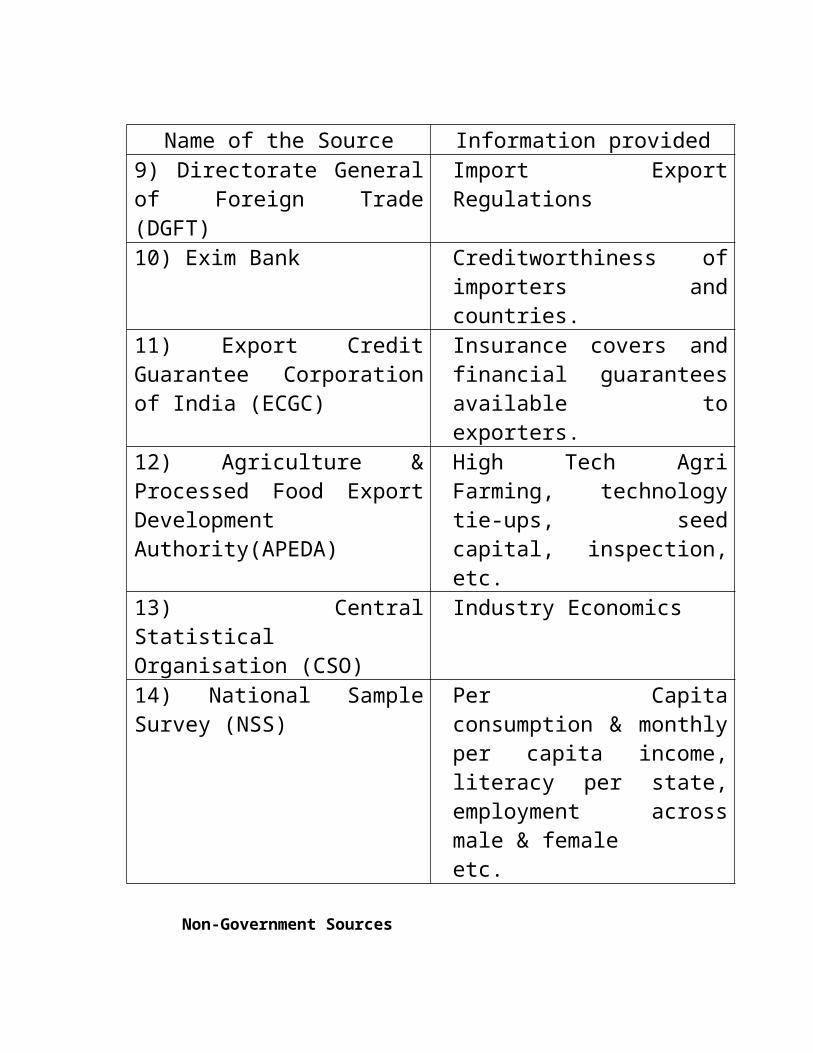
Name of the Source Information provided9) Directorate General of Foreign Trade (DGFT)
Import Export Regulations
10) Exim Bank Creditworthiness of importers and countries.
11) Export Credit Guarantee Corporation of India (ECGC)
Insurance covers and financial guarantees available to exporters.
12) Agriculture & Processed Food Export Development Authority(APEDA)
High Tech Agri Farming, technology tie-ups, seed capital, inspection, etc.
13) Central Statistical Organisation (CSO)
Industry Economics
14) National Sample Survey (NSS)
Per Capita consumption & monthly per capita income, literacy per state, employment across male & female etc.
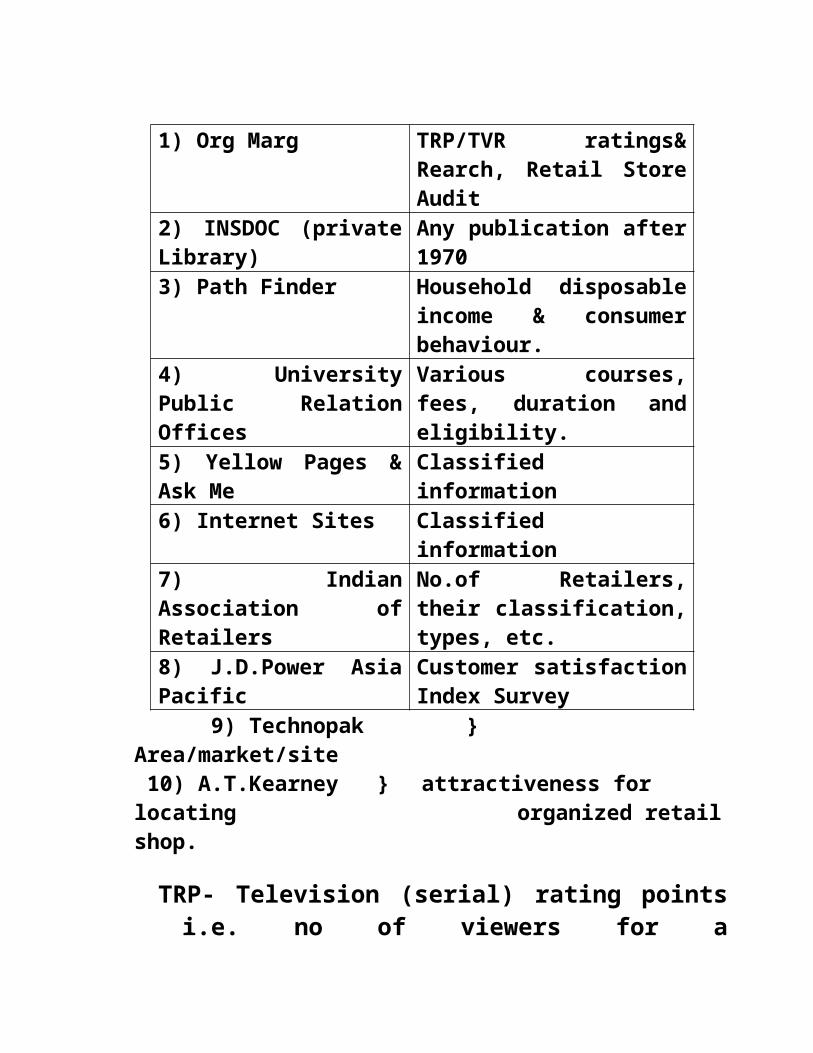
Non-Government Sources
1) Org Marg TRP/TVR ratings& Rearch, Retail Store Audit
2) INSDOC (private Library)
Any publication after 1970
3) Path Finder Household disposable income & consumer behaviour.
4) University Public Relation Offices
Various courses, fees, duration and eligibility.
5) Yellow Pages & Ask Me
Classified information
6) Internet Sites Classified information7) Indian Association of Retailers
No.of Retailers, their classification, types, etc.
8) J.D.Power Asia Pacific
Customer satisfaction Index Survey
9) Technopak } Area/market/site 10) A.T.Kearney } attractiveness for locating
organized retail shop.
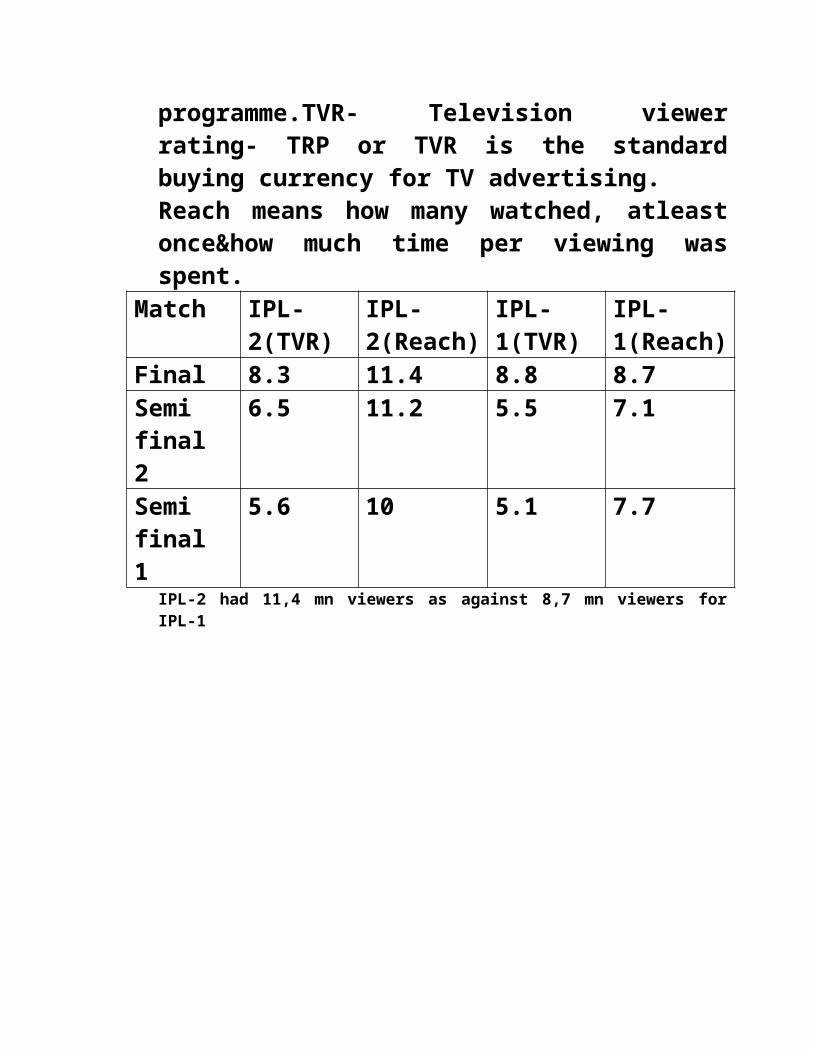
TRP- Television (serial) rating points i.e. no of viewers for a programme.TVR- Television viewer rating- TRP or TVR is the standard buying currency for TV advertising.Reach means how many watched, atleast once&how much time per viewing was spent.
Match IPL-2(TVR)
IPL-2(Reach)
IPL-1(TVR)
IPL-1(Reach)
Final 8.3 11.4 8.8 8.7Semi final 2
6.5 11.2 5.5 7.1
Semi final 1
5.6 10 5.1 7.7
IPL-2 had 11,4 mn viewers as against 8,7 mn viewers for IPL-1

• THE NATURE OF SECONDARY DATA
• Secondary data is available from publications, in-house databases, research agencies etc. It constitutes readymade information that can be used for research purpose with minimal analysis. However, the researcher should bear in mind that secondary data is published for purposes other than the current research.
• Collecting primary data involves field work and further analysis on the data collected to arrive at a conclusion. For instance, a marketer who wants to launch a particular product may be interested in collecting data regarding the buying habits of consumers in that particular region. The marketer can conduct field surveys to collect the relevant data, which, in turn, can be analyzed to arrive at a proper conclusion. But at the same time, he can refer to any published material that has already done an analysis. While the first method is tedious, time consuming, and expensive, the second method, which is collecting secondary data, is fast and inexpensive.
• 2.2 ADVANTAGES OF SECONDARY DATA• One of the main advantages of secondary
data is that it is quite inexpensive. A small start-up company study the market to launch a product may not be able to afford to do primary research. By getting hold of good reports and articles, such small organizations will be able to do the study cost effectively.
• Secondary data helps researchers save time. While primary research takes a considerable amount of time in the form of collecting and analyzing the data, secondary data offers readymade solutions.
• If the demographics of a particular region have to be studied, the researcher has to collect the statistics of the population. It is impossible for any organization to conduct such a census study. Here too, secondary data published by a government organization will be of considerable use. Moreover, data collected and published by the government will be less biased.
• 2.3 DISADVANTAGES OF SECONDARY DATA

• The major disadvantages of secondary data are
• Relevance• Accuracy• Sufficiency • Availability
Methods of data collection in field researchElement of differentiation
Personal interview method
Mail method Telephone interview method
No of samples Not very high due time constraint
Large no samples can be contacted
Much more sample can be contacted as less time required
Time Is used when adequate time is available
Used when considerable time is available
Used when very short is available
Cost Highest Lowest Moderately high as compared to MM
Accuracy Highest due to personal interaction and data recording with right understanding
Not very high due to a. Response rate not more than 20 to 25%b. Wrong interpretation of Qus. can not be sorted out.
Fairly high but depends on skill of interviewer in sorting out misinterpretation of Qus.
Use Not much useful when large geographic area is to be covered due to cost constraint
For geographically scattered samples this is best suited
For outstation samples the cost could be managed with mobiles. hence useful for locAl as well out stn surveys

Infrastructure Huge infrastructure in form of project leader, research officer and investigators required
Almost negligible In terms of skilled telephone operator and data base
Type of samples Useful for ignorant and illiterate samples also
Suitable for samples who can read and write
Suitable if samples can properly communicate
Questionnaire Samples loose interest with lengthy questionnaire
lengthy questionnaire is no prob. bcozSample fill it at his convenient time
Legthy questionnare wont do bcoz sample is not directly seen
Interviewer Skilled Interviewer can improve accuracy
Skilled or not skilled Interviewer does not
affect accuracy
Skilled Interviewer can improve accuracy
Type of Qus Suitable for spontaneous Ans since samples do not like to tax their memories
Suitable for spontaneous as well as well thought
Ans
Suitable only for Spontaneous Ans
Drawbacks/Limitations If investigators are not trained, he himself might
fill up Questionnaire
Questionnaire might not be filled up by intended
person
It is impossible to judge person contacted is desired person as
such the 1st name of sample must be known
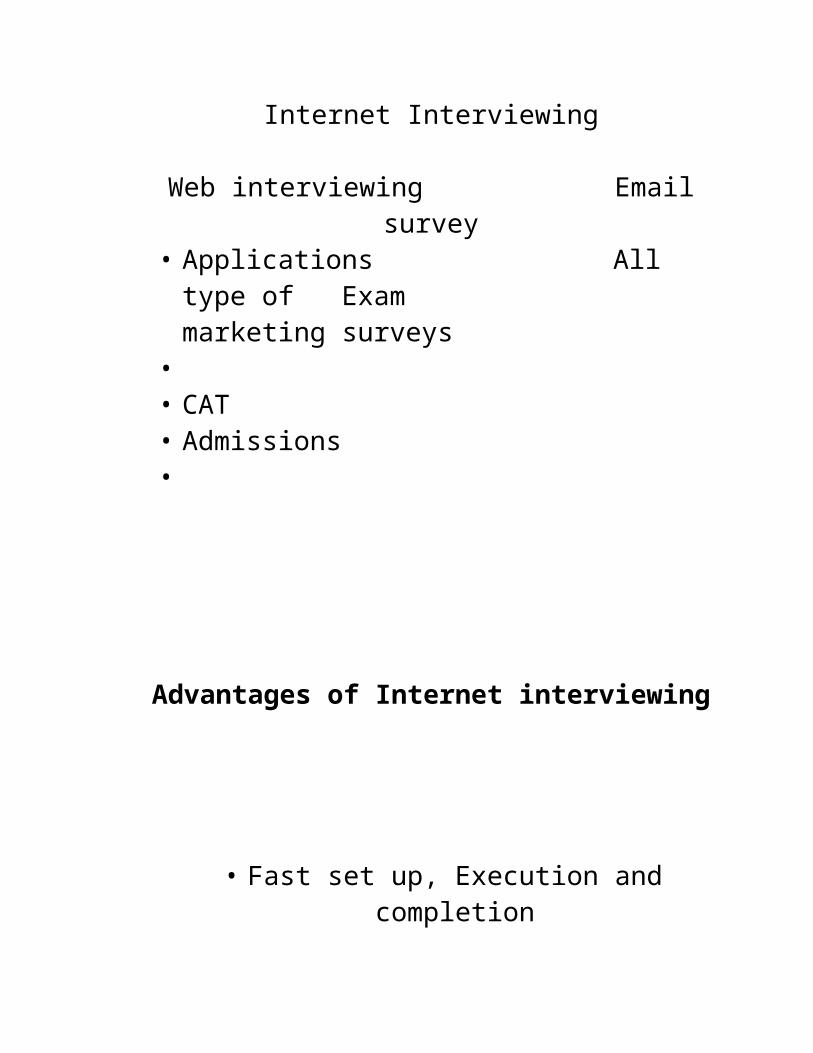
Internet Interviewing
Web interviewing Email survey• Applications All type of
Exam marketing surveys•• CAT• Admissions•
Advantages of Internet interviewing
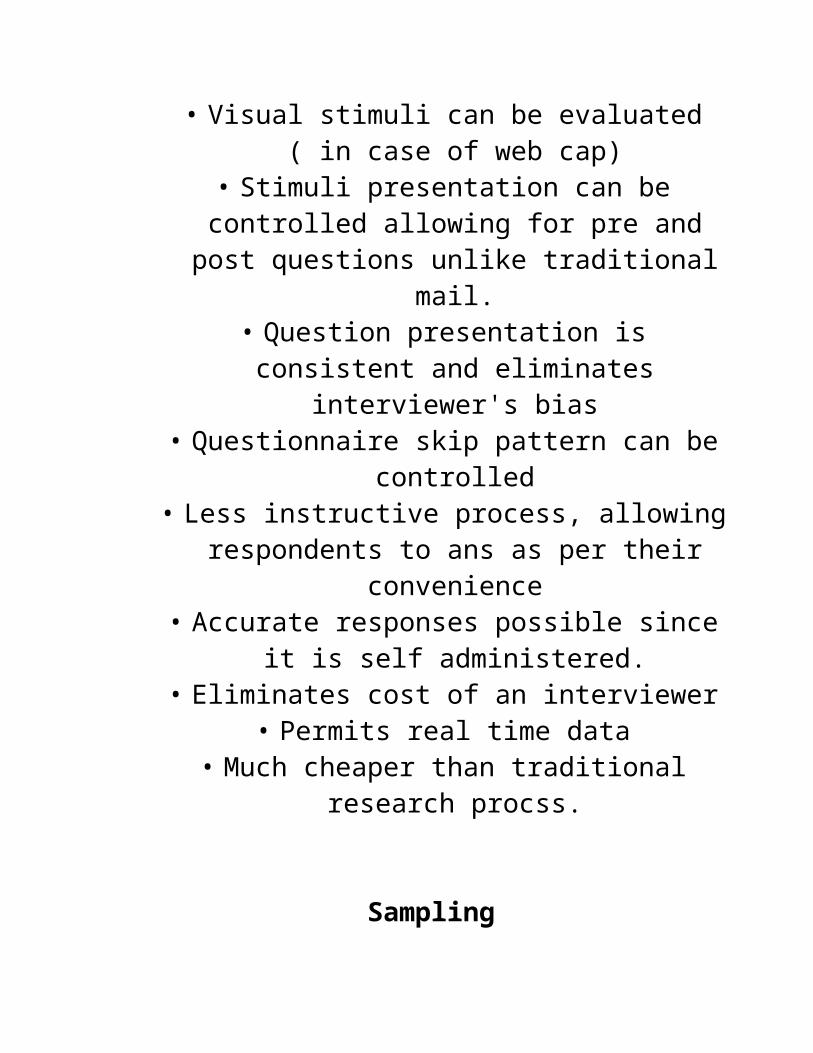
• Fast set up, Execution and completion• Visual stimuli can be evaluated ( in case of
web cap)• Stimuli presentation can be controlled allowing for pre and post questions unlike
traditional mail.• Question presentation is consistent and
eliminates interviewer's bias• Questionnaire skip pattern can be controlled
• Less instructive process, allowing respondents to ans as per their convenience
• Accurate responses possible since it is self administered.
• Eliminates cost of an interviewer• Permits real time data
• Much cheaper than traditional research procss.
Sampling
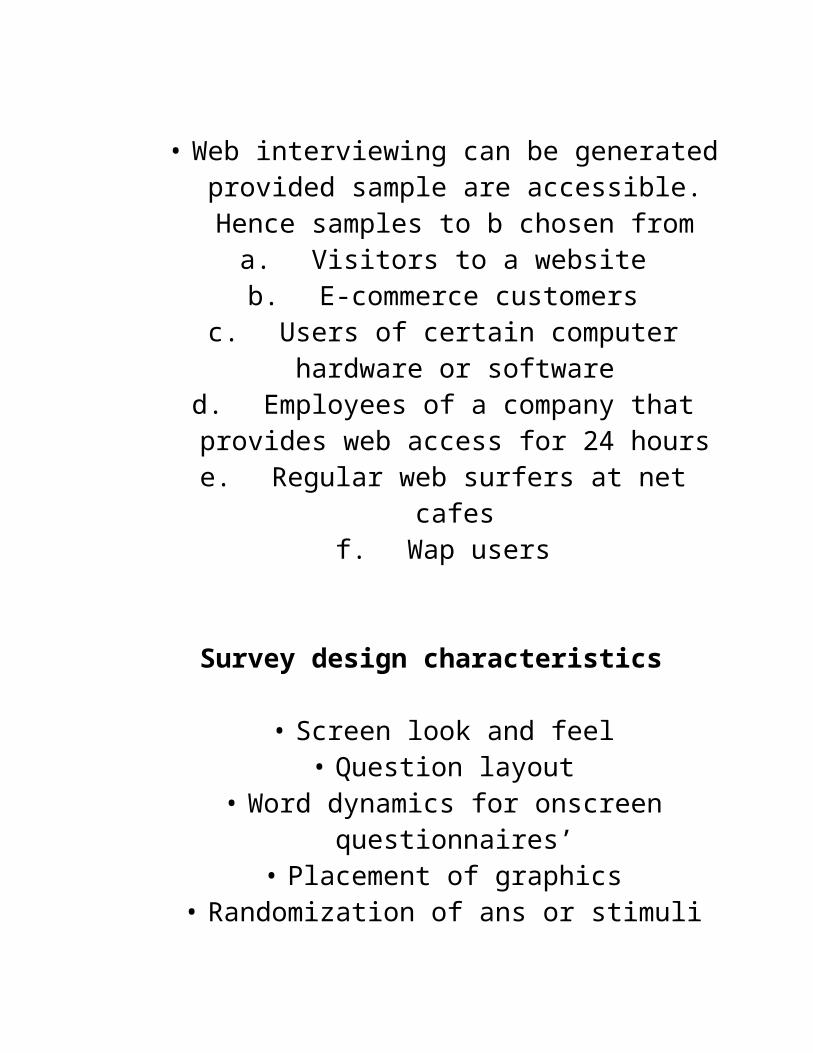
• Web interviewing can be generated provided sample are accessible. Hence samples to b
chosen from a.Visitors to a website
b.E-commerce customersc.Users of certain computer hardware or
softwared.Employees of a company that provides web
access for 24 hourse.Regular web surfers at net cafes
f. Wap users
Survey design characteristics
• Screen look and feel
• Question layout• Word dynamics for onscreen questionnaires’
• Placement of graphics• Randomization of ans or stimuli
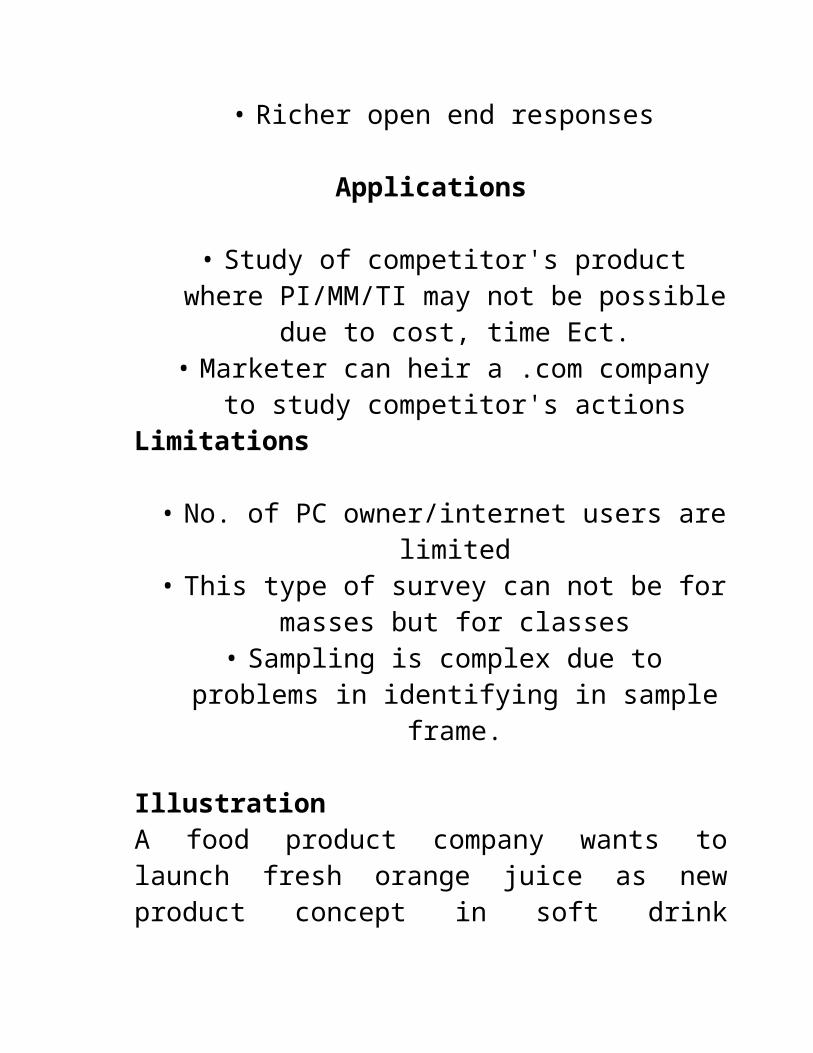
• Richer open end responses
Applications
• Study of competitor's product where PI/MM/TI may not be possible due to cost, time Ect.
• Marketer can heir a .com company to study competitor's actions
Limitations
• No. of PC owner/internet users are limited• This type of survey can not be for masses but
for classes• Sampling is complex due to problems in
identifying in sample frame.
IllustrationA food product company wants to launch fresh orange juice as new product concept in soft drink markets. Suggest what data should it collect and how.

The fresh orange juice is to be launched as new product hence the feasibility must be studied as follows:
(I) Information to be collected from Secondary Sources
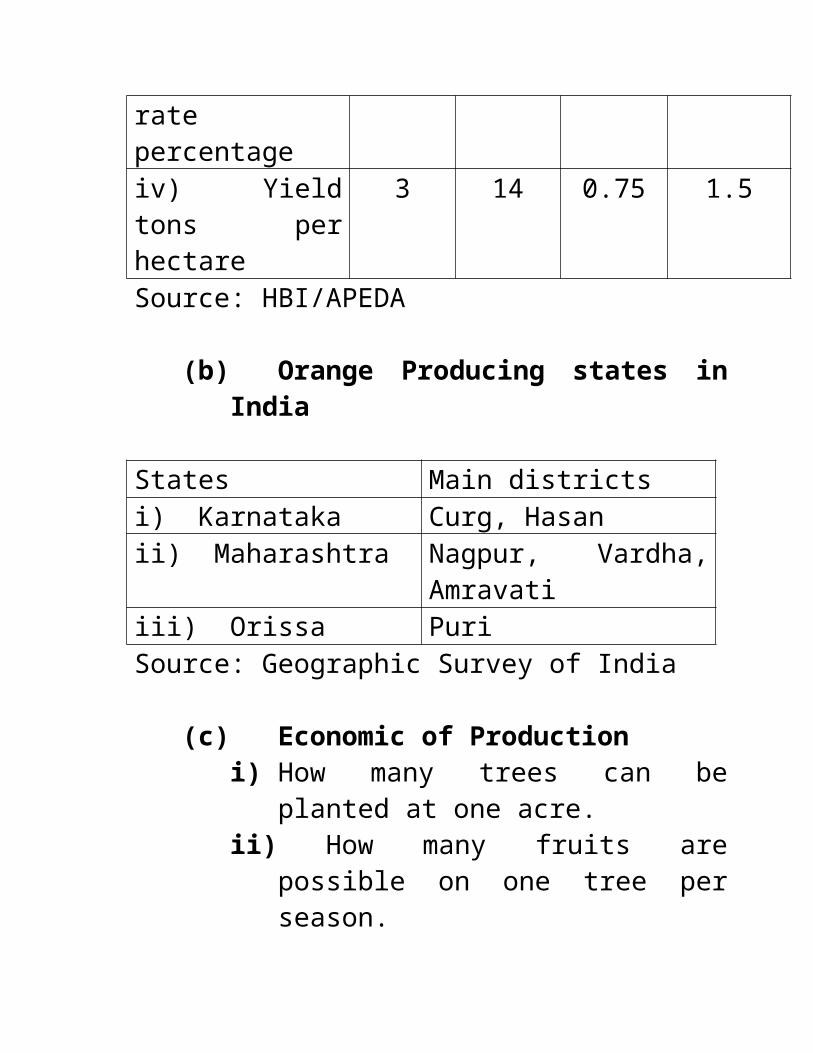
(a) Orange availability statistics:
India Brazil West-Indies
Tanzania
i) area covered Hectors
600 1300 100 400
ii) volume grown in million tons
2 18 0.5 1.2
iii) Growth rate percentage
3-4% 6-8% NIL 1-2%
iv) Yield tons per hectare
3 14 0.75 1.5
Source: HBI/APEDA
(b) Orange Producing states in India
States Main districtsi) Karnataka Curg, Hasanii) Maharashtra Nagpur, Vardha,
Amravatiiii) Orissa Puri
Source: Geographic Survey of India
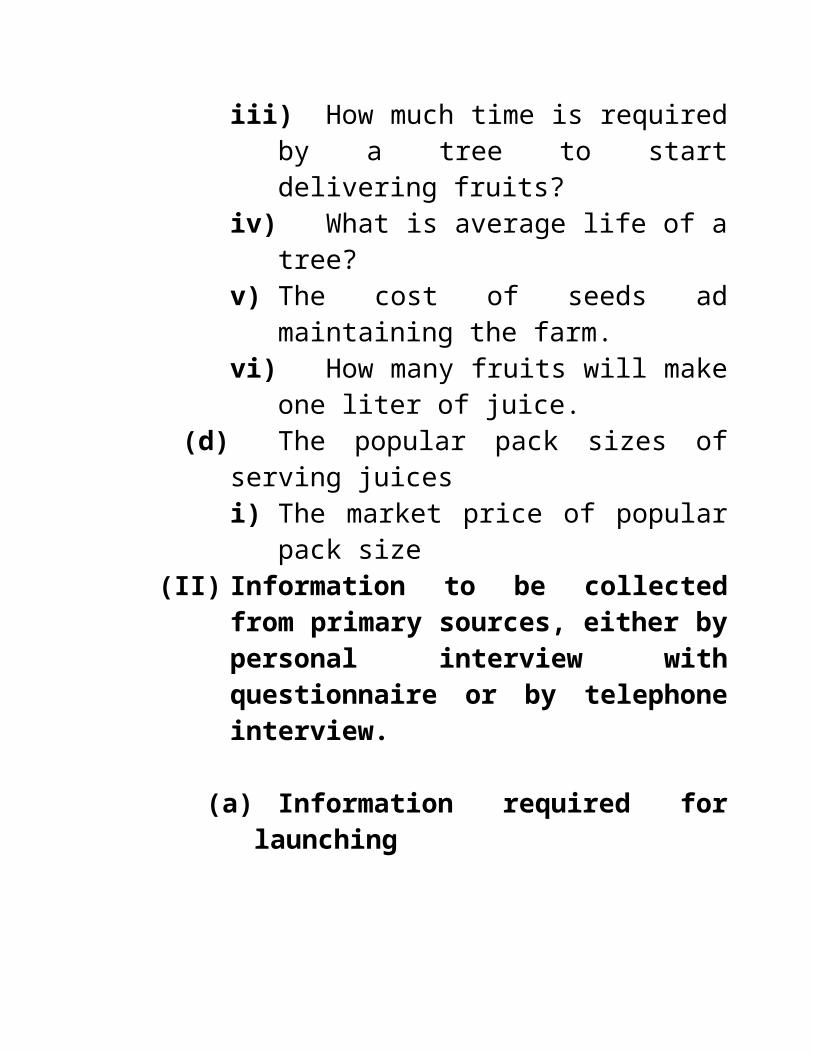
(c) Economic of Productioni) How many trees can be planted at
one acre.ii) How many fruits are possible on one
tree per season.iii) How much time is required by a tree
to start delivering fruits?iv) What is average life of a tree?v) The cost of seeds ad maintaining the
farm.vi) How many fruits will make one liter of
juice.(d) The popular pack sizes of serving juices
i) The market price of popular pack size(II) Information to be collected from
primary sources, either by personal interview with questionnaire or by telephone interview.
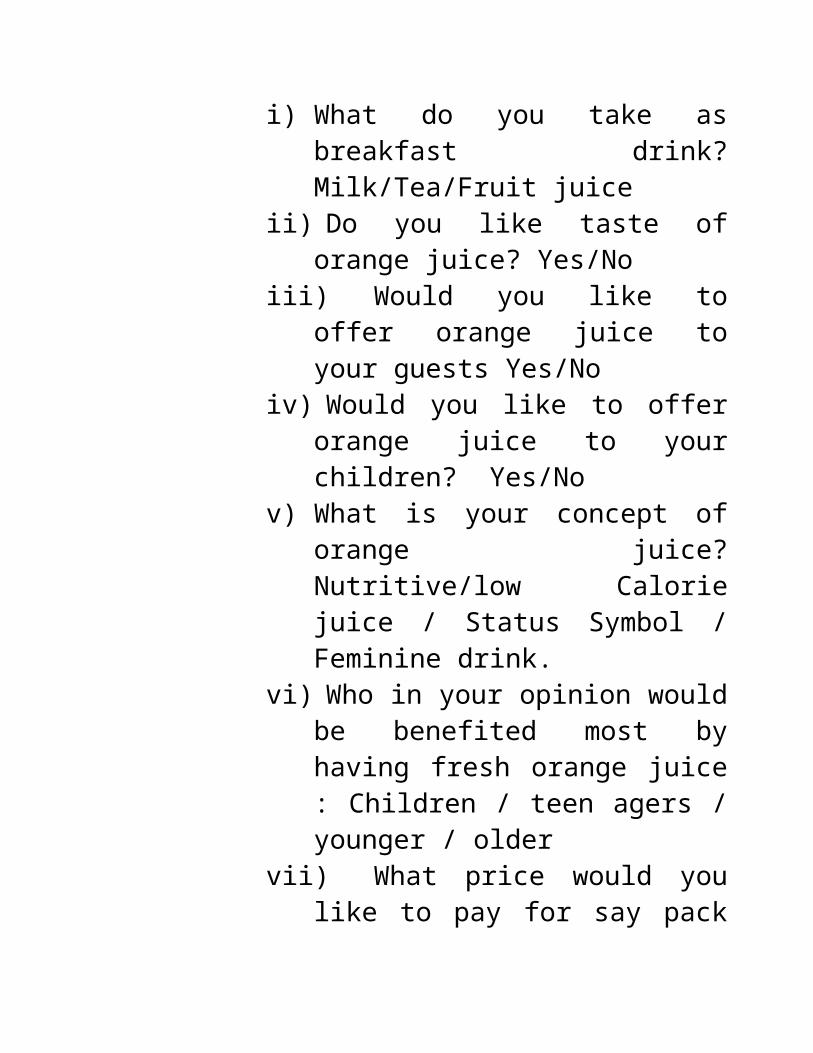
(a) Information required for launching i) What do you take as breakfast
drink? Milk/Tea/Fruit juiceii) Do you like taste of orange juice?
Yes/Noiii) Would you like to offer orange
juice to your guests Yes/No

iv) Would you like to offer orange juice to your children? Yes/No
v) What is your concept of orange juice? Nutritive/low Calorie juice / Status Symbol / Feminine drink.
vi) Who in your opinion would be benefited most by having fresh orange juice : Children / teen agers / younger / older
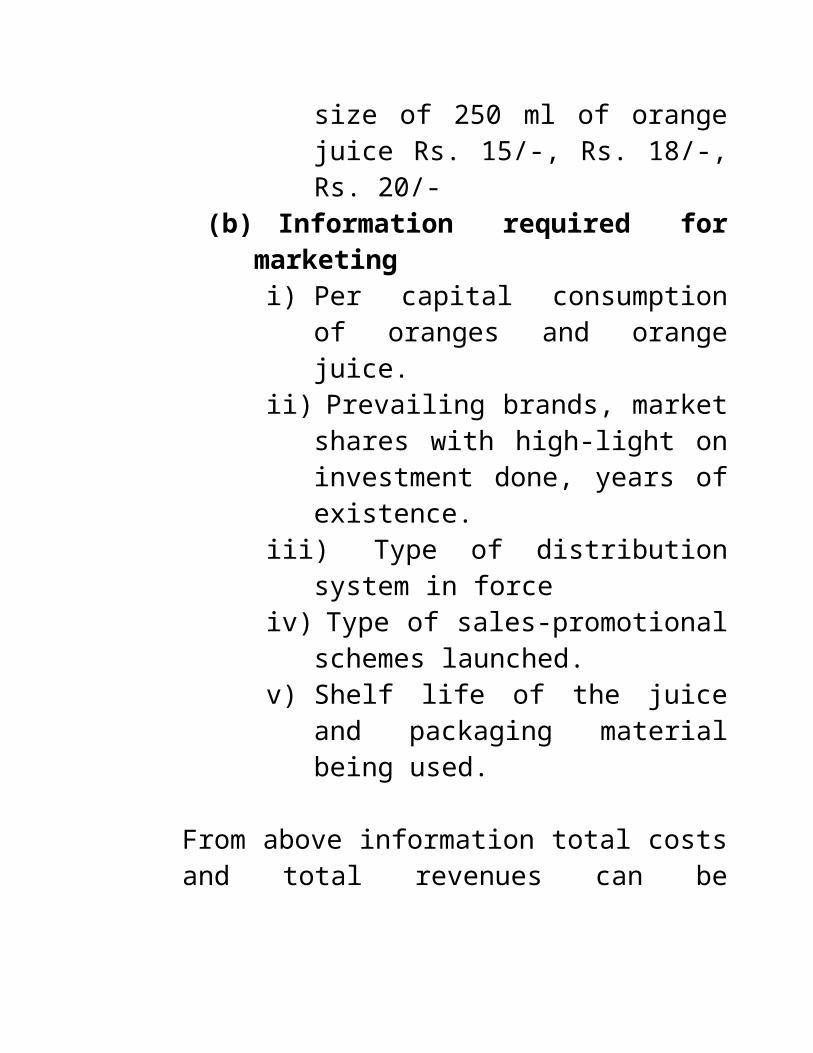
vii) What price would you like to pay for say pack size of 250 ml of orange juice Rs. 15/-, Rs. 18/-, Rs. 20/-
(b) Information required for marketingi) Per capital consumption of
oranges and orange juice. ii) Prevailing brands, market shares
with high-light on investment done, years of existence.
iii) Type of distribution system in forceiv) Type of sales-promotional
schemes launched.v) Shelf life of the juice and
packaging material being used.
From above information total costs and total revenues can be calculated and feasibility can be accessed.
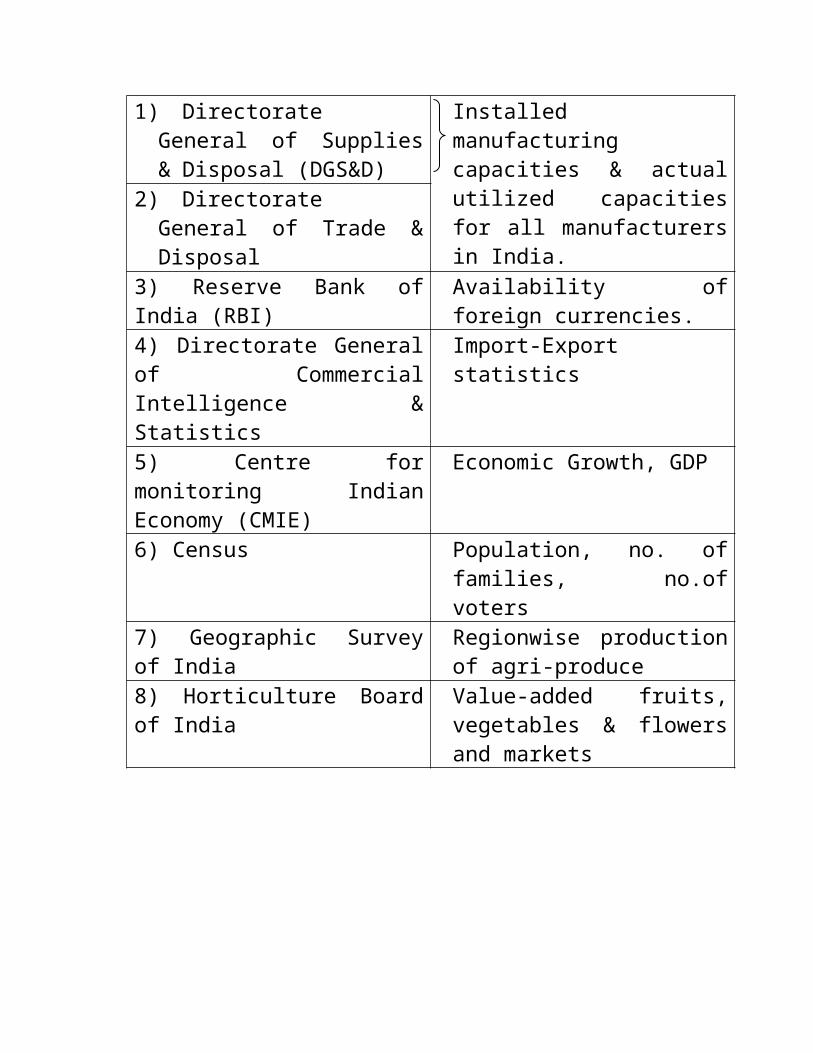
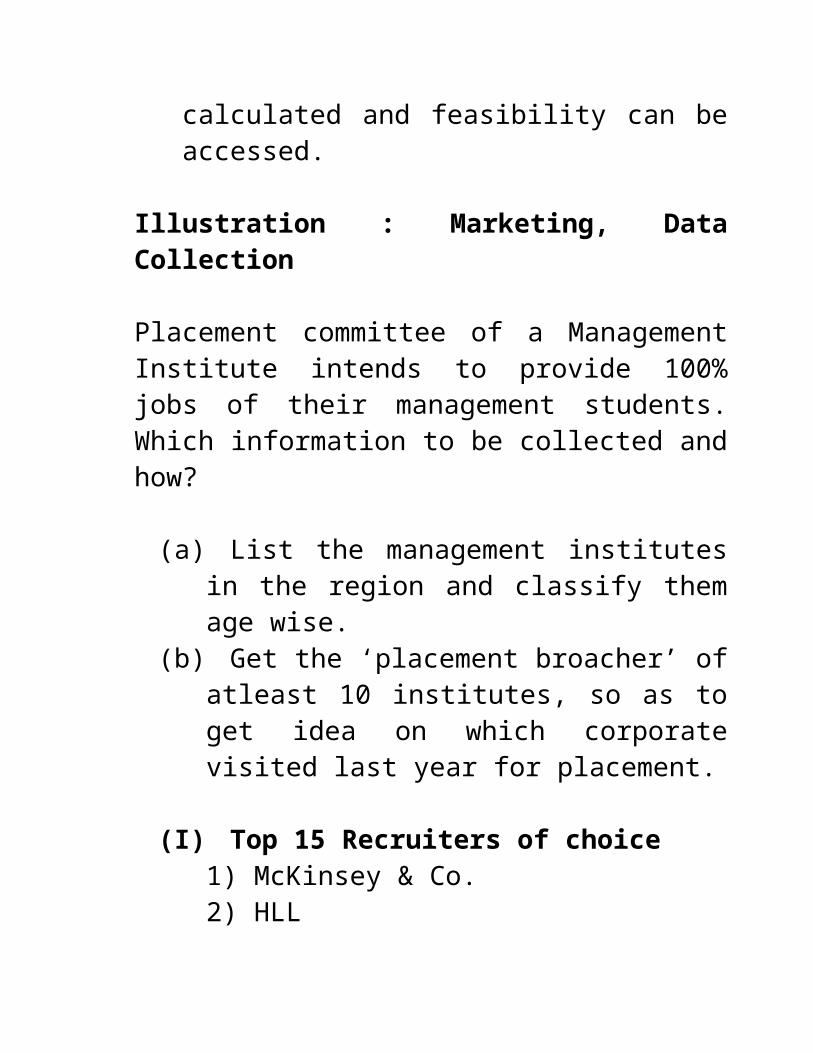
Illustration : Marketing, Data Collection
Placement committee of a Management Institute intends to provide 100% jobs of their management students. Which information to be collected and how?
(a) List the management institutes in the region and classify them age wise.
(b) Get the ‘placement broacher’ of atleast 10 institutes, so as to get idea on which corporate visited last year for placement.
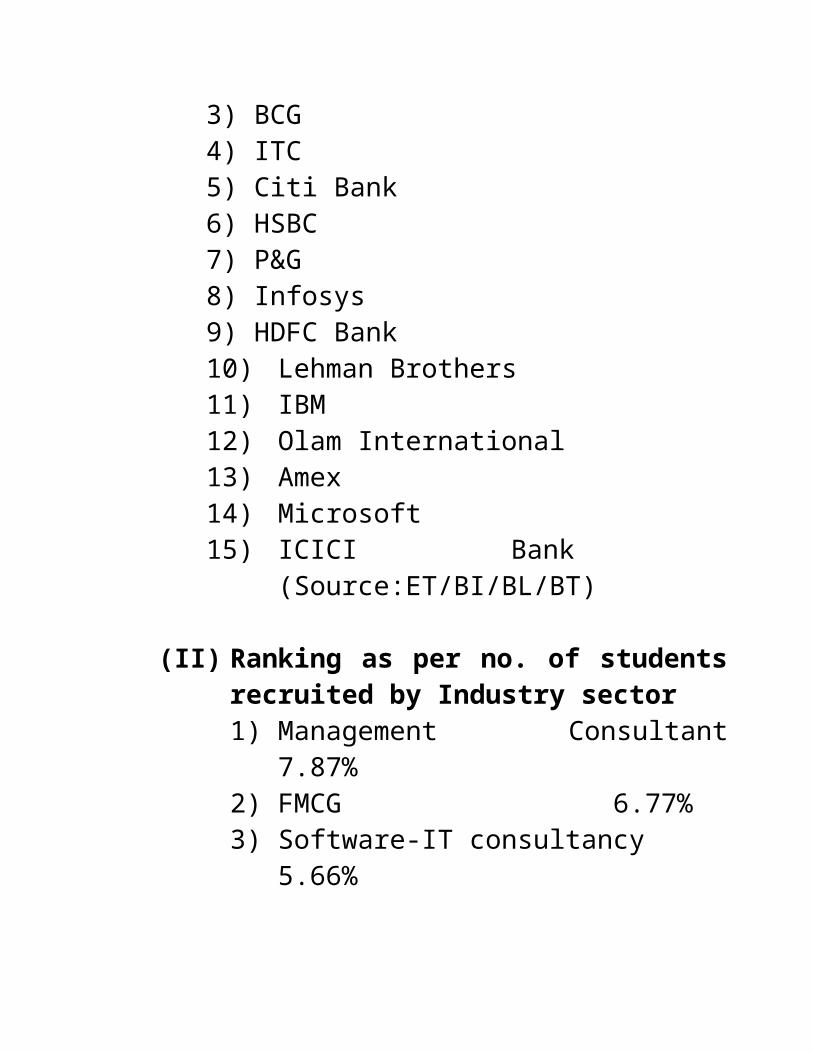
(I) Top 15 Recruiters of choice1) McKinsey & Co.2) HLL3) BCG4) ITC 5) Citi Bank6) HSBC7) P&G8) Infosys9) HDFC Bank10) Lehman Brothers11) IBM12) Olam International13) Amex
14) Microsoft15) ICICI Bank (Source:ET/BI/BL/BT)
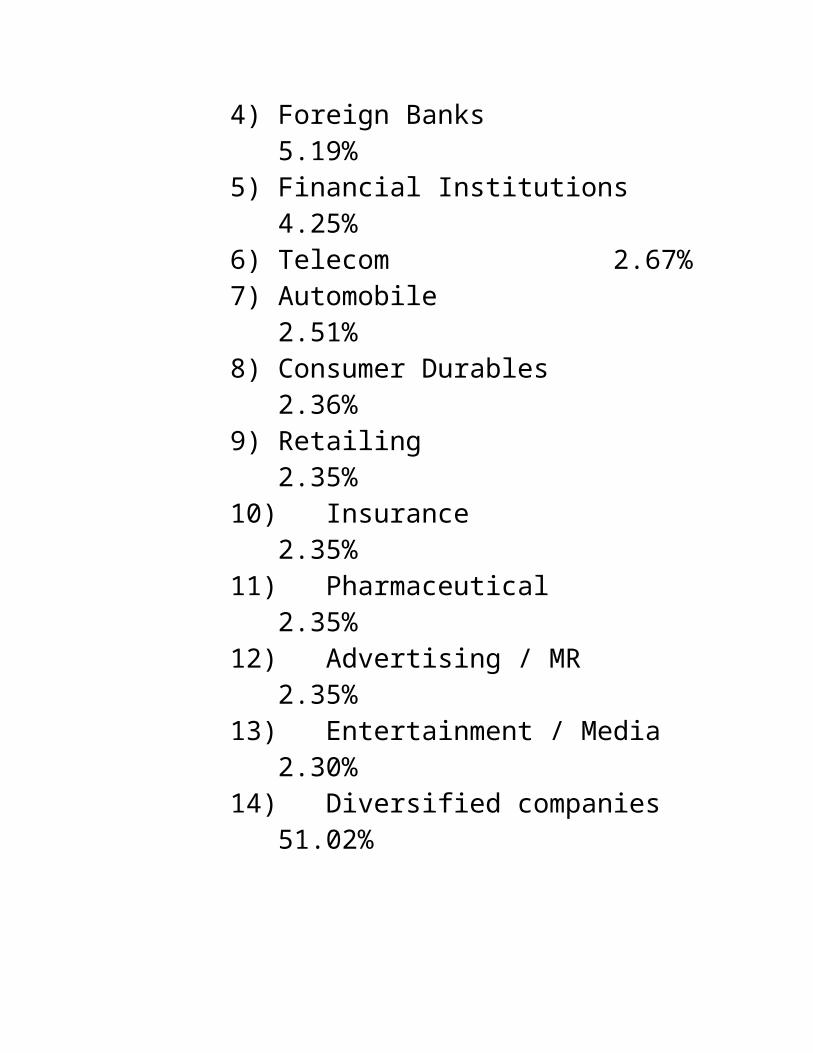
(II) Ranking as per no. of students recruited by Industry sector1) Management Consultant 7.87%2) FMCG 6.77%3) Software-IT consultancy 5.66%4) Foreign Banks 5.19%5) Financial Institutions 4.25%6) Telecom 2.67%7) Automobile 2.51%8) Consumer Durables 2.36%9) Retailing 2.35%10) Insurance 2.35%11) Pharmaceutical 2.35%12) Advertising / MR 2.35%13) Entertainment / Media 2.30%14) Diversified companies 51.02%
(III) Management Institute should interact with Industry sector to understand traits expected by them through PI/TI/MM/Internet Interviewing.
Make available this information to Internal and External faculties as well as to
students. Conduct training programme to develop respective skills.
(IV) Communicate respective industries on available skills
(V) Wait for call or generate the requirement through aggressive marketing.
MMM (Semester-II) Examiantion – 2006
Marketing Research
Time : 3 Hours Max. Marks : 70
Instructions:
(1) Attempt any five questions.(2) All questions carry equal marks.
Q.1 Discuss some of the major uses of Marketing Research in today’s Corporate Environment of India. [14]
Q.2 (a) What are the major components of a Marketing Research Report? [07]
(b) Discuss the distinct coverage of each major component of a written report. [07]
Q.3 Write short notes on ANY THREE: [14](a) Consumer Panels(b) Retail Store Audit(c) National Readership Survey(d) Data Collection Methods(e) Semantic Differential Scale(f) Rating and Ranking Scales
Q.4 (a) What general guidelines should one follow in designing a questionnaire? [07]
(b) List the merits and demerits of multiple choice questions. Under what conditions multiple choice questions be inappropriate. [07]
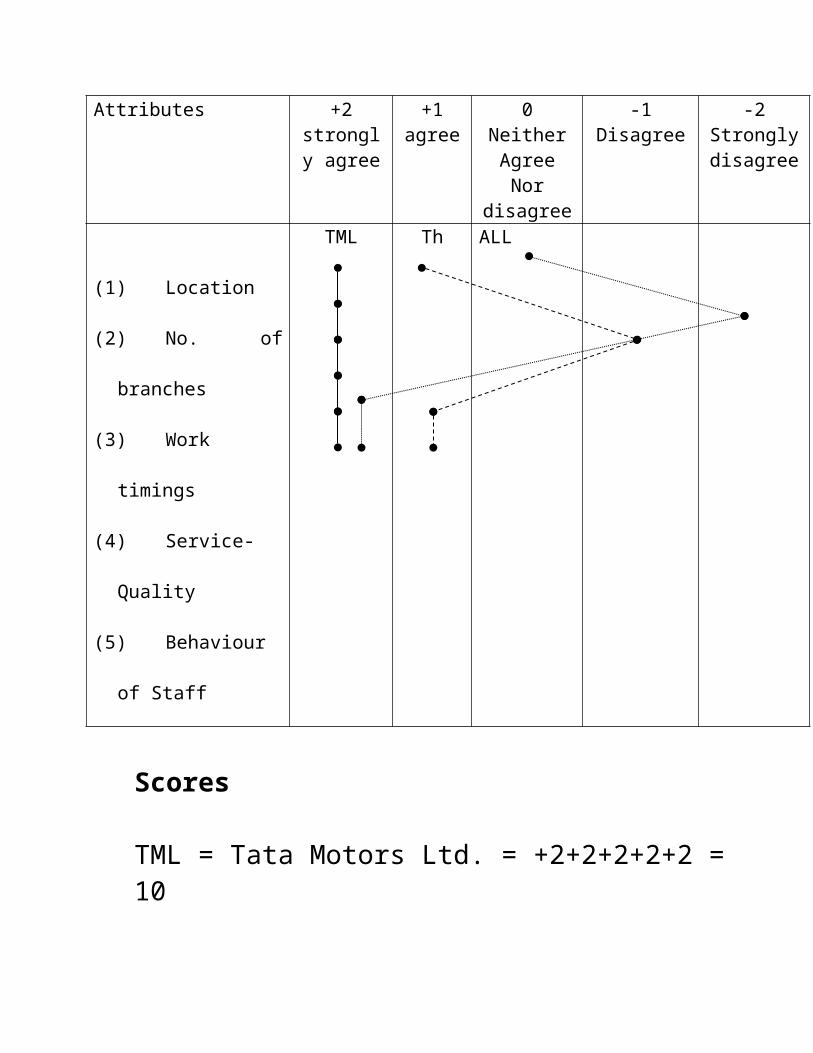
Q,5 (a) Outline a suitable Likert Scale to examine the corporate image of a bank measured by its location, number of branches, timings, service quality, behaviour of staff, etc. [07]
(b) For the same problem in Q.5 (a) construct a suitable semantic differential scale.
[07]
Q.6 (a) Why is sampling used in Marketing Research? [07]
(b) What factors would you consider in determining the sample size for a Marketing Research study? [07]
Q.7 State and explain various Limitations of Market Research. [14]
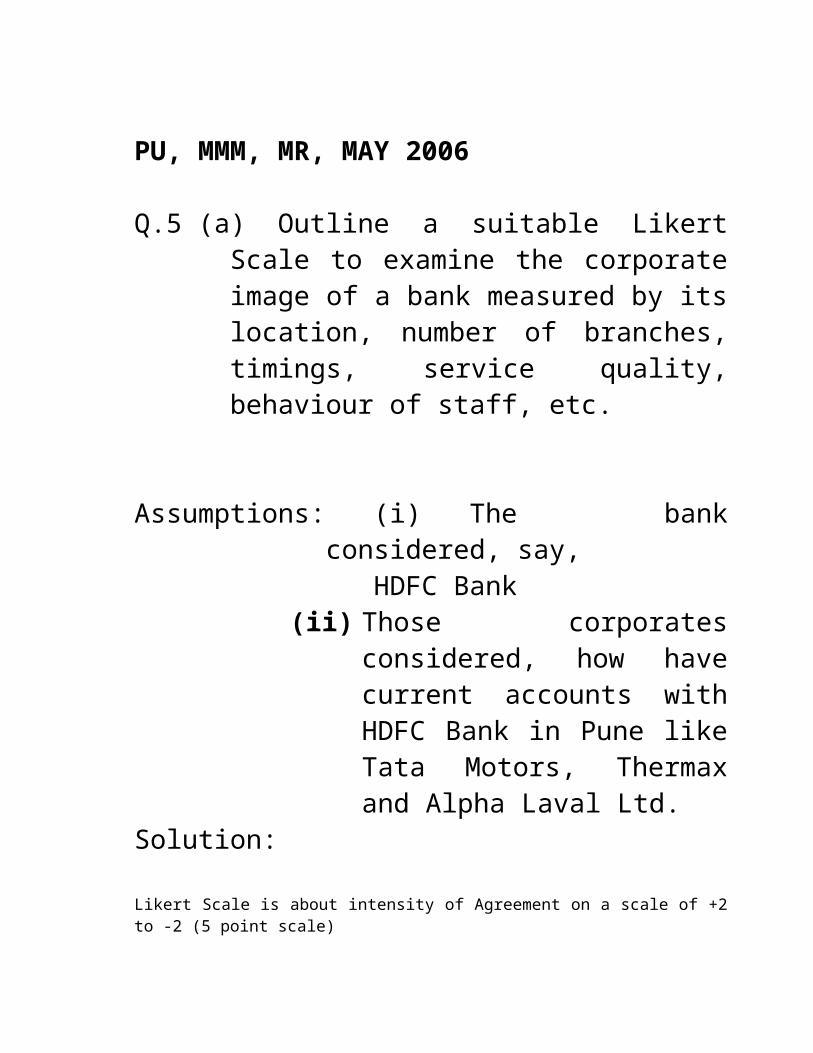
PU, MMM, MR, MAY 2006
Q.5 (a) Outline a suitable Likert Scale to examine the corporate image of a bank measured by its location, number of branches, timings, service quality, behaviour of staff, etc.
Assumptions: (i) The bank considered, say, HDFC Bank
(ii) Those corporates considered, how have current accounts with HDFC Bank in Pune like Tata Motors, Thermax and Alpha Laval Ltd.
Solution:
Likert Scale is about intensity of Agreement on a scale of +2 to -2 (5 point scale)Attributes +2
strongly agree
+1agree
0Neither
Agree Nor disagree
-1Disagree
-2Strongly disagree

(1)Location
(2)No. of branches
(3)Work timings
(4)Service-Quality
(5)Behaviour of Staff
TML Th ALL
Scores
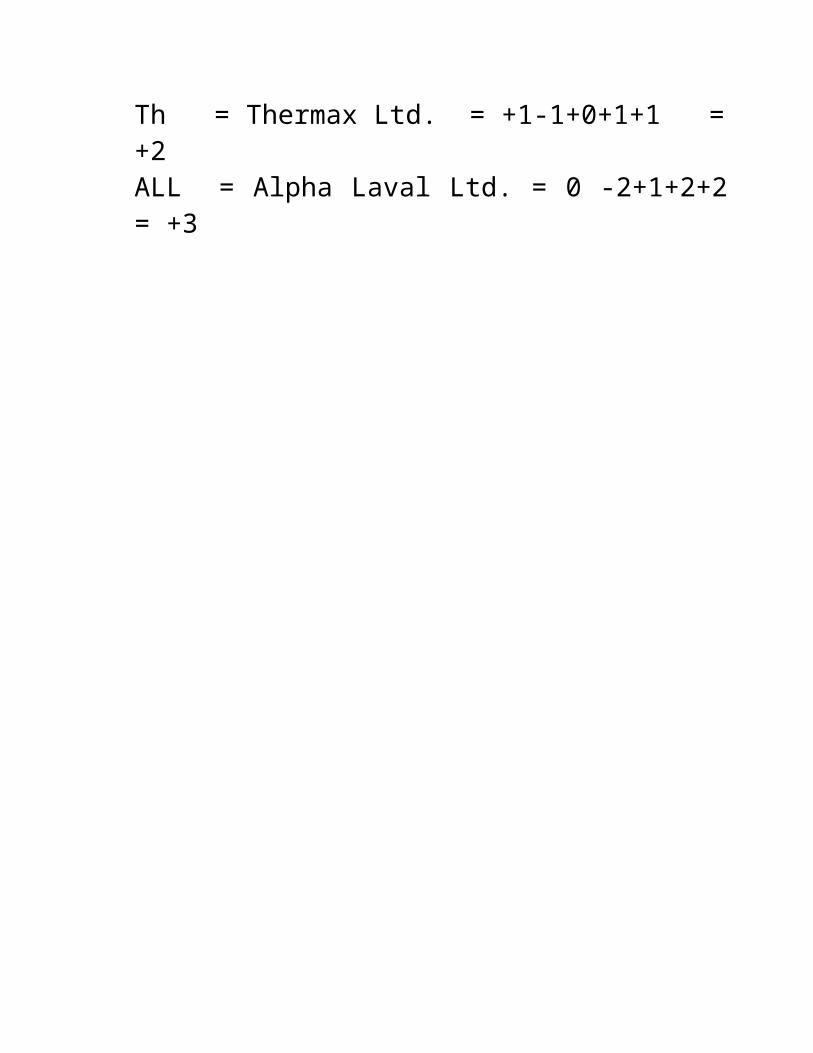
TML = Tata Motors Ltd. = +2+2+2+2+2 = 10Th = Thermax Ltd. = +1-1+0+1+1 = +2ALL = Alpha Laval Ltd. = 0 -2+1+2+2 = +3
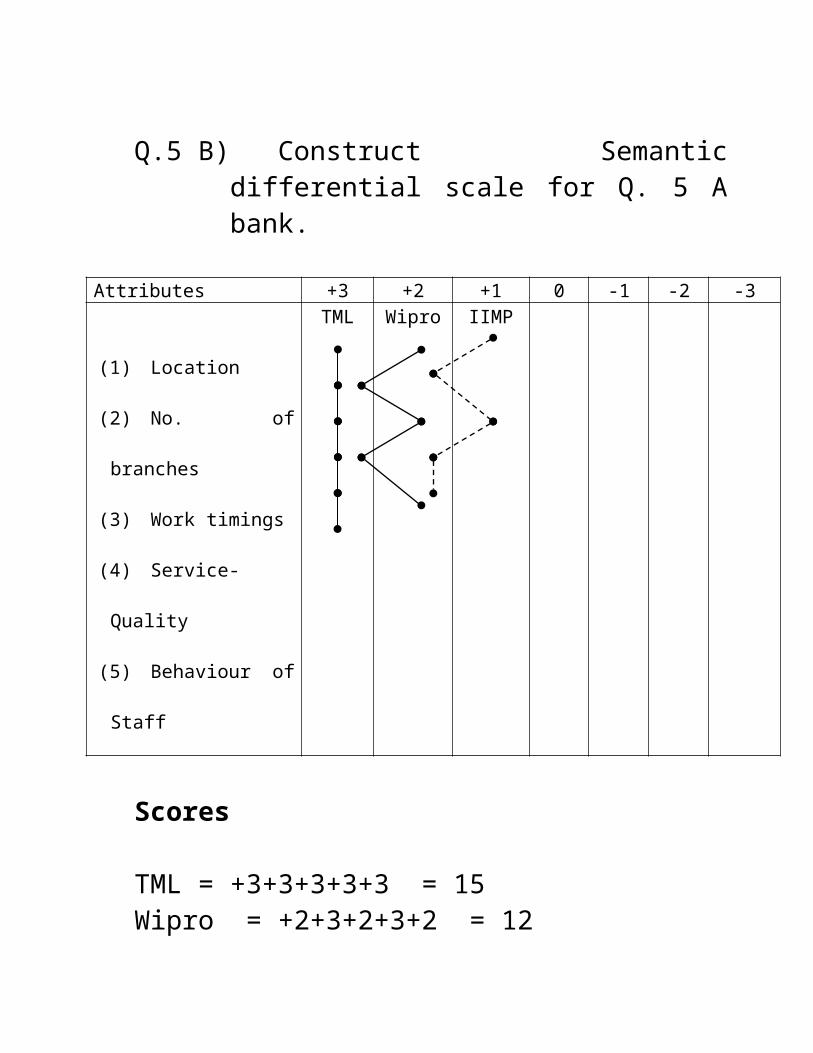
Q.5 B) Construct Semantic differential scale for Q. 5 A bank.
Attributes +3 +2 +1 0 -1 -2 -3
(1) Location
(2) No. of branches
(3) Work timings
(4) Service-Quality
(5) Behaviour of
Staff
TML Wipro IIMP
Scores
TML = +3+3+3+3+3 = 15Wipro = +2+3+2+3+2 = 12IIMP = +1+2+1+2+2 = 8
CH 3SPECIALISED TECHNIQUES OF MARKETING
RESEARCH

(I) NATIONAL READERSHIP SURVEY (NRS)
Objective of NRS is to provide such information which is simultaneously acceptable to media owners (DD, ET, etc.) Advertises (HLL, P&G, Godrej, etc.) and advertising agencies (JWT, O&M, etc.). It normally provides following information:
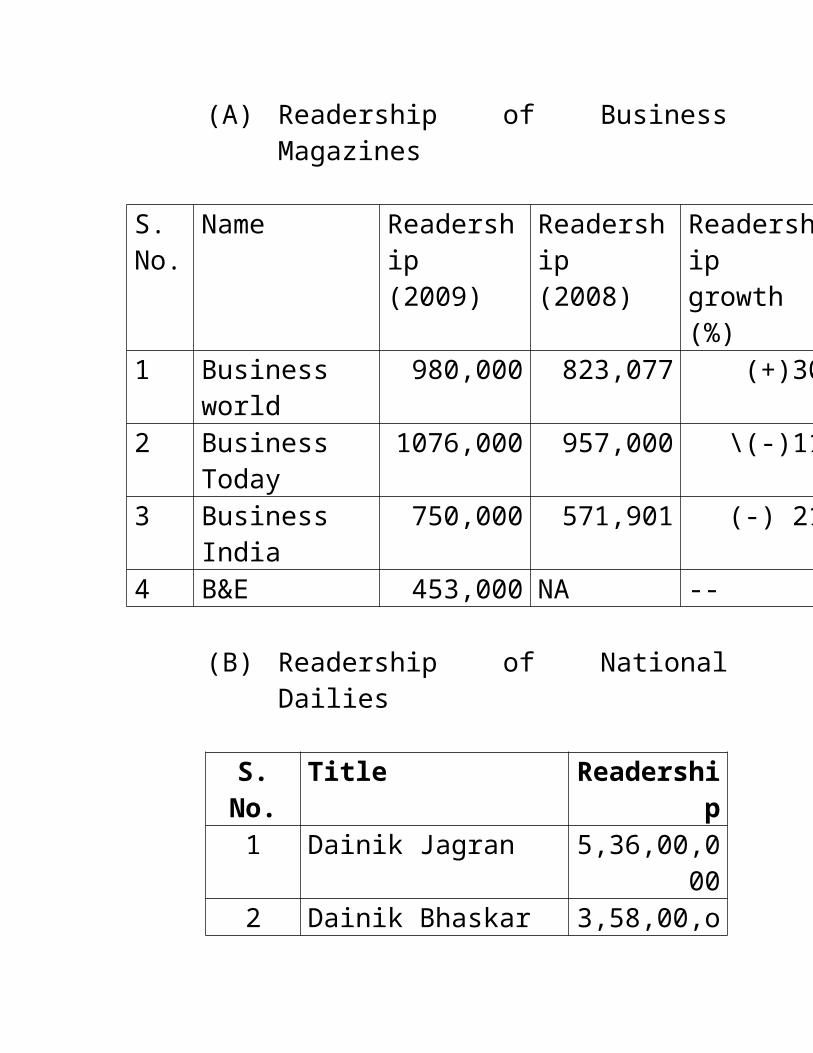
(1) The readership of 535 publications (230 dailies and 305 magazines) as follows:(A) Readership of Business Magazines
S.No.
Name Readership (2009)
Readership (2008)
Readership growth (%)
1 Business world
980,000 823,077 (+)30
2 Business Today
1076,000 957,000 \(-)11
3 Business India
750,000 571,901 (-) 21
4 B&E 453,000 NA --
(B) Readership of National Dailies
S. No. Title Readership1 Dainik Jagran 5,36,00,000

2 Dainik Bhaskar 3,58,00,ooo3 Eenadu 13,800,0004 Lokmat 2,29,oo,ooo5 AmarUjala 10,800,0006 Hindustan(hindi+eng) 2,96,oo,ooo7 Daily Thanthi 10,400,0008 Dinakaran 9,639,0009 Rajastan Patrika 9,391,000
10 Malayala Manorama 8,409,000
(2) Cinema and TV viewership and radio listener sip as follows:(A) In India everyday, one crore people
watch cinema. In South India, people watch regional movies whereas in North India, people watch Hindi movies.
(B) TV viewer ship: India has 135 million TV homes, of which 70 million are C&S homes &8 million DTH homes. From this, TV viewer ship can be calculated by multiplying number of people (5 per home) to TV homes.
(C) Radio Listernship : Indian radio reach – 95 percent population of India listens Vividh Bharati. Only 3 percent population listen private radio i.e. FM
(say Radio Mirchi). India has 190 radio centres with 324 channels.Prime time ad tariff for Vividh Bharati is Rs. 2500/- for 10 second ad and Rs. 1300/- for non-prime time. Similar figures for FM are Rs. 2000/- / 1000/-.
(3) Reach of Indian PostIndian post has 1.56 lakhs post offices in 470 cities, 6,34,321 villages in 29 states. Total number of postman 3,59,685, area covered by each post office 21.13 sq.km., population served per post 6602. Everyday Indian post receives and distributes 0.30 crores mails, the configuration of which is as follows:
Service Subsidy per unit (in Rs.)
Traffic(in million)
Total deficit
(in Rs. Cr.)Post Card 6.1 255.1 156.6Printed post card 0.7 43.6 2.9Letter cards 4.1 327.5 135.4Registration 16.0 223.3 357.9Money Order 28.5 116.5 331.5Reg. Newspaper (single)
7.9 59.3 46.6
Reg. Newspaper 12.2 3.6 4.4
(bundle)Printed Books 9.2 2.5 2.3Parcel 12.1 5.3 6.5Others NA NA 160.0Total 1203.0
(4) The degree of duplication among various publications and between the different media. For e.g. how many readers read same ad in two print media (Business Magazine and Economic Times) as well how many readers see the ad say in Economic Times and TV.
(5) Socio-economic characteristics of readers of various publications like dailies and magazines with respect to income level, educational background, profession, etc.
Consumer profile for Dainik Jagaran is as follows:
(a) 4.3 million graduates and above (b) 48% belong to SECA
households (c) 49% belong to 15,000 + income
group(d) 45% of readers have
refrigerators (e) 38% of readers have TV sets
(f) 48% have washing machine and ACs
(g) 46% have four wheelers (h) 38% have motor cycles
Consumer profile for The Hindu is as follows:
(a) Two lakhs of readers belong to SEC A1
(b) 19 lakhs belong to age 20+ (c) 12 lakhs belong to graduate level
education(d) More than 8 lakhs belong to
income Rs. 5000+(e) Five lakhs have profession like
Executive, Business class, etc.
(II) Retail Stores Audit
It is a method of quantitative feedback from the market on consumer buying habits. It is the exclusive service provided by ORG – MARG to Indian FMCG industry. The basic objective of retail stores audit is to observe or count the movements of the products off the retailers shelves to the consumers. The procedure adopted is as follows:
(a) A list of retail outlets in India for a particular city is prepared by using data from Indian retailers Association. Based on the sales turnover, the retail outlets are classified as small, medium and large.
(b) The representative of ORG-MARG calls on all listed retailers to us their concurrence for providing information. Only those are visited who express willingness to cooperate.
(c) The teams are sent to different areas already planned in advance and with the guidelines on collection of data
(d) The team visit retail outlets twice in a month, once in first week of month (assuming retailer fills up inventory in the beginning of month) and during last week of month. The stop position is actually counted for all the commodities, brands stock by retailer. The month-end inventory is subtracted from month-beginning inventory. The difference is the movement of goods of the retailer shelves.

(e) For recording the data, special booklets are prepared in which the team records the entries.
(f) The data from all the retail outlets is compiled and then systematically analyzed.
The analysis provides following useful information:
(i) Total sales for product type (ii) Total sales for different brands
and thereby market share(iii) Total sales for different pack
sizes The above information is very useful for marketing planning, packaging decisions and promotion decisions.
The main disadvantage of this method is Brand Loyalty can not be studied, for which next tool Consumer Panels is followed.
(III) Consumer Panels
Retail Store Audit is quantitative tool whereas Consumer Panels is qualitative tool which focuses on Brand Loyalty. Such panels can be
set up by manufacturing companies like HLL or Research Agencies like ORG-MARG or by Advertising Agencies like JWT. Sometimes Government also might formulate consumer panels for studying impact of budget on consumers, etc.
The size of total number of panels depends on total population to be covered. For example, for consumer goods, to collect data from population of 30 crores consumers (USA) around 1,000 panels are required. From this formula, if we calculate for Indian markets, total 9,000 panels will be required for collecting the data.
The procedure of data collection is as follows:(a) The panel members are allotted a fix area
like one society having fifty apartments. So, in specified area, the societies are selected which have minimum fifty households. A panel consists of two people, essentially matured husband and wife.
(b) Panel members are asked to maintain purchase records in the registers provided by sponsor. The details to be recorded are as follows:
Brand purchased, Number of units bought, Price paid, Pack size, Place of purchase and reason for purchase.
(c) Panels are advised to visit households on week-end days.
(d) The registers from panel members are collected at the end of the month and then the data is analyzed for complete city. After tabulating the information, it provides following valuable information:(i) Number of families purchasing not
only sponsors brand but competitor’s brands also
(ii) Trends in retail sales: composition of India`s total Retail market is as follows:,Food&grocery 75%,Clothing&textile 7%, Consumer durables 4%,Jewelery&watches 4%Home décor&furnishing 3%,Beautycare 2%,Misc 5%(iii) Purchases by new customers V/s
Purchases by old customers(iv) Evidence of Brand Loyalty (Why
same product is purchased repeatedly or why product is purchased from a specific retailer or broker)
(v) Market share
The major limitation of consumer panels study is its costliness. Panel members expect handsome honorarium which is as follows Rs. 50/- per entry per family per week. Hence for a month the total cost for nation wide survey works out to be – 9,000 x Rs. 50/- x 4 x 50 = 9,000,0000
(IV) TEST MARKETING
Basic objective of test marketing is to safeguard the investment risk before initiating commercial production.
Test marketing could be done at one city at one time or many cities at same time. The criteria for selecting the test area i.e. the city is the profile of resident of city must match with target consumers’ profile.
The test marketing can be done in either of the following way:
(i) Before the product formulation but after branding, packaging, positioning, etc. has
been finalized, to test expectations of consumers about product features.(examples – HLL’s Closeup, HLL’s Liril, M&M’s Bijali, P&G’s Pantene,
(ii) After the product is finalized but before introducing to markets, to test reactions of marketing middlemen, customers on brand name, style, looks, etc.(example – Tata Motors Indica, Bajaj Eliminator and Movies)
Whether marketer follow (a) type of test marketing or (b) type, he has to work out the market acceptance by using anyone of following methods are used to project estimate of national sales based on test area sales of test marketing:
(a) Buying Income Method Total Income of Country
Estimate of national sales = --------------------------------- x Test Area Sales Test Area income
(b) Sales Ratio Methods
National sales of other product Estimate of national sales = ------------------------------------------------- x Test Area
* Test area sales of this other productSales of
Test product
* This other product means similar products. For example, if test marketing of say semi-automatic washing machine is done then all sized semi-automatic washing machine are considered.
(c) Share of market method Test area sales of new brand
Estimate of national sales = ------------------------------------- x National sales of ** Test Area sales of this whole category Whole product category
** Whole product category means entire product range. For example, if test marketing of washing machine is being done then entire home appliances are considered.
(V) RESEARCH IN ADVERTISING DECISIONS
At the end of the year, top management always ask the brand manager, a simple question like have you wasted money or have you invested money. This question could be replied by undertaking research in advertising as follows:
The objectives for such research could be (a) To identify target markets, their
buying behavior, their perception on price and value of a product or service
(b) Ad copy testing for its effectiveness
(c) Media research and selection .Effective use of publicity to arrange company`s name always in news.
The companies in more News
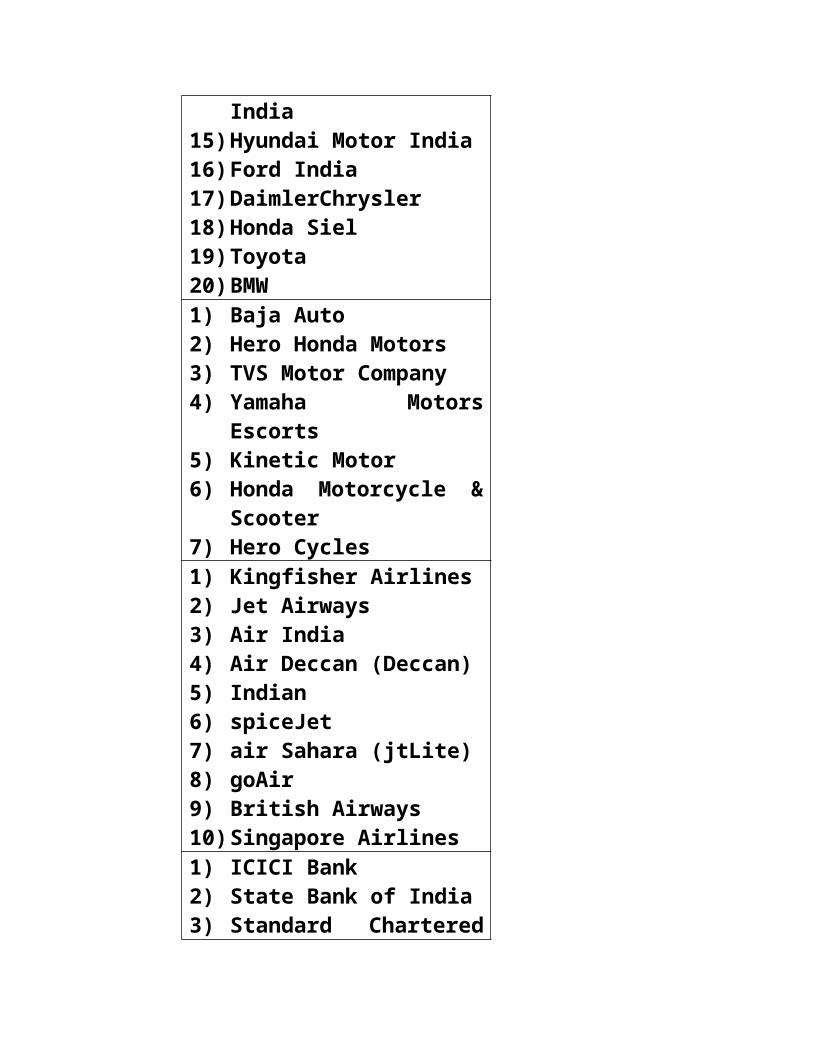
India’s Biggest News-Makers company
Rank 07Automotive 1) Tata Motors
2) Mahindra & mahindra3) Maruti Suzuki India4) General Motors India5) Hyundai Motor India6) Ford India7) DaimlerChrysler8) Honda Siel9) Toyota10) BMW
11) Tata Motors12) Mahindra & mahindra13) Maruti Suzuki India14) General Motors India15) Hyundai Motor India16) Ford India17) DaimlerChrysler18) Honda Siel19) Toyota20) BMW1) Baja Auto2) Hero Honda Motors3) TVS Motor Company4) Yamaha Motors Escorts5) Kinetic Motor
6) Honda Motorcycle & Scooter
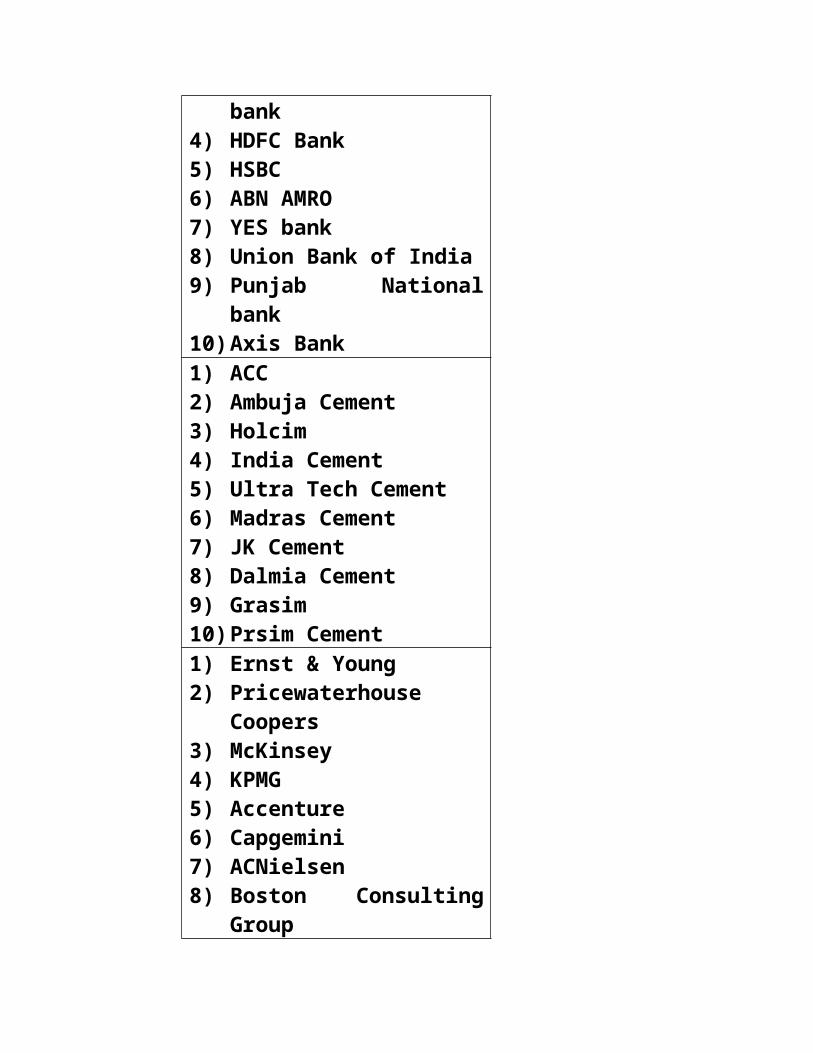
7) Hero Cycles1) Kingfisher Airlines2) Jet Airways3) Air India4) Air Deccan (Deccan)5) Indian6) spiceJet7) air Sahara (jtLite)8) goAir9) British Airways10) Singapore Airlines1) ICICI Bank2) State Bank of India3) Standard Chartered
bank4) HDFC Bank5) HSBC 6) ABN AMRO7) YES bank8) Union Bank of India9) Punjab National bank10) Axis Bank1) ACC2) Ambuja Cement3) Holcim4) India Cement5) Ultra Tech Cement6) Madras Cement7) JK Cement8) Dalmia Cement9) Grasim 10) Prsim Cement

1) Ernst & Young2) Pricewaterhouse
Coopers3) McKinsey4) KPMG5) Accenture6) Capgemini7) ACNielsen8) Boston Consulting
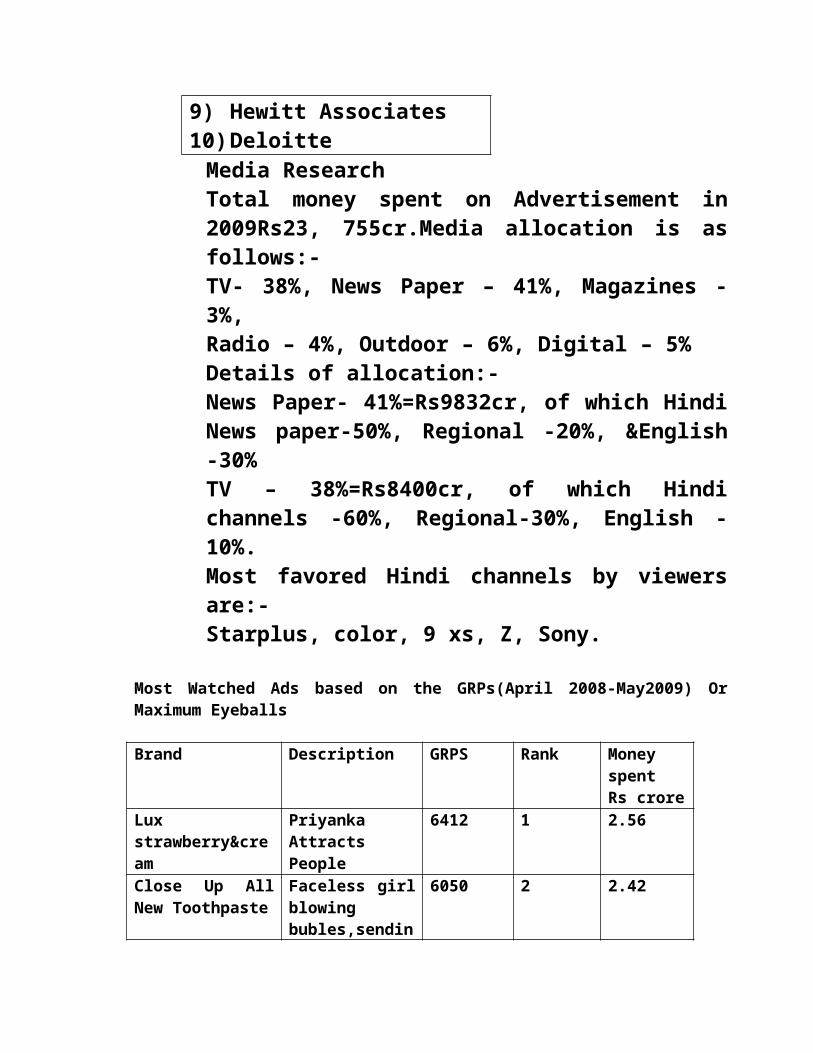
Group9) Hewitt Associates10) Deloitte
Media ResearchTotal money spent on Advertisement in 2009Rs23, 755cr.Media allocation is as follows:-TV- 38%, News Paper – 41%, Magazines -3%,Radio – 4%, Outdoor – 6%, Digital – 5%Details of allocation:-News Paper- 41%=Rs9832cr, of which Hindi News paper-50%, Regional -20%, &English -30%TV – 38%=Rs8400cr, of which Hindi channels -60%, Regional-30%, English -10%.Most favored Hindi channels by viewers are:-Starplus, color, 9 xs, Z, Sony.
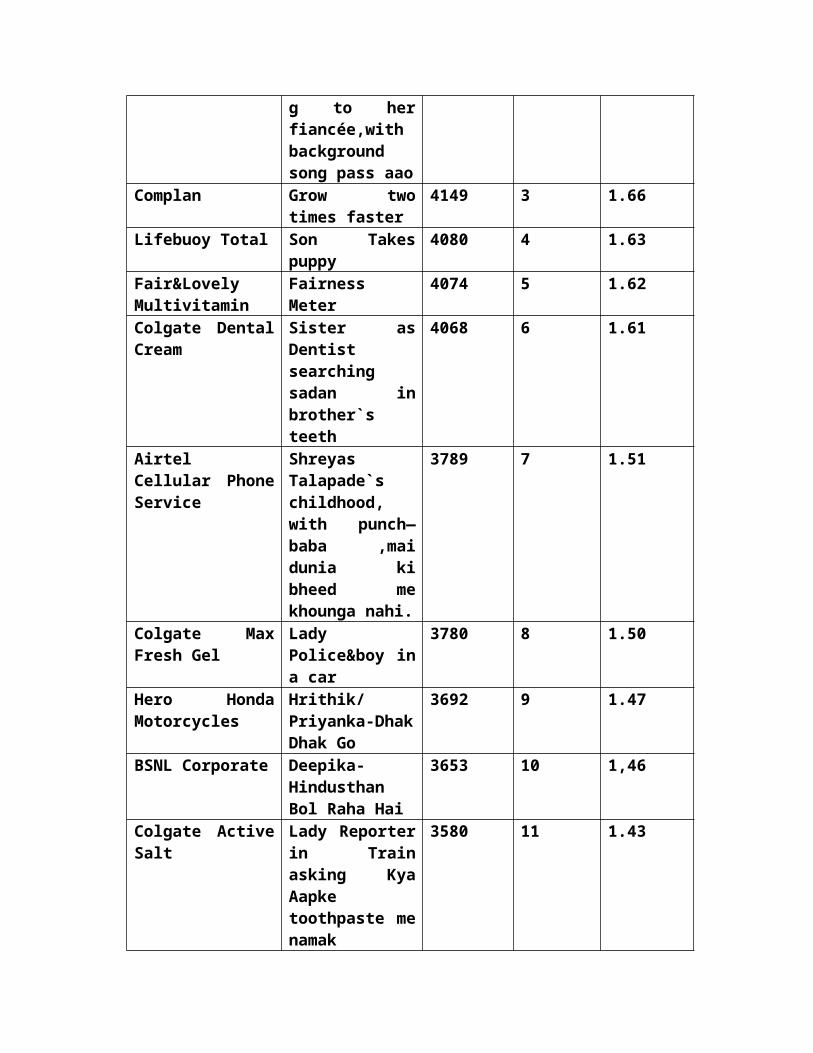
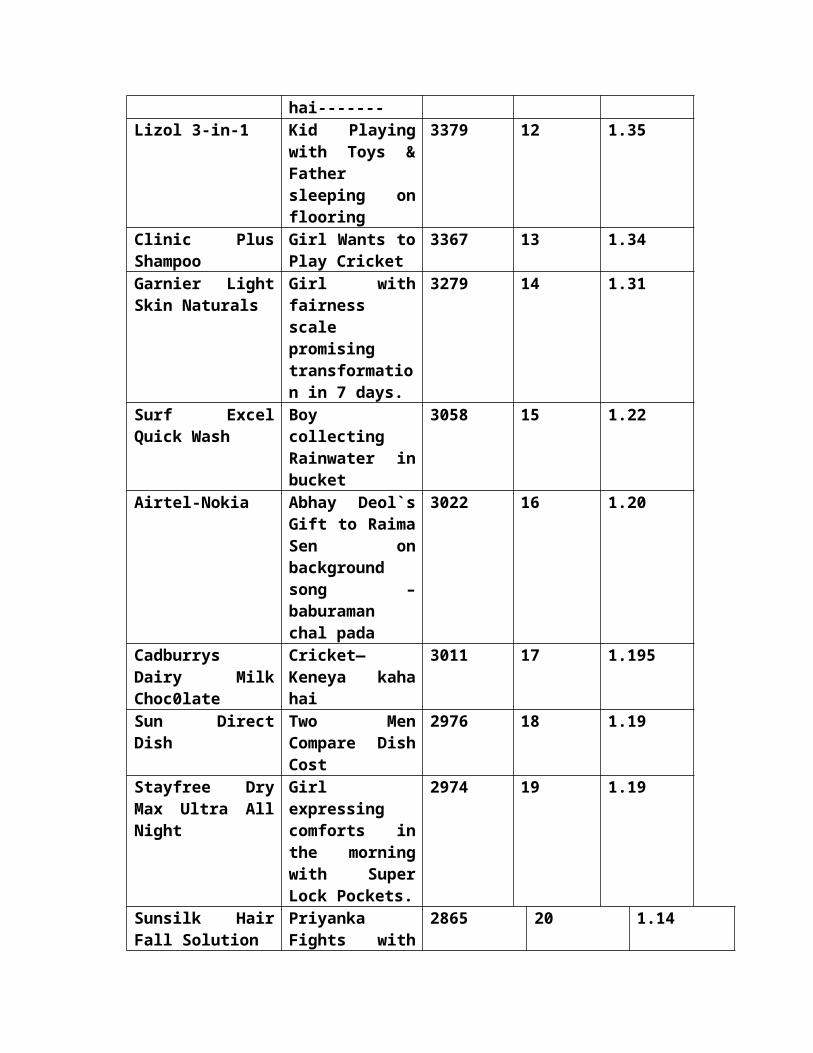
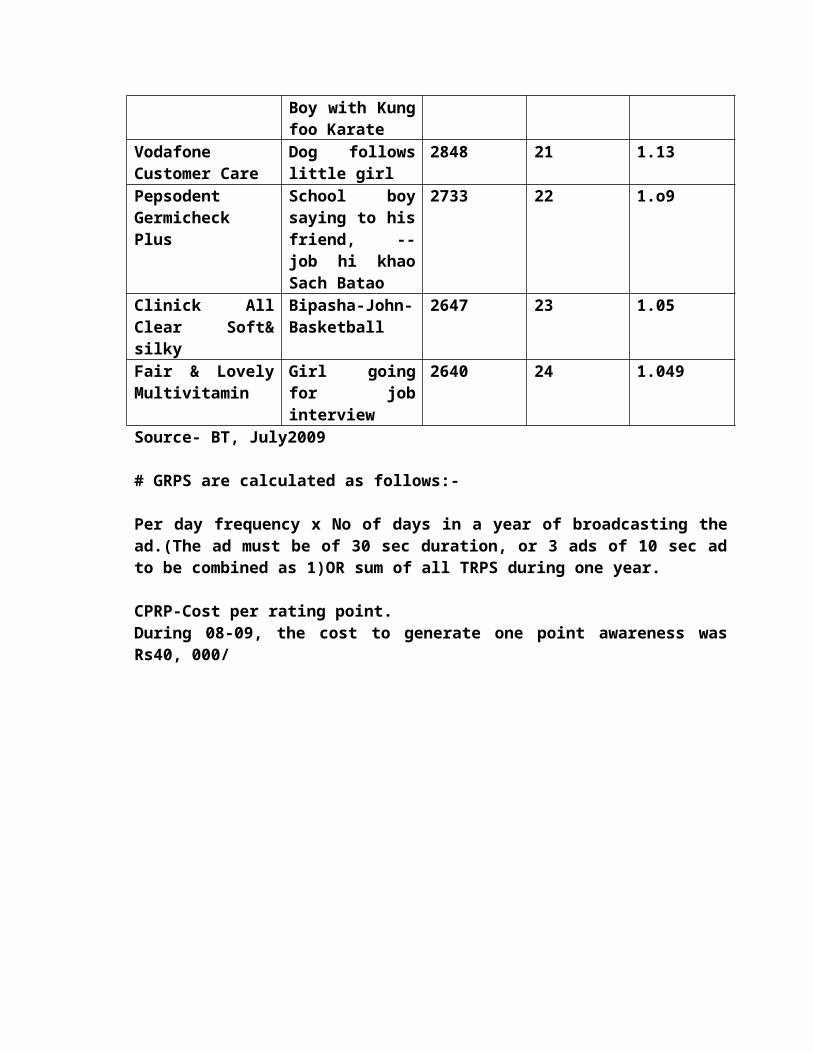
Most Watched Ads based on the GRPs(April 2008-May2009) Or Maximum Eyeballs
Brand Description GRPS Rank Money spentRs crore
Lux strawberry&cream
Priyanka Attracts People
6412 1 2.56
Close Up All New Toothpaste
Faceless girl blowing bubles,sending to her fiancée,with
6050 2 2.42
background song pass aao
Complan Grow two times faster
4149 3 1.66
Lifebuoy Total Son Takes puppy
4080 4 1.63
Fair&Lovely Multivitamin
Fairness Meter 4074 5 1.62
Colgate Dental Cream
Sister as Dentist searching sadan in brother`s teeth
4068 6 1.61
Airtel Cellular Phone Service
Shreyas Talapade`s childhood, with punch—baba ,mai dunia ki bheed me khounga nahi.
3789 7 1.51
Colgate Max Fresh Gel
Lady Police&boy in a car
3780 8 1.50
Hero Honda Motorcycles
Hrithik/Priyanka-Dhak Dhak Go
3692 9 1.47
BSNL Corporate Deepika- Hindusthan Bol Raha Hai
3653 10 1,46
Colgate Active Salt
Lady Reporter in Train asking Kya Aapke toothpaste me namak hai-------
3580 11 1.43
Lizol 3-in-1 Kid Playing with Toys & Father sleeping on flooring
3379 12 1.35
Clinic Plus Shampoo
Girl Wants to Play Cricket
3367 13 1.34
Garnier Light Skin Naturals
Girl with fairness scale promising transformation in 7 days.
3279 14 1.31
Surf Excel Quick Wash
Boy collecting Rainwater in bucket
3058 15 1.22
Airtel-Nokia Abhay Deol`s Gift to Raima Sen on background song – baburaman chal pada
3022 16 1.20
Cadburrys Dairy Milk Choc0late
Cricket—Keneya kaha hai
3011 17 1.195
Sun Direct Dish Two Men Compare Dish Cost
2976 18 1.19
Stayfree Dry Max Ultra All Night
Girl expressing comforts in the morning with Super Lock Pockets.
2974 19 1.19
Sunsilk Hair Fall Solution
Priyanka Fights with Boy with Kung foo Karate
2865 20 1.14
Vodafone Customer Care
Dog follows little girl
2848 21 1.13
Pepsodent Germicheck Plus
School boy saying to his friend, -- job hi khao Sach Batao
2733 22 1.o9
Clinick All Clear Soft& silky
Bipasha-John-Basketball
2647 23 1.05
Fair & Lovely Multivitamin
Girl going for job interview
2640 24 1.049
Source- BT, July2009
# GRPS are calculated as follows:-
Per day frequency x No of days in a year of broadcasting the ad.(The ad must be of 30 sec duration, or 3 ads of 10 sec ad to be combined as 1)OR sum of all TRPS during one year.
CPRP-Cost per rating point.During 08-09, the cost to generate one point awareness was Rs40, 000/
(d) To study image of company as well of the product
(e) To study effectiveness of ad agency
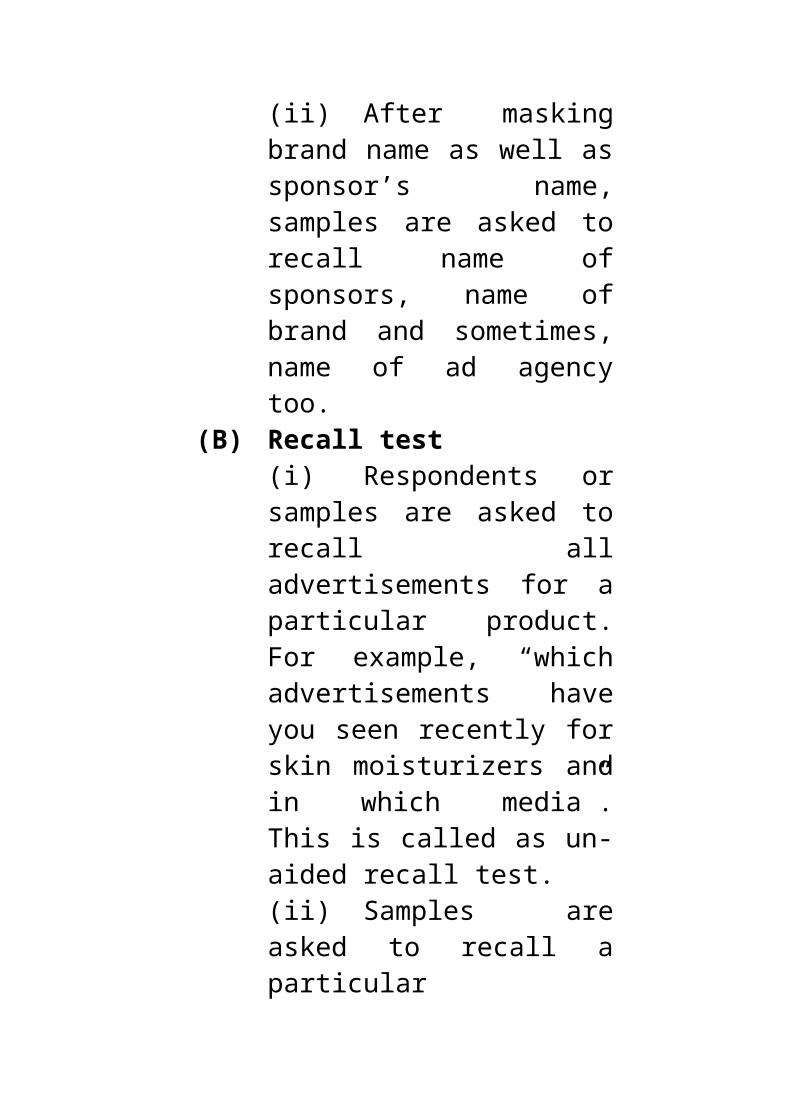
The procedure adopted is as follows:(A) Recognition test
(i) The respondents or samples are shown different advertisements of same product which appear in print or audio visual media and they are asked to recognize which one they have seen earlier, in which media, did they like it, if any. (ii) After masking brand name as well as sponsor’s name, samples are asked to recall name of sponsors, name of brand and sometimes, name of ad agency too.
(B) Recall test(i) Respondents or samples are asked to recall all advertisements for a particular product. For
example, “which advertisements have you seen recently for skin moisturizers and in which media”. This is called as un-aided recall test. (ii) Samples are asked to recall a particular advertisement for a specific brand. For example “Do you remember having seen Shahrukhan with Lux soap, if yes, in which media”. This is called as aided recall test.
(VI) MARKETING AUDIT
Definition: A systematic, comprehensive, independent and periodic examination of companies business unit’s marketing problem areas and opportunities and to recommend an action plan to improve marketing effectiveness.
Marketing Audit(1) Marketing Environment Audit (2) Marketing Strategy Audit(3) Marketing Organization Audit (4) Marketing System Audit
The frequency of conducting the exercise of marketing audit depends on type of products. For example, in case of consumer non durables the exercise might have to be done twice in a year
whereas for home appliances once in a year could be OK.
(VII) DATABSE MARKETING Definition: Marketing Database system is an organize collection of comprehensive data about individual customers, prospects or even suspects (suspects can be converted into customers), i.e. current, accessible and actionable for marketing purpose such as lead generation and sales of a product or service or maintenance of customer relationships.
Effective database marketing might start with employees itself (case study of Alpha Laval and Mrs. Poonawala to be discussed).
For consumer durables, database marketing could be done as follows:
All the dealers could be enlightened to ensure that the customers who walk in the shops to be converted into buyers. For this purpose, whosoever just enquires his name, address, contact nos. to be taken down and to be
followed at regular interval till he is converted as buyer?
(VIII) FOCUS GROUP INTERVIEW TECHNIQUE
This is also known as indirect interviews. A group of eight to ten samples jointly participate in an unstructured interview conducted by a moderator. The samples selected have similar background or use experience related to the problem being research. The moderator in informal way goes on asking unstructured questionnaire and recording the data in two-in-one tape recorder. This information later on analyzed for decision making.
Advantage: The data can be collected in shortest possible time, say, a day or two. Disadvantage: Since sample size is very small, accuracy could be doubtful. Moreover, in one focus group if a dominant personality is one of the sample then other samples gets carried away with his views even though they want to say something different.
Case study of German car maker( Volks wagon) to be discussed.
Illustration- Focus Group Interviews During March 2009, Economic Times conducted Focus Group Interviews. It called top 100 CEOs from leading industries& asked their action plan for Facing global recession.
Q1. How do you view the prospects for your business in the global marketplace?Over the next three years?
(i) Very good --------- 27%(ii) Good ----------------57%(iii) Indifferent ----------12%(iv) Poor -------------------4%

Q2. What are the top three revenue growth strategies your company is evaluating for delivering growth over the next three years?
Acquiring new customers ----------------------------------------- 53% Developing new products and services---------------------------------- 53% Closer customer relationships To enhance wallet share --------------------------------47% Entering new alliance relationships -------------------------31% Pursuing inorganic growth through Mergers and acquisition ------------------------31%Performance improvement initiatives ----------------25%
Q3. Select the top five forces that will have the greatest impact on your business over the next three years?
Indian Macroeconomic Scenario--------------------------------------- 59% Global Macroeconomic Scenario -------------------------------------- 59% Availability of Right skilled Talent --------------------------- 57%
Increased Competition ----------------------49 % Changing Regulatory Environment ------------- 41% Rising Raw Material Costs ---------------- 37% Rapid Growth in Emerging Markets ------------- 35%
Increasing Customer Pressure -------------35% For Better Products and Service
Q4. What are the top three strategic priorities in your agenda for the next three years?
Increasing Over Revenue --------------------------------------------- 67% Enhance our Talent/skills Base -----------------------------------------61% Increasing Our Market Share --------------------------------- 49% Lowering Our Market Share ---------------------------- 47% Changing Our Corporate Organization And culture ------------------- 24% Changing Our Business Model ------------------- 24% Changing Our Market Positioning And/or Customer Base ---------22%

Q5. What are the top three measures that your organization would adopt to manage the current uncertain global business scenario?
Neutralizing business risks by expanding Into new markets ------------------------------------- 52% Driving down supplier costs ------------------------------------ 52% Integrating overlapping systems/functions ------------------------------------ 52% Divesting underperforming business Products and services ----------------- 38% Diversifying into new business domains ---------- 36%
Q6. What are the three greatest risks facing your organizations over the next three years?
Inability to attract and retain talent ----------------------------------- 49% Inability to respond to Dynamic market conditions ------------------------------47% Increased competitive pressure --------------------45%

Macroeconomic and financial risk --------------- 41% Inflation and rising input costs -------------33% Failure to innovate --------31%
---------------------------------------------------------------------------------------------------------------------
Assignment for students:CONSTRUCT A FOCUS GROUP STUDY TO ANALYSE THE ISSUE “DO WE REALLY NEED INTERNET?”

CHAPTER 4SAMPLING QUESTIONNAIRE AND
SCALING TECHNIQUESBasic Terms in Sampling
i. Sample Population: It is pre-defined set of potential respondents (elements) in a specific geographic area where research is intended.For example: All mothers in Pune city who buy branded baby products.All teenagers in Mumbai who love watching MTV
ii. Sample Frame: It is a sub-set of the defined target population, from which researcher can select a sample for collection of data. Sample frame is usually a partial list of population. For Example: Telephone directory of Pune List of income tax payers in Pune
iii. Sample: It is the test unit, which provide information or data to the researcher. Alternatively, samples are the respondents who represent the characteristics of the target population and drawn from sample frame. Sample Size Calculation
ZS 2
n = -------

ewhere n = sample size, Z = standard normal distribution for certain confidence level, e.g. Z95% = 1.96 & Z90% = 1.645, Z99 = 2.58S = Population Standard Deviation
Maximum value – minimum value
= --------------------------------------------6
e = Tolerable error in estimating the variable
Illustration:
Whirlpool intends to research customer satisfaction level for washing machine. Customer satisfaction level is to be measured on a scale 1 to 10 where 1 means not at all satisfactory and 10 means full satisfaction. Value of Z is 1.96. What should be sample size if tolerable error is 0.5?
Solution: First compute S i.e. Population standard deviation
maximum value – minimum value
S = --------------------------------------------6
10 – 1 9 = -------- = --- = 1.5
6 6
Substituting value in the formula
1.96 x 1.5 2
n = ------------- = 35 0.5
Whirlpool should interview 35 samples for the intended research.
--------------------------------------------------
Sample Unit – a) Household – you & me i.e. end users (b) Industrial – manufacturers, wholesalers, retailers, etc.
Consideration Design TypeProbability Non-
ProbabilityCost More Costly Less Costly

Accuracy More Accurate
Less Accurate
Time More Time Less TimeAcceptance of results
Universal acceptance
Reasonable acceptance
Generalisability of results
Good Poor
5.8 SAMPLING TECHNIQUES
Probability Sampling Non-probability Sampling1) Each sample unit in sample frame has equal or known chance of being included as sample
1) The chance of each sample unit from sample frame being included as sample cannot be estimated.
2) Samples are selected at random from sample frame.
2) Samples are selected w.r.t. prior Experience or judgment of the researcher
3) Whenever large sample size is involved, this method is used.
3) For accessing small sample size this method is used.
4) When highly accurate decisions of known errors are intended regardless of cost, this method is useful.
4) Whenever time and cost constraints are inevitable (like exploratory Research), this method is used.
5) Normally used for consumer goods survey.
5) Normally used for industrial goods survey.
5.9 ILLUSTRATION
Emami wants to launch ‘Madhuri’ and ‘Ishwarya’ range beauty ayurvedic creams, say in Pune. How should it do sample design.
Solution:
Sample Population: All women in Pune using Skin creams as beauty-aid.Sample Frame: All women of PUNE usingBeauty ayurvedic creams between age group 10-50Sampling Method: Stratified.Sampling Plan “Sample frame is divided into 4 groups as follows:
Group 1 – School-going girls between 10-16
Group 2 – College –going girls between 17-23
Group 3 – Working ladies between 24 – 35
Group 4 – Housewives and working ladies between 36-50.
Samples can be drawn from schools, colleges, offices, societies, etc.
Justification : Beauty ayurvedic creams are costly and hence stratified sampling will ensure the income i.e. affordability. It is seen that at higher secondary school level, the girls are more cautious about looks. Hence, the age limit begins with 10. At the age 50, the ladies might value
natural beauty. Four groups are formed to understand in depth the consumer profile and its preferences.
Sample size: 1%of frame&equally distributed over each group. (Sample frame for Pune contains 8 lacs ladies)
Sampling MethodsFor probability sampling technique
(i) Random Sampling(ii) Systematic Sampling(iii) Stratified Sampling(iv) Multistage Sampling(v) Area Sampling
For non-probability technique
(i) Purposive Sampling (ii) Quota Sampling
QuestionnaireThe Functions of a Questionnaire
• Translates the research objectives into specific questions
• Standardizes those questions and the response categories

• Fosters cooperation and motivation
• Serves as permanent records of the research
• Can speed up the process of data analysis
• Can serve as the basis for reliability and validity measures
Questionnaire Design and Drafting
Following elements in balanced manner make good questionnaire
(i) The questions must be relevant to subject matter and a set of questions must be able to cover the entire topic of the research (illustration of Chaitanya Health Clubs questionnaire)
(ii) The question should not indicate specific answers. (example of Amul’s Masti curd and HLL’s study on Surf Wash Boosters)
(iii) Lengthy and difficult questions would lose customer attention and hence short and easy questions to be posed.
(iv) Each and every question should create interest in the minds of samples so that samples also feel importance of question being asked and hence likely to give accurate answers seriously.
(v) Double-baralled Questions to be avoided. Inexperienced questionnaire designers have a tendency to combine two questions into a single question, such as:Are you happy with the price and quality of brand Y?Yes No This is not a good question to ask,
because the answer will be ambiguous, whether it is yes or no. It would not be clear whether the respondent has said yes for price alone, quality alone, or for both. The same problem exists for a ‘no’ answer.
It is better to rephrase the question and provide for different answer categories for each attribute or ask two separate questions, one for price and one about quality. Then the interpretation of answer becomes far easier.
• Questionnaire design is a systematic process in which the researcher contemplates various question formats, considers a number of factors characterizing the survey at hand, ultimately words the various questions very carefully, and organizes the questionnaire’s layout.
Appropriate Layout
How wording affects answersDid you see…A broken headlight?The broken headlight?
Information Needed (Secondary or Primary data)
Method of data collection, PI, TI or Observation
Sampling technique and
methods
Questionnaire Layout Design
Decide on content of each questionDecide on type of questions
Decide on wording or questionsDecide sequence of questions
Decide pre-testing of questionnaire
Final revised questionnaire
Words to Avoid in Questionnaire Development
• All• Always• Any• Anybody• Ever• Every• Never
Why Avoid These Words?• These words: all, any, anybody,
best, ever, every, never, etc. are all EXTREME ABSOLUTES…
• They place respondents in a situation where they must either fully agree or they must completely disagree with the extreme position in the question.
– Do you always observe traffic signs?
– Would you say all cats have four legs?
Questionnaire Do’s and Don’tsEnsure questions are free of bias
Make questions simpleMake questions specific
Avoid sophisticated wordsAvoid ambiguous words
Avoid negatives
Avoid hypotheticalsAvoid words that could be misheardUse mutually exclusive categoriesAllow for “other” in fixed response
questions
Types of Questions
(1) Open-ended question What do you think of the taste of
brand X cola?OR what is your opinion on ------- ?(2) Dichotomous questions
(a) Are you user of X toilet soap? Yes / No. OR Do u have mobile phone ? Y /N
(3) Multiple Choice questionsMultiple responses has more than two options for the response
Advantages:

i. Allows for broad range of possible responses
ii. Simple to administer and codeDisadvantages:
iii. Must distinguish “pick one” from “pick all that apply”
iv. May alert respondents to response options of which they were unaware
Which of the following factors made you buy this brand of car:(a) Reasonable price(b) Great looks (appearance)(c) Fuel economy(d) Easy availability of service(e) Any other, please specify.
(4) Ratings or RankingsRating questions(a) Please rate the following detergent on
A scale of 1- 7 in their ability to clean clothes
Brand A 1 2 3 4 56 7Brand B 1 2 3 4 56 7
Brand X 1 2 3 4 56 7ORIndian Airlines’ food service is
_____. £ Excellent
£ Very good£ Good£ Fair£ Poor
(b) Please rank for following detergents on their ability to clean the clothesBrand A 1 2 3 4 56 7Brand B 1 2 3 4 56 7Brand X 1 2 3 4 5
6 7(1 means best, 2 means better, 3
Means good, -------, 7 means worse)
(5) Indirect questions(a) Most of the people in India
smoke Non-Filter Cigarettes because ----------------
(b) Jo Bibi Se kare pyar wo -------- se kaise kare inkar?

(6)Likert scaleDo u agree that we offer the best services?a) Strongly agree b) agree c) neither agree nor dis agree d) dis agree e) strongly dis agree ORIndicate your level of agreement with the following statement: Small airlines generally give better service than large ones. £ Strongly disagree
£ Disagree£ Neither agree nor disagree£ Agree£ Strongly agree
(7) Semantic scaleHow do u think our service is?
a) excellent ------ worstb) better ----- very poorc) good ----- poord) averageORIndian Airlines isLarge ………………………………...…………….SmallExperienced………………….
………….InexperiencedModern………………………..………….Old-fashioned
(8)Importance scale In flight, food service is _____ to me. £ Extremely important
£ Very important£ Somewhat important£ Not very important£ Not at all important (9)Intention to Buy ScaleHow likely are you to purchase tickets on Go-Airlines if in-flight Internet access were available?£ Definitely buy£ Probably buy£ Not sure£ Probably not buy££ Definitely not buy
11) Probability ScaleDo you intend to buy an automobile (say, car) within the next 6 months?0.00 No

0.20 Slight possibilities0.40 Fair possibilities0.60 Good possibilities0.80 High possibilities1.00 Certain
Illustration: Construct a questionnaire for understanding buyer behavior in Selection of television set for household segment
Objectives:(i) What features buyers are looking for in a TV set (ii) How important the price to the buyer(iii) What are the methods of payment? (iv) The selection process of the buyer
Questionnaire:(1) a. Do you own a television?
Yes / Nob. If yes, which brand / company
name
c. If no, go to question 7. (2) While buying a TV what are the
features you look for? (3) Given below some of the features of the TV. How important is each
one to you, please tick mark. Features Extremely
importantImportant Some
what important
Not very important
Not important at all
(i) Looks(ii) Portability(iii) Cabinet - Moulded - Wooden(iv) Size of the screen(v) No. of channels(vi) No. of speakers(vii) Auto control monitor(viii) Manufactures reputation(ix) Video adaptability(x) Integral DVD(xi) Foreign collaboration(xii) Guarantee offered(xiii) Servicing arrangement(xiv) Price(xv) Child lock(xvi) Games
(4) a. If a price of TV is classified as high, medium
And low then where your TV model belongs to?
c. How do you judge price of a TV with respect to the features of a TV?
d. Which payment option do you prefer? Cash / Installment
(5) At the time making brand choice decision, from whom among other following sources did you take the advice?Family membersFriends / neighborsDealersAdvertisementAny other source, please specify
(6) A set of statements are given below. Please indicate your opinion, to be recorded a scale ranging from strongly agree to strongly disagree
Statements Strongly Agree
Agree Can’t say Dis-agree Strongly disagree
(i) Possessing TV set is a status symbol (ii) Observing TV is passing time(iii) DDs TV programmes are dull whereas C & S’s
programmes are attractive(iv) TV affects children education (v) Indian TV programmes are educative (vi) TV is best source of entertainment (vii) TV is low cost entertainment (viii) Government’s decision on expanding TV network through DTH and dish TV is appreciable (ix) TV is best gift item (x) people are confined to homes due to TV viewing
(7) Classified data (a) Age (b) Education (c)Occupation(d) Annual income of the family
Ideal Questionnaire
Research Problem :
To identify or study market penetration of fair and lovely.
Research Objective :
w Which is the most commonly used fairness cream in Market?
w What influences people to buy particular brand?
w What is the penetration level of fair and lovely in market?
w To identify customer needs?
Questionnaire :
1. Do you use any fairness cream?
o Yes o No
2. Which fairness cream does you most frequently use?
o Boro plus
o Garnier
o Fairever
o Vicco turmeric
o Fair and lovely
o Any other (specify)
3. Do you use fair and lovely?
o Yes o No
4. You do not use fair and lovely because of
o Price
o Quality
o Packaging
o Few schemes and offers
o Any other (specify)
5. What influences to buy your preferred brands?
o Friends
o Neighbors
oAdvertisements
oSelf experience
oAny other (specify)
6. If fair and lovely which sub brand do you use?
o Multivitamin
o Ayurvedic
o Skin clarity
o Active sun block
7. What influences your decision while buying fair and lovely?
o Skin protection
o Fairness
o Nourishment
o Price
o Any other (specify)
8. Have you seen any promotional campaign of fair and lovely?
o Yes o No
If yes Which one provoked you to buy the product?
o Ad of Air hostess
o Ad of father and daughter for job
o Ad of mother and daughter (commentary)
o Ad of stage (drama) actress
o Ad of chance in a movie
o Any other (specify) .........
10. Do the various schemes associate with fair and lovely affect your purchase?
o Yes o No
10. Would you suggest any changes for fair and lovely in following field?
o Packaging sizes
o Style of packing
o Pricing
oAvailability
oMore schemes or offers
oAny other (specify)..........
11. How frequently do you purchase fairness cream?
o Once a month
o Twice a month
o Once in 2 months
o Other (specify) ..........
12. If your preferred fairness cream is unavailable you go for 1st
choice...........
2nd choice..........
13. Most preferred fairness cream among people you know
o Fair and lovely
o Fair ever
o Garnier
o Boroplus
o Any other (specify)..........
o o o
Some key research areas & Questionnaire.1) Customer Satisfaction:-
# I am extremely satisfied with the service I receive from BOB.Strongly Agree Neither Disagree StronglyAgree Agree Disagree Nor Disagree

# How would u rate the services you receive from BOB?Excellent Very good Good Fair Poor# Are u ------- with food quality of MCdonalds?Very Somewhat Neither Somewhat Very Satisfied Sat Sat Dis-sat dis Nor Sat Dis-Sat # How satisfied are u with CCD overall? Rate on a 5 point scale, where 1 means not atall satisfied & 5 means extremely satisfied.(2) Brand-TrustSuppose the study is being made about most trusted mobile handset brands.Tick mark from (a) strongly agree (b)Agree© Neither agree nor dis agree (d) Dis agree(e)Strongly dis agreeFollowing attributes for your hand set.1)Always maintains a high level of quality.2)Is worth the price it commends.3)Is one brand that I would definitely consider if I have to buy that product.4)Is going to be a popular brand for many years.5)Has something that no other brand has.6)Evokes a feeling of confidence & pride among its users.
7)It is a very special brand & has some Unique feelings associated with it.Samples could be from SEC A, B & C.
SCALING TECHNIQUES
7.7 ILLUSTRATIONS
(1) Construct following scales of attitude measurement (i) Nominal (ii) Ordinal (iii) Interval (iv) Ratio (v) Thurston
(i) Nominal Scale: Symbols or numbers are assigned to brand names, geographic territory, sex, user status, etc.
Illustration: (a) Nominal scale to identify potential of cellular phone (WLL) w.r.t. territory
Following data is provided on WLL Mobile Telephone Users – city wise
City Mobile Telephone
Users
Symbol City Mobile Users
Symbol
1. Pune 80000 W 7. Puri 50000 E2. Mumbai
300000 W 8. Hyderabad
180000 S
3. Nasik 50000 W 9. Bangalore
270000 S
4. Delhi 250000 N 10. Chennai
275000 S
5. Lucknow
60000 N 11. Cochin 40000 S
6. Calcutta
200000 E 12. Punjim 50000 W
We can put the respective city in respective region like west, east, south and north and put the first word of region against each city name. We now add potential users under W,E,S & N and represent as follows:
North Territory
West Territory
South Territory
East Territory
310000 480000 725000 250000
Conclusion: - Attitude formed is, south territory has highest potential.
Illustration (b) Godrej Agrovet have provided following data for it’s ‘cattle feed’ product Brand ‘Milk More’. Construct Nominal scale.
District Region Sales per day in
Qtl.
District Region Sales per day in
Qtl.1. Nagpur Vidharbha 300 7.
SolapurSouth Maharashtra
260
2. Akola Do 200 8. Baramati
Do 340
3. Wardha Do 400 9. Sangli Do 2804. Aurangabad
Marathwada 150 10. Pune
Wet Maharashtra
500
5. Jalna Do 105 11. Nasik
Do 380
6. Parbhani Do 125 12. Satara
Do 400
Let us regroup region wise sales and rank them
Sr. No.
Regiona Total sale in Qtls. Per
day
Rank
1 Vidharbha 950 II2 Marathwada 380 IV3 South
Maharashtra880 III
4 West Maharashtra
1330 I
Conclusion: Attitude formed is Western Maharashtra Region is having highest sales potential.
(ii) Ordinal Scale: In marketing research, ordinal scales are used to ascertain consumer’s perception on a brand, service, etc. Illustration a) Mobile user’s brand preference for handset manufacturers
Attributes
Light
weight
Price
Design / style
High technology
Battery life
Durability
Reliability
Voice
quality
Caring
company
Total
score in %
Nokia 99%
Sony Ericson
99%
Motorola
97%
LG 93%
Samsung
82%
Panasonic
80%
Philips 68%
Sieme 66

ns %Mitsubhishi
30%
Alcatel 13%
TCL 5%
Illustration (b): Microwave ovens manufactures wants to know the brand ranking perceived by customers. Design ordinal scale.
Attributes Price(10) Weight (10)
Antibacterial properties
(10)
Nutritive food (10)
After sales
service (10)
Total service out of
50LG 9 9 10 10 10 48BPL 8 8 8 8 8 40Kenstar 10 10 7 8 10 45Samsung 8 8 10 10 10 46Electrolux 6 9 9 8 6 38Panasonic 6 8 8 8 6 36National 7 7 7 7 7 35Whirlpool 7 7 7 7 7 35Bajaj 8 7 10 10 10 45
(iii) Interval scale: In marketing research, this scale is used to measure intensity by which attitude towards a brand varies on any marketing stimuli.
Illustration: (a) Mobile telephone users may express Nokia brand in follows:Global brand Nokia cellular is liked by me the most, I neither like nor dislike Nokia cellular, I dislike Nokia cellular, I dislike Nokia cellular the most.
Illustration (b) Consumers want to express the tastes (likes / dislikes) of Pizzas and burgers supplied by
Pizza Hut, McDonalds and domino Pizza. Design Interval Scale.
Attributes Like the most
Like Neither like nor Dislike
Dislike Dislike the most
P D M P D M P D M P D M P D MTasteCheese QualityBrisknessThicknessSpice Price
Conclusion: McDonald’s Burgers is liked by most of the consumers. (Amul Pizza is not considered because only in Gujarat, it is served in ready to eat fashion whereas in other part of the country it is served in frozen condition, which requires further processing).
(iv) Ratio scale: This scale is used to measure attitude on quantity sold, number of consumers, profitability, probability of purchase, etc.
Illustration: (a) IT customers handled by the Telecom companies. – Number of IT consumers handled by Tata Indicom is one tenth of that handled by Reliance Infocom.
Illustration (b) A automobile dealer wants to get knowledge on profitability on consumer base of hero Honda and TVS Victor. Design ratio scale:
Vehicle Quantity sold in
one year
Price /each in
Rs.
Total sale Rs.
Commission earned per
vertical
Total profit Rs.
Hero Honda Passion
230 46000 10580000 4000 920000
TVS Victor GL 205 45000 9525000 4500 922500
Conclusions: (1) No. of consumers handled by Hero Honda Dealer are 1.12 times more than TVS victor dealer
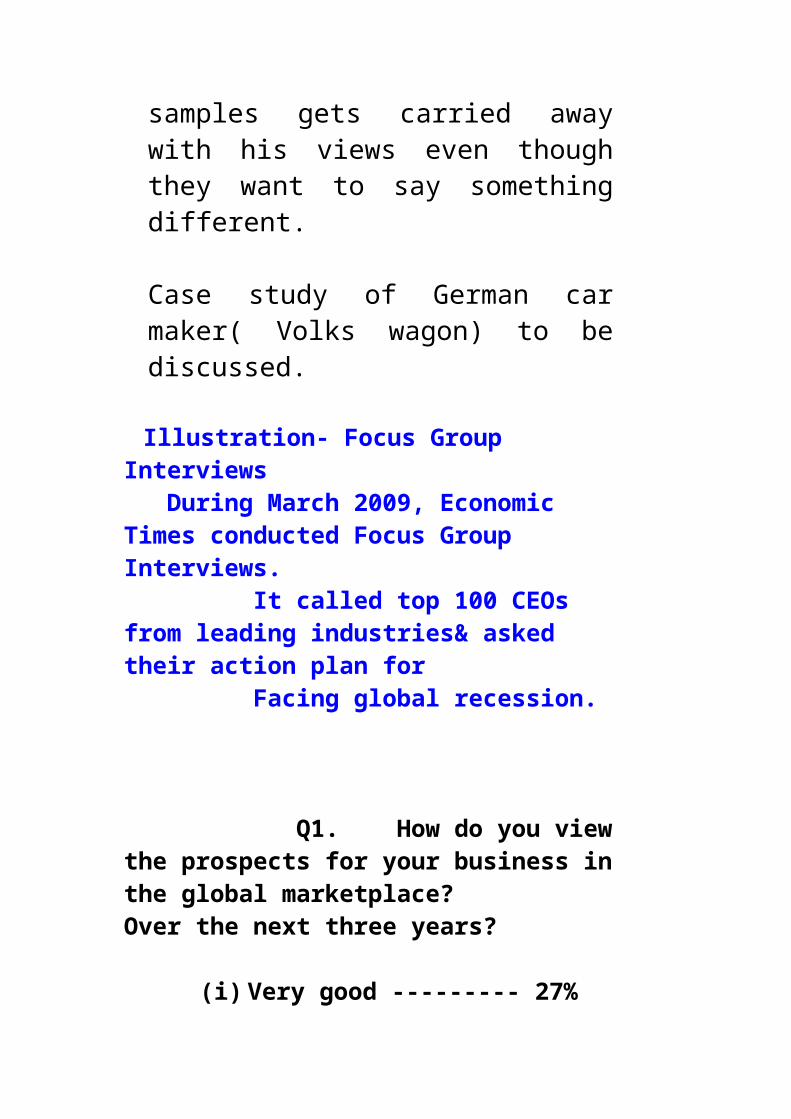
(2) Total profitability of TVS Victor dealer is 1.0027 times more than Hero Honda Dealer.(v) Thurston scale: This is eleven point scale to express varying degree of attitude from unfavorable to favorable.
BA F K
C D E G H I JUnfavorable Neutral Favorable
Illustration (a) supposes a statement is made like, ‘Enron Power Project is beneficial to India’; the response from the consumers, politicians and govt. could vary from 100% unfavorable to 100% favorable.
Illustration (b) Design Thurston scale for ‘Saas-Bahu’ TV serials being run on most of the prime channels (SCMHRD May 2005)
Solution: Following statements (from A to K) could be made.
(a) All these Saas-Bahu serials build up negative value system by depicting disputes in the family.
(b) All Saas-Bahu serials portray an irrational depiction of characters.
(c) Telecast time of Saa-Bahu serials clashes with important programmes like News, etc.
(d) All Saas-Bahu serials are monotonous.(e) Most of the Saas-Bahu serials are complete
waste of time.(f) I have no positive or negative feelings about
Saas-Bahu serials,(g) Saas-Bahu serials provide good entertainment
after a hard days work.
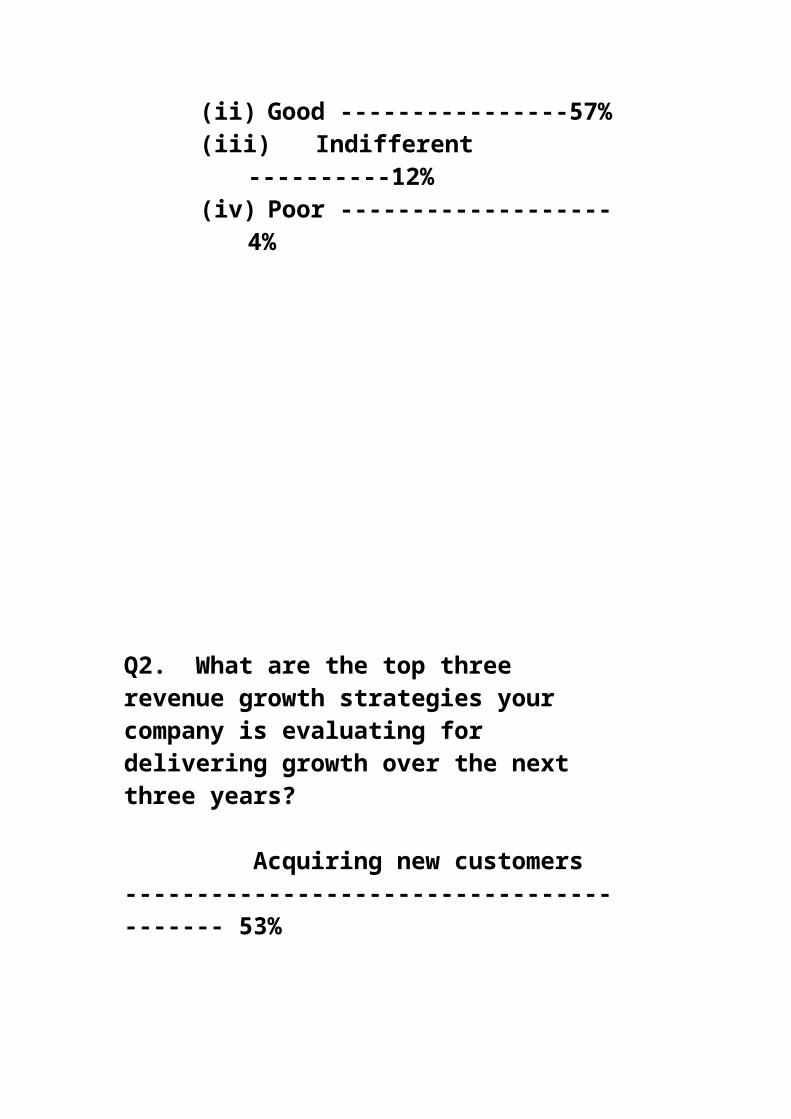
(h) Most of the key characters of Saas Bahu serials become trend setters in respect to clothings, jewelry and other accessories.
(i) Most of the Saas Bahu serials bring the whole family together
(j) Saas-Bahu serials help to understand, analyse and solve the domestic crisis.
(k) The Saas-Bahu serials are a good ways to instill family values in terms of obedience& respect
(2) Compare rating and ranking scales (SCMHRD Dec. 2005)
Solutions:
Rating Scale Ranking Scale1. Attitude is measured from the point of view of intensity of the likes and dislikes
1. Attitude is measured from the point of view of intensity of preferring one product over other.
2. Interval data is needed 2. Ordinal data is needed3. It is absolute 3. It is relative4. Examples – Interval Scale 4. Example – Ordinal scale, Semantic
differential scale
(3) Construct Likert Scale, Perceptual Map and Semantic Differential Scale
(i) Likert Scale to study consumer satisfaction with tyre-brands
Score out of
+2 +1 0 -1 -2
Attributes Strongly Agree
Agree Neither agree nor Disagree
Disagree Strongly disagree
Cost friendlyGrip
Wear & tearRubber – qualitylongevity
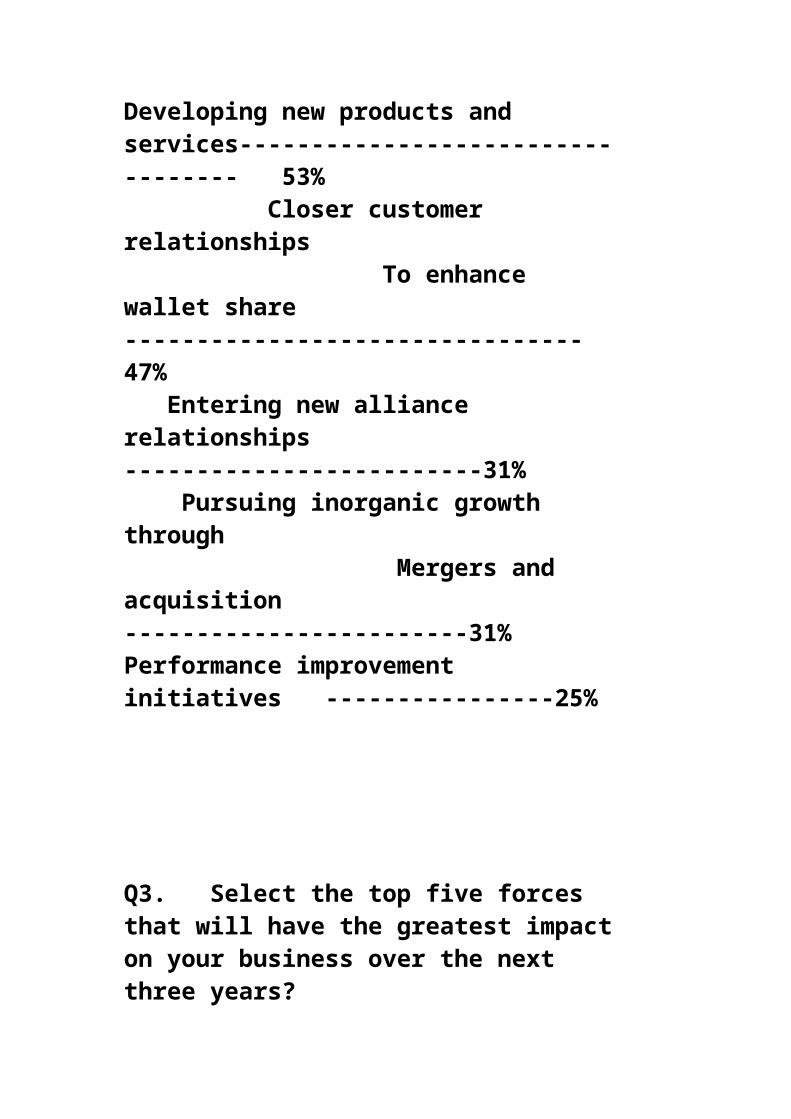
Brand Sign ScoreMRF 2+2+2+2+2 = 10 JK 2+1+2+1+2=8
Apollo 2+1+0+0+0=3
(ii) Semantic differential scale to understand the images in the mind of consumers for washing machine manufacturers
Remark Excellent
Better
Good
Average
Poor
More poor
Worst
Score +3 +2 +1 0 -1Attributes W V LG AttributesProgressive
Traditional
Reliable Unreliable
Strong Weak
Cust-focused
Non cust-focused
Responsive
Non response
Brand Sign ScoreWhirlpool W +3+2+2+3+2 = 12 Videoon V +2+2+3+2+2=11
LG LG +3+2+2+2+2=11(iii) Following data is given for three Telecom companies. Prepare Semantic Differential Scale
Attributes Reliability Tangibility Responsiveness
Assurance Empathy
RIM +3 +2 +1 +1 +1BHARATI +3 +2 +2 +3 +3TATA -2 -3 0 +1 +1
Solution :
+3 +2 +1 0 -1 -2 -3Reliability

Tangibility
ResponsivenessAssuranceEmpathy
Brand Sign Score
RIM BA +3+2+1+1+2 = 9 Bharati BH +3+2+2+3+3=13
Tata TA -2-3+0+1+1=-3
Construct Semantic Differential scale for Management Institutes (Leading) in India
Attributes Excellent
Better
Good
Average
Poor
Very poor
Worst
+3 +2 +1 0 -1 -2 -3ReputationSuccess of placementQuality of PlacementInfrastructureFacultyTeaching MethodologySpecial
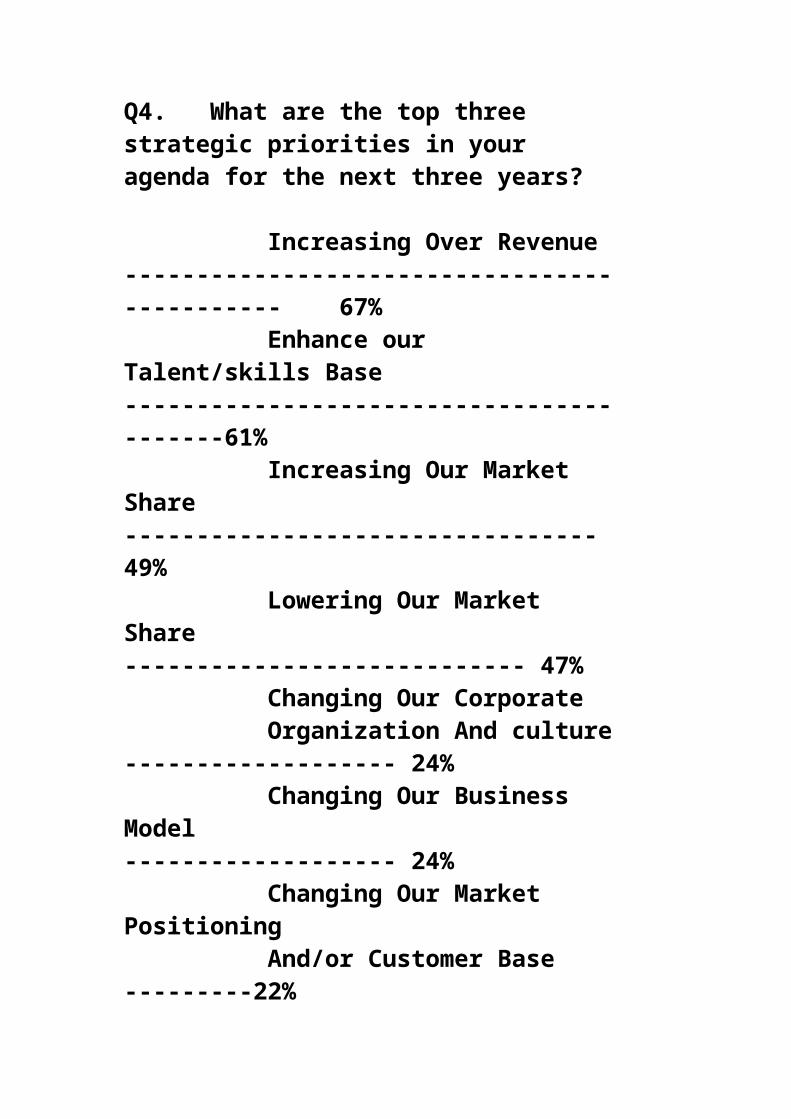
UnitsAdmission eligibility
2) Reputation: High rank, tie up with foreign Universities / Instt., admission tests are toughest, have international recognition, best aluminus
3) Success of placement: 100% placement, multiple placement option
4) Quality of placement: Abroad placement with MNCs, Average salary best among top ‘B’ schools
5) Infrastructure: provides financial aids, convenient location, high standard hostel & mess, high speed internet facility, all class room with LCD, high class book library
6) Faculty: Well trained faculty, research done by faculties, visiting faculties from Industries
7) Teaching Methodology: Good counseling, student faculty ratio 1:1, industry interaction as part of syllabus
8) Special units: Known for marketing programme, known for mass media and finance programme
9) Admission eligibility: Students with work experience, only engineers
Scores for Leading Management Institutions:
IIM = +3+2+2+2+2+2+1+1 = 15ISB = +2+2+3+3+2+2+3 = 17ICFAI = +2+1+2+2+2+1+2+1 = 13SYMBI = 2 X 8 = 16INDIRA = +1+2+1+2+2+2+1+0 = 11
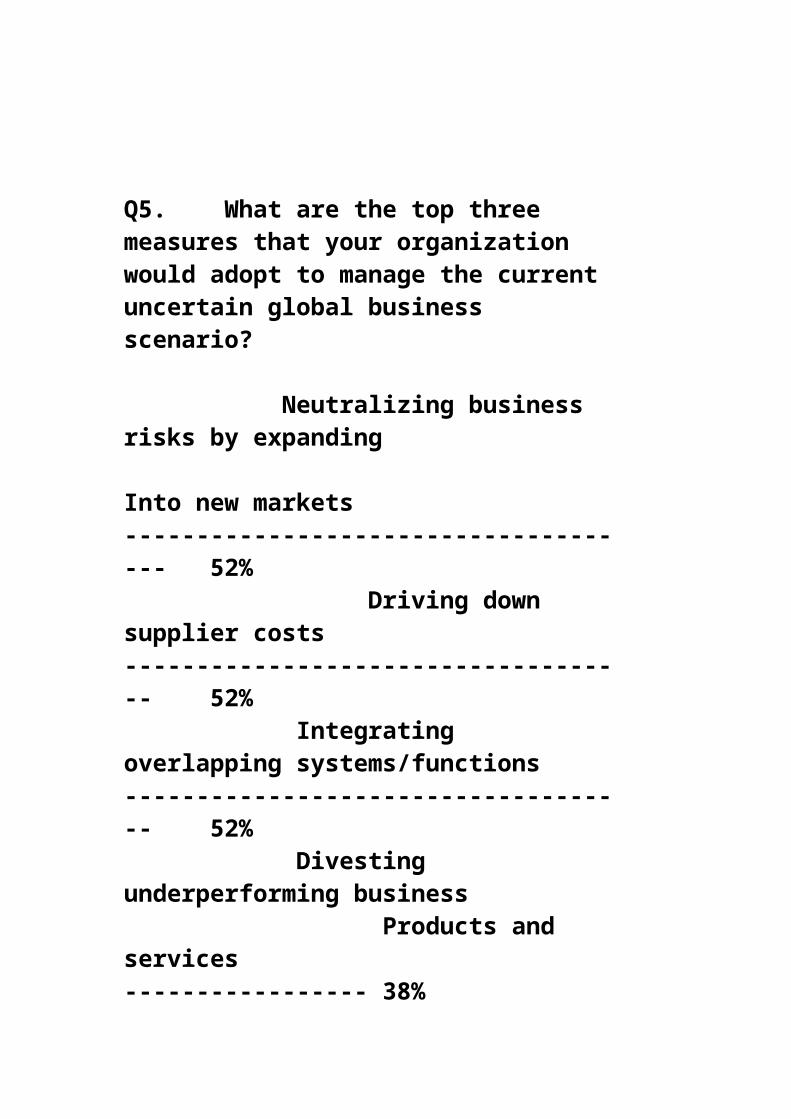
(iv) Perceptional Map
Following data is given on Indian Refrigerator Industry (Size 165 lit. to 180 lit.)
Brand Technology Price :Rs.BPL Direct cool 9290Godrej Do 8000Kelvinator Do 9990Samsung Do 8490Whirlpool Do 9100LG Do 9000Electrolux Frost free 11000Videocon Direct cool 8890Allwyn Do 8290Voltas Do 8110Daewoo Frost free 10500
Prepare Perceptual map.
Solution: Construction of Perceptual Map
LAST CHAPTER – APPLICATIONS OF MARKETING RESEARCH
Kelvinator
High price (Rs.)
Frost freeDirect cool
Low Price
8000
8500
9000
9500
10500 #
11000 $
11500
12000
LG
BPL
Voltas
Samsung
Alwyn
Whirlpool
Gordrej
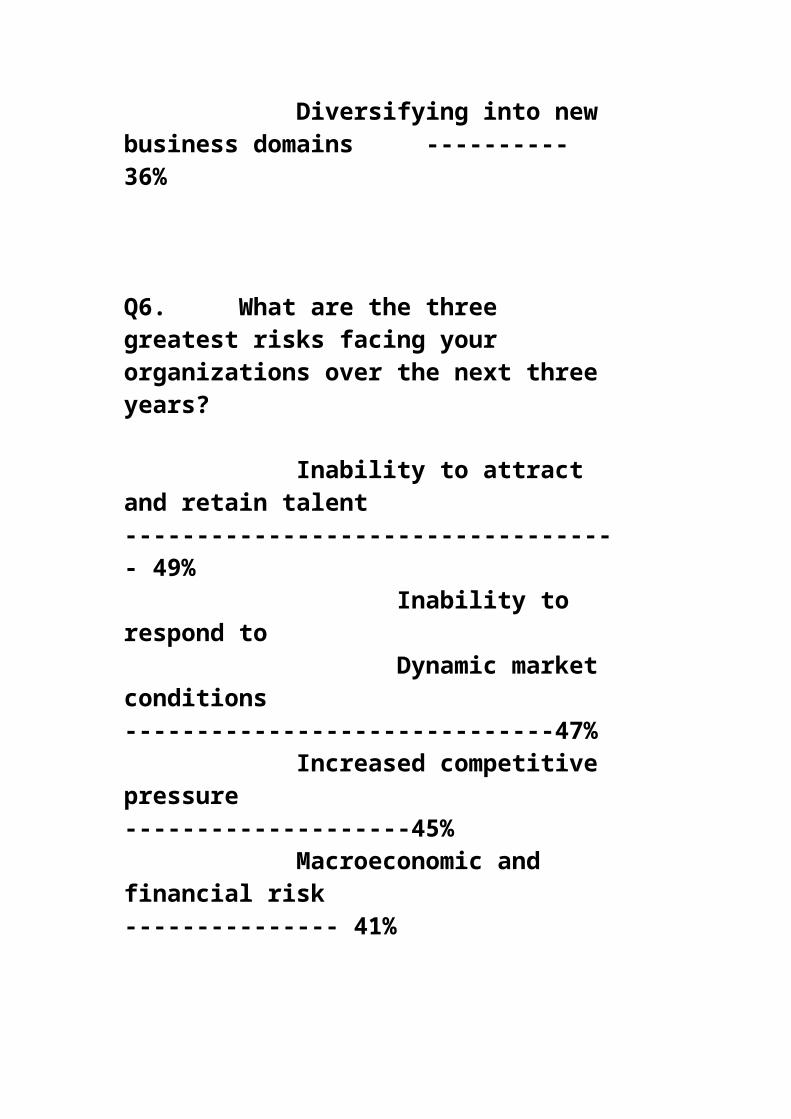
I. PRODUCT RESEARCH
Product research areas
Marketing research techniques
(1) Formulating new product
Regression Technique, Benefit Analysis
(2) Product Line Extension / Brand Extension
Perceptual Map
(3) Test Marketing of new product
Experimental research design
(4) Re-launching of declining product
Qualitative Research or Perceptual mapping
New Product Research
New products development is critical to the life of most organizations as they adapt to their changing environment. Since, by definition, new products contain unfamiliar aspects for the organization, there will be uncertainty associated with them. Thus, it is not surprising that a large proportion of marketing research is for the purpose of reducing the uncertainty associated with new products.
New-product research can be divided into four stages, as shown in Figure 1. The first stage is generating new-product concepts; the second is evaluating and developing those concepts; the third is evaluating and developing the actual products; finally, the product is tested in a marketing program.
Concept Generation
There are two types of concept generation research. The first might be termed need identification research. The emphasis in need research is on identifying unfilled needs in the market. The second is termed concept identification. Here, an effort is made to determine concepts that might fill an

identified need.
Need Identification. Marketing research can identify needs in various ways. Some are qualitative and others, such as segmentation studies, can be quantitative. Following are some examples:
Perceptual maps, in which products are positioned along the dimensions by which users perceive and evaluate, can suggest gaps into which new products might fit. Multidimensional scaling typically is used to generate these perceptual maps.
Social and environmental trends can be analyzed. For instance, a trend away from low-calorie foods was the reason that Pizza Hut introduced the Big Foot Pizza and McDonald's reintroduced the Quarter pounder.
An approach termed benefit structure analysis has product users identify the benefits desired and the extent to which the product delivers those benefits, for specific applications. The result is an identification of benefits sought that current products do not deliver.
Product users might be asked to keep a diary of a relevant portion of their activities. Analyzing such diaries can provide an understanding of unsolved problems associated with a particular task.
In focus-group interviews, product users might discuss problems associated with product-use situations. Thus, office managers might, for example, discuss problems they have experienced with shipping services.
Lead user analysis is another approach that many companies now use more often. In this approach, instead of just asking users what they have done, their solutions are collected more formally. First, lead users are identified. Lead users are those who face needs early that later will be general in a marketplace; they are positioned to benefit significantly by solving problems associated with these needs. Once a lead user is identified, the concepts that company or person generates are tested.
The advertising agency JWT, which relies heavily on "problem detection" to generate new-product concepts and ideas for advertising campaigns, has developed a procedure for rating problems? The agency asks each respondent who is a potential prospect to rank each problem as to whether it
Is important. Occurs frequently. Has a solution.
A "problem score" is obtained by combining these ratings, and the score is used to screen ideas. Using this technique, 8800 found that buyers of a dog food felt that it
Smelled bad. Cost too much.
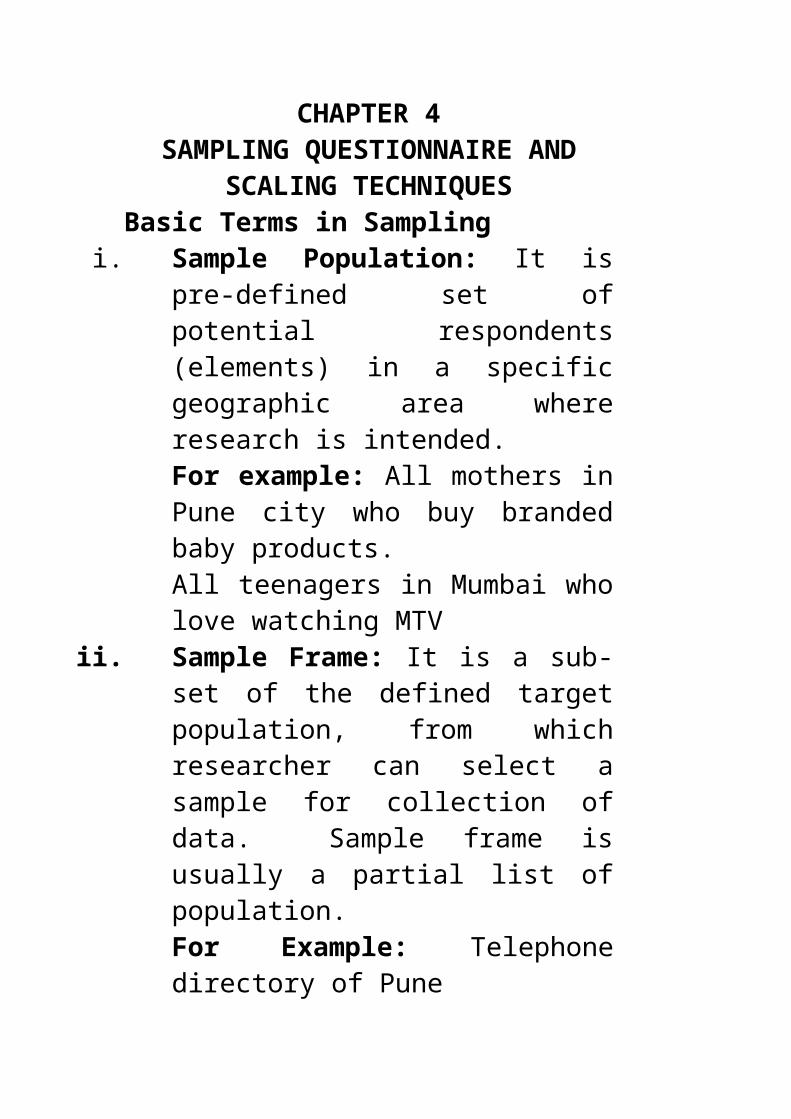
Did not come in different sizes for different dogs.
Subsequently, the company developed products that were responsive to the criticisms.
Figure: Phases in new-product research
Concept Identification. There are various ways to identify concepts. Some are neither user-based nor follow from identification of unfilled needs. For example, a technological breakthrough can suggest concepts, as when the freeze-dry process suggested freeze-dried fruit in cereal; or competitors may introduce a new product that represents either a threat to or an opportunity for an organization. One role of marketing research is to monitor the environment systematically to learn of technological or competitive developments that may suggest new concepts.
During the new-product development process there is usually a point where a concept is formed but there is no tangible usable product that can be tested. The concept should be defined well enough so that it is communicable. There may be simply a verbal description, or there may be a rough idea for a name, a package, or an advertising approach. The role of marketing research at this stage is to determine if the concept warrants further development and to provide guidance on how it might be improved and refined. Conjoint analysis typically is used to obtain an ideal combination of the concept's various features. Thus, research questions might include
Are there any major flaws in the concept? What consumer segments might be attracted to it? Is there enough interest to warrant developing it further? How might it be altered or developed further?
Concept Generation Need identification
Concept identification
Concept Evaluation and Development
Product Evaluation and Development
Testing the Marketing Program

Normally, the concept is exposed through personal contact, either in the respondent’s home, office or plant or in some central location such as a shopping center. Normally, respondents should include those who would be among the target segments. Since the goal of concept testing is to determine if a viable market exists, the researcher should be careful to avoid omitting a potential segment from the study.
Usually, the concept test explores several versions of a concept or several product concepts that respond to a user need. For example, in the mid-1960s, in response to an identified need for a household garbage disposal system, Whirlpool engineers tested four concepts: a disposable garbage can, a garbage compactor that would hold two weeks’ worth o garbage, a built-in kitchen compactor and a portable kitchen compactor. The concept test showed the last two alternatives to be definitely superior.
For the evaluative aspects of concept testing, it is necessary to include some overall indication of attitudes, interest and likelihood of purchase. The purchase likelihood, for example, cold be scaled as
Definitely Probably Might or Might Probably DefinitelyBuy Buy Not Buy Not Buy Not Buy
Researchers must interpret the results cautiously, particularly when they are encouraging, since the exposure, even if presented in a relatively neutral way, will sensitize the respondent to the product. The result actually is then an exaggerated tendency to indicate that the respondent will buy the product.
Concept testing is particularly important for durable goods and many industrial products, because they rarely employ testing r test markets. The Ford Taurus, Mitsubishi large-screen TV sets or the Sony Camcorder were never in test markets, for example. The problem is that it really is not practical to develop or produce such equipment on a pilot basis. A major commitment is required and it would not be realistic economically to withdraw the product after market-testing it.
Product Evaluation and Development
Product evaluation and development, or product testing, is very similar to testing, in terms of both the objectives and techniques. The aim is still to predict market response to determine whether or not the product should carried forward.
Use Testing. The simplest form of use testing gives users the product, and after a reasonable amount of time, asks their reactions to it, including their intentions to buy it. Researchers can contact respondents in shopping centers, by personal visits to their homes or offices, or, initially, by telephone. Burlington Industries, producer of fabrics, calls randomly selected telephone numbers to locate adult women who make many of their own clothes and

who would be willing to evaluate a new dress fabric. The fabric then is sent by mail, and a second telephone interview two months later solicits their description of their experience with it. Now market researchers can use the latest in computer technology and can do virtual product testing, which is explained in Marketing Research in Business 1. IA and Visionary Shopper are product-oriented techniques that do not take account of the fact that it is difficult to evaluate a service until it is consumed. Thus, when testing services, another virtual reality model, SERVASSOR, is more appropriate.
Several problems are associated with use tests. First, because of unclear instructions, a misunderstanding, or lack of cooperation, respondents may not use the product correctly and may therefore report a negative opinion. Or they may not use it at all and simply fabricate an opinion. Second, the fact that they were given a free sample and are participating in a test may distort their impressions. Third, even when repurchase opportunities are made available, such decisions may be quite different than when they are made in a more realistic store situation with special displays presenting the new brand and those of its competitors. Fourth, there is the issue of whether the users will accept the product over a long time period. This problem is especially acute when repurchase data cannot be or Ire not obtained. Finally, they may inflate their intention to buy. Consumers may say that they will buy the product but may end up not doing so.
VIRTUAL TESTING
MarketWare Corp. believes it has captured real marketing research on consumer behaviour in its new software, Visionary Shopper. The suburban Atlanta-based firm, already a leader in pegboard-display product space management software with its Pegman product, now is trying to take its technology into the rest of the store with its new virtual reality-based software. The system which runs on PCS, allows consumers to stroll through store aisles on a computer screen, allowing examination of packages as though the shelf was really in front of them. MarketWare (www.mktware.com) believes a multitude of marketing variables can be measured in impact through the process, which for most brands and categories runs about 30 minutes per consumers.
Most significantly, though, according to MarketWare’s Stephen Needel, who directs the firm’s simulation efforts, “it feels like fun”: for the consumer. “We can extend the time we have them in there” doing the testing because of the appeal of the three-dimensional presentation and real-shelf look. Consumers can actually remove products easily from a shelf, examine labels, study prices and other product options, and react to shelf-layout changes or promotional and pricing considerations – all without setting foot in a store. And for consumers sensitized to batteries of direct marketing and marketing research mail and phone calls, the system is a pleasant break, because “it’s not survey work”, said Needel. “It’s virtual reality”.
Predicting Trial Purchase. Several models have been developed to predict

trial levels of new, frequently purchased consumer products. The model called ESP (estimating sales potential) is typical. Data from 45 new-product introductions were obtained and used to estimate the model. Trial levels (the percentage of a sample of consumers who had purchased the product at least once within 12 months after launch) were predicted on the basis of three variables:
Product class penetration (PCP)-the percentage of households purchasing at least one item in the product class within one year.
Promotional expenditures-total consumer-directed promotional expenditures on the product
Distribution of the product-percentage of stores stocking the product (weighted by the store's total sales volume)
Knowledge of these three variables enabled ESP to predict trial levels of the new products extremely accurately. (The regression model explained 95 percent of the variance of the three variables.) Once the model is estimated, it can be applied to other new products. The manager simply estimates the percentage of households using the product class, the total promotional expenditures planned for the new product, and .the expected distribution level. The model will then estimate the trial level that will be obtained.
Trial also can be estimated directly using controlled shopping experience. A respondent is exposed to the new product promotion and allowed to shop in a simulated store or in an actual store in which the product is placed. The respondents then have an opportunity to make a "trial" or first purchase of the product.
Table 1 : The Assessor Laboratory Test Market Research Design and Measurement
Design Procedure MeasurementO1 Respondent screening and
recruitment (personal interview).Criteria for target group identification (e.g. product class usage)
O2 Premeasurement for established brands (self-administered questionnaire)
Composition of “relevant set” of established brands, attribute weights and ratings and preference
X1 Exposure to advertising for established brands and new brand
(O3 ) Measurement of reactions to the advertising materials (self-administered questionnaire)
Optional, (e.g. likability and believability ratings of advertising materials)
X2 Simulated shopping frip and exposure to display of new and established brands
O4 Purchase opportunity (choice recorded by research personnel)
Brand(s) purchased
X3 Home use / consumption of new brand.

O5 Postusage measurement (telephone interview)
New brand usage rate, satisfaction ratings, and repeat purchase propensity. Attribute ratings and preferences for “relevant set” of established brands plus the new brand.
O = measurement; X = advertising or product exposureSource: Adopted from Alivn, J. Silk and Glen L. Urban, “Pre-Test-Market Evaluation of New packaged Goods: A Model an Measurement Methodology”, Journal of Marketing Research, 15, may 1978, p. 178.
Pretest Marketing. Table 1 is an overview of a laboratory test design (a form of pretest marketing) called ASSESSOR.12 Two approaches are used to predict the new brand's market share. The first is based on the preference judgments. The preference data are used to predict the proportion of purchases of the new brand that respondents will make given that the new brand is in their response set. These estimates for the respondents in the study are coupled with an estimate of the proportion of all people who will have the new brand in their response set, to provide an estimate of market share. A useful by-product of this approach is an analysis of the concomitant market share losses of the other brands. If the firm has other brands in the market, such information can be critical.
The second approach involves estimating trial and repeat purchase levels based on the respondent's purchase decisions and intentions-to-buy judgments. A trial estimate is based on the percentage of respondents who purchase the product in the laboratory, plus an estimate of the product's distribution, advertising (which will create product awareness), and the number of free samples to be given away. The repeat-purchase rate is based on the proportion of respondents who make a mail-order repurchase of the new brand and the buying-intentions judgments of those who elected not to make a mail-order repurchase. The product of the trial estimate and the repeat purchase estimate become a second estimate of market share. ASSESSOR has been modified and other models have also been proposed for pretest marketing.
Test Marketing
Test marketing allows the researcher to test the impact of the total marketing program, with all its interdependencies, in a market context as opposed to the artificial context associated with the concept and product tests that have been discussed.
Test marketing has two primary functions. The first is to gain information and experience with the marketing program before making a total commitment to it. The second is to predict the program's outcome when it is applied to the total market.
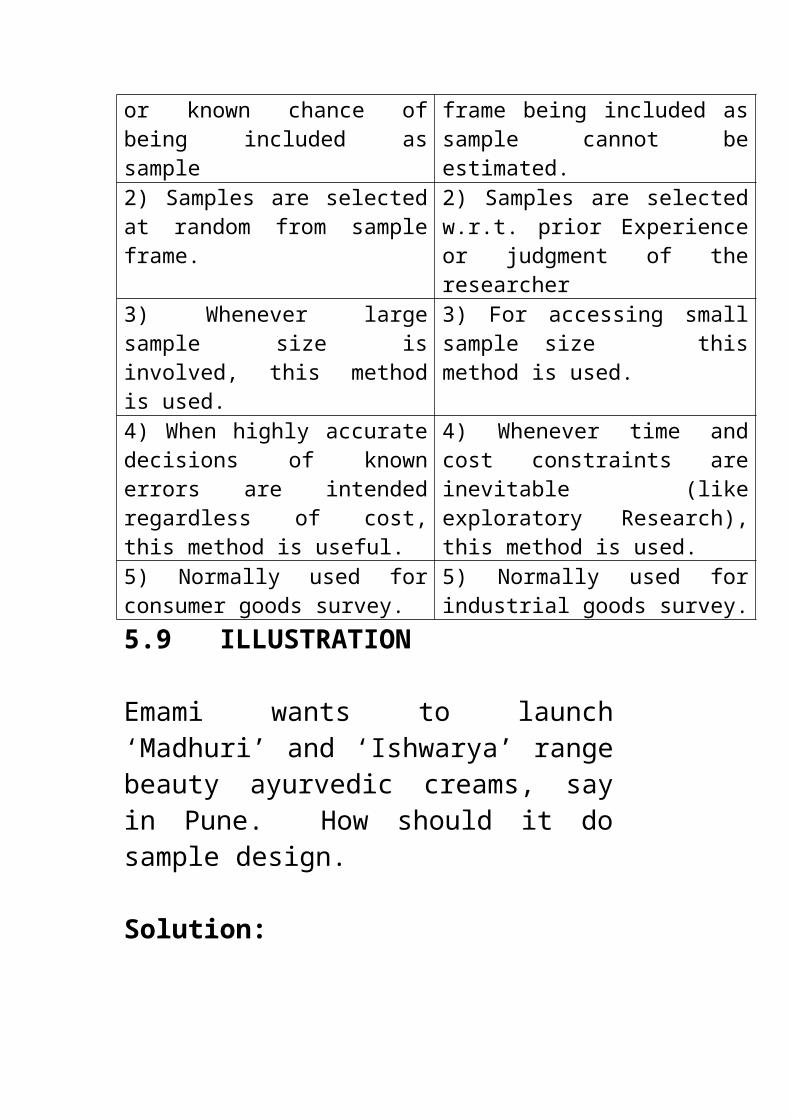
There are really two types of test markets: the sell-in test market and the controlled-distribution scanner market. Sell-in test markets are cities in which the product is sold just as it would be in a national launch. In particular, the product has to gain distribution space. Controlled-distribution scanner markets are cities for which distribution is prearranged and the purchases of a panel of customers are monitored using scanner data.
Sell-In Test Markets
Selecting the test cities
1. Representativeness. Ideally, the city should be fairly representative of the country in terms of characteristics that will affect the test outcome, such as product usage, attitudes, and demographics.
2. Data availability. It often is helpful to use store audit information to evaluate the test. If so, it would be important to use cities containing retailers who will cooperate with store audits.
3. Media isolation and costs. It is desirable to avoid media spill-over. Using media that "spill out" into nearby cities is wasteful and increases costs. Conversely, "spill-in" media from nearby cities can contaminate a test. Media cost is another consideration.
4. Product flow. It may be desirable to use cities that don't have much "product spillage" outside the area.
An important issue for sell-in test markets is the number of test cities to use. A single test city can lead to unreliable results because of the variation across cities of both brand sales and consumer response to marketing programmes. Implementing and controlling the test
A second consideration is to control the test by ensuring that the marketing program is implemented in the test area so as to reflect the national program. The test itself may tend to encourage those involved to enhance the effectiveness of the marketing program. Salespeople may be more aggressive. Retailers may be more cooperative. There is also the reaction of competitors. At one extreme they can destroy the test by deliberately flooding the test areas with free samples or in-store promotions. More likely, however, they will experiment with retaliatory actions and also monitor the results themselves.
Timing
A third consideration is timing. If possible, a test market normally should be in existence for one year. An extended time period is needed for several reasons. First, there are often important seasonal factors that can be observed only if the test is continued for the whole year. Second, initial

interest is often a poor predictor of a program's staying power. There is usually a fatigue factor that sometimes can take a long time to materialize.
Measurement
A crucial element of the test market is the measure used to evaluate it. A basic measure is sales based on shipments or warehouse withdrawals. Store audit data provide actual sales figures and are not sensitive to inventory fluctuations. They also provide variables such as distribution, shelf facings, and in-store promotional activity. Knowledge of such variables can be important in evaluating the marketing program and in interpreting the sales data.
Measures such as brand awareness, attitude, trial purchase, and repeat purchase are obtained directly from the consumer, either from surveys or from consumer panels. Such variables as brand awareness and attitude also serve as criteria for evaluating the marketing program and can help interpret sales data. The most useful information obtained from consumers, however, is whether they bought the product at least once, whether they were satisfied with it, and whether they repurchased it or plan to.
Costs of test marketing
In making cost-benefit judgments about test markets, all costs need to be considered. Many costs are relatively easy to quantify; these might be the development and implementation of the marketing program, preparation of test products, administration of the test, and collection of data associated with the test.
The costs and risks that may delay the launch of a new product are more difficult to quantify. If a new-product launch is delayed by six months or a year, an opportunity to gain a substantial market position might be lost.
Controlled-Distribution Scanner Markets (CDSMs). These markets are termed controlled-distribution because there are generally agreements with retailers to allow new products under test to have access to shelf space. An example of a CDSM is lRI's BehaviorScan.
CDSMs have four major advantages over test markets. First, they are less expensive. Although it is difficult to generalize, they probably cost from one-sixth to one-third the cost of a full test market. Second, there is the potential to do more experimenting with marketing variables in a CDSM. The advertising seen by panel members is controllable. Further, in-store activities such as promotions and pricing are under more control than they would be in a sell-in test market. Third, the scanner-based data probably are more accurate, timely, and complete than the data available in a sell-in test market. .Fourth, there is the potential to provide accurate early estimates of the test market results using the consumer panel information.
The most obvious disadvantage of a CDSM is that it provides no test of the
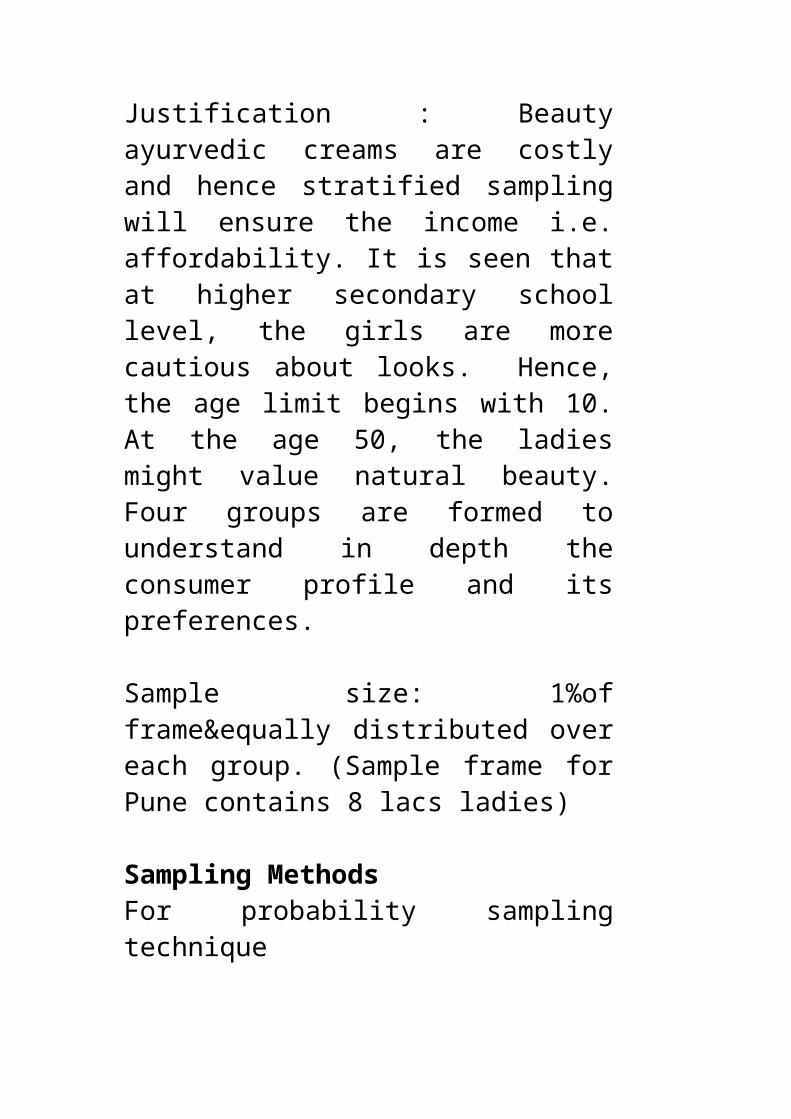
product's ability to gain shelf space, special displays, in-store promotions, and so on. However, recent research on the effectiveness of sales promotions has generated useful information for making efficient decisions. Since gaining distribution can be a crucial issue for some products, leaving it unaddressed can be troublesome. Another major CDSM disadvantage is the limited choice of test cities.
Projecting trial, repeat, and usage rates using panel data
To estimate the ultimate trial level, the percentage of product class buyers who will try the new brand at least once is monitored over time. Each person who tries the new product is then monitored again, and the time between the first (trial) purchase and second purchase is noted. The market share estimate is thus the product of the percentage of people who tried and the percentage of people who repeat-purchased the product. Market share and sales projections made using this modeling logic can be very accurate. Marketing Research in Business gives an example of test marketing.
CASE STUDY EXAMPLES
(a) Apartment on wheels(b) Makeup room on wheels(c) Hotel apartment(d) McKinney Electronic Toll Collection
Pass (ETCP)
Product research would be also applicable to find out the reactions of consumers to manual cameras vs automatic cameras. In addition to specific likes or dislikes of each product category, brand preferences within the category could form a part of the research. The objectives may be to find out what type of camera to launch and how strong the brand

salience for the sponsor’s brand is. Another product of research could be to find out from existing users of photocopiers (commercial and corporate), whether after sales service is satisfactory, whether spare parts are reasonably priced and easily available and any other service improvement ideas for instance, service contract, leasing options or buy-backs.
II. PRICE RESEARCH
PRICING RESEARCH
Research may be used to evaluate alternative price approaches for new products before launch or for proposed changes in products already on the market. As in the of test marketing, the question of "reality" applies, and it has been found that the sales response to products at different prices in actual stores produces Ire discriminating results than the sales response in an artificial store.
There are two general approaches to pricing research. The first is the well-established Gabor and Grainger method. In this method, different prices for a product are presented to respondents (often by using test-priced packs), who then asked if they would buy. A "buy-response" curve of different prices, with the corresponding number of affirmative purchase intentions, is produced.
In a second approach, respondents are shown different sets of brands in the same product category, at different prices, and are asked which they would buy. This multi-brand-choice method allows respondents to take into account competitors' brands, as they normally would outside such a test. As such, this unique represents a form of simulation of the point of sale.
Decisions regarding price ranges for new products have to be made early in the development stage. A product concept cannot be tested fully, for example, without indicating its price, so when the product is ready to be introduced, a decision must be made about its specific price. Decisions on price changes-Should we change the price, and, if so, in which way and by how much? will then need to be made over the product's life cycle.
Either of two general pricing strategies can be followed. The first is a skimming strategy, in which the objective is to generate as much profit as

possible in the present period. The other is a share-penetration strategy, whose objective is to capture an increasingly larger market share by offering a lower price. Pricing research for the two different approaches differs substantially in terms of the information sought.
Research for Skimming Pricing
The skimming pricing strategy is based on the concept of pricing the product at the point at which profits will be the greatest until market conditions change or supply costs dictate a price change. Under this strategy, the optimal price is the one that results in the greatest positive difference between total revenues and total costs. This implies that the researcher's major tasks are to forecast the costs and the revenues over the relevant range of alternative prices.
Research for Penetration Pricing Penetration pricing is a strategy based on the concept that average unit production costs continue to go down as cumulative output increases. Potential profits in the early stages of the product life cycle are sacrificed in the expectation that higher volumes in later periods will generate sufficiently greater profits to result in overall profit for the product over its life. For some products, this reduction takes the form of an experience curve.
Figure 2: Share-oriented penetration
The pricing pattern that is adopted for increasing market share is to:
1. Offer a lower price (even below cost) when entering the market. 2. Hold that price constant until unit costs produce a desired percentage
markup. 3. Reduce price as costs fall to maintain markup at the same desired
percentage of costs.
Rs. 100,000
Rs. 10,000
Rs. 1,000
Rs.100
1 100 10,000 1,000,00
Unit cost
Price
Constant markup percentage
Cumulative output in units
Uni
t cos
ts a
nd p
rices
The pricing pattern is illustrated in Figure 2.
The types of information required for this pricing method are
1. The nature of the experience curve. 2. Breakeven points. 3. Cost of units sold to additional market segments. 4. Competitor costs. 5. Forecast of the "decline" stage of the product life cycle.
Table 2: Informational Requirements for Pricing Strategies
Strategy Description Information Requirements
Sources of information
Random discounting
If some consumers have heterogeneous search costs, firms, discount their prices in a random manner to take advantage of those consumers. These consumers buy at the undiscounted price instead of searching for the lowest price, whereas consumers with low search costs will buy at the low price.
Knowledge of consumer segments in the market.
Characteristics of consumers (their search costs, etc.)
Product and cost information
Information on legal constraints
Demographic consumer data
Analysis of scanner data
Internal records
Legal data
Strategy Description Information Requirements
Sources of information
Second-market discounting
If distinct markets exist and if the consumers in one market incur transaction costs to buy in another, the firm can discount its price in the other markets to below its average cost. In the international context this is called dumping.
Knowledge about the different markets and their characteristics
Product and cost information.
Information on the legal aspects of the other markets.
Information on the legal transaction cost incurred by the consumer when he or she buys from the different market
Internal records
Legal data
Secondary data sources that give the demographic profile of the markets
Periodic discounting
When some consumers in the market have differential reservation prices, firms can start at high prices and periodically discount them in order to draw consumers with lower reservation prices
Information about the consumers’ reservation prices
Product and cost information
Internal records
Survey research to determine the consumers’ reservation price
Legal data
Price signaling When consumers in the market are willing to pay more for a product despite lack of knowledge regarding its quality, then price signaling can be used. Essentially the strategy is to produce on inferior product and sell it at the same price as the better quality product another firm produces, in the belief that consumers will assume that the product is of high quality and buy it because of its high price
Information about your competitors’ prices and costs
Information about the legal constraints of price signaling
Product and cost information
Internal records
Secondary data on competitor prices
Legal data
Inferential information on competitor costs

Strategy Description Information Requirements
Sources of information
Penetration pricing
Penetration pricing is used in situations similar to that in periodic discounting, except in this case competitors are also free to enter of the same price. Hence, the threat of competitive entry and price-sensitive consumers force the firm to price its products at a low price.
Product and cost information
Information about competitor prices and costs
Secondary data and inferential information on competitor prices and costs
Internal records
Geographic pricing
Geographic pricing strategies are used by firms that sell in markets that are separated geographically. The difference in pricing is due to transportation costs rather than reservation prices or transaction costs.
Information on the characteristics of the different markets
Product and cost information
Information on the transportation costs and about any legal aspects that may hinder this particular type of pricing strategy
Internal records
Secondary data and inferential information on competitor prices and costs
Premium pricing
This strategy and price signaling are very similar. The difference stems from the fact that in price signaling the firm produces only the inferior product and prices it high, whereas here the firm produces both the inferior and the better product and sells them at the same price to exploit the joint economies or scale.
Product and cost information
Information on the competitors’ price and cost
Information on the characteristics of the consumers (like the maximum price they are willing to pay for this product)
Secondary sources of legal data
Internal records
Secondary sources of information on markets and transportation costs
Price bundling Bundling strategy is adopted when the products are no substitutable, perishable, and there is an asymmetric demand structure for them. An example of this strategy is selling a car with the maximum number of options. The perishability in the case of durables is with regard to the purchase occasion.
Information on the demand characteristics for the various components of the bundle
Product and cost information
Information on the consumer preferences for the various combinations of the bundle
Internal records
Survey data on consumer characteristics and preferences
Secondary sources of information on competitor costs and prices

Strategy Description Information Requirements
Sources of information
Complementary pricing
Complementary pricing is the strategy used by firms to price complementary products. They usually price the main product at low price while the price of the complement is high. The classic example is Japanese pricing of their cars and the spare parts.
Product and cost information
Internal records
Price research is done in following two situations
(B) When competitors product is available for comparison of the price.Coca cola, though started offering 300 ml at Rs. 7 as against Pepsi’s 200 ml for Rs. 6, returned back to Rs. 5 for 200 ml to attract target market which was college going youth.
(C) Well competitors product is not available for comparison
Dabour India Ltd. Launch lime juice (Lemoned). During launching similar product was not available for price
comparison that is why it contacted target customer (50 housewives, 50 working women and 50 cooks)
(D) When price is the only benefit you are offering to targets, do not hide but hammer it. Cadbury Shweppes while launching sports cola and Canada dry offered 300 ml bottle at price Rs. 6 and communicated as follows:Yehi hai Right Price Baby – Just 6 bucksNothing expensive about it – Just 6 bucks
(E) International Distillers & Vinters Research wine and alcoholic beverage market and realize that 90% of the market exists below Rs. 250/- price segment. As such it launch two pack sizes with brand names Green Lable & Old Gold price at Rs. 175 and Rs. 225 for 125 ml (these brands belong to green lable visky
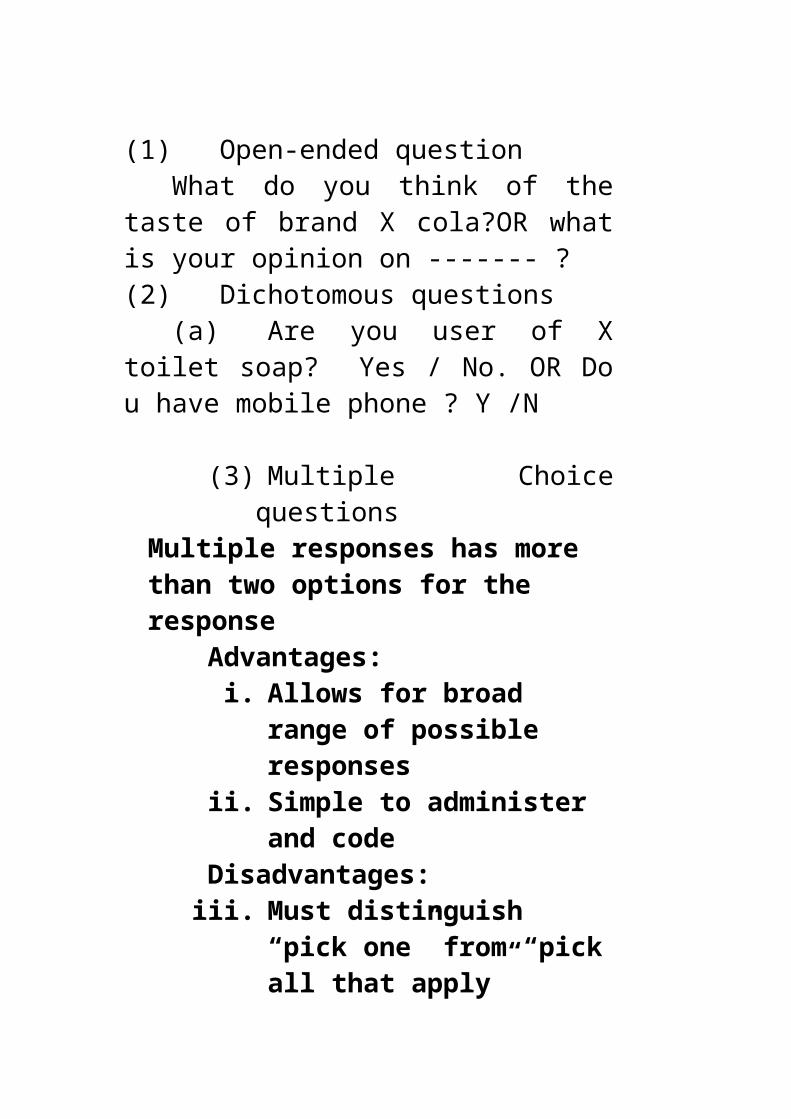
Lesser if you cannot identify affordability (as done by coca cola and dabur) you may adopt the second route – largest possible customer segment.
III Distribution Research
Decision area Marketing research technique to be adopted
1) Selecting suitable channel option from two alternatives like direct Distribution or Indirect distribution
Indepth interviews, focus group studies, exploratory research
2) Performance Appraisal of two horizontal channel partners (retailer vs retailer)
Cluster analysis
3) Encouraging or motivating channel members
Qualitative research or focus group studies
CASE STUDY EXAMPLE(A) Nagaland Govt. Labhlaxmi Lottery (B) Playwin (C) Sundaram Fastners
(D) Rebok India(E) How Bollywood producers invented 7th
8th and 9th channel of distribution for the films
* Application of Research to Bollywood.Why and how Bollywood producers invented new channels of distribution for selling the films?
a) Till 1992, if a movie was to recover just cost of production + distribution + marketing; it would have stayed in theatres for 50 days. (Minimum 3 show per day, all over India)
b) The revenue earning ability of movies was not great because overall affordability of the society was weak. The balcony ticket during 1960-70 was Rs.1.50, which increased to Rs. 2.00 during 1970-80. It became Rs.20 by 1995 and then to Rs. 50 by 2005 for single screen cinema.
c) Given below production + marketing cost for a movie, decade-wise, as well as the revenue per territory for different viewerships.
(1) Production +Marketing cost for a movie – decade wise
Sr. No.
Decade Production + Marketing cost in Rs.
Cr.
Hit movies
1 60-70 Upto Rs.0.50 cr.
Dosti, Jangali Kasmir ki Kali, Aaradhana, Daag, Aarjoo, Farz, Suraj, Sangam, Upkar
2 70-80 Upto Rs. 0.75 cr.
Bombay to Goa, Janjeer, Bobby Hathi Mere Sathi, Amare Prem, Kati Patang, Deewar, Roti,

Trishul, Don, Shole, Roti kapada Aur Makan, Pyarab-Paschim
3 80-90 Upto Rs. 1.25 Cr
Karma, Ram-Lakhan, Tejab, Dostana, Aakhir Rasta, Himmatwala, Tohafa
4 2001-2008
Upto Rs. 50 Cr.
Laggan, Koi Mil Gaya, Krish, Devdas, OSO, Welcome, K3G
(2) India’s movie market is distributed in 6 territories. Total 13,000 single screen theatres, in 6 territories entertain Indian Public. Till 1992, the revenue from movies was as follows:
Sr. No.
Decade Balcony ticket
Movie cost
Revenue (all India) Movie stays for50 days
100 days
175 days
1 60-70 Rs. 1.50 Rs. 0.50 Cr.
0.48 0.65 0.80
2 70-80 Rs. 2.00 Rs.0.75 Cr.
0.74 0.90 1.10
3 80-90 Rs. 5.00 Rs.1.25 Cr.
1.25 1.50 1.75
4 90-2000 Rs.20.0 Rs.2.0 Cr.
2.05 2.35 2.60
5 2000-2008 Rs.50.0 Rs.10.0 Cr
100.0 170.0 250.0
(3) Comparison of Revenues before and after 1992
Revenue per week (fig. in Rs. Cr.)Before 1992
After 1992 to 2000Movie (single
screen)Various Rights
Total
50% 0.035 0.29 0.15 0.44
viewership90% viewership
0.070 0.60 0.15 0.75
d) Bollywood invented new channels of distribution, since 1992
Year Invention Example1992 Music right Khalnayak - 0.75 cr), K.K.H.H. - 2.25,
Mohabbatai – 7 Cr., Devdas -12 Cr.1995 Export
RightsK.K.H.H. – 11.37 cr., Mohabbataien – 6.5 Cr., Dil to Pagal Hai – 6.4, Hum Aap Ke Hai Kaun, 4 Cr., Kaho Na Pyar Hai – 3.21 Cr., Laggan – 2.87 Cr., Mansoon Wedding – 60 Cr., Devdas – 12 Cr., Koi Mil Gaya & Krish – 10 Cr.
1997 DVD & Satellite
Kaho Na Pyar Hai – 2 Cr., Karan-Arjun – 0.50 cr., Krish & Koi Mil Gaya – 12 Cr., Murder – 20 Lakhs
e) Alter 2000, Multiplex mushroomed in India. As on today i.e. June 2008, total 360 screens through 90 multiplexes are available for show-business. Now a movie can recover production + marketing cost in a week. Example: Movie Jannat released in June 2008,Singh is King,Rab Ne Bana Di Jodi&Gajni.
Cost All India Revenue in one week RemarkSingle screen cinema
Multiplex Total
Jannat 5 cr. 14 cr. 2 cr. 16 Super Hit
IV ADVERTISING RESEARCH
Decision area Marketing research technique
1) Determining ad-objectives (which objective should be chosen)
Focus group interview, qualitative research
2) Evaluating ad-copy and ad-effectiveness
Experimental research deisgn
3) Deciding media Qualitative research4) Advertising budgets Opinion poll,
qualitative research
In attention, advertising research is revolving around
(1) Copy (2) Media
CASE STUDY EXAMPLES(A) Sales Promotion Campaign by Asian
Paints(B) Sales Promotion Campaign by BT, BW,
A&M
Appeal in Indian Advertising Changing Role of Women- From confident women (Lalita) to Glamour Girl (Lolita)
Indian advertisement has witnessed a significant transformation in the manner in which women are portrayed. Earlier, advertisers were charged with depicting women in a stereotypical way; but now there is a considerable positive change. Many contemporary advertisements portray women as independent, assertive, enjoying life, & serious about their careers.
Decision Area
MR Technique usedDecide Appeal Qualitative ResearchDecide on ad-slogan Concept testing, Opinion pollDecide on media Observations, PI, and Experiments.
ILLUSTRATIONS1) Hero Honda Pleasure------- Print & Audio visual
Ad slogan- Why should boys have all the fun?Why to sit on back-seat?
Audio-visual- Faceless girl, individual or double seat, with helmet, driving the scooter& enjoying the life.Print—Girl with modern dress with spread arms, in front of yellow bike, expressing thrill of driving.Recently Priyanka Chopra has been endorsing the brand with Punjabi-dialog.
2) Asmi Diamond Jewelry------ Print & Audio visualAd slogan—I believe in meBaseline- For the women of spritPrint---- An antique looking background is used as a photo frame to signify the time-less ness that diamond represents.
3) ICICI Prudential Life----- Print & Audio visualAd slogan- Jeetey RahoMost of Insurance marketers depict negativity like death while selling policy. ICICI this ad has effectively changed this perception on a very happy note. Moreover, in Indian tradition, the sindur, that is shown in the ad, symbolizes protection& the slogan jeetey raho is an established blessings for longevity. Thus it conveys idea behind taking life insurance, which is to facilitate a peaceful life without any worries regarding the future.The ad also portrays woman as decision maker in financial planning.
4) Sania Mirza as a glamour girl endorsing many products.a)Tata Tea Premium—Changing with the timesb) Getz- Prime drive globalc) Yosmart Scooterated) TVS Scooty-streak—Tough- Trendye) Sprite
5) Indica V2 Xeta—Two Glamorous looking modern girls asking lift to male, who is driving xeta6) Pizza Hut- A young girl, with very modern dress trying to hold skirt which is going up due to wind7) Women in advertisement for Men’s toiletries a) Axe deodorant- Women in bra & panties running after a man8) Nakshatra Jewellery- Ashawrya Rai- Baccan b) Wild Stone- A married woman dreaming sex with someone else, who come across with her while retuning after worshiping god.
------------------------------------------------------------

Brand Equity Research
Brand equity is defined as a set of assets and liabilities linked to a brand that add to or subtract from the value of a product or service to a company and / or its customers. The assts or liabilities that underlie brand equity must be linked t the name and / or symbol of the brand. The assets and liabilities on which brand equity is based will differ from context to context. However, they can be usefully grouped into five categories:
1. Brand loyalty2. Name awareness3. Perceived quality4. Brand associations in addition to perceived quality5. Other proprietary brand assets: patents, trademarks,
channel relationships, etc.
The concept of brand equity is summarized in Figure which shows the five categories of assets that are the basis of brand equity. The figure also shows that brand equity creates value for both the customer and the firm.
Research questions under Brand Equity
An appraisal of the brand based on the five dimensions involves addressing and obtaining answers to the questions that follow. Marketing research can help to provide answers to these questions.
Brand loyalty. What are the brand-loyalty levels, by segment? Are customers satisfied? What do “exit interviews” suggest? Why are customers leaving? What is causing dissatisfaction? What do customers say are their problems with buying or using the brand? What are the market share and sales trends?
Awareness. How valuable an asset is brand awareness in this market? What is the company’s brand awareness level as compared to that of competitors? What are the trends? Is the brand being considered? Is brand awareness a problem? What can be done to improve brand awareness?Perceived quality. What drives perceived quality? What is important to the customer? What signal quality? Is perceived quality valued – or is the market moving toward a commodity business? Are prices and margins eroding? If so, can the movement be slowed or reversed? How do competitors stack up with respect to perceived quality? Are there any changes? In blind-use tests, what is our brand name worth? Has it changed over time?
Brand associations. What mental image, if any does the brand stimulate? Is that image a competitive advantage? Does it have a slogan or symbol that is a differentiating asset? How are the brand and its competitors positioned? Evaluate each position with respect to its value or relevance to customers

and how protected or vulnerable it is to competitors.
Other brand assets. Are sustainable competitive advantages attached to the brand name that are not reflected in the other four equity dimensions? Is there a patent or trademark that is important? Are there channel relationships that provide barriers to competitors?
Figure 1: Brand Equity
Customer Satisfaction Measurement Process
It is believed that 96 percent of dissatisfied customers never complain; 60 to 90 percent of these “silent” dissatisfied customers will no buy from you again; 90 percent of those who do complain will not buy from you again. Therefore, it is important that every firm should have a customer satisfaction programme. A “no frills” customer satisfaction programme involves the following.
Brand Loyalty
Name Awareness
Perceived Quality
Brand Associations
Other Proprietary Brand Assets
BRAND EQUITYName
Symbol
Provides value to Customer by enhancing customer’s:
interpretation / processing of informationconfidence in the Purchase Decisionuse Satisfaction
Provides Value to firm by enhancing:
Efficiency and effectiveness of Marketing ProgrammesBrand Loyalty Prices / MarginsBrand ExtensionsTrade Leverage
Competitive Advantage

Define Goals and How Information will be used. A common failure of customer satisfaction research is lack of clear, comprehensive and measurable goals. Given the strategic nature of the quality improvement process, key parts of a company must be involved in setting objectives for customer satisfaction measurement and management. This helps to clarify the needs of various users of the information, creates a sense of ownership of the process, and identifies how various levels of a company may have to cooperate to plan action.
Equally important is determining how the information will be used once it is developed. Careful analysis of strategic and tactical organizational applications will ensure that issues of design, sample, analysis, reporting and deployment are structured to provide customer-focused information hat can be acted on most effectively.
Discover What Is Important to Customers and Employees. This discovery phase of data collection is intended to identify, in customers’ and employees’ own language, the attributes that compose their perceptions and expectations for quality and satisfaction. This information is gathered through various qualitative techniques, notably, depth interviews with senior managers and focus groups or on-site interviews with customers and customer-contact personnel.
The research will generate a comprehensive list of everything that customers and employees consider important. It is now necessary to use similar associative for subsequent measurement as key drivers of satisfaction.
Measure Critical Needs. Measuring the relative importance of the attributes identified in qualitative discovery and a company’s competitive performance on those attributes is accomplished through critical-needs assessment. This phase uses in-depth telephone, mail, or personal interviews with a representative sample of customers, lost customers and competitors’ customers to gather quantitative information. Using trade-off techniques, instead of traditional importance scaling, provides improved discrimination on the relative importance of attributes.
This phase should provide a broad array of actionable information. It should include the relative importance of key drivers of satisfaction; competitive performance on these critical attributes; site-specific performance, depending on sample size; cross-market segments with specific service needs; value-adding performance relative to expectations; and specific gaps between importance and performance.
Act on the Information. Action planning organizes activity to improve customer satisfaction by operationally defining and functionally deploying customer requirements. This makes it possible to establish cross-functional quality improvement reams. Using techniques such as quality function deployment, flow charts, check sheets, Pareto charts and cause-and-effect diagrams, teams can improve processes based on external customer needs,

internal chains of customers, workflow analysis, and work-process analysis.
Measure Performance over Time. Periodic measurement of how a company and its competitors perform on the key drivers of satisfaction reveals the rate at which customer satisfaction is improving or declining. Using the same sample criteria and interviewing techniques applied in critical-needs assessment, measurement should involve a brief interview on current performance and include an opportunity for open-ended comments. The frequency of measurement should be determined by market dynamics and should allow sufficient time for change to become measurable.
Consideration also should be given to periodic qualitative monitoring to provide information on changes in environment. Using the model described in the preceding paragraph to improve and measure customer satisfaction requirements can greatly enhance existing total quality management and other quality improvement programmes. It also can stand alone as a first step in focusing an organization on improved customer satisfaction as the key to improved market share and financial performance.
In either case, success ultimately is determined by the organization’s top-down commitment to meet and exceed the customers’ requirements in the market place. For example, knowing that customers want “quick service” is helpful; knowing that “quick service” means having their problems solved in less than 5 minutes is actionable.
------------------------------------------------------
Market Development Research:- Socio-Cultural Trends- Segmentation researchMass Segmentation to Niche SegmentationNiche segmentation is the act of finding a slot within the mass segment, rather than creating a unique slot with fewer customers.Why Niche segmentation?Following socio-cultural changes/trends are responsible.
(A) Significant change in Demographics of the society in last 3/4 years# Increase in disposal income, Metros- 35to55%, Mini Metros-30-50%, Tier-I cities- 25-40%, Rural Area- 10-15%# Increasing financial independence among women, No. of girls pursuing graduation, post-graduation& PhD programs have increased by 25-35% in last 9 years.# In small families, children’s influence on purchase decisions

Have increased.# Increase in the level of education overall.
(B) A Cultural Transition$ From myths to awareness to acceptance.$ From tradition-bound to techo-savy$ Change in family structure, from joint to nuclear.$ Shift in thinking process, from orthodox to modern.
(C) Shift in Market Dynamics@ Increase in product category, from general to distinctive.@ Need for innovation & experimentation.@ Changing buyer behavior like from basic goods to premium Or luxury or value added goods.@ Growing customer expectations due to impact of internet.@ Distinct individuastic& clear preferences for health& fitness.@ Competitive clutter.
Examples of Niche segmentationExhibit 1: Niche segment or Special slot
PRODUCT BENEFIT NICHE SEGMENTWomen’s Horlicks Wholesome&
completeNutritional health drink.
New generation women balancing between family &career.
Amul Probiotic wellness ice cream.
Overall health & well - being
Health& fitness conscious generation.
Kellogg’s Special K Whole wheat cereal flakes for weight management.
For women who are fitness conscious.
Colgate Total Whitening & anti-cavity toothpaste.
For kids prone to cavities.
Johnson’s no tears shampoo
Protection of delicate skin & eyes.
Infants
Diet Coke/Diet Pepsi/Amul Lite
Low calorie beverages& food products
Over weight persons unable to resist the attraction of processed food.
Scooty Pep 99 vibrant colors, first time ever in any two wheelers.
Young women loving feminine colors.
Saffola Active Cooking oil having low cholesterol
Heart awareness& cholesterol control
Saffola low calorie Rice Health& fitness Higher middle class young men worrying about stomach.
Gender specific Niche segmentation.
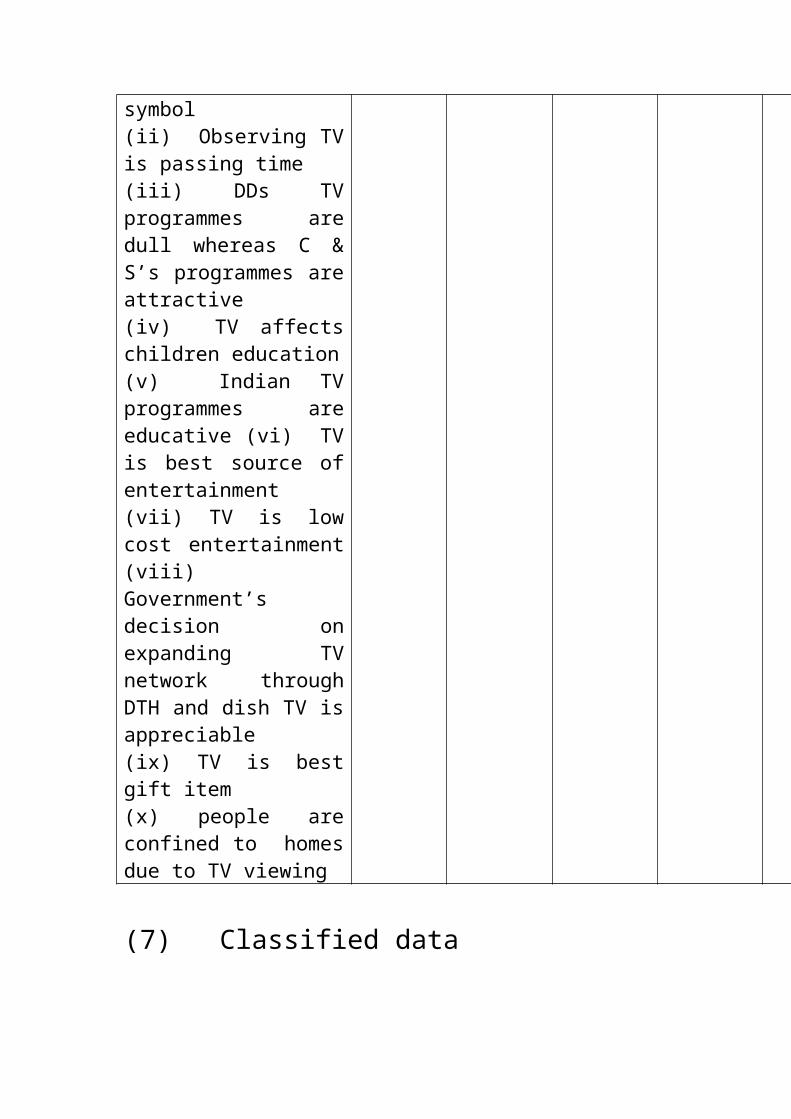
Exhibit 2: Gender WonderBrand Company Benefit/ Niche SegmentFair& Handsome Emami Fairness cream for
men to convert their tough skin in fair/gentle skin.
Fair One Elder Pharma& Shhanaz Husain
The goodness of herbs especially for men.
Fair & lovely(Men`s Active)
HUL Fairness cream for men with sun control.
Clinic All Clear HUL Anti dandruff shampoo especially made for rough scalp & hair type in men.
Synergy Garnier(L`oreal) Specially made hair colors for men’s hair
Nivea for Men Beiersdorf Grooming & skin care products for men.
Saka Bleach Fem India`s first bleach especially formulated for men`s skin tone.
Set Wet Paras Pharma Hair grooming range( gel&shampoo) for men.
Parachute After shower range
Marico Ind Wet look & extra – holdGel,anti-dandruff&moisturizing hair care range for men.
Biotherm L`oreal Anti-ageing gel, under eye gel, moisturizing pack etc, catering to wrinkles sagging necks in men.
Axe HUL Range of deodorants for men
Pleasure Hero-Honda Scooter designed for providing thrill to women (Why should boys have all the fun?)

Creating a Niche Segment: - Nokia wayNokia did marketing research during September 2008.Total sample size was 80,000 across 26 countries. After analyzing data, it came up with 12 distinct customer segments. These were aggregated into 4 major categories--------Connect, Live, Achieve and Explore.Nokia divided its handsets into these 4 categories. This very well reflects in its positioning strategy------------------------- Connecting PeopleThe strategy is very successful providing 65% market share to nokia. High Involvement
Pragmatic Technology Leaders Leaders Technology stylists
Live Young Explorers Explore
Life Builders

Life Jugglers Style Leaders
Rational ----------------------------------------------------------------- Aspirational
Mature Acceptors Image Seekers Family Providers Style Followers Connect Achieve Simplicity Seekers
Lower involvement
V. CONSUMER BEHAVIOUR RESEARCH
Consumer Behaviour and the factors that affect consumer buying behaviour can be very well studied through HYPOTHESIS TESTING. Following illustrations will focus on consumer behaviour and applications of marketing research:
Illustration 1
Consumer Behaivour and Brand Extnesion

Hypothesis
Hypothesis 1
H0: The hypothesis of the study is that cultural differences do not have an impact on brand extension across countries as well as states within a country like India. For example, people in the state of Tamil Nadu may have different consumer profile compared to that of Punjab and but might perceive and accept brand extensions in a similar way. Cultural differences do not have an impact on brand extensions.
H1 : The alternative hypothesis is that cultural difference do have an impact on brand extensions and is very relevant in the Indian scenario. In fact, brand extensions judged to be a poor fit by U.S. respondents, such as Coke. Indian respondents perceived popcorn and McDonald’s chocolate bars, much more positively.
Hypothesis 2
Cultural differences will exist to the level of importance attached to individual product attributes.

The hypothesis 1 and 2 were based upon the observation that, within a product category, different brands and/or products featuring specific attributes often carry significantly different tags.
Objective
The objective of this study is to examine whether cross-cultural difference exist in consumer perceptions of the various attributes in brand extensions. Also we try to examine whether cultural differences will be stronger with extensions that are further away from the parent brand, which was referred to as “low fit” extensions. The brand extension selected were Coke Popcorn, McDonald’s chocolate bar, Mercedes-Benz watch and Kodak greeting cards.
To find out whether cultural differences will exist in the amount consumers would expect to pay for each product / brand extensions and the frequency of their buying. Another objective was to check whether cultural differences will exist in the level of importance attached to individual product attributes, like colour, taste, etc.
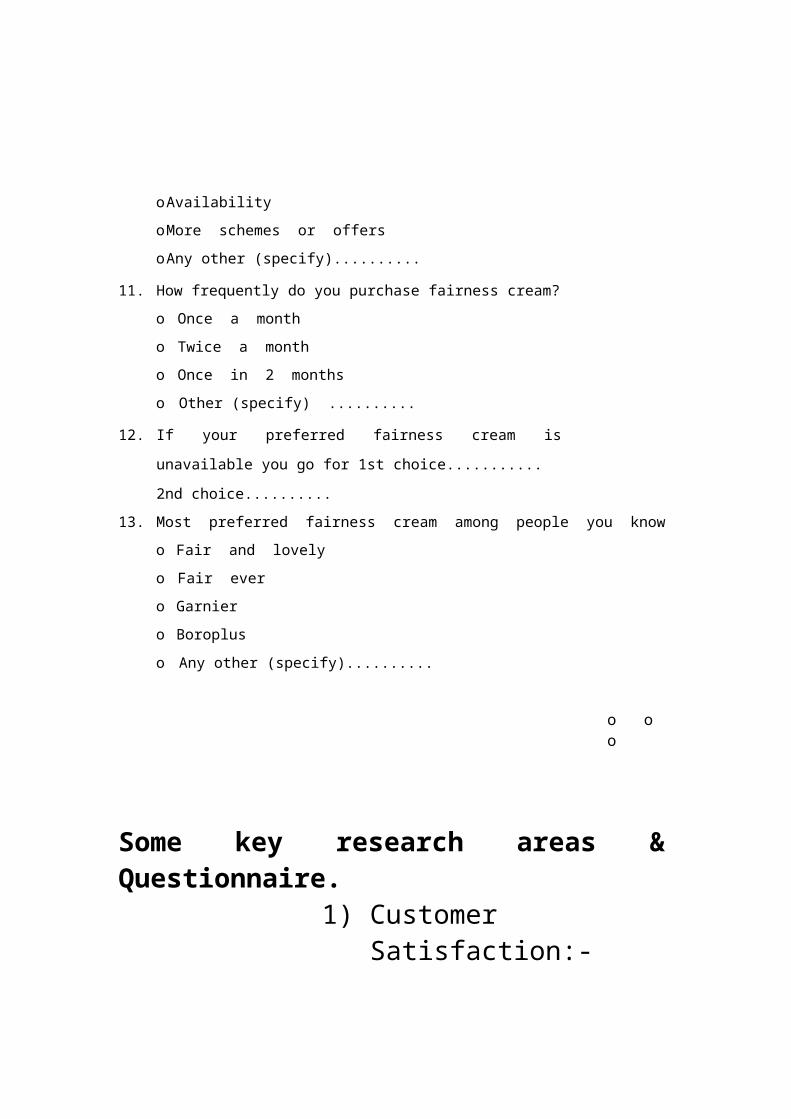
Research methodology
A survey was conducted to study the impact of cultural differences on brand extensions in the Indian scenario. This was done by carrying out a market research on consumer responses to the various brands along with their extensions (listed) and which are parts of the FMCG sector.
List
Kellogg’s Bisucits / Kellogg’s Cereals
Lux Soap / Lux Liquid Soap Maggi Noodels / Nestle Chocolate Nirma Detergent / Nirma Soap Lipton Tea / Lipton Ice Tea
Exploratory Research design was constructed to learn various stated and unstated needs of people w.r.t. brand and brand extensions. The questionnaire was formulated after interviewing 15 samples.
The sample size selected for the main survey was a total of 90 respondents considering the time duration fo the project and it was felt that the sample size of 90 was substantial enough to represent the universe. The respondents

were typically the existing users of either of the various brands being mentioned. Almost 45% of Mumbai’s population comprises of Maharashtra (the second most being Gujaratis) so care has taken to see that the sample comprises of similar percentage of maharashtrians. Hence the Western region sample size is more than 55% of the total sample size.
Although the type of sampling used was convenience sampling, care was taken to ensure that the example was as diverse and representative a s possible by targeting respondents across the various cultures, income levels, education backgrounds, etc. so care was taken to ensure that people from different regions or states were considered. Similarly the survey had a greater mix of families, rather than individuals since they are more often the decision makers when it comes to buying such commodities.
Analysis and Findings
After collecting the data from the respondents, the data was complied and the analysis was done using SPSS. PREFERENCE OF INDIAN AND FOREIGN BRANDS IN VARIOUS REGIONS.

Independent sample test to check for variation in responses for preferred brands (Indian or Foreign) based on region and the significance level to be 0.05. it was found that the significance was observed to be greater than 0.05 thus proving that variation exists in the responses of consumers of various regions for Indian and Foreign brand preference.
75% of the respondents preferred buying Indian brands to foreign brands and this was seen on an overall basis even though, brands mentioned except Nirmal are foreign origin. Their adaptation to indianisationis of great importance. Imported products may be more referred as foreign products. Zonal differentiation exist and North szone has more liking for foreign products compared to South and West. South has more affinity for Indian Brands.
The most popular brands as found from the survey were the well-known brands such as Lux Soap, Maggi Noodles and Nestle Chocolate, which shows that in case of Maggi not just the parent brand, but also the Nestle chocolates are really popular among the consumers. This is not really the case with the other parent brands.
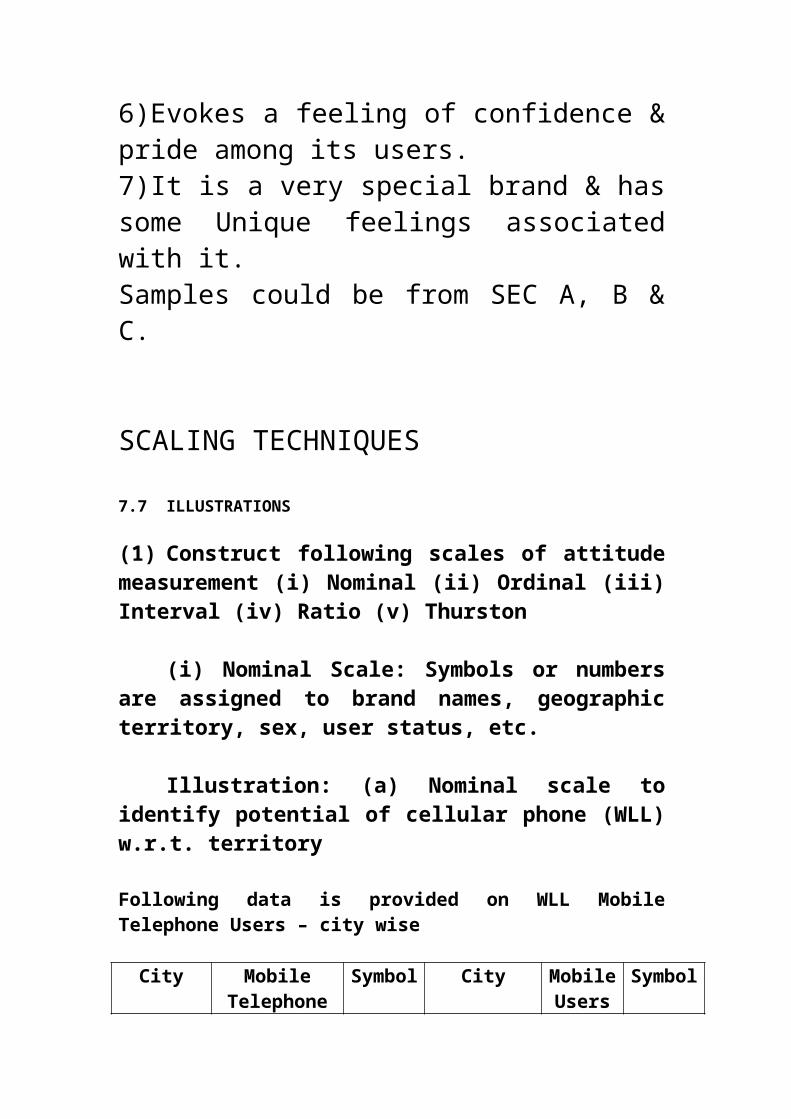
INFLUENCE OF CULTURE AND TRADITION ON BRAND PREFERENCE
The significance is observed to be greater than 0.05 suggesting that the responses of consumers vary between regions.
BRAND ATTRIBUTES IN THE INDIAN CONTEXT
With regards to friends / family influence, it was found that it had a moderate to low influence on respondents. Also the brand name had a high to moderate influence, whereras quality had a high influence on the purchase decision of the respondents.
CONCLUSIONConsumers across the world respond more favourably to brand marketing that shows sensitivity to local preferences. Brand extensions research yield an important insight and it is observed from the survey that there is difference in responses from people of North, South, East and west regarding whether traditions and culture influence the choice of brand extensions. Multiple brand names or brand extensions tend to create confusion among people in the various regions.
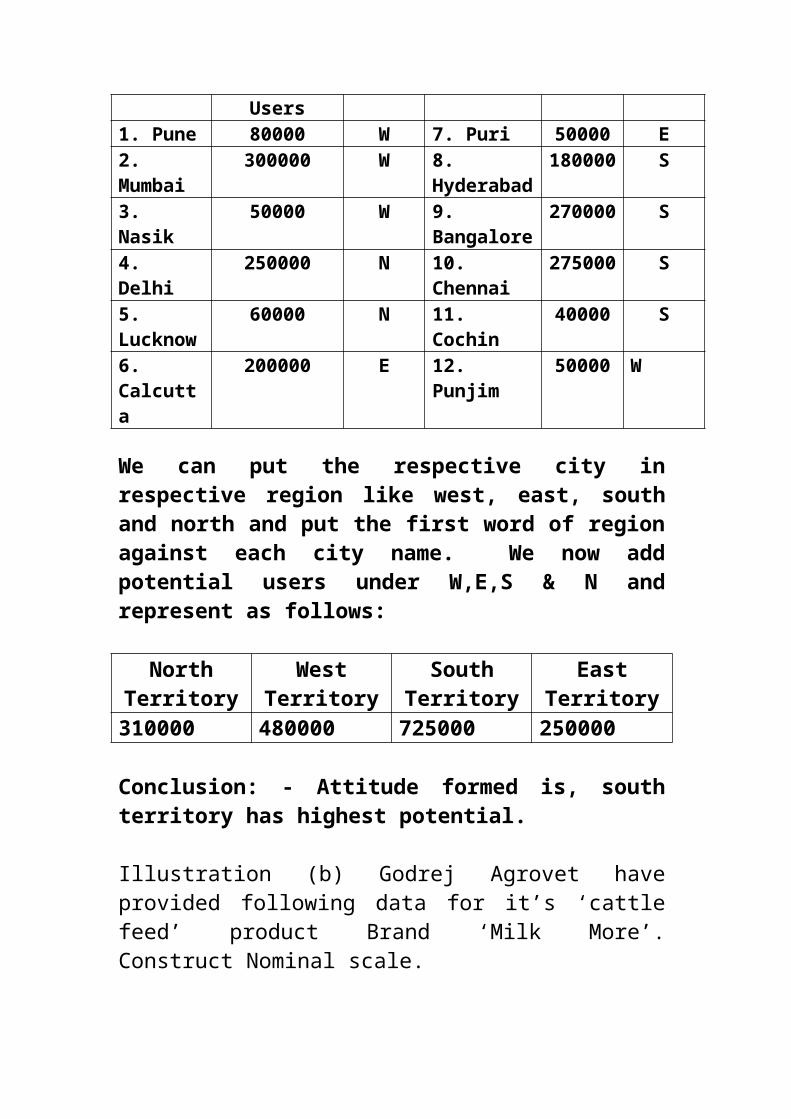
RECOMMENDATIONS
Marketers marketing products in religious and culturally diverse countries need to remember that in each purchase situation the consumer brings a set of cultural experiences and preferences to a particular product, brand or brand extension. Marketers need to adopt different strategies and techniques to understand consumer preferences in culturally diverse markets.
Illustration 2 – Lux Soap and changing consumer behaviour
Research Problem
1) Whether Shah Rukh Khan is the right choice as a male ambassador for Lux.To test this we will have to find out whether people associate Shah Rukh Khan’s qualities with Lux.
2) We shall also analyze whether Lux needs to target the male consumers also. We shall test by finding out whether men really have a say in the purchase decision for soaps.
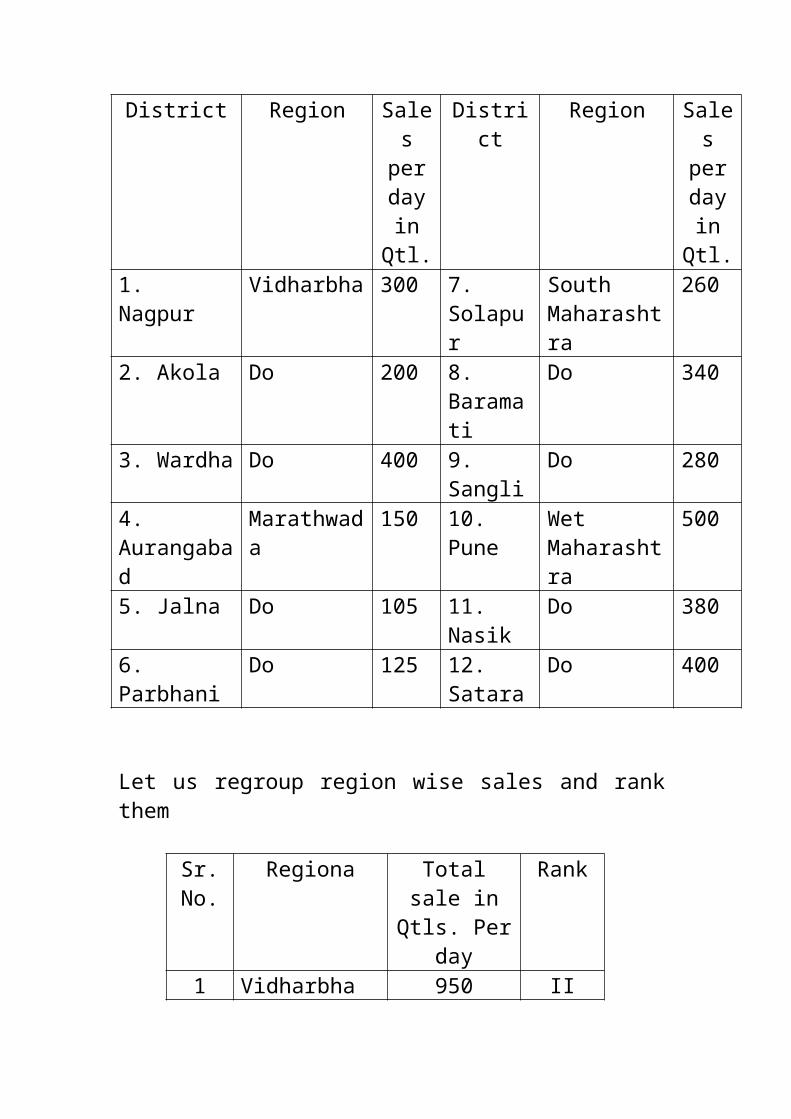
RESEARCH OBJECTIVE
Primary Objective
To find whether there is an image mismatch between the image of Shah Rukh Khan and Lux
Secondary Objective
- To find out whether the new improved positioning of Lux (targeting men also) is required?
- To find out which male celebrity (if any) is the most appropriate for Lux.
RESEARCH HYPOTHESIS
H0 : There is no mismatch between the image of Lux and Shah Rukh Khan.
HA : Tehre is a mismatch between the image of Lux and Shah Rukh Khan.
FINDINGS
Qualities Rank for Lux
Rank for SRK
1 Masculine 5 6 0

2 Feminine 1 2 13 Status 3 5 24 Sophisticated 4 3 15 Cool / Hep 5 4 16 Glamorous 2 1 1
Summary of Findings
Correlation1 Glamour There is not a
significant Difference2 Feminist There is a significant
Difference3 Mascutinity There is a significant
Difference4 Status There is a significant
Difference5 Sophistication There is not a
significant Difference6 Cool / Hap There is a significant
Difference
ANALYSIS
Market Share of Various Soaps:
Out fo the total 21 men interviewed 5 of them use Lux, 3 use Cinthol and 3 use dove. 9 of

them use soaps other than those mentioned here.
From among the 73 women interviewd, 18 of them use Lux i.e. around 25% of them use Lux, 13% use dove and pears and around 17% use Cinthol. A very small share goes to Dettol, i.e. around 2.7% whereas around 25% of the female respondents prefer to use other soaps like Chandrika and other medicated soaps.
Men and Buying Decision:
From, the data collected, we have found that out fo all the men interviewed only 21% either buy the soap themselves or ask someone else to buy the brand they specify. This means that the men do not have any influence on the buying decision for any brand of soap. Thus the strategy of Lux of trying to capture the male segment of the society by targeting them would not work as men do not influence the buying decision.
Reason for buying a Soap:
From what we have collected, we find that just 4% of the respondents buy soap because a celebrity endorses it. Majority of the

respondents buy it for medical reasons (31%) or because of its attractive packaging, shape or scent (24%). Not even one of these respondents claims to be buying their brand of soap due to influence by friends or peers. A good 14% of the respondents buy their brand of soap because they think their brand is value for money. Thus we can infer that the buying decision for a particular brand of soap largely depends upon medical reasons. Thus Lux would be better off trying to capture more market share by using that strategy.
Lux and Male Celebrity?
When the respondents were asked about their opinion on Lux using a male celebrity to endorse it, only 23% said that they liked the idea, 20% said that it does not matter to them whether Lux uses a male or a female celebrity, whereas 57% of them did not like the idea. This shows that the Ad has not been absolutely accepted by the general public. The Ad might have created a stir in the market, but that according to us will not attract many customers and may be not improve the market share for the soap.
Preferred male Star in Lux Ad:

If company plans to continue with a male celebrity in its ads, it should take Saif Ali Khan or Akshay Kumar(AK)as majority of the respondents (31%) liked as compared to SRK. He was followed by Shahid Kapoor with 19% votes. This supports our research as it shows that the public have not been able to connect to the Lux-Shah Rukh Khan partnership and the company would been better off if they would have chosen either Saif Ali Khan ,AK or Shahid Kapoor for the same. Saif,AK and Shahid are up in their careers and are thus very much in the news. The metro sexuality quotient is very high in them and thus very much liked by youth of today.
LUX AD FEATURING SHAH RUKH KHAN:
Nearly 1 out of every 2 people asked did not like the Lux Advertisement featuring Shah Rukh Khan. Also, the number of people who liked the Advertisement is a 19%. Most of the people were of the opinion that the advertisement was not only unaesthetic but also that it could have been shot in a better manner as it was the first time that Lux was experimenting with a male celebrity. The advertisement has created a stir in the minds of the consumers, but has not necessarily helped the company in increasing its market
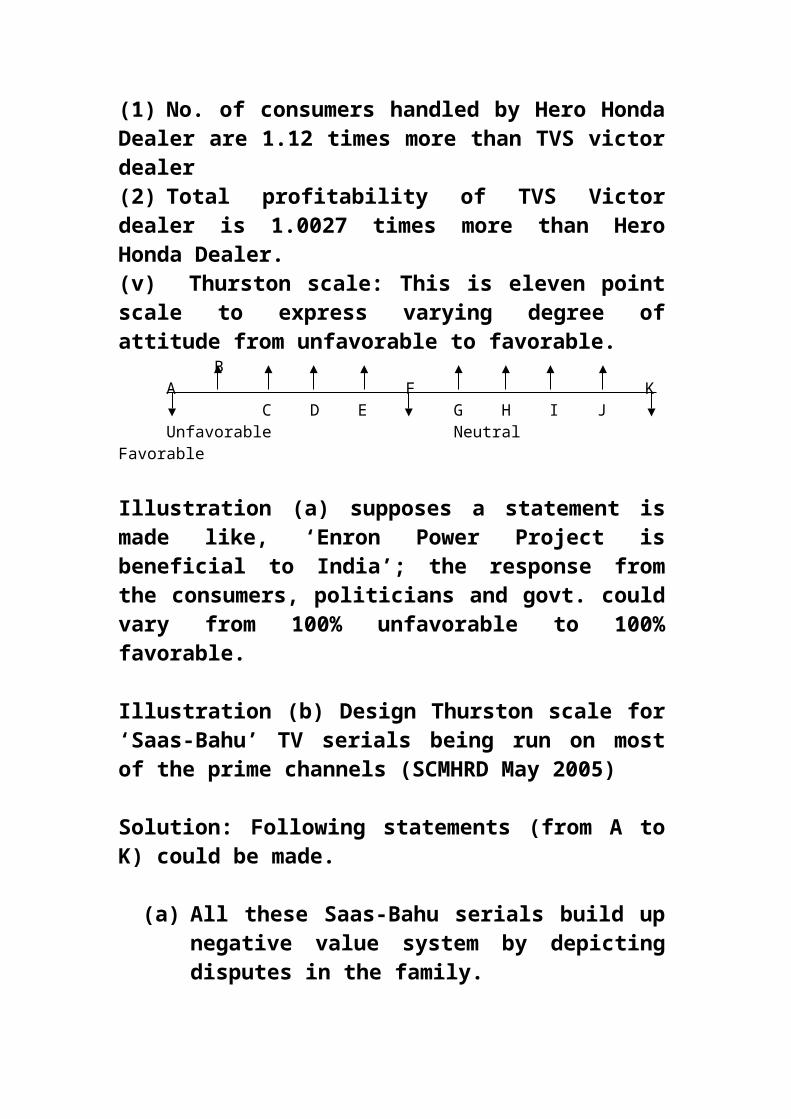
share. The advertisement is in the news, but not for the reasons the company must have wanted it to be in. this has lead to confusion in the minds of the consumers.
TESTING OF HYPOTHESIS
To test our stated hypothesis, we wanted to see if there was a correlation between the qualities associated with Lux and those associated with Shah Rukh Khan. There is significant difference in the rankings given to the qualities for each Shah Rukh Khan and Lux.
1. There is no significant Difference in the Glamour quotient of Shah Rukh Khan and Lux.
2. There is a significance Difference in the Feminine quotient of Shah Rukh Khan and Lux.
3. There is no significance Difference in the Sopyhistication quotenti of Shah Rukh Khan and Lux.
4. There is a significance Difference in the Masculinity quotient of Shah Rukh Khan and Lux.
5. There is a significance Difference in the Status quotient of Shah Rukh Khan and Lux.
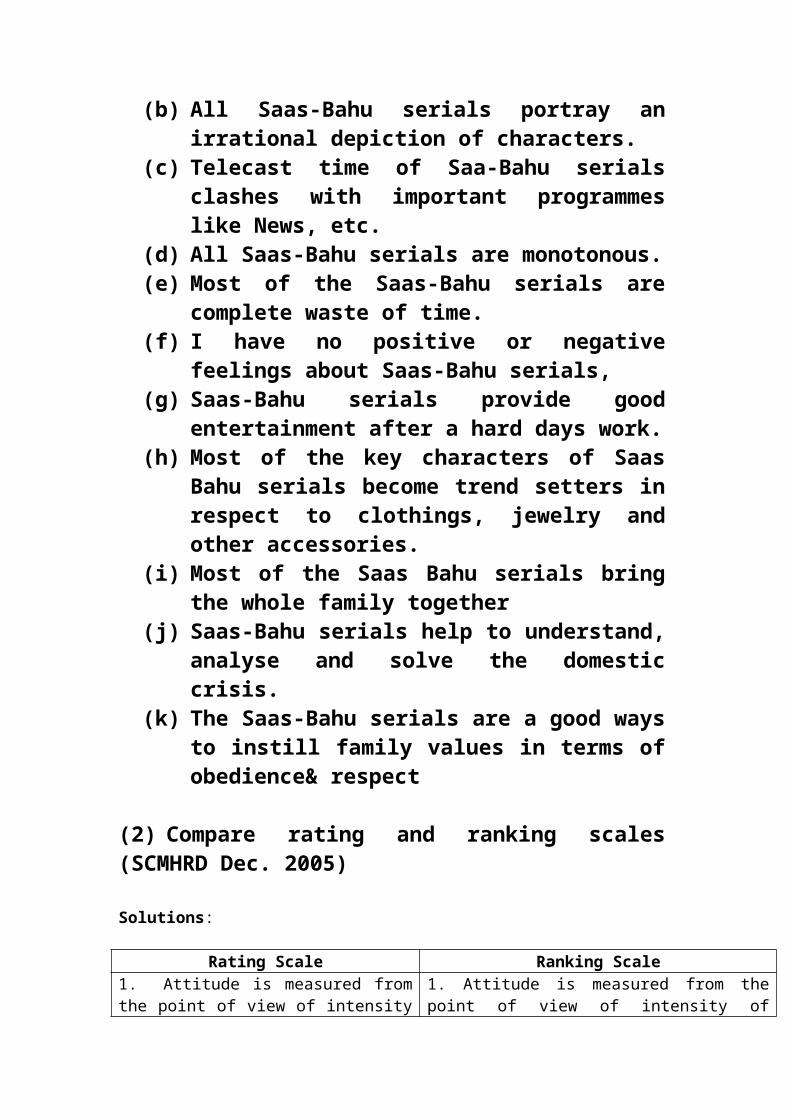
Thus, we find that there is a significant difference in the quotients of 4 of the 6 qualities used to describe Shah Rukh Khan and Lux. Thus we conclude that there is an image mismatch to some extent.
Therefore, we reject the null hypothesis (that there is no mismatch between the image of Lux and Shah Rukh Khan), thus concluding that,
There is an image mismatch between Lux and Shah Rukh Khan.
Analytical marketing research
Data Analysis Methods
Unvaried data analysis Multivariate analysis (Data obtained in (Simultaneous
Analysis of two or More variables Single variable)
Testing of hypothesis Correlation analysis

HYPOTHESIS
4.0 INTRODUCTION
In the chapter on preparation and tabulation of data we discussed the appropriate procedures for collection and tabulation. Once we tabulate the data we need to analyze it, i.e. is we should verify the hypothesis stated in the problem. To do so we need to learn hypothesis-testing methods. If the manager of a shopping mall wants to find out if customer satisfaction is at least 90 percent, we can test the validity of this hypothetical parameter by
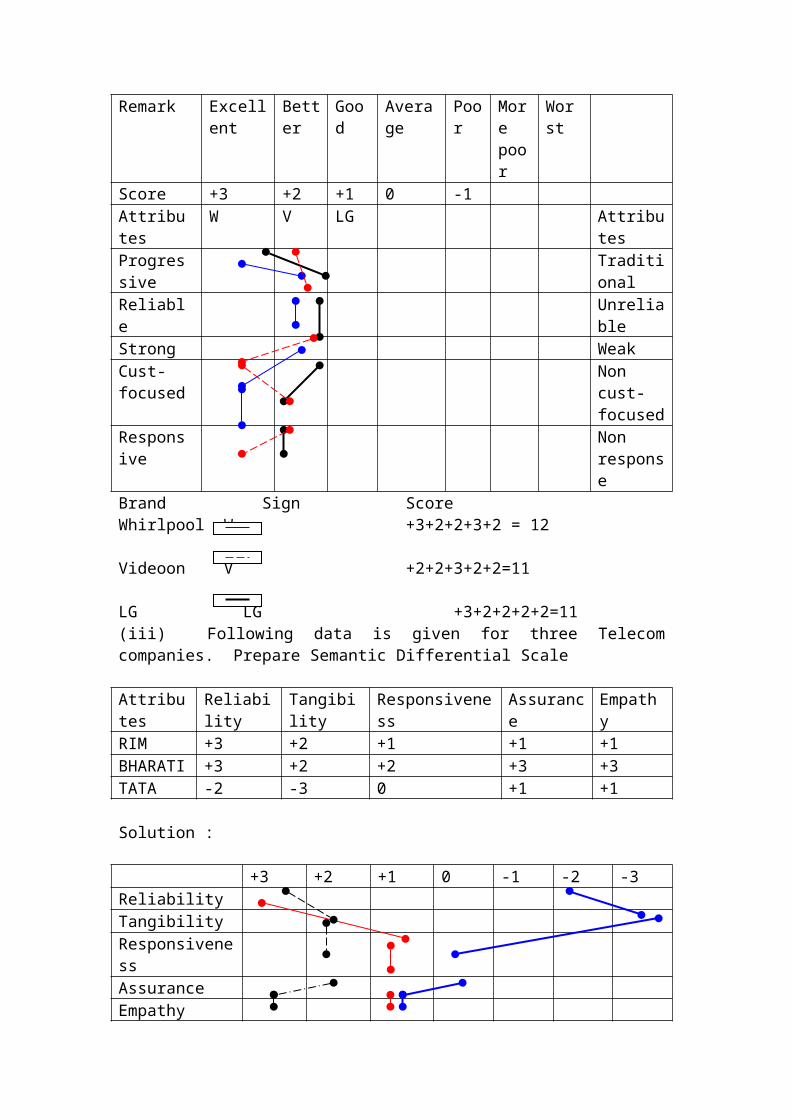
the use of hypothesis testing. Hypotheses test, also known as tests of significance, enable us to decide on the basis of the sample results if the deviation between the observed sample statistic and the hypothetical parameter value (or) statistic is significant (or) might be attributed to chance (or) the fluctuations of sampling.
4.1 METHOD OF HYPOTHESIS TESTING
Definitions of Hypothesis
(i) Hypothesis – It is a statement or assertion about the statistical distributor or parameter of statistical distribution. Alternatively hypothesis is a claim to be tested.
(ii) Null hypothesis – A hypothesis of ‘no difference’ is called null hypothesis
(iii) Alternative Hypothesis – It is a hypothesis to be accepted in case null hypothesis is rejected. In other words, a complementary hypothesis to null hypothesis is called alternative hypothesis.
4.12 Steps In Formulating And Testing

Testing for statistical significance follows a well-defined pattern. Though one may not be able to understand all the terms in these steps at this stage, we are mentioning them here. They will be discussed in subsequent chapters. The steps are as follows:
State the null hypothesis: The null hypothesis&Alternate hypothesis must be stated.
Choose the statistical test: The choice of the statistical test is dependent on the power and efficiency of the test, the nature of the population, the method of drawing the sample and the type of measurement scale.
Select the desired level of significance: The exact level of choice depends on how much Alpha risk one is willing to take in comparison with beta risk (Alpha risk and Beta risk are explained later in this chapter).
Compute the calculated difference value: After the data is collected, the formula for the appropriate significance test should be used to obtain the calculated value.Obtain critical test value: The critical value for the calculated value should be looked up in the appropriate tables. The critical value is
the criterion that defines the region of rejection from the region of acceptance of the null hypothesis.
Make the decision: For most tests, if the calculated value is larger than the critical value, we reject the null hypothesis and it is conclude that the alternate hypothesis is accepted. If the critical value is larger, we conclude we have failed to reject the null.
4.13 Formulating A Hypothesis
2.5% of area
Rejection region
95% of area
Acceptance region
2.5% of area
Rejection region

The first in hypothesis testing is stating the hypothesis itself. A hypothesis to a problem can be basically stated in two ways – Null hypothesis and Alternative Hypothesis.
Null Hypothesis: In tests of hypothesis we always begin with the assumption (or) hypothesis called Null Hypothesis. The Null hypothesis asserts that there is no significant difference between the statistics and the population parameters; and whatever observed difference is there is merely due to population. It is denoted by the symbol H0. The null hypothesis is often the reverse of what the experimenter actually believes; it is put forward to allow the data bring out the contradiction.
In the above example, the null hypothesis is that the average purchase has not changed from Rs. 1500. it is represented by
H0 : μ (mu) = Rs. 1500
Alternative Hypothesis: Alternative hypothesis is complementary to the Null hypothesis and is denoted by the symbol H1.
In the above example, the alternative hypothesis is that there has been a change in
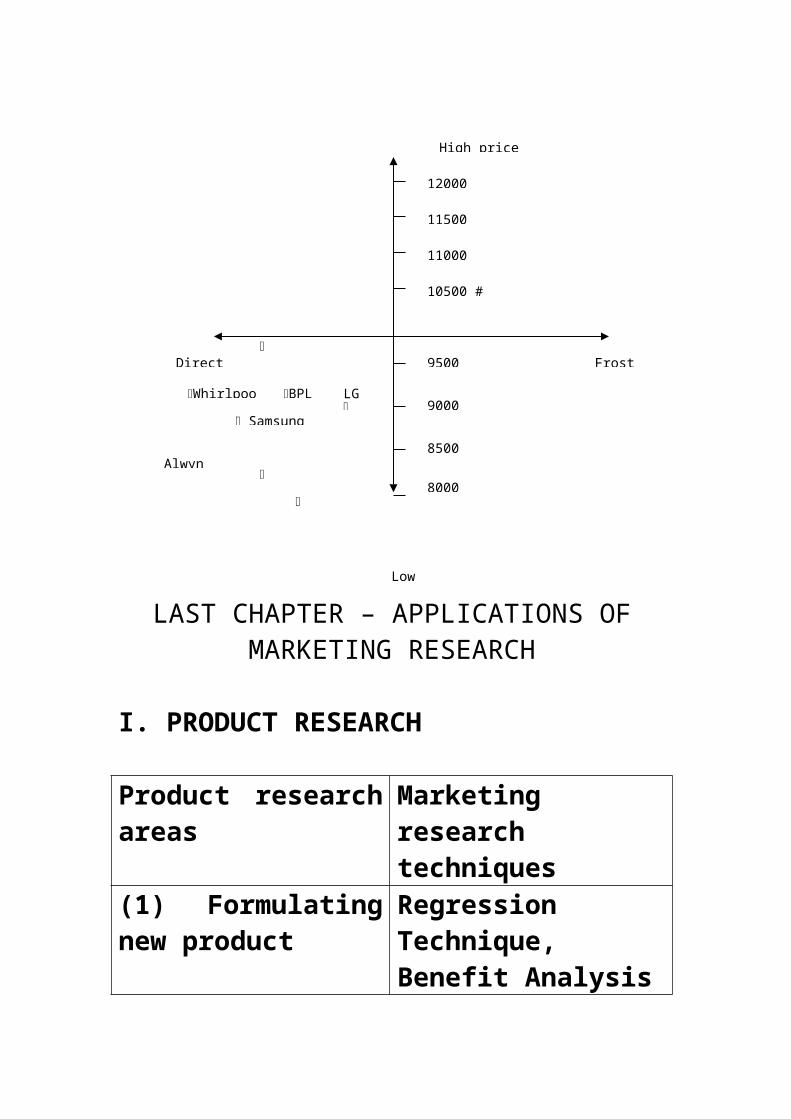
the average purchases per week from Rs. 1500. We can have three different alternative hypotheses about this change. These are indicated below as:
HA : μ (mu) ≠ Rs 1500
HA: μ (mu) > Rs 1500
HA : μ (mu)< Rs 1500
Significance Level The probability level which is too low to justify the acceptance of a null hypothesis
The hypothesis can be tested with a two-tailed test. The regions of rejection for null hypothesis are divided between the two tails. The second hypothesis uses the right tail for rejecting the null hypothesis whereas the third uses the left tail for rejecting it.
A hypothesis is never accepted; it is only rejected or failed to be rejected. This statistical testing is not sufficient proof for disproving a hypothesis. But instead of a clumsily saying that we have failed to reject the hypothesis, we say that we accept the hypothesis. Rejecting a null hypothesis is equivalent to accepting the alternative

hypothesis and rejecting an alternative hypothesis is equivalent to accepting the null hypothesis.
4.14 Errors In Testing
The decision to accept or reject the null hypothesis H0 is made on the basis of the information supplied by the observed sample observations. The conclusion drawn on the basis of a particular sample may not always be true with respect to the population. For instance, in the above mentioned example we have a 5.0% chance of rejecting a true hypothesis in the above mentioned example.
In table 4.14, four cases are presented. When the alternative hypothesis is true, it means that the null hypothesis is false. Using this concept we can deduce that the cases are accepting a true null hypothesis and rejecting a false null hypothesis from the table it is clear that in any testing problem we are liable to two types of errors.
Type-I error: Rejecting a true null hypothesis is called a Type-I error. It is compared to convicting an innocent person. This is considered a serious error and researchers
generally try to minimize its occurrence as much as possible.
The probability of rejecting a true null hypothesis in the above example is 5%. This indicates the probability of a type I error. It is denoted by α.
Here, α = 0.05, or 5%
The region between the acceptance and rejection region is called the critical value. In the above problem the critical values are Rs. 1470 and Rs. 1530 at a given significance level of 5%. Alternatively, for a given significance level we can calculate the critical values above or below which a hypothesis can be rejected or accepted.
Type-II error: Accepting a false null hypothesis is called a Type II error and is compared to acquitting a guilty person. It is difficult to detect such an error. It is denoted by β. And this error depends on (1) the true value of the parameter, (2) the α level we have selected, (3) the nature of the test used (one or two-tailed) to evaluate the hypothesis, (4) the sample standard deviation, and (5) the size of the example.

Let us assume that the mean has actually moved from 1500 to 1470. Our null hypothesis is that the average purchase is 1500. This is false. The probability of not finding this out, which is nothing but assuming that the given hypothesis is correct, is (β) 95%. For a different population mean the value of β will be different. Ideally, a zero β indicates an error free test. This means that ideally 1- β must be equal to 1. The closer this value is to 1, the better is the test. 1- β is considered as the power if a hypothesis test for it is the probability of rejecting a false null hypothesis.
Accept H0 Reject H0
H0 is true
Correct Wrong – Type-I error
HA is true
Wrong – Type-II error
Correct
4.15 Selecting A Test
Three questions should be raised when choosing between various tests.
How many samples does the test involve? One, two or K?
If moor than one sample is involved, are they related or not?

What is the type of data? Nominal, ordinal, interval, or ratio?
Questions like the size of the sample, the quality of the sample size and weighted data can be raised. These questions will be answered in advanced statistics books and researchers should make use of them when required.
Two samples are often used when there are two different products. Two samples, one for each product, are taken and tested to find out whether they belong to the same population.
Table 4.1 lists the various statistical techniques appropriate for different measurement levels and test situations. ANOVA is discussed in the text, but in a separate chapter. Only the most commonly used tests are surveyed in the following sections. Non-parametric tests except chi square tests, call for an involved discussion and so are not discussed here. Refer to advanced spastics books for studying these methods in detail.
4.2 CHI SQUARE (χ2) ANALYSIS
This is the most widely used non-parametric test, particularly for nominal data, but it can also be used for higher scales. It is used for actual values rather than percentages. It is used to find if difference between the
χ2 = ∑
Observed distribution of data among categories and expected distribution is significant.
One sample Test
In this test, we first note the expected (hypothesized) frequencies in each of the categories. Then the values of actual frequencies are compared with the hypothesized frequencies. The value χ2 is a measure that expresses these differences in the form of a mathematical value. The larger this difference, the larger this difference, the larger is the χ2 value. The formula for χ2 is given as
Where
(Oi – Ei)2
Ei
k
i=1
Oi = Observed number of cases categorized in the ith categoryEi = expected number of cases in the ith categoryK= The number of categories χ2 is unique for each degree of freedom. The degrees of freedom involved in a category are equal to K-1.
Care should be taken in using the chi square method in the following cases:
When d.f. =1,each expected frequency should be at least 5 in size.
If d.f.>1, then the χ2 test should not be used if more than 20 percent of the expected frequencies are smaller than 5, or when any expected frequency is less than 1.
Let us take an example. A survey was conducted in Delhi to measure the intent of purchasing a second car. A sample of 200 people was taken. We would like to analyze the data based on the profession of the respondents. Is the intent dependent on the profession or not?

We assume that these categories have no effect on the income. Now we proceed with the procedure recommended earlier.
Hypothesis : H0: O1 – Ei. The proportion of the population that intends to buy independent of their professional categories as given.
Alternative hypothesis is
HA:O1<> Ei
Statistical test: The responses are divided into nominal categories and so we should use Chi square analysis
Calculated value:
Using the Table 4.2 we have calculated the value chi-square to be χ2= 12.68
Degrees of freedom are 4-1=3Critical value: From the tables we get a critical value of 7.82 for a significance of 5%.
Decision: here the calculated value is greater than the critical value and so we reject the null hypothesis conclude that the categories do have an effect on the intent to purchase a new car.

Table 4.2: The Data and Calculations for Chi-Square with Single Sample Problem
Profession Intendent to buy Oi
Number interviewed
Percent (No.
Interviewed/ 200)
Expected Frequencies (Percent x
Self employed (like doctors, lawyers)
14 90 45
Front Line workers
17 40 20
Administrative 14 40 20Academic 15 30 15Total 60 200 100
Two Sample Test
The basic methodology is same as in the one sample test but the formula involved is as follows:
Here the data is categorized and so is placed in a two
χ2 = ∑ ∑ i j
Eij
(Oij - Eij)

Dimensional matrix. The subscript ij refers to ijth cell.
The degree of freedom are given as (r-1)(c-1).
4.3 ONE AND TWO TAILED HYPOTHESIS
There could be two types of situations, based on which hypothesis is classified as one sided or one tailed and tow sided or two tailed.
When alternate hypothesis HA is defined as only more than or less than hypothesized mean (μ) i.e. HA> μ i.e. HA > μ or HA < μ is called one tailed hypothesis. On the other side when alternate hypothesis is stated as not equal to hypothesized mean (μ) i.e. HA ≠ μ, it means HA could be less than μ or more than μ. Hence this is called as two sided or two tailed hypothesis.
4.4 LEVEL OF SIGNIFICANCE AND CRITICAL VALUE OF Z
Level of ignorance
(α)
Critical value of ZOne tailed test (zα)
Two tailed test (zα)
10% 1.28 1.645% 1.64 1.96
1% 2.33 2.58
4.5 ILLUSTRATIONS
Case (i) Two tailed test
Problem : Nicrome Metal works, a leading name in Packaging Industry, has designed automatic milk packing mache ‘Fill-Pack’ to fill plastic pouch with 1000 ml of milk with a standard deviation of 10ml. A sample of 100 pouches was examined and then the average volume / quantity of milk found was 98oml. Can we say with 95% confidence that the machine is working property?
Null Hypothesis = H0 = 1000ml
Alternate Hypothesis = HA ≠ 1000ml
X - μTest Statistics = t/z = -----------
S / √
Data : x = 980ml., μ = H0=1000ml, n = sample size = 100, standard deviation = s =10ml.
980 -1000 - 20Hence t/z = ---------------- = --------- = 20
10/ 100 1
n
For 95% confidence level, corresponding level of significance is 5%, and the value of z for two tailed test is 1.96. As such calculated value of z i.e. 20 is more than actual value of z i.e. 1.96. Hence null hypothesis is rejected. Conclusion – Packing machine is not working properly.
Case (ii): One tailed test
A sample of 1000 spherical roller bearing is found to have average weight of 50 grams. Sample population standard deviation is 5 gm. One bearing, randomly selected was found of 60 gm. What is the guarantee that balance bearing will be of correct weight?
Null Hypothesis = H0=μ – 50 gmAlternate Hypothesis = H1: μ< 50 gm
x - μTest statistics = t/z = ---------
S / √n
Data: x=60 gm, μ = 50gm, S=5 gm, n = sample size =1000
60-50 10 10 t/z = ----------- = --------- = ----------- = 63.29

5√1000 5 / 31.62 0.158
Assume level of significance 1% hence value of z for one tailed test is 2.33. Since calculated value of Z (63.29) is much more than actual value of z (2.33) null hypothesis is rejected.
Conclusion: There is no guarantee that remaining bearings will be of correct weight of 50 gm.
Illustration – Lux Soap and changing consumer behaviour
Research Problem
3) Whether Shah Rukh Khan is the right choice as a male ambassador for Lux.To test this we will have to find out whether people associate Shah Rukh Khan’s qualities with Lux.
4) We shall also analyze whether Lux needs to target the male consumers also. We shall test by finding out whether men really have a say in the purchase decision for soaps.
RESEARCH OBJECTIVE
Primary Objective
To find whether there is an image mismatch between the image of Shah Rukh Khan and Lux
Secondary Objective
- To find out whether the new improved positioning of Lux (targeting men also) is required?
- To find out which male celebrity (if any) is the most appropriate for Lux.
RESEARCH HYPOTHESIS
H0 : There is no mismatch between the image of Lux and Shah Rukh Khan.
HA : Tehre is a mismatch between the image of Lux and Shah Rukh Khan.
FINDINGS
Rank for Lux
Rank for SRK

1 Masculine 6 02 Feminine 2 13 Status 5 24 Sophisticated 3 15 Cool 4 16 Glamorous 1 1
Summary of Findings
Correlation1 Glamour There is not a
significant Difference2 Feminist There is a significant
Difference3 Mascutinity There is a significant
Difference4 Status There is a significant
Difference5 Sophistication There is not a
significant Difference6 Cool / Hap There is a significant
Difference
ANALYSIS
Market Share of Various Soaps:
Out of the total 21 men interviewed 5 of them use Lux, 3 use Cinthol and 3 use dove. 9 of
them use soaps other than those mentioned here.
From among the 73 women interviewed, 18 of them use Lux i.e. around 25% of them use Lux, 13% use dove and pears and around 17% use Cinthol. A very small share goes to Dettol, i.e. around 2.7% whereas around 25% of the female respondents prefer to use other soaps like Chandrika and other medicated soaps.
Men and Buying Decision:
From, the data collected, it was found that out of all the men interviewed only 21% either buy the soap themselves or ask someone else to buy the brand they specify. This means that the men do not have any influence on the buying decision for any brand of soap. Thus the strategy of Lux of trying to capture the male segment of the society by targeting them would not work as men do not influence the buying decision.
Reason for buying Soap:
From the data collected, it was found that just 4% of the respondents buy soap because a celebrity endorses it. Majority of the
respondents buy it for medical reasons (31%) or because of its attractive packaging, shape or scent (24%). Not even one of these respondents claims to be buying their brand of soap due to influence by friends or peers. A good 14% of the respondents buy their brand of soap because they think their brand is value for money. Thus it can be concluded that the buying decision for a particular brand of soap largely depends upon medical reasons. Thus Lux would be better off trying to capture more market share by using that strategy.
Lux and Male Celebrity?
When the respondents were asked about their opinion on Lux using a male celebrity to endorse it, only 23% said that they liked the idea, 20% said that it does not matter to them whether Lux uses a male or a female celebrity, whereas 57% of them did not like the idea. This shows that the ad has not been absolutely accepted by the general public. The ad might have created a wave in the market, but that according to research will not attract many customers and may be not improve the market share for the soap.
Preferred male Star in Lux Ad:

If the company plans to continue with a male celebrity in its ads, it should take Akshay Kumar or Saif Ali Khan as majority of the respondents (41%) though they are more of a macho sexual man as compared to SRK. They were followed by Shahid Kapoor with 29% votes.SRK could fetch only 10% of the votes. This supports the research as it shows that the public have not been able to connect to the Lux-Shah Rukh Khan partnership and the company would been better off if they would have chosen either A.K or Saif Ali Khan or Shahid Kapoor for the same. Both AK, Saif and Shahid are on the up in their careers and are thus very much in the news. The macho sexuality quotient is very high in both of them and thus very much liked by youth of today.
LUX AD FEATURING SHAH RUKH KHAN:
Nearly 1 out of every 2 people asked did not like the Lux Advertisement featuring Shah Rukh Khan. Also, the number of people who liked the Advertisement is a 19%. Most of the people were of the opinion that the advertisement was not only unaesthetic but also that it could have been shot in a better manner as it was the first time that Lux was experimenting with a male celebrity. The

advertisement has created a wave in the minds of the consumers, but has not necessarily helped the company in increasing its market share. The advertisement is in the news, but not for the reasons the company must have wanted it to be in. This has lead to confusion in the minds of the consumers.
TESTING OF HYPOTHESIS
To test stated hypothesis, it was necessary to see if there was a correlation between the qualities associated with Lux and those associated with Shah Rukh Khan. There is significant difference in the rankings given to the qualities for each Shah Rukh Khan and Lux.
6. There is no significant Difference in the Glamour quotient of Shah Rukh Khan and Lux.
7. There is a significance Difference in the Feminine quotient of Shah Rukh Khan and Lux.
8. There is no significance Difference in the Sopyhistication quotenti of Shah Rukh Khan and Lux.
9. There is a significance Difference in the Masculinity quotient of Shah Rukh Khan and Lux.

10. There is a significance Difference in the Status quotient of Shah Rukh Khan and Lux.
Thus, we find that there is a significant difference in the quotients of 4 of the 6 qualities used to describe Shah Rukh Khan and Lux. Thus we conclude that there is an image mismatch to some extent.
Therefore, we reject the null hypothesis (that there is no mismatch between the image of Lux and Shah Rukh Khan), thus concluding that,
There is an image mismatch between Lux and Shah Rukh Khan.
Correlation analysis
Correlation Is statistical technique used for measuring relationship or interdependence of two or more variables. E.g. marketing manager might be wanting to know
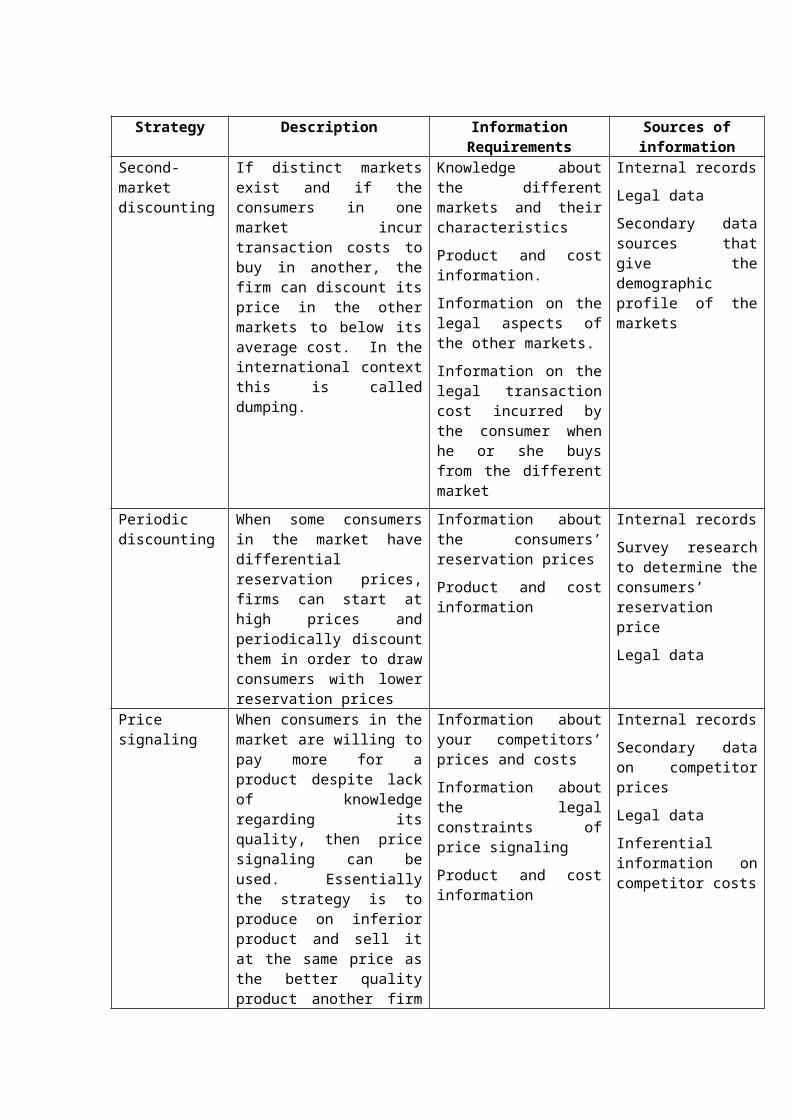
relationship of sales with say ad budget, no. of salesmen etc.
Whenever a correlation analysis is to be attempted it is advisable to draw a graph which represent following type relationship
y positive relationship y negative relationship \ / \ / \ / \ / \ x x
y non linear relationship y no relationship
. . .. .
. . .. . . .
. . . . . . .
x x
Illustration
Let us study relationship between say, ad budget and sales. Independent variable x represents ad expences in Rs lacks where as dependent variable y represents sales in Rs crores

X : 2 5 4 6 9Y: 3 4 4 8 9
Worksheet for the calculation of correlation
Series X Series Y XY X2 Y2
25469
34489
620164881
425163681
916166481
26 28 171 162 186
The formula for calculating coefficient of correlation r is as follows:
Y = n ∑ xy – (∑ x) (∑ y)
√ (n ∑ x2 – (∑ x) 2 (n ∑ y2 – (∑ y) 2)

Where r is coefficient of correlation and n is no. of observations ( here n = 5 )After substituting values n, x, y, xy, X2 and Y2
r = 5* 171 – ( 26 *28)
√ ( ( 5 * 162) – ( 26)2) ( ( 5* 186) – ( 28)2)= .908
If coefficient of correlation i.e. r having value .9 and more indicates that dependent variable y is having very high degree of positive relation with independent variable x. If value r is less than .5, it indicates there is no relationship. The value of r more than .5 but less than .9 indicates weak relationship.
Rank Correlation
Sometimes marketing manager is interested in examining the extent of association between two ranks. For that purpose following method is used:
Illustration
Nokia cellular appointed 10 salesmen for Indian markets to sell handsets to institutional buyers. It
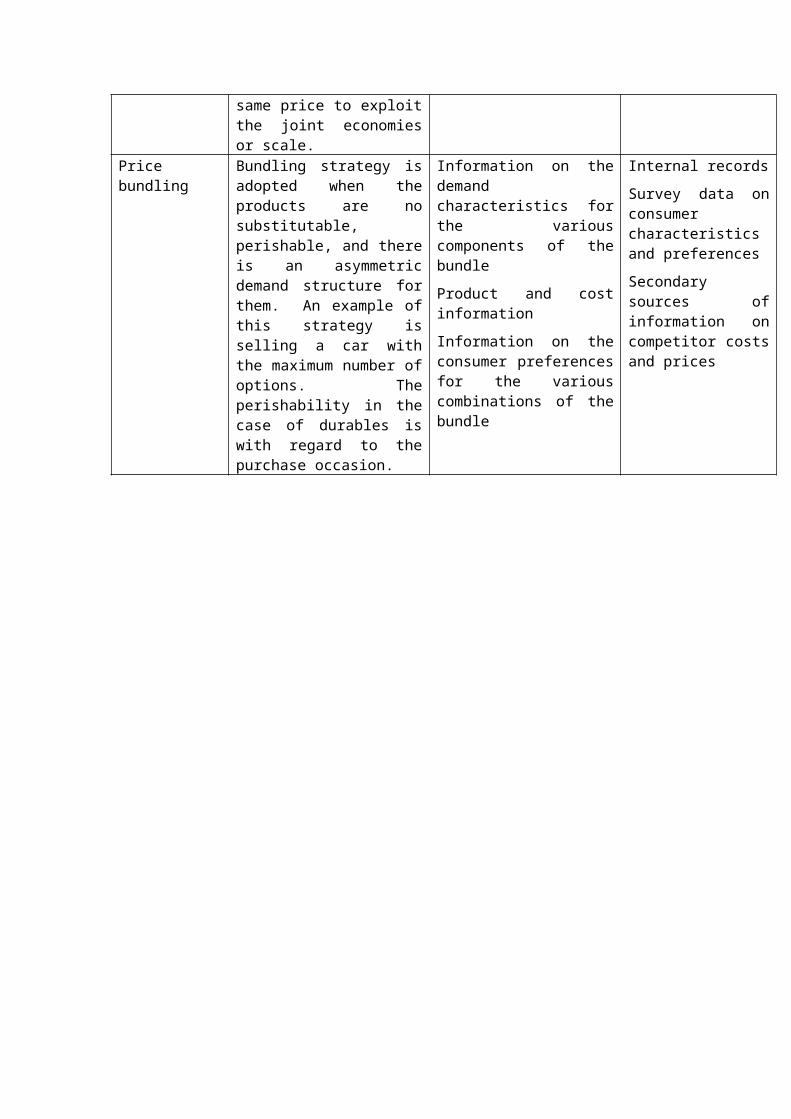
provided 1 months training to these salesmen. It observed the performance of the salesmen during the training and ranked them. After training was over, all the salesmen were field sales. Their performance in field sales was observed for 6 months, based on which they were ranked. Now Nokia wants to know is there any relationship between training and ranked issued during field sales.
Rank of salesmen in respect of training and field sales performance.
Salesmen
Ranks obtained in training X
Ranks on the basis of field sales performanceY
Differenced=( X-Y)
Difference square d2
1 4 5 -1 1
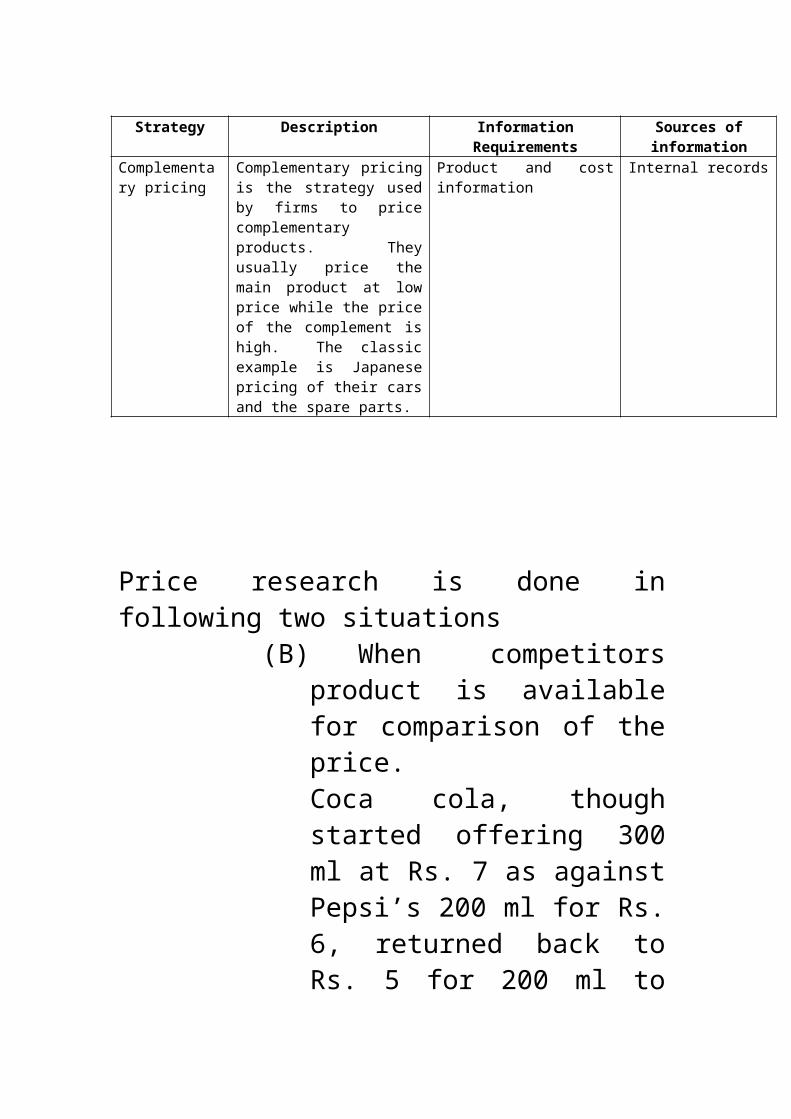
2345678910
6139710285
8317692104
-2-222110-21
444411041
∑ d2 = 24
The mathematical formula to compute coefficient of rank correlation is as follows
6 *∑d2 Rs = 1 - N (N2 – 1)
Where rs means coefficient of rank correlation, n means no. of observations ( here no. of salesmen), d means difference between two ranks.Substituting values, (6) (24)rs = 1 - 10 ((10)2 -1)
= 1 - .145= .855
The value of rs equal to more than .8 indicates high degree of correlation between independent variable x and dependent variable y. here rs is .855 means there is high degree of correlation between ranks issued to salesmen during training and field sales performance.

CHAPTER 5SETTING OF AN IMPLEMENTATION OF MR
PROJECTS
Following steps are involved:
Step 1: Defining research problem and identifying research objectives
Management problem and marketing research study problem could be different as explained in following table:
Management problem MR study area1. Allocate ad-budget among various media.
Estimate awareness generated by each meida.
2. Change the marketing programme
Design a test marketing situation such that the effect of new programme can be estimated.
3. Increase the sales of a product
Measure the current image of the company as well as the of the product and project sales with image.
Exploratory Research------Research Purpose Research Questions
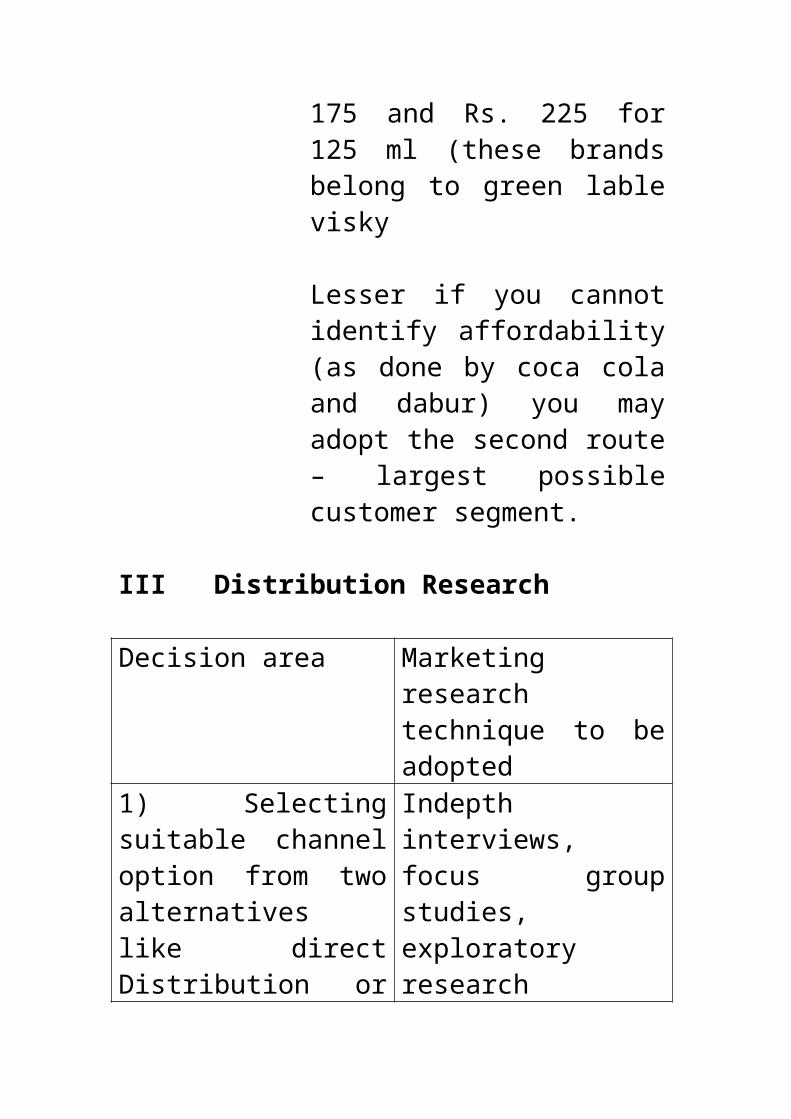
1) What new products to be developed?
Which alternative products are possible?
2) What product appeal will be effective in advertising
What benefits do people seek from the product?
3) How can our service be improved?
What is the nature of customer- dissatisfaction?
Descriptive ResearchResearch Purpose Research Questions1) How should a new product to be distributed?
Where do people now buy similar products?
2) What should be target segment?
What kind of people now buy similar products& who is likely to buy our brand?
3)How should our product be changed?
What is our current image? What image consumer are looking forward to?
Experimental Research-----Research Purpose Research Questions1)Will an increase in sevice staff be profitable?
What is the relationship between size of service staff & revenue?

2) What advertising program will translate into marketing objectives?
Run all ads& watchWhich ads generated maximum sales?
3) Should a new budget or no-frills class of airfare be introduced?
Will the no-frills airfare generate sufficient new passengers to offset the loss of revenue from existing passengers who switch from economy class?
Step 2: develop research plan
It comprise of following sub steps
(a) Research Design : Exploratory / Descriptive / Experimental
(b) Data Source : Sources for secondary data as well as for primary data to be mentioned
(c) Research Approach : Whether research will be done through observation, focus group interviews, individual sample interviews or through experiments
(d) Sampling plan: It comprise of sample universe, sample frame, sample size, sampling method, sampling procedure and sample unit. Sample unit could be
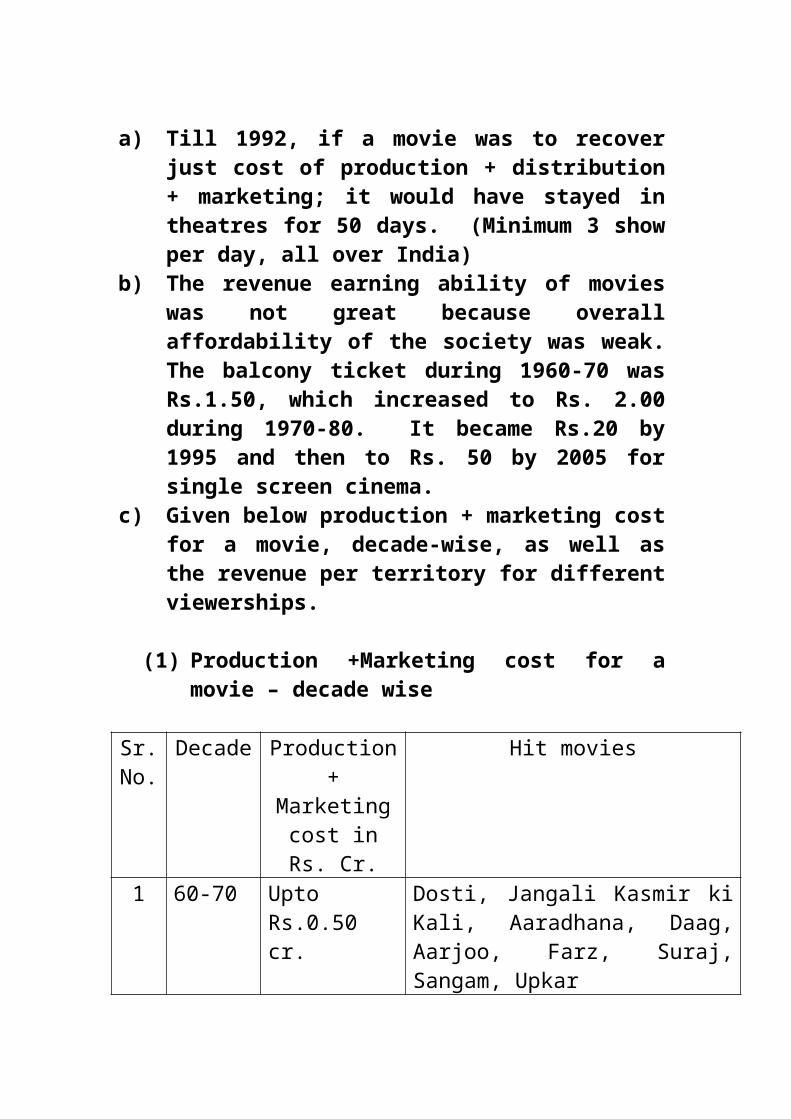
household or industrial. Household sample means end users whereas industrial sample means members of B2B market i.e. wholesalers, manufacturers, retailers, etc.
(e) Contact method : Mail, telephone, personal interviews,
Step 3: Collecting the market data
For collection of market data, a temporary marketing organization is formed, which comprise of project leader, MR Officer and the investigators.
Investigator go sample to sample and administer the questionnaire and collect the data. MR Officer supervises the investigators, as well help project leader for data analysis. Project leader is the captain in charge. He formulates the project in form of title, objectives, sampling, data analysis and preparation of report.
Step 4: Data analysis and interpretation
For data analysis statistical techniques like regression analysis, correlation analysis, univariate and multivariate analysis as well as hypothesis testing is used. 21st century
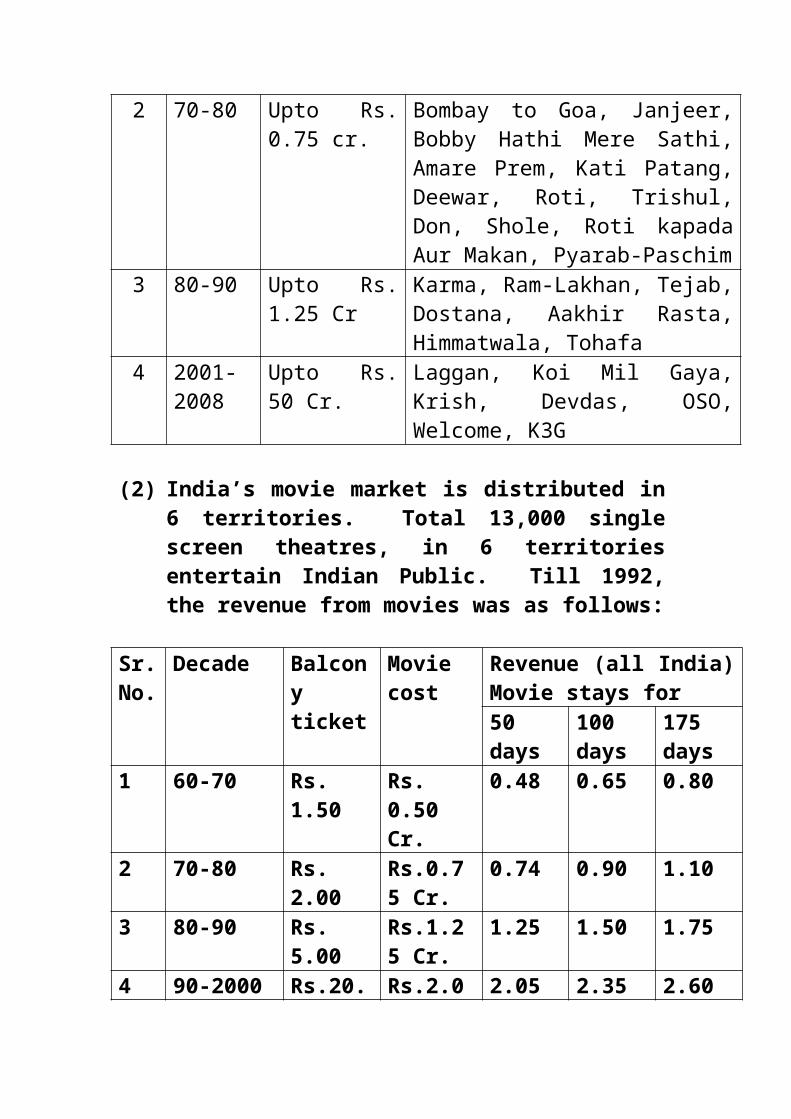
researchers use a SPSS which directly gives analysis of all above mentioned information.
Step 5:
(A) Presentation of market data The data can be presented in form of (i) Tables (ii) Graphs(iii) Pie charts(iv) Bar charts(v) Pitto graphs(vi) Cartos graphs
(B) Preparation of MR reportIt comprise of following chapters:1.Executive Summary2.Objectives 3.Company profile and product profile 4.Research methodology5.Limitations6.Data analysis, interpretation and
findings7.Conclusions8.Recommendations9. References – (a) questionnaire (b) List of samples
1.10.4. Research Project 1 :Title : To research the consumer behaviour in PARLEselection of Parle Biscuits.Parle Biscuits :
Compaly Profile :
Parle Products has been India’s largest manufacturer of biscuits and confectionery, for almost 80 years. Makers of the world’s largest selling biscuit,

Parle-G, and a host of other very popular brands, the Parle name symbilizes quality,
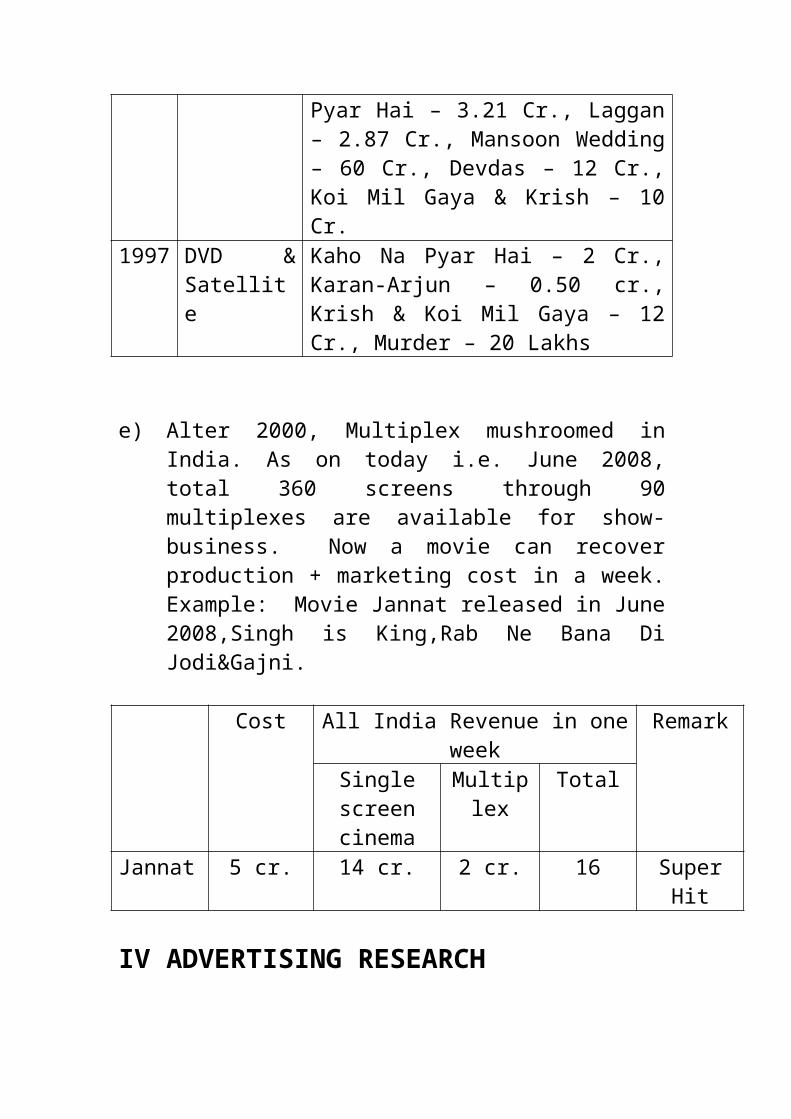
nutrition and great taste. With a reach spanning even the remotest villages of India, the company has definitely come a very long way since its inception.
Many of the Parle products - biscuits or confectioneries, are market leaders in their category. With a 40% share of the total biscuit market and a 15% share of the total confectionary market in India, Parle has grown to become a multi-million dollar company.
In 1929 a small company by the name of Parle products emerged in British dominated India. The intent was to spread joy and cheer to children and adults alike, all over the country with its sweets and candies. The company knew that it wouldn’t be an easy task, but they decided to take the brave step. A small factory was set up in the suburbs of Mumbai, to manufacture sweets and toffees. A decade later it was upgraded to manufacture biscuits as well. Since then, the Parle name has grown in all directions, won international fame and has been sweetening people’s lives all over India and abroad. Apart from the factories in Mumbai and Bangalore Parle also has factories in Bahadurgarh in Harayana and Neemrana in Rajasthan, which are the largest biscuit and confectionery plants in the country.
Product Profile :
Name of Features of the products Pack Sizesthe Biscuits available
Parle g Filled with the goodness of milk and wheat, Parle 19 G, 44 G,G is not just a treat for the taste buds, but a 44 G, 66 G,source of strength for both body and mind. 93.5 G,Tear over a packet of Parle G to experience 231.5 G,what has nourished Generations of Indians since 346.5 G,last sixty five years, making it truly 400 G, 462“Hindustan Ki Taakat.” G, 576.5 G
Krackjack The original sweet and salty biscuit is one of the 75 G, 120 G,most loved biscuits in the country 240 G
Krackjack It is a delicious combination of crispyness of 90 GCrispy Krackjack and sweetness of cream biscuit withCreams salty taste gets laced with a sweet & sour lime
flavour in the cream sandwiched betweenKrackjack biscuits.
Monaco A light crispy biscuit sprinkled with salt, Monaco 75 G, 120 G,adds a namkeen twist to life’s ordinary moments. 240 G
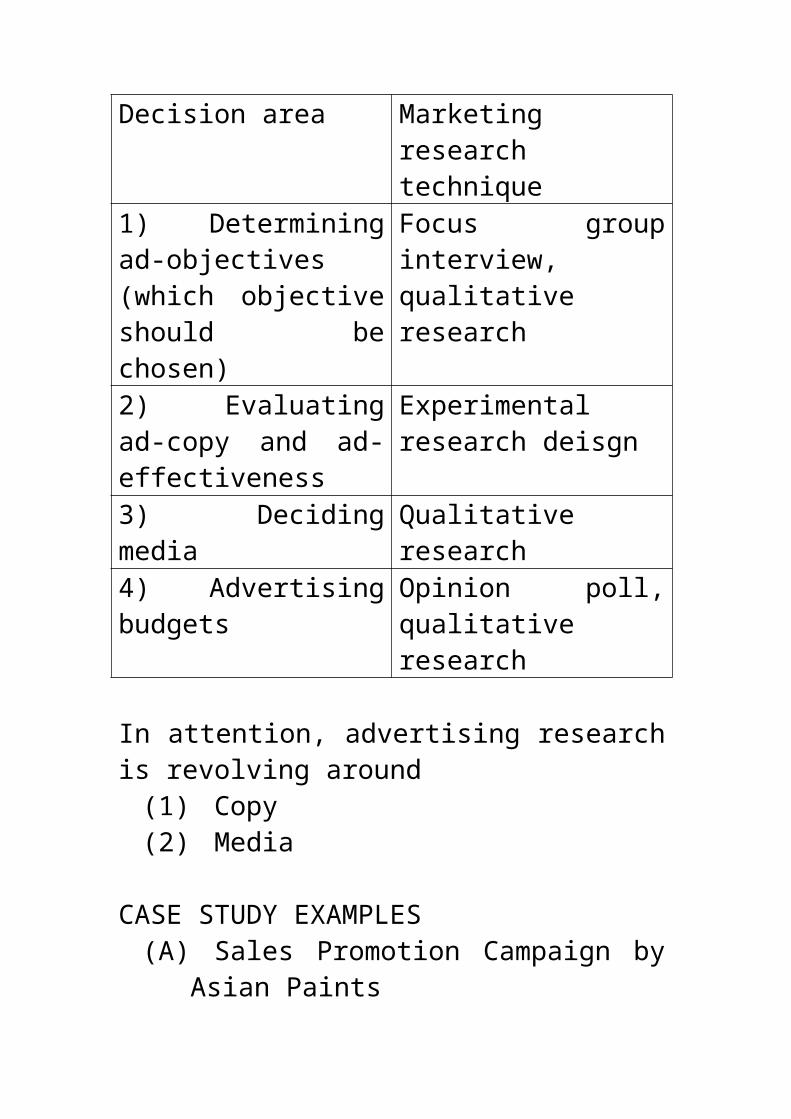
Foot Note : G mean grams

Name of Features of the products Pack Sizesthe Biscuits available
Orange Tickle your senses with Parle Orange Cream - 90 G,The tangy orange cream between two 180 Gscrumptions biscuits makes for a real treat.
Hide n seek This is a choco biscuit that flirts with your taste 25 G, 50 G,buds which seek out the chocolate chips that 100 G,aren’t really hidden. 200 G
Hide n seek A cookie with a reputation for romance. Indulge 65 G,milano in the sinful taste of Milano and everything 100 G,
that follows it. 135 G
Digestive This biscuit is more enjoyable and much healthier, 25 G, 50 G,Marie with lower fat and calories than other digestive 100 G,
biscuits, it helps us to stay Active-Lite all day. 200 GYahi Marie, Sahi Marie!
Marie Parle Marie is lighter, crispier and tastier. And 88 G, 176 G,biscuit immerse yourself in an engaging conversation 347 G, 400 G,
and an even more engaging taste. (For East)
Milk shakti The Shakti of milk fortified with the goodness of 75 G, 150 Ghoney, a zabardast combo.
Parle 20-20 parle presents 20-20 Cashew and butter cookies 75 G, 110 G,cookies where every cookie is baked to deliver the 225 G
perfect taste and aroma. It promises acombination of crunch and scrumptious delicacy.
Nimkin A crispy cracker that adds a namkeen zing to 75 G, 150 Gthe usual biscuits.
Consumer Profile :
110 respondents in pune geographic were contacted.
Segment targeted :
F Children
F Old age people
F Housewives
F Student
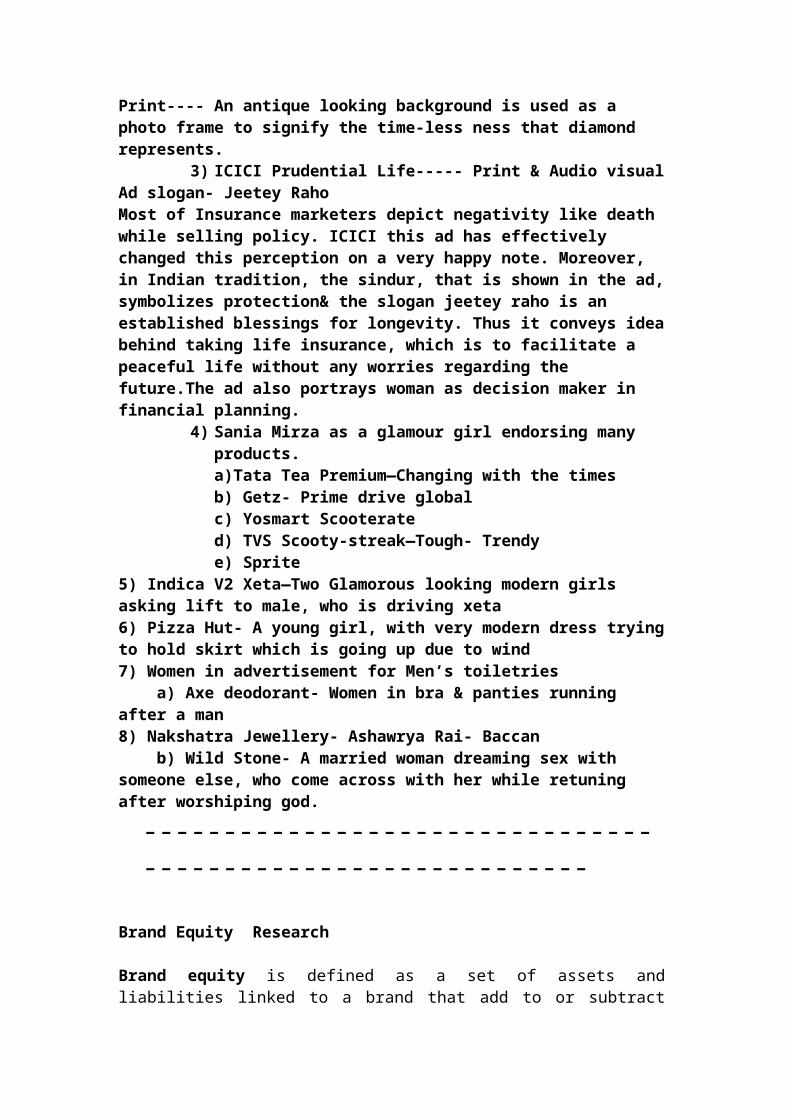
Research Objectives :
1. To find out the penetration of Parle biscuits in Pune.
2. To find out the consumer buying behaviour towards buying biscuits in Pune.
3. To find out the quantity size and buying frequency of the consumers.
4. To find out the effect of promotional campaigns done by Parle biscuits among the consumers.
5. To find out the consumers’ feedback i.e. improvements required or suggestions given.
Questionnaire :
Questionnaire for Household Survey :
Dear Sir/Madam,
The management students are conducting this survey as a part of their project in the field of research. The purpose of this activity is to measure the penetration of Parle Biscuit in Pune.
1. Which brand comes 1st in your mind when you think of biscuits?
(a) Parle ____________ (b) Britannia __________
(c) ITC (Sun feast) __________ (d) Others __________
2. Which biscuit of parle brand do you consume?
(a) Parle G __________ (b) Hide n seek __________
(c) Krackjack __________ (d) Monaco __________
(e) Others (Please specify) __________
3. Which factor influences you to purchase a biscuit packet?
(a) Price __________ (b) Taste __________
(c) Advertisement __________ (d) Others (Please specify) _______
4. While purchasing a biscuit what quantity size do you usually go for?
(a) small __________ (b) Medium __________
(c) Large __________
5. How frequently do you buy biscuits?
(a) Daily __________ (b) Weekly __________
(c) Fortnight __________ (d) Monthly _______

6. Do offers or schemes affect your buying decision?
(a) Yes / No and Why? _________________________________________
7. Who consumes Parle biscuit in your home?
(a) Children __________ (b) You __________(c) Old aged people __________ (d) Others (please specify) _______
8. If your preferred biscuit is not available, you go for (a) 1st Choice __________ (b) 2nd choice __________
9. If you get extra benefits and features in some other brand then will you switch over? Yes / No and why ________________________________
10. Have you seen any promotional campaign of Parle biscuit?
Yes __________ No __________If yes then which one :(a) M.S. Dhoni & grandmother (b) Hrutik Roshan & girlfriend(c) Amir Khan & Dharsil (d) A boy flying with aeroplane
11. Would you suggest any changes in Parle biscuit in the following fields?
a. Availability of products in different places __________ b. Style of packaging __________ c. More schemes to be associated __________ d. Price __________ e. Taste __________ f. Others (please specify) __________
Something about you
Name : ____________________________________________
Age Group : _______________
Address : ________________________________________________
Contact Number : ___________________
Occupation : _______________________
No. of members in your family : _________________________________

Table No. 3/1
Year Sales in Rs. Sales in Unit (Tonnes) Market Share %
2007 1554.74 401114.79 23.78
2006 1405.31 306300.86 21.18
2005 1004.57 219469.86 17.53
Graphical representation of sales in Rs., sales in units and market share inpercentage for the year 2005 to 2007
Sales in Rs. Crores
1,400.00 - 1,405.31
1,200.00 -
cror
es
1,000.00 - 1,004.57
i n
800.00 -
sale
s 750.64
Mea
n
600.00 -
400.00 -
200.00 -
0.00 -2005 2006 2007
year
From the above graph we can see that there is a continuous rise in sales of Parle biscuits @ 30-40% from the year 2005-2007. In 2005-2006 sales rose by 33.83% whereas in 2006-2007 sales rose by 39.9%. Thus the company is constantly growing in terms of sales in Rs. Crores.

Mea
n sa
les
in u
nits
500,000.00 -
400,000.00 -
300,000.00 -
200,000.00 -
100,000.00 -
0.00 -
Sales in Units Tonnes
401,114.79
306,300.86
219,469.86
2005 2006 2007 year
From the above graph we can say that sales in units have shown a trend in growth of 30-40%. In the year 2005-2006 sales in units have rose by 39.56% whereas in the year 2006-2007 sales in units have rose by 30.95%. Therefore the sales have risen by 86831 and 94831.95 tonnes in 2006 and 2007 respectively but there is a percentage drop in sales (in uits) by 8.61%.
PARLE

Mea
n m
arke
t sh
are
Market Share
25.00 -
23.78
20.00 - 21.18
17.53
15.00 -
10.00 -
5.00 -
0.00 -2005 2006 2007 year
From the above graph we can say that there is a rise in market share of parle biscuits @ 17-24% for the years 2005-2007. In the year 2005-2006 market share rose by 3.65% whereas in the year 206-2007 the market share rose by 2.6%. Therefore we can conclude that there has been a rise in market share but the percentage rise has fallen by 1.05%.
PARLE

Analysis and Intepretation of Data
1. Which brand comes 1st in your mind when you think of biscuits?
(a) Parle ____________ (b) Britannia __________
(c) ITC (Sun feast) __________ (d) Others __________
From the below graph we can see that Parle is the brand that most of the consumer consume. 48.6 customers responded that they consume parle biscuits, 38.32% of customer responded that they consume Britannia and 13.06% of customer responded that they prefer ITC (Sunfeast). From the percentages we can see that parle has got a good amount of share in the market and customers are willing to consume its biscuits.
Brand of Biscuits you consume
AC
4138.32%
52 Britannia48.6%Parle
B
1413.08%
ITC
Brand
A - Britannia
B - ITC
C - Parle

PARLE
Analysis and Intepretation of Data
2. Which biscuit of parle brand do you consume?
(a) Parle G __________ (b) Hide n seek __________
(c) Krackjack __________ (d) Monaco __________
(e) Others (Please specify) __________
From the chart we can see that Parle-G as well as hide n seek is consumed by 46% of the consumers whereas krackjack accounts for 8% of the total consumption.
Brand of Parle Biscuits
C4
8.0%Krackjack
A
B23
46.0%Parle G
2346.0%
Hide N Seek
Parle
A - Parle G
B - Hide N Seek
C - Krack Jack
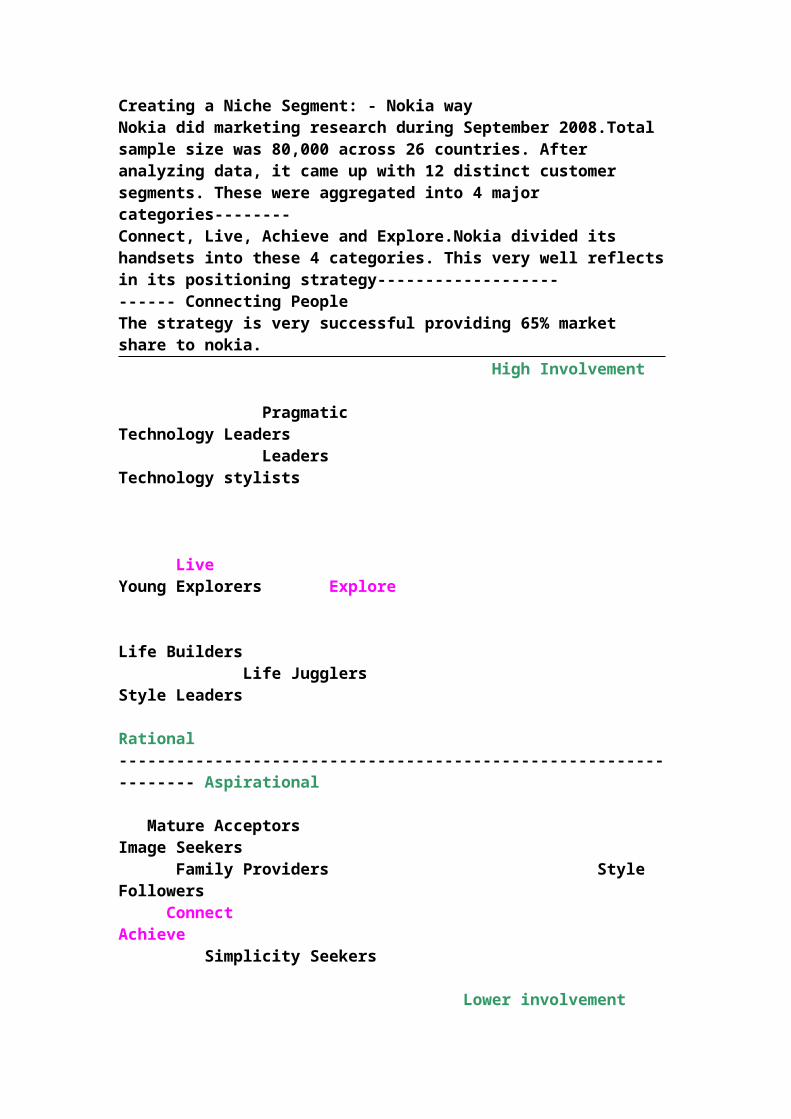
PARLE
3. Which factor influences you to purchase a biscuit packet?
(a) Price __________ (b) Taste __________
(c) Advertisement __________ (d) Others (Please specify) _______
From the chart below, we can conclude that 72.9% of the consumers are influenced by the taste of biscuits whereas 24.3% o the consumers are influenced by the price factor and the rest 2.8% of the consumers are influenced by the advertisement. Thus, we can see that taste is the most important factor which influences the customer’s buying behaviour and parle has an upper hand on this factor.
Factor Influence you to Buy
28.0%
3Advt.
A B
C24.3%
26Price72.9%
78Taste
Influence
A - Advertisement
B - Price
C - Taste

PARLE

4. While purchasing a biscuit what quantity size do you usually go for?
(a) small __________ (b) Medium __________
(c) Large __________
In the following graph we can conclude that 59.81% of the consumers go for medium pack whereas 28.79% of the users go for small pack and the rest 11.21% of the consumers prefer large or family packs. Mostly the consumers of parle are kids and bachelors so they mostly prefer medium and small packs whereas families mostly prefer the large pack.
Quantity You usually go for....
A11.21%Large
C 12
28.97%Small
31
B
59.81%Medium
64
Quantity
A -Large
B - Medium
C - Small
PARLE
5. How frequently do you buy biscuits?
(a) Daily __________ (b) Weekly __________
(c) Fortnight __________ (d) Monthly _______
How Frequently you buy
A

17.76% Daily 19
D62.62% Weekly
67
Frequency
A - Daily
B - Fortnight
C - Monthly
D - Weekly
B15.89%
Fortnight 17
C3
74...

From the chart we can see that 62% of the consumers buy biscuits weekly. The rest 15%, 17% and 3% prefer to buy biscuits fortnight, daily and monthly. As the consumers of parle are mostly kids and bachelors and they mainly buy medium packets so they mostly go for weekly purchase.

PARLE

6. Do offers or schemes affect your buying decision?
(a) Yes / No and Why? _________________________________________
From the chart below we can conclude that 58.88% of the consumers will not change their buying decision even if offers and schemes are offered to them whereas 41.12% of the consumers will change their buying decisiion if they are offered schemes and offers related to quantity, price, taste, quality etc.
Schemes OR Offers Affect you buying decision?
B A41.12% 58.88%
Yes No44 63
Offers
A - No
B - Yes
PARLE
7. Who consumes Parle biscuit in your home?
(a) Children __________ (b) You __________
(c) Old aged people __________ (d) Others (please specify) _______
From the pie-chart given below we can conclude that 45.79% of the consumers consume Parle biscuits themselves who are between the age group of 25-40 years whereas 34.58% of the consumers purchase parle biscuits for their family and the rest 19.63% purchase Parle biscuits for their children.
Who consumes Parle at home
A19.63%Children
C 21
45.79%Myself
49
B
34.58%Family
37
Consumers
A - Children
B - Family
C - Myself

PARLE
8. If your preferred biscuit is not available, you go for
(a) 1st Choice __________
(b) 2nd choice __________
From the chart we found that 48.6% of the consumers first alternative would be parle biscuits whereas 38.32% of the consumers would go or Britannia biscuits and the rest 13.08% of the consumers would prefer ITC (Sunfeast) as their second alternative. Therefore we can say that Parle biscuits has left a remarkable impression on consumer’s mind as the second choice entered by most of the consumers is also Parle biscuits.
Preferred Biscuits
AC
38.32%Britannia
48.6% 41Parle
52
B
13.08%ITC
14
Preference
A - Britannia
B - ITC
C - Parle

PARLE

9. If you get extra benefits and features in some other brand then will you switch over? Yes / No and why ________________________________
From the chart below we can conclude that 64.49% of the consumers will not switch over to other brands even if extra benefits are offered to them whereas 35.51% o the consumers will switch over to other brands if they get extra benefits.
If you get extra benefits, will you switch to other brands
B A35.51% 64.49%
Yes No36 69
Switch
A - No
B - Yes
PARLE

10. Have you seen any promotional campaign of Parle biscuit?
Yes __________ No __________
If yes then which one : ________________________________________
The pie-chart shows that 65.42% of the consumers are not aware of promotional campaigns done by Parle biscuits whereas 34.58% of the consumes are aware of Parle biscuit’s promotional campaigns especially the advertisement of “G mane Genius.” Therefore we can say that consumers are mostly not influenced by promotional campaigns of Parle biscuits instead they are more inclined towards the taste and pricing.
Have you seen any Promotional Campaign of Parle
B A34.58% 65.42%
Yes No37 70
Campaigns
A - No
B - Yes
Out of 34.58% samples, remembered following ad-campaigns.
(a) M.S. Dhoni & grandmother : 60%
(b) Hrutik Roshan & girlfriend : 10%
PARLE(c) Amir Khan & Dharsil : 25%
(d) A boy flying with aeroplane : 5%
11. Would you suggest any changes in Parle biscuit in the following fields?
a. Availability of products in different places __________ b. Style of packaging __________ c. More schemes to be associated __________ d. Price __________ e. Taste __________ f. Others (please specify) __________
From the chart we can conclude that 33.64% of the consumers suggest an improvement in taste, 22.43% suggest an improvement in ofers and schemes, 17.76% suggest an improvement in price, 20.56% suggest an improvement in packaging, 5.61% suggest an improvement in distribution channels of Parle biscuits. Therefore Parle biscuits should take care of all the above suggestions in order to become the best out of better.
Suggestions for Parle Biscuits
5.61%Availa-bility
6
E AB
33.64%20.56%Taste
Packaging3622
C
D 17.76%Price
22.43% 19Schemes
24
Suggestions
A - Availability C - Price E - Taste
B - Packaging D - Schemes

Conclusions :
u Britannia is the closet competitor to Parle.
u Parle-G is the largest selling product of Parle Biscuits.
u Consumers always choose a biscuits to consume on the basis of its taste.
u Most of the consumers choose to buy a small pack of product for itsconsumptions.
u Consumers prefer to buy biscuits on their weekly shopping.
u Most of the schemes don’t affect consumers buying behaviour.
u Most of the consumers of Parle are Bachelors and Children.
Recommendations :
u “Parle G” and “Hide n Seek” are the only products of Parle that are on highsales, so company should launch new products as well.
u Company has good brand image in the minds of people, so it should makesure that the customer stays loyal towards it.
u The company should find out better promotional strategies. It should havea brand ambassador that will strengthen the brand. The ads should bebroadcasted for a long time.
u Company should periodically visit the consumers for gathering feedback fromits consumers to further enhance the products.
u The company should give more stress on packaging of Parle biscuits.
u Britannia is the closest competitor of Parle biscuits, so Parle biscuits shouldcome out with newer and better strategies to increase its sales. Parle-G isgoing to face together competition with Britannia’s Tiger and Good daybiscuits.
u The company should try to improve its distribution channel by making it more efficient and cost effective. Britannia is the closet competitor of Parle, so proper strategies should be implemented to stay ahead of the race.
Research Problem: To study the image of LG CTV
Research Objectives
1) To study how the customer perceives the LG range of CTV.
2) To identify the factors those influence the buyers to buy and non-buyers not to buy LG CTV.
3) To examine the effectiveness of various promotional activities.
Methodology
Sources of data
The data is basically primary in nature.
Methods
Our communication approach was basically structured questioning, that is, personal interview with the aid of printed questionnaires.
Sample size
Convenience sampling: No sampling technique was employed in arriving at a sample size. It is a convenience sampling suiting our use.
Consumer sample – 30 Dealer sample size – 6
Limitations
1) This being a convenience sample, the analysis may not be a true picture of the target population.
2) Language problem, especially with the household respondents of cosmopolitan areas.
3) Prejudice of some of the respondents.For instance, one of the respondents had a bitter experience with respect to LG VCR. For this reason, he is totally against the brand name LG and could not consider even a single factor in favour of the LG CTV.
4) Low sample size of the dealers – that is, we could not find more than 6 who were able to answer our questions in the areas surveyed.
ANALYSIS OF SIMPLE TABULATIONS
Customer’s questionnaire
1) Are you a user of LG CTV?
Sample Size 30
Frequency Percentage
User / Non-User
No33%
Yes67%
0
5
10
15
20
25
Attr
ibut
es
Aes
thet
ics
Pric
e
Bra
nd
Rel
iabi
lity
Per
form
ance
Adv
ertis
emen
t
Afte
r sal
esse
rvic
e
IIIIII
Yes 20 66.7No 10 33.3
67% of the respondents are users of LG CTV and 33% are non-user
2) What influences your decision to purchase a Color TV?
Sample Size 30
Ranks I II IIIAttributesAesthetics 5 1 3Price 5 8 6Brand 5 8 5Reliability 2 3 7Performance 12 6 5Advertisement 0 2 1After sales service 1 2 3
0
2
4
6
8
10
12
14
16
Aesthe
tics
Price
Brand
Reliabil
ity
Perform
ance
Advertis
emen
t
After s
ales s
ervice
User Non-User
The respondents ranked performance as the most important attribute influencing their purchasing decision. The next important attributes are price brand and aesthetics.
3) What influenced your decision to purchase / not to purchase LG CTV?
It is found that the non-users have not purchased LG CTV because of dissatisfaction with its price and performance.
Surprisingly, price and performance are also found to be the factors that have influenced the purchase of LG CTV.
4) Which brand do you think is the toughest competitor to LG CTV?
Sample Size 30
Frequency PercentSAMSUNG 11 36.7VIDEOCON 1 3.3HAIER 5 16.7PHILIPS 2 6.7AKAI 1 3.3AIWA 4 13.3SONY 3 10ONIDA 3 10CAN’T SAY 3 10

34%
3%15%6%3%
12%
9%
9%9%
SAMSUNGVIDEOCONHAIERPHILIPSAKAIAIWASONYONIDACAN’T SAY
Successful87%
Unsuccessful13%
From the table it can be clearly inferred that Samsung is the toughest competitor to LG according to the perception of the consumers.
5) Do you think LG CTV is a successful / unsuccessful brand?
Sample Size 30Frequency Percentage
Successful 26 86.7Unsuccessful 4 13.3
87% of the respondents feel that LG CTV is a successful brand. Rest 13% find it to be unsuccessful.
6) Why do you think LG has been a successful / unsuccessful brand?
Sample Size 30
Successful Frequency Percentage
Reasons for Success
23%
38%39%
Range of Products
Range of Prices
Promotional Activities
Reasons for Non-Success
25%
50%
25%
Range of Products
Range of Prices
Promotional Activities
Range of Products 10 38.5Range of Prices 6 23.1Promotional Activities 10 38.4
As far as the reasons for LG CTV being a successful brand is concerned, 39% of the consumers feel that the success is due to the range of products offered by LG, 38% feel its due to the range of prices and the rest 23% feel that its due to the promotional activities carried out by LG.
Sample Size 30
Successful Frequency PercentageRange of Products 1 25Range of Prices 2 50Promotional Activities 1 25
Among the people who find LG an unsuccessful brand, 50% feel its due to the range of prices offered by LG, rest 25% each feel its due to the range of prices and promotional activities respectively.
7) Based on the price range what impr3eession do you carry of LG CTV?

Impression based on price
Economical
73%
Costly27%
Size
15%
10%
55%
15% 5%14”20”21”25”29”
Sample Size 30
Frequency PercentageEconomical 22 73.3Costly 8 26.7
73% find LG to be an economical brand and the rest 27% find it costly. Thus the overall impression of LG in CTV segment is that of an economical one.
8) Give the size of the LG CTV you own (User’s Questions)
Sample Size : 20
Frequency Percentage14” 3 1520” 2 1021” 11 5525” 3 1529” 1 5
We found that the most preferred size by 55% respondents was 21”, followed by 14” and 25”, with 15% each.
9) Which of the following additional attributes do you perceive as most important in your CTV?
Attributes
57%25%
18%Net-Savy technologyLocking SystemsPicture-In-Picture
Advertisement
31%
66%
3%
ImpressiveSatisfactoryUnsatisfactory
Advertisement
31%
66%
3%
ImpressiveSatisfactoryUnsatisfactory
Sample Size 28
Frequency PercentageNet-Savvy technology 16 57.1Locking Systems 7 25Picture-In-Picture 5 17.9
57.1% of the people prefer to have Net Savvy Technology as an additional attribute in their CTVs. Following this are locking systems with 25% and Picture in Picture with 17.9%.
10) What do you think of the advertisement of LG CTV?
Sample Size 29
Frequency PercentageImpressive 9 31Satisfactory 19 65.5Unsatisfactory 1 3.4
Ad Like
37%
22%
41% Model / CelebrityPresentationSlogan
65.5% of the respondents find the advertisements satisfactory while 31% and 3% find it impressive and unsatisfactory respectively.
11) You like / dislike the advertisement because of
Sample Size 30
Like Frequency PercentageModel / Celebrity 10 35.7Presentation 6 21.4Slogan 11 39.3
Sample Size 30
Dislike Frequency PercentageModel / Celebrity 0 0Presentation 3 100Slogan 0 0
Out of the sample size of 30, only 3 people disliked the ad and all of them disliked it because of the presentation (no ad was specifically mentioned).
12) Which do you think is the most striking media to advertise LG CTV?

Schemes Affect
63%
37%YesNo
Media
13%
87%
NewspaperTelevision
Sample Size 30
Frequency PercentageNewspaper 4 13.3Television 26 86.7
87% of the respondents asserted that television is the most striking media to advertise LG CTV while the rest 13% felt that the newspaper is the best media.
13) Do the various schemes / promotional activities affect you purchase plans?
Sample Size 30
Frequency PercentageYes 19 63.3No 11 36.7
63% of the respondents felt that the various schemes offered by the company would affect their purchase decision, while the rest 37% did not feel so.
Re-Purchase
63%
37%YesNo
Punch-Line
83%
17%
AgreeDisagree
14) If you go for re-purchase of TV will you prefer LG CTV?
Sample Size 30
Frequency PercentageYes 19 63.3No 11 36.7
15) Do you agree / disagree with the Punch line of LG?
Sample Size 30
Frequency PercentageAgree 25 83.3Disagree 5 16.7

Age
17%
33%23%
27%18-2526-3031-40>40
Occupation
7%
49%27%
17%StudentServiceBusinessOthers
83% of the respondents agree with what the punch line of LG has to say and the rest 17% disagree with the statement that LG is the best.
Demographics
Age
Frequency Age Group Percentage5 18-25 16.7010 26-30 33.307 31-40 23.308 >40 26.70
Occupation
Occupation Frequency PercentageStudent 2 6.70Service 15 50Business 8 26.70Others 5 16.70

Sex
93%
7%
MaleFemale
Annual Income
41%
33%
17%3%3% 3% <1,00,000
1,00,000 – 1,50,000
1,50,000 – 2,00,000
2,00,000 – 2,50,000
2,50,000 – 3,00,000
>3,00,000
Sex
Sex Age Group PercentageMale 28 93.30Female 2 6.70
Annual Income
Annual Income Frequency Percentage<1,00,000 12 401,00,000 – 1,50,000 10 33.301,50,000 – 2,00,000 5 16.702,00,000 – 2,50,000 1 3.302,50,000 – 3,00,000 1 3.30>3,00,000 1 3.30
Dealer’s Questionnaire

0
20
40
60
80
100
120
Rank I Rank II Rank III
After sales service
Performance
Reliability
Brand
Price
Aesthetics
Size
17%
17%66%
14”20”21”
1) What influences your customer’s decision to purchase a LG CTV?
Ranks I II IIIAesthetics … … 1(16.7%)Price 2(33.3%) 4(66.7%) …Brand 2(33.3%) 2(33.3%) 1(16.7%)Reliability … … …Performance 2(33.3%) … 3(50%)After sales service … … 1(16.7%)
Accordingly to the dealers, the top three attributes that influence their customer’s purchase decision are: performance, brand name and price.
2) Which size of BPL CTV do the customers purchase the most?
Sample Size : 6
Size Frequency Percentage14” 1 16.720” 1 16.721” 4 66.725” 0 029” 0 0

Competitor
66%17%
17%SamsungVideoconOnida
21” is the most preferred size of the LG CTV. It is accepted by 66% of the dealers.
3) Which do you think is the toughest competitor to LG?
Sample Size : 6
Competitors Frequency PercentageSamsung 4 66.7Videocon 1 16.7Onida 1 16.7
Samsung is found to be toughest competitor to LG CTV. This is a true picture of the national scenario. Next come Videocon and Onida as felt by 17% of the Dealers.
4) Where do you rank the following CTVs in terms of
Sample Size 6
LG Samsung Onida Videocon Sansui PhilipsBrand Name 1 2 1 2Aesthetics 3 2 1Range of Products 4 1 1Range of Prices 2 1 1 2Performance 2 2 1 1DPA 4 1 1CPA 1 2 1 2
0
1
2
3
4
5
6
Bra
nd N
ame
Aes
thet
ics
Ran
ge o
f Pro
duct
s
Ran
ge o
f Pric
es
Per
form
ance
DP
A
CP
A
Afte
r Sal
es S
ervi
ce
PhilipsSansuiVideoconOnidaSamsungLG
Successful / Unsuccessful
83%
17%
SuccessfulUnsuccessful
After Sales Service 1 3 2
The best in terms of
Brand Name : LG, SamsungAesthetics : OnidaRange of Products : LGRange of Prices : LG, PhilipsPerformance : LG, OnidaDealers Promotional Activities : OnidaConsumers Promotional Activities : Onida, SansuiAfter Sales Service : Onida
5) Do you think LG CTV is a successful / unsuccessful Brand?
Sample Size 6Frequency Percentage
Successful 5 83.3Unsuccessful 1 16.7

Reason for Success
20%
80%Range of Products
Range of prices
83% of the dealers accepted that it is a successful brand and 17% felt it is an unsuccessful brand.
6) Why do you think LG CTV has been a successful / unsuccessful Brand?
Sample Size 5Successful Frequency PercentageRange of Products 1 20Range of prices 4 80Promotional Activities 0 0Distribution Network 0 0
80% of the dealers felt it is successful because of its range of prices. 20% felt it is because of the range of products. Promotional activities and distribution network have nothing to do with the success of LG CTV.
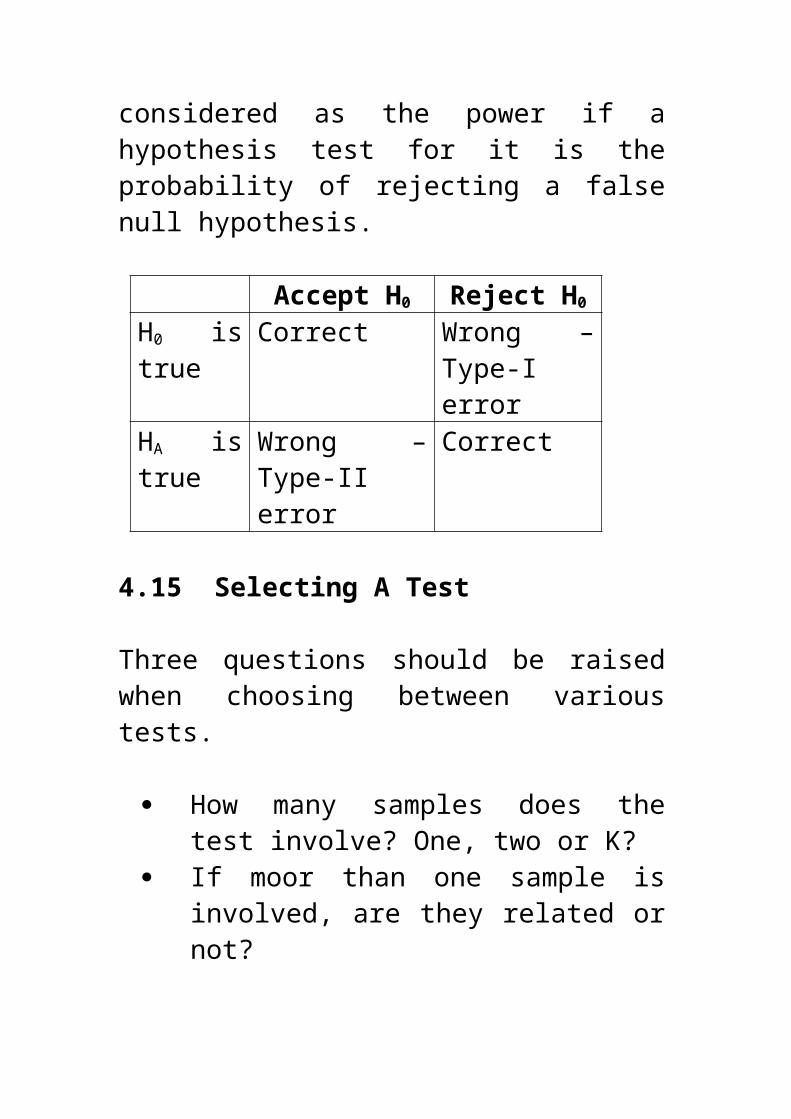
Advertisement
83%
17%
YesNo
Effectiveness of Promotions
33%
67%
YesNo
Only one dealer found the brand unsuccessful because of its range of products.
7) Are the consumer sales promotional activities of LG effective?
Sample Size 6Frequency Percentage
Yes 4 66.7No 2 33.3
67% of the dealers are happy with the effectiveness of sales promotional activities and 33% are not. 8) Are you satisfied with the current media used by LG for advertisement?
Sample Size 6Frequency Percentage
Yes 5 83.3No 1 16.7
83% are happy with the current media used for advertisement and 17% are not happy.

Dealer Incentive
67%
33%YesNo
Financing
33%
67%
YesNo
9) Do you think LG should go for financing the purchase of the Colour TV?
Sample Size 6Frequency Percentage
Yes 4 33.3No 2 66.7
67% of the dealers wanted LG to go for financing the purchase of the CTV.10) Are you satisfied with the dealer incentive schemes provided to you by
LG vis-à-vis the competitors?
Sample Size 6Frequency Percentage
Yes 4 66.7No 2 33.3
It was found that 67% of the dealers were satisfied with the incentive schemes provided to them by the company. But 33% of the dealers were not satisfied.
11) Do you think the latest technological changes introduced in the LG CTV will result in the boost of it’s sales?
Sample Size 6Frequency Percentage
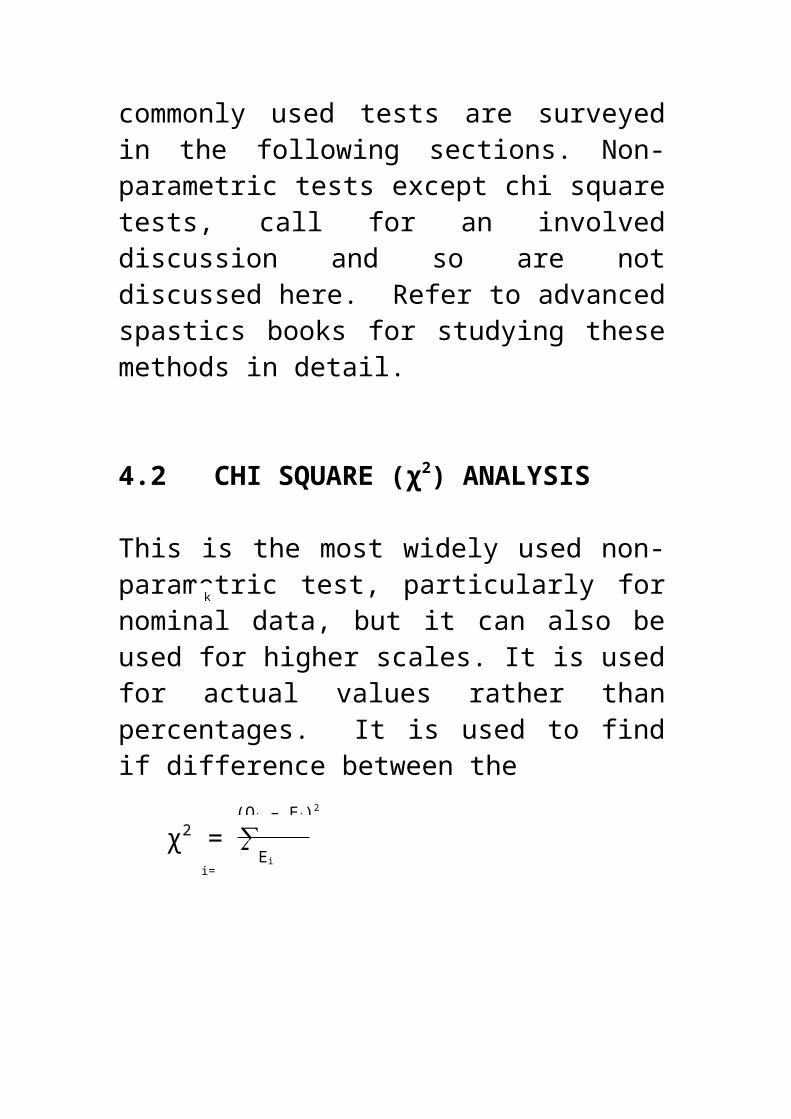
Technology
33%
67%
YesNo
17
9
31
02468
1012141618
Successful Unsuccessful
Users - Successful
UsersNon-users
Yes 4 66.7No 2 33.3
67% of the dealers thought that the technological advances would really affect the sale of the CTV. There were 33% of the dealers who felt that it would not affect the sale.
Cross-Tabulation
1) The objective of this tabulation is to find the break-up between the percentage of users / non-users perceiving LG as a successful brand.
Successful UnsuccessfulUsers 17 3 20 (66.7%)Non-users 9 1 10(33.33%)
26 (86.7%) 4 (13.3%)
2) The main objective of this cross-tabulation is to show how the choice of attributes of CTV vary with income levels.
0
2
4
6
8
10
12
14
Aesthe
tics
Price
Brand N
ame
Reliabil
ityPerf
ormanc
e
Advertis
e-ment
After S
ales S
ervic
e
>3,00,000
2,50,000 – 3,00,000
2,00,000 – 2,50,0001,50,000 – 2,00,000
1,00,000 – 1,50,000
<1,00,000
14
5 6 5
0
5
10
15
Yes No
Users - Re-purchase
UserNon-user
Annual Income Aesthetics Price Brand Name
Reliability Performance Advertise-ment
After Sales
Service<1,00,000 2 1 6 1 2 40%1,00,000 – 1,50,000
3 1 6 33.3%
1,50,000 – 2,00,000
1 2 1 1 16.7%
2,00,000 – 2,50,000
1 3.30%
2,50,000 – 3,00,000
1 3.30%
>3,00,000 1 3.30%3.30% 20% 20% 3.30% 43.30% 3.30% 6.70%
Finding
It is very clear from the table and the graph above that the lower income groups (i.e. 1,00,000 and 1,00,000 – 1,50,000) give more preference to performance. Where the higher income groups (i.e. 2,50,000 – 3,00,000 and >3,00,000) give more preference to brand name.
3) The objective of this cross-tabulation is to know the break-up between the number of users / non-users going for re-purchase of LG CTV?
Yes NoUser 14 6 20 (66.7%)Non-user 5 5 10(33.33%)
19 (63.3%) 11 (36.7%)
User-Schemes
60%
40%
AffectedNot Affected
Finding
We find that out of 20, 6 of the users do not want to go for re-purchase of LG CTV. The reasons are:
The lower income group people find the range of prices and promotional schemes offered by other brands more attractive vis-à-vis LG.
The higher income groups people feel that the quality of LG is not up to the expected level of standards. The trust associated with the brand name is falling.
Surprisingly, half of the non-users are willing to go for LG as their re-purchase choice. This shows the privilege enjoyed by LG as the market leader in the CTV segment and also the minds of the people.
4) The objective of this cross-tabulation is to know how many of the users have really been affected by the various purchase schemes offered by the company.
SchemesAffected Not Affected
Users 12 8
Finding From the above table it is very clear that 60% of the users are affected by the schemes and 40% are not.
RECOMMENDATIONS
Brand Image Should be Maintained
LG enjoys a good brand image, especially due to its reputation of conforming to quality in the consumer electronic goods market. This story dates back to the time when there were not many brands in the amrekt and LG was the only brand, which got hugely popular especially due to its quality levels. But lately it has been noticed that
Their quality is going down No prompt after sales service Less incentive schemes to dealers compared to competitors.
So our recommendation to LG is that if they want to retain their market share it becomes vital for them to maintain the brand image and the trust which they have built over the years.
Better Advertisements
Another finding of our survey was that people were in a very ambiguous state when asked as to what they thought of the advertisements. Even on being told what they were, the respondents were not able to recall them exactly. Thus, it is necessary to come out with more attractive ads. Also, the number and the frequency of the ads has to be increased on the television channels.
Quality Checks
In the past LG could boast of its best quality. But today we find that both the customers and dealers have too many complaints with the quality of the product. Thus we think LG should go for more stringent quality checks.
QUESTIONNAIRE FOR CONSUMERS
Date: Q.No.
Dear Sir / Madam,
We the students of MI are conducting a market research to know your brand perception in the colour TV segment. Kindly extend your cooperation in filling this questionnaire and enable us in doing the research successfully.
1) Are you a user of LG colour television?
Yes.

No.If no, specify which brand __________
2) What influenced your decision to purchase a Colour TV?(Rank the following in the order of preference) 1– Best, 2 – next best and so on.
___ Aesthetics / Appearance___ Price___ Brand name___ Reliability___ Performance___ Advertisement___ After sales service
3) What influenced your decision to purchase / no to purchase LG Colour TV? (Please select any two from above)
i. _____________________ii. _____________________
4) Which Brand do you think is the toughest competitor to LG?
OnidaVideoconHaierPhilipsAkaiAiwaSonySamsung
Why? ______________________________
5) Do you think LG Colour TV is a Successful brandUnsuccessful brand
6) Why do you think LG Colour TV has been a successful / unsuccessful brand?
Range of productsRange of pricesPromotional activities
7) Based on the price range what impression do you carry of LG CTV:
EconomicalCostly
8) Tick the size of LG Colour TV you own (user’s questions)( ) 14” ( ) 20” ( ) 21” ( ) 25” ( ) 29”

9) Which of the following additional attributes do you perceive as most important in your Colour TV?
Net savvy technology (e.g. Web TV, Multi-media TV, etc.)Locking systems (e.g. Child Lock, Volume Lock)Picture in picture
Any others, specify _________________
10) What do you think of the advertisement of LG?
ImpressiveSatisfactoryUnsatisfactory
11) You like / dislike the advertisement because of:
Like DislikeModel / Celebrity _______________________Specify the celebrity _______________________Presentation, ____________
___________What you liked / disliked ____________
___________Slogan ____________
___________Any other (specify) ____________
___________
12) Which do you think is the most striking media to advertise LG CTV?
NewspaperMagazinesTVThe InternetHoardingRadio
13) Do the various schemes / promotional activities affect your purchase plans?
YesNo
14) If you go for re-purchase of TV, will you prefer LG Colour TV?YesNo
15) Do you agree or disagree with the punch line of LG --------------------

A word about yourself
Name :Address :Age : (a) 18-25 (b) 26-30 (c) 31-40 (d) above 40Occupation : Student / Service / Business / Any other (specify) _______Sex : Male / FemaleAnnual Income : 1) <100000
2) 100000 – 1500003) 150000 – 2000004) 200000 – 2500005) 250000 – 3000006) > 300000
Thank you
QUESTIONNAIRE FOR DEALERS
Date:Q.No.
Dear Sir / Madam,
We, the students of MI are conducting a market research to know the consumer perception and sales promotion effectiveness of LG CTV.
Kindly extend your cooperation in filling this questionnaire and enable us to conduct the research successfully.
1) What influences your customer’s decision to purchase a LG Colour TV? (Rank the following in the order of preference) 1 – best, 2 – next best, etc.
__Appearance / Aesthetics__Price__Brand name__Reliability__Performance__After sales service
2) Which size of LG CTV do the customers purchase the most?
( ) 14” ( ) 20” ( ) 21” ( ) 25” ( ) 29”

3) What do you think is the toughest competitor to LG?
OnidaVideoconHaierPhilipsSamsungAkaiAiwaSony
Why? ___________
4) Where do you rank the following colour TVs in terms of (Rank the top 3 for each)
LG Onida Videocon AIWA AKAI Samsung HaierBrand NameAestheticsRange of ProductsRange of PricesPerformanceDealer Promotional ActivitiesConsumer Promotional ActivitiesAfter Sales Service
5) Do you think LG Colour TV is a
Successful brandUnsuccessful brand
6) Why do you think LG Colour TV has been a successful / unsuccessful brand?
Range of productsRange of pricesDistribution NetworkPromotional activities
7) Are the consumer sales promotion activities of LG effective?
YesNo
If No, why? _________________________________8) Are you satisfied with the current media used by LG for advertisement?

YesNo
9) If No, which do you think is the most striking media for LG to advertise?
NewspaperMagazinesTVThe InternetHoardingRadio
10) Do you think LG should go for financing the purchase of the Colour TV?
YesNo
11) Are you satisfied the latest technological changes introduced in the LG CTV will result a boost in it’s sales?
YesNo
Shop Name :Address :
Thank you.

Illustration:Step 1: Defining research problem and identifying research objectives
Research Problem – To study market penetration of Surf Detergent Powder in & around Pune .
Research Objectives
To find out:
(a) Which is the most commonly used detergent in the market?
(b) What influences people to buy a particular brand?
(c) What is the penetration level of Surf in the market?
(d) To identify customer needs.
Step 2 : Developing research plan
(a) Research Design – Descriptive
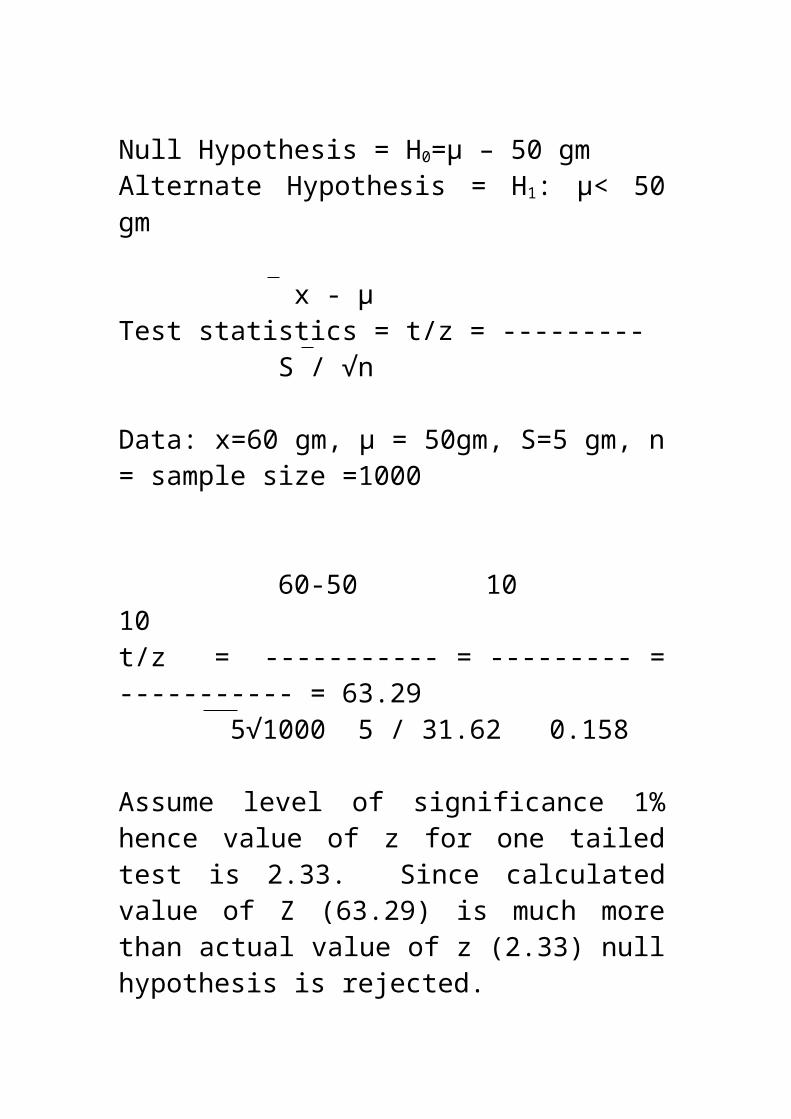
(b) Sources of secondary data – From Indian retailers association, name and addresses of grocers, supermarkets were collected, from whom name and addresses of detergent users were collected. Sources of primary data – Household samples
(c) Research approach – Focus group interviews and individual sample interview.
(d) Research instruments – Structured questionnaire
(e) Sample Plan Universe – Residents of Pune
Frame – Detergent usersSample size – 52 / 40 (52 list of detergent users from whom 40 Surf users were picked up)
Method – Systematic samplingUnit – Household
(f) Contact method – TI / PI Questionnaire for households samples.
Dear Sir / Madam,
The students of Management studies, Pune are conducting this survey, as a part of their project in the field of Research. The purpose of this activity is to measure the penetration of Surf in Pune.
1. Do you wash your clothes at home? Yes No
2. Do you use Surf? Yes No
3. If Surf, which sub-brand do you use? Surf Excel,Surf Excel Blue Surf Ultra Surf Super Excel Surf Excel Matic
4. What influences your decision while buying Surf? (Tick as many as applicable)

Whiteness Lather Easy on hands Easy on fabric Stain removal Any other (please specify)
5. Have you seen any promotional campaign of Surf? Yes NoIf yes, which one does you like the most? Lalitaji Surf Excel hai na Dho daala ,Daag Achhe Hai !Hai
Na ? Dhoondhthe Reh jaaoge Any other (please specify)
________6. Do the various schemes associated with
Surf affect your purchase? Yes No
7. Would you suggest any changes for Surf in the following fields? Availability in different quantities Style of packaging

More schemes to be associated with the brand
Pricing Any other (please specify) ____
8. Why not Surf? Price Quality Packaging Fewer schemes as compared to
other brands Any other (Please Specify) _
9. Which detergent does you most frequently use? (Tick as many applicable) Ariel Nirma Wheel Rin Tide Henko Any other (please specify)
_______10. What influences you to buy your
preferred brand? Friends Neighbours Advertisements Self Experience
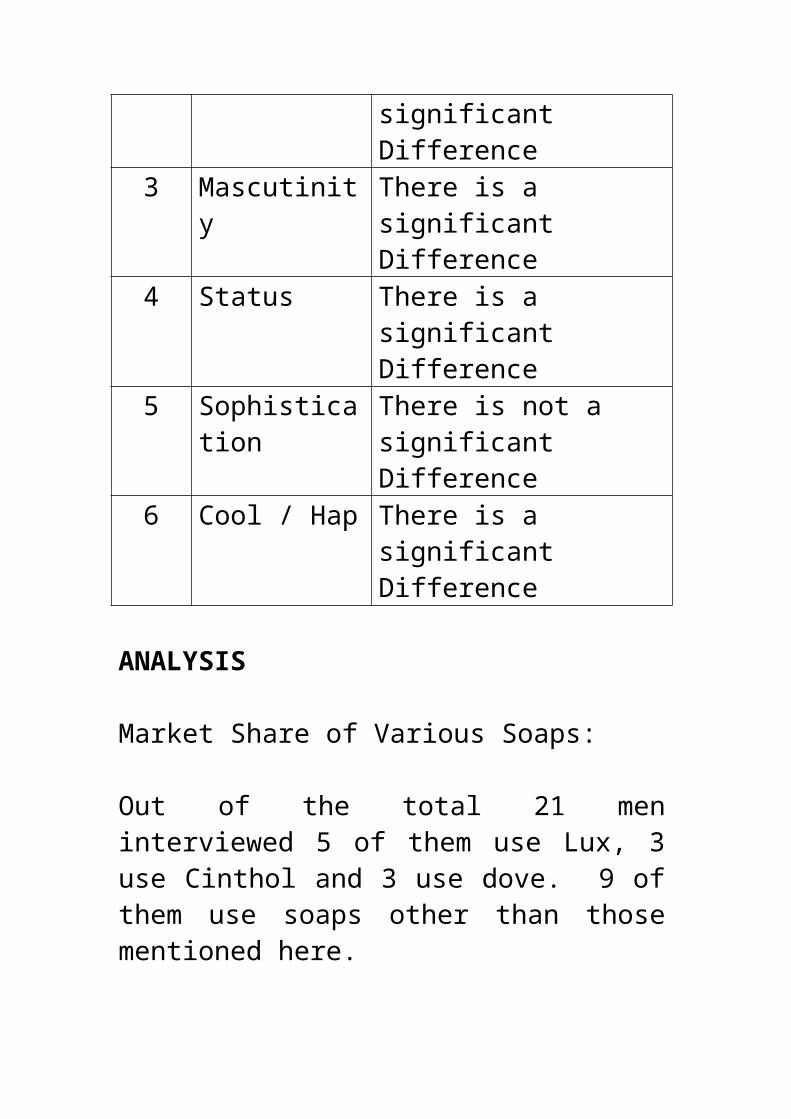
Any other (please specify) ______11. While purchasing a detergent, what
quantity do you usually go for? Less than 1 Kg 1-2 Kg 2-3 Kg 3-4 Kg More than 4 Kg
12. How frequently do you purchase detergents? Once a week Once a fortnight Once a month Once in two months
13. You prefer your detergent in: Sachets (10 gm, 20 gm, 50 gm,
etc) Packets Jars Bigger containers Any other (please specify)
_______14. If your preferred detergent is not
available, you go for:First Choice ______________Second Choice ___________
15. Do you keep a stock of detergents in your home?
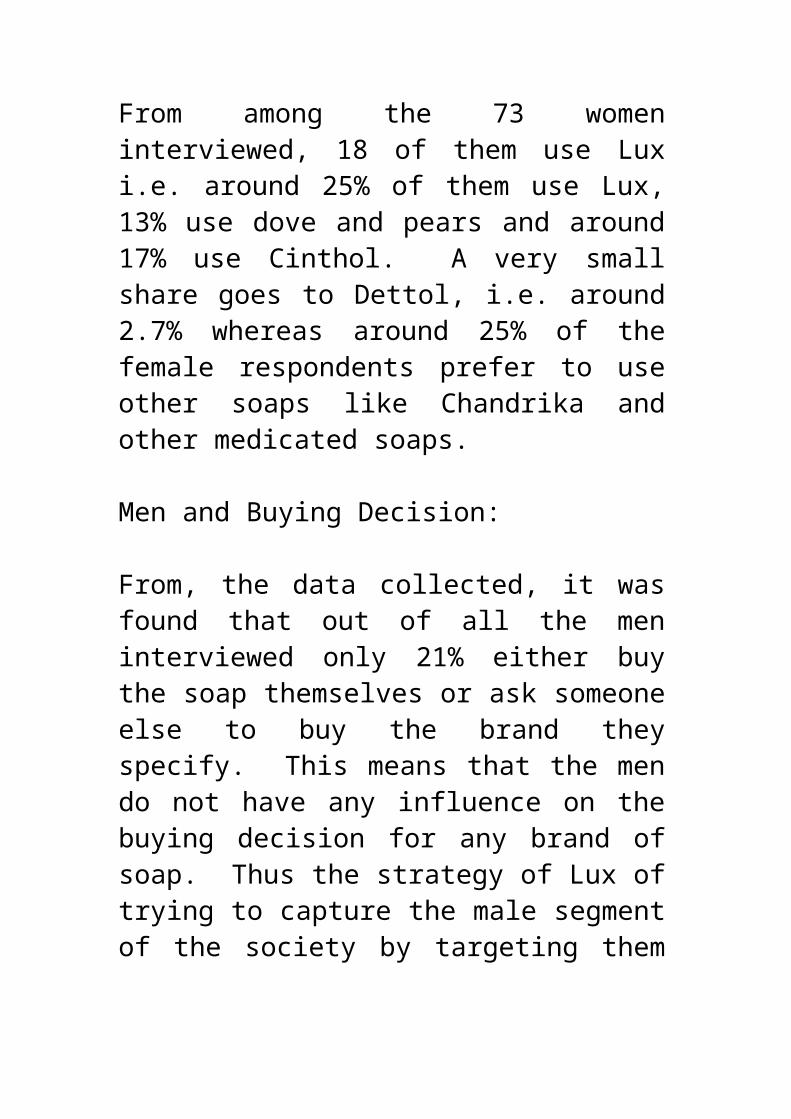
Yes No
16. Most preferred detergent among people you know Surf Ariel Nirma Wheel Rin Tide Henko Any other (please specify)
_______Something about you
Name : Mr./Mrs./Ms. _________Age Group :Kindly tick whichever is applicable
< 25 25-34 35-44 45 and above
Address:
Occupation:
Do you own a washing machine? Yes No
Who washes the clothes in your house?

Yourself Maid Any other (please specify)
_______How many members are there in your household?
_________________________________
Income Group: (Tick whether is applicable)
< 5000 5,001-10,000 10,001-15,000 15,001 and above
Thank you
Step 3: Forming temporary marketing organization for collection of market data
Project Leader - 1
MR Officer (Not required)

Investigators – 1
Time to complete the project – since 52 / 40 samples to be interviewed and one sample might take 30 minutes and 30 minutes could be consumed in traveling, in one day, 8 samples could be interviewed. Hence project will be over on 5th day. No. of investigators needed is only one.
Step 4 & 5 : Data analysis by using SPSS. Data presentation and preparation of Research Report.
Sample Composition
In all, group members as a part of our survey visited 52 households. 12 of them revealed that they were entirely dependent on local washermen or launderettes. Therefore these respondents were not considered for answer the questionnaire. The remaining 40 thereby formed the sample size of our survey.
Sex
MaleFemale
Sample size = 40
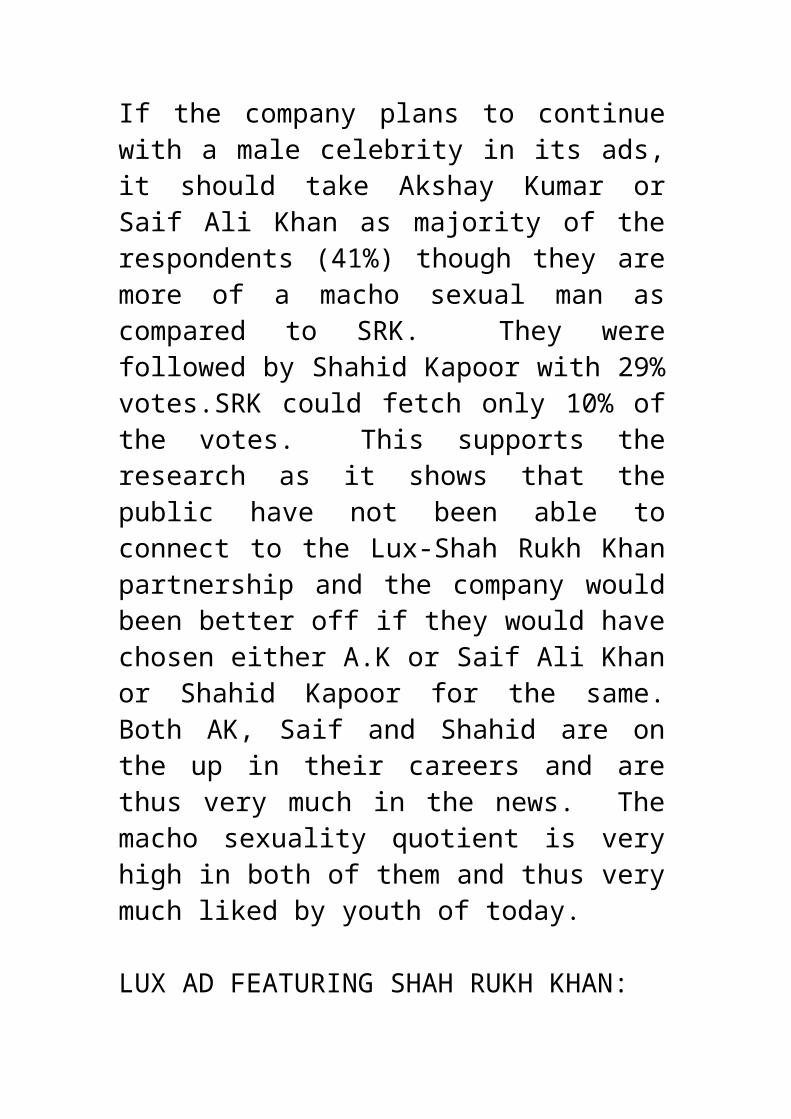
Sample Size = 40
OCCUPATION
23
107
0
10
20
30
Housewife Student Working
AGE GROUP
9
1412
5
0
5
10
15
<25 25-34 35-44 >44Sample Size = 40
Sample Size = 40
INCOME GROUP
10
10
14
6
0 2 4 6 8 10 12 14 16
>15000
10001-15000
5001-10000
<5000
Sample Size = 40
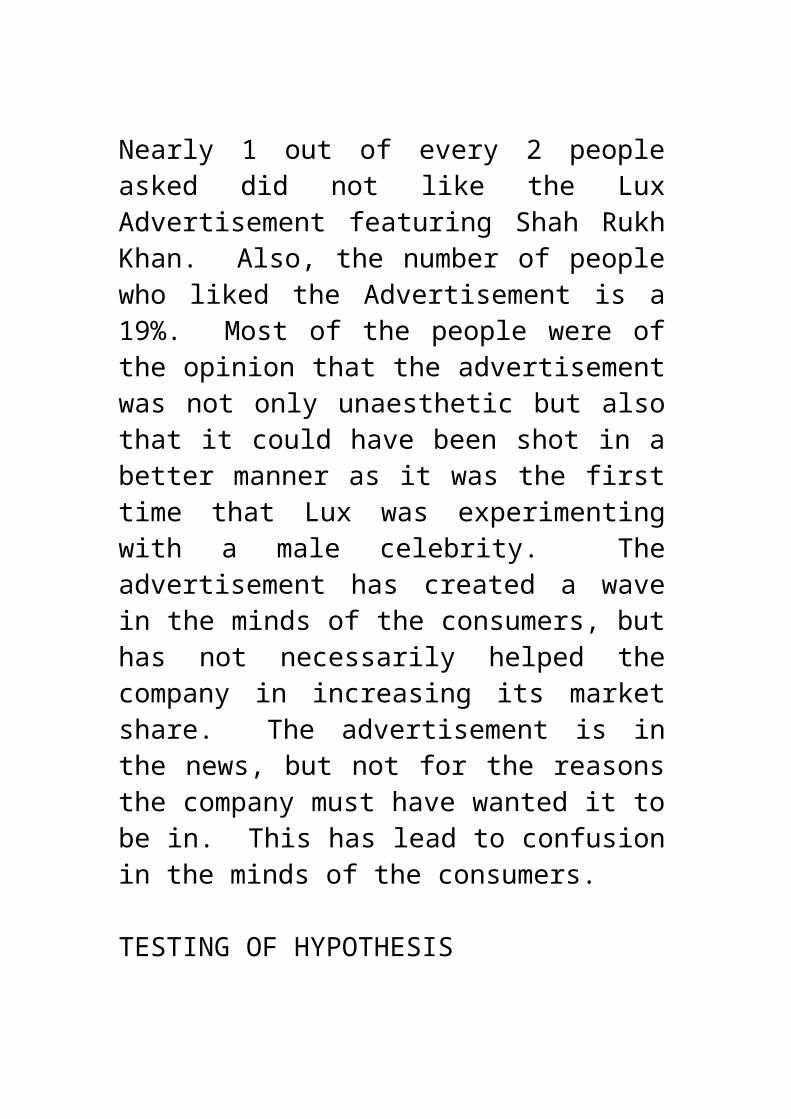
Sample Size = 40
12
22
6
05
10152025
1
Yourself Maid / servant Others
MEMBERS IN HOUSEHOLD5%
10%
14%
19%24%
28%
123456
Sample Size = 40

Findings of Survey
As a part of our survey, we visited 52 houses. It was found that 12 households gave all their clothes to launderettes, while 40 households washed their clothes at home. Since the objective of our survey was to find out which
OWN A WASHING MACHINE?
50%50%
Yes No Sample Size = 40
77%
23%
Yes No Sample Size = 52

detergent is popular in the households, we did not take into consideration the 12 who depended entirely on launderettes.
Of the 40 people interviewed, it was found that 21 households used Surf, while 19 of them washed their clothes with other detergents. This is a clear indicator of the popularity and the presentation of this particular brand in the consumer’s mind and in the market.
3. Sub-brands of Surf used
Sample Size = 40
48%52%
SurfOthers
17
2 20
0
5
10
15
20
Surf Excel Surf Ultra Surf SuperExcel
Surf ExcelMatic
Users of Surf 21

Of the 21 consumers using Surf, it was found that Surf Excel & Blue as a sub-brand was the most commonly sued, with 17 consumers stating it as their preference. This was followed by Surf Ultra and Surf Super Excel with 2 consumers each. However, no users could be detected for Surf Excel Matric.
4. Influential factors while buying Surf
As indicated above, whiteness that the detergent provides, say 8 of the consumers, is one of the most potent influences while buying
37%
10%10%
24%
14%5%
WhitenessLather
easy on handseasy on Fabric
Stain RemovalOthers
Sample Size = 21

the detergent. The second most important influence is the fact that it is easy on the fabric, say 5 of them. Other influential factors are its gentleness on hands and its good stain removing capacity (Daag dhoondte reh jaaoge).
5. Consumer awareness with respect to the advertising campaign of Surf.
Of the consumers surveyed, awareness with respect to advertising by Surf was cent per cent-that is, all consumers using Surf were aware of its promotional campaigns and all had seen Surf ads at one point of time or the other. Of the different types of ads aired by the media, the lalitaji ad held the greatest retention power and linking, with 7 out of the 21 consumers liking it the most, followed by the ad for Surf Excel and Dhoondthe Reh Jaaoge, with a fan following 5 consumers each.
32%
24%10%
24%
10%
Lalitaji
Surf Excel hai Naa
Dho Daala
Dhoondte RehJaaogeAny Other
Sample Size = 21

6. Persuasive Powers of variousSchemes, which are launched by Surf to promote sales, are generally not THE major criteria when the consumer goes in for a purchase. This is also reflected by the survey in which 13 out of 21 of the consumers supported the fact. Only 8 were those who were affected by the schemes propagated by Surf.
7. Suggestions provided by the consumers
The following changes were suggested in the any other category.
Demands for a measuring scale so as to avoid wastage of powder.
Change in the color of the detergent powder.
Fragrance of the detergent.
8. Reasons for not using Surf.
0
1
2
3
4
5
Price Quality Packaging FewerSchemes
Others
Sample Size = 19
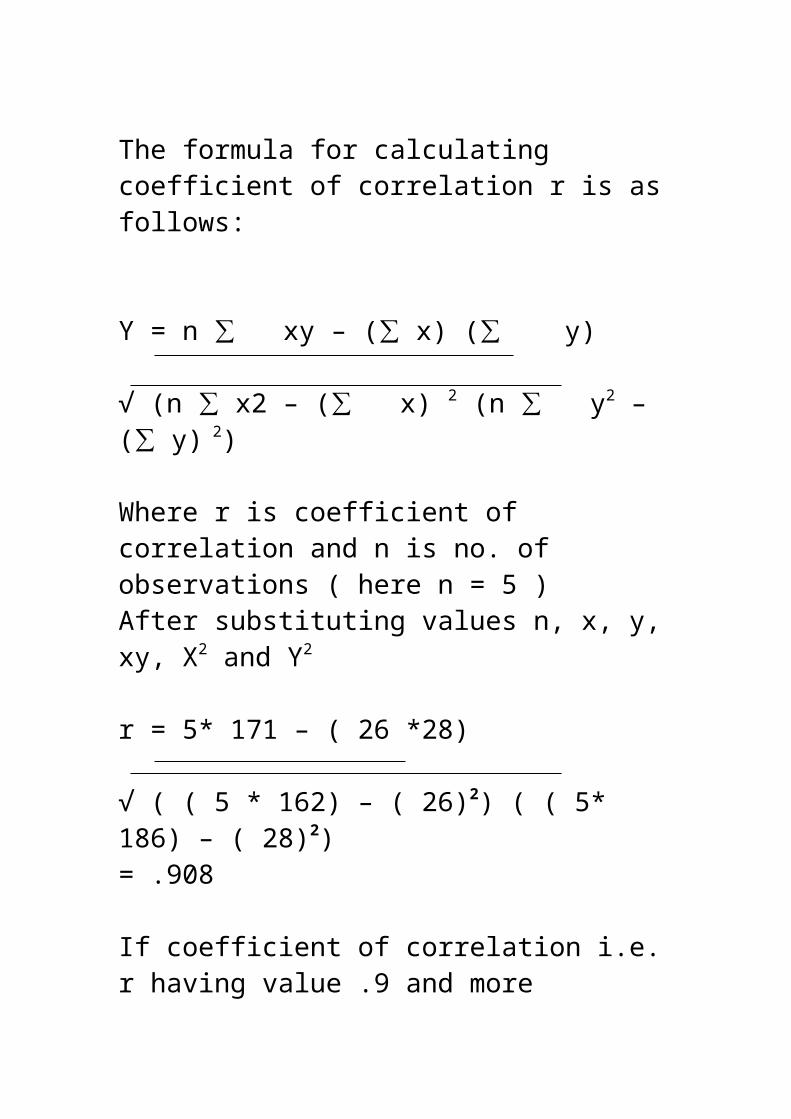
Price of the detergent and association with fewer schemes were the two primary reasons for which consumers preferred other brands to Surf. Price was a factor for users of cheaper washing powders such as Nirma, Rin and Wheel. Users of Henko, Tide and Ariel insisted that the quality of their detergent was superior to that of Surf.
9. Detergents (other than Surf) frequently used by consumers
2
1
1
7
7
2
4
0 2 4 6 8
Others
Tide
Rin
Wheel
Ariel
Sample Size = 24

Amongst many existing brands available (excluding Surf) in the market, the most frequently used ones are Rin and Wheel followed by Ariel with others (Local) constituting the rest of the market. In the chart indicted above, 19 were nonusers of Surf, while 5 of them also preferred an additional detergent besides Surf.
10. Major influencers while making a purchaseFactors No.Friends 3Neighbours 4Advertisements 13Self-experience 19Others 1Total 40While conducting the survey, personal experience of using the product along with many others over a period was major influence while indulging in the purchase. Apart from this, effective advertising was a close runner-up and was largely responsible in influencing people while buying their preferred brand.

11. Quantity usually purchased
Quantity No.Less than 1 kg 101-2 kg 202-3 kg 63-4 kg 3More than 4 kg 1Total 40
As is predictable, due to the fact that the survey was done in an area which was middle – class one, the housewives usually went in for the 1-2 kg pack and the frequency of purchase was once in a month which is depicted in the chart above.
12. Frequency of purchase
Frequency No.Once a week 3Once a fortnight 11Once a month 23Once in two months 3Total 40
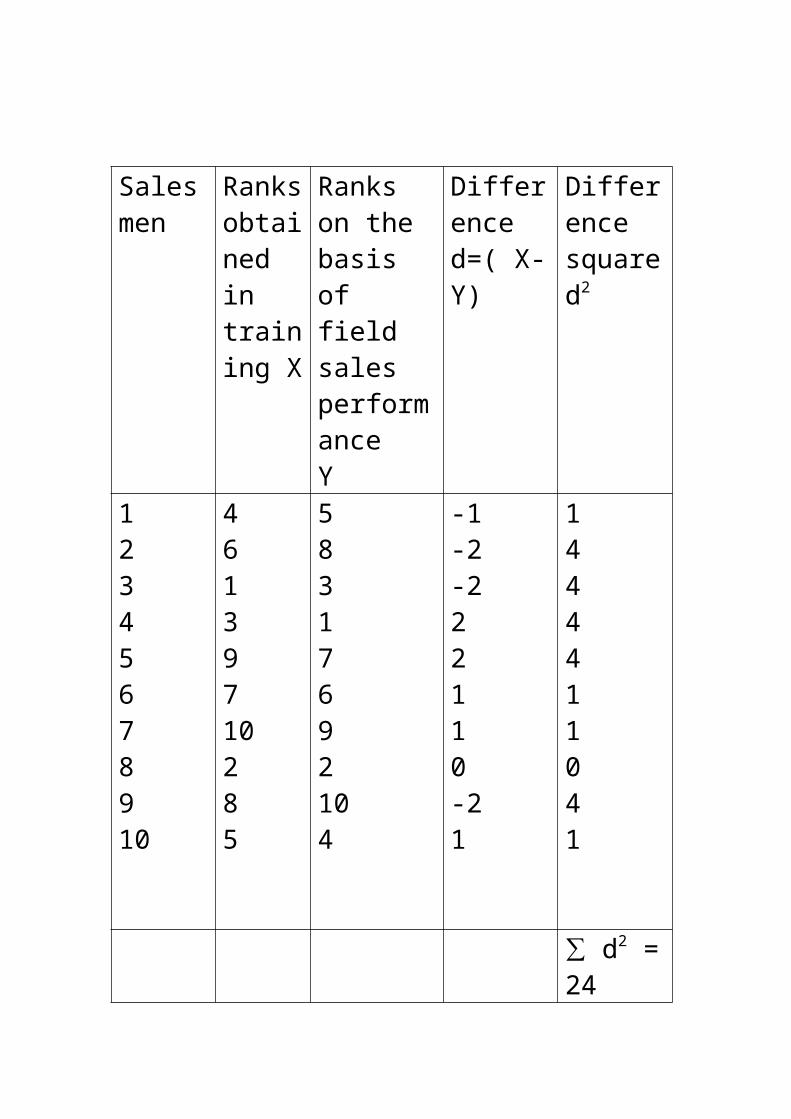
Usually households preferred to buy their stock of detergent once in a month, as is mostly the case with all stock being ordered along with the ration that comes monthly. But still many households also buy it fortnightly.
Packets (500 gm, 1 kg, 2 kg) are the outright winners in this section with more than 50% consumers in this category preferring this particular style of packaging. However, Jars were also preferred because of their multi-utility purpose after using the primary product.
14. Alternative brand of detergent
First choice Second choiceBrands No. Brands No.
Rin 9 Rin 11Wheel 8 Wheel 12Surf 10 Surf 5Tide 1 Tide 6Ariel 7 Ariel 3Henko 4 Henko 1Nirma 1 Nirma 2Total 40 Total 40
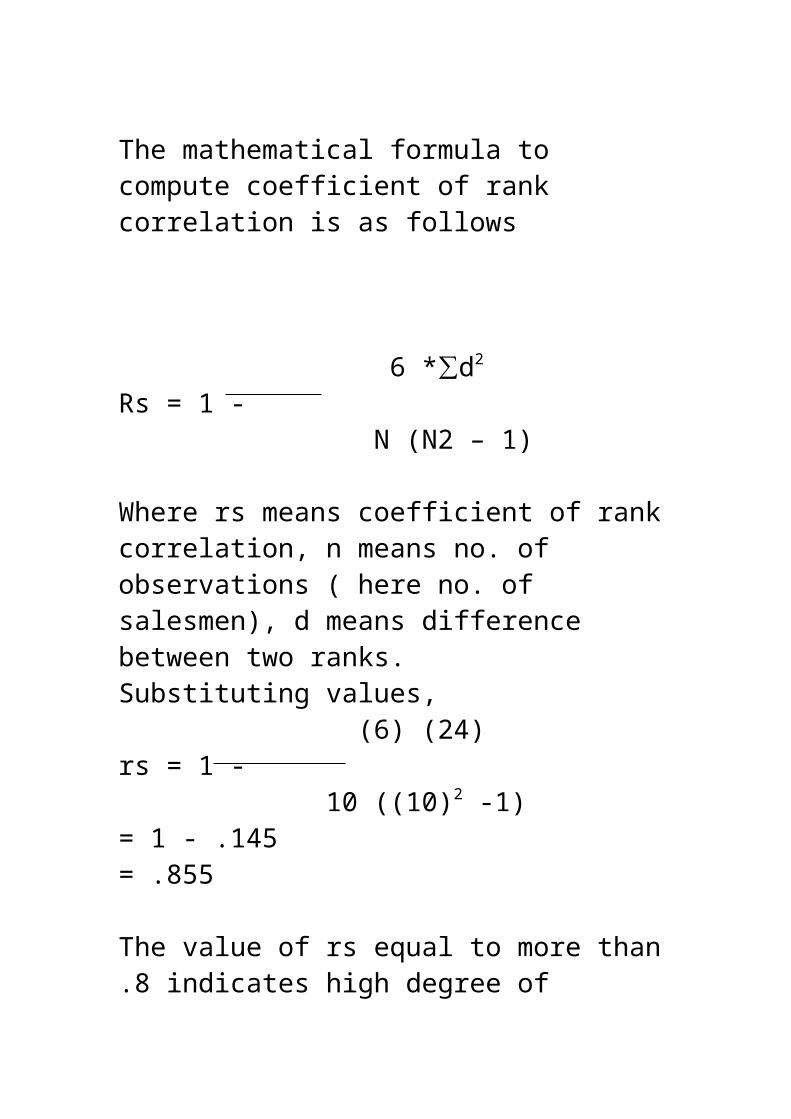
There were 10 non-users of Surf who preferred it as their first choice of purchase in case of non-availability of their preferred brand. Users of Surf voted for Ariel, Rin and wheel as their first choice given the same situation.
15. Stock of detergents
More than 50% of the households did not keep a stock of detergents at home and resorted to purchase only when the need arose.
16. Preferred detergent amongst acquaintances of consumers
0 5 10 15 20 25
Yes
No
Sample Size = 40

The general impression that we get after conducting the survey is that Surf rules the market because it was revealed that amongst the acquaintances also Surf was the most popular brand followed by Ariel and Nirma.
Findings
In Q.No. 7, eight respondents stated that they would like more schemes to be associated with Surf. However, when they were asked that what change would they suggest in their detergent (Q.No. 8), only 5 of them suggested more schemes.
Surf Excel (17/21) is preferred by the consumers because of its extraordinary whiteness (8/21) and the fact that it is easy on the fabric (5/21).
When it comes to housewives the verdict is almost equal with 12 saying ‘Yes’ and 11 saying that they do not use Surf but when it comes to students, Surf is the clear winner with 6 out of 7 favouring the product.
Of the 40 consumers surveyed, 21 Surf and of those 21, 19 were women as Surf
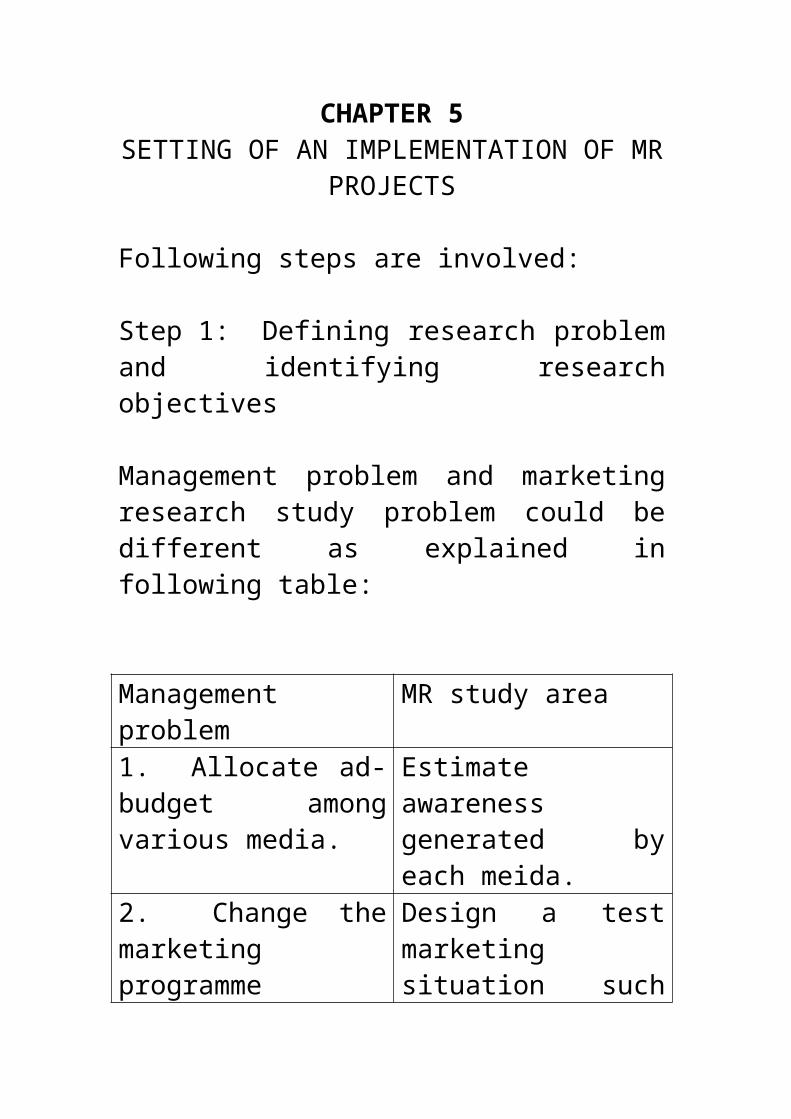
is more a product that homemakers use. Of the 19 non-users, 16 again were women with the rest being men who had genuine knowledge about the product and who had used it at one moment of time or another.
Of the users of Surf, all of them were more or less equally distributed when categorized according to the income group with the higher income group categories preferring Surf a little more as Surf is costlier than most of the other brands (13/21).
An interesting fact is revealed, 4 suers stated that some of their clothes were washed either by themselves or by their maids; however the expensive clothes were given to launderettes.We also find that the trend of people who are in the different categories is almost the same with almost an equal number in each category.
One interesting observation may be possible. It is seen that the less than 25 age group of users are more inclined to sue Surf and as the age group increases the number of users decrease, this may be due to the new positioning that Surf
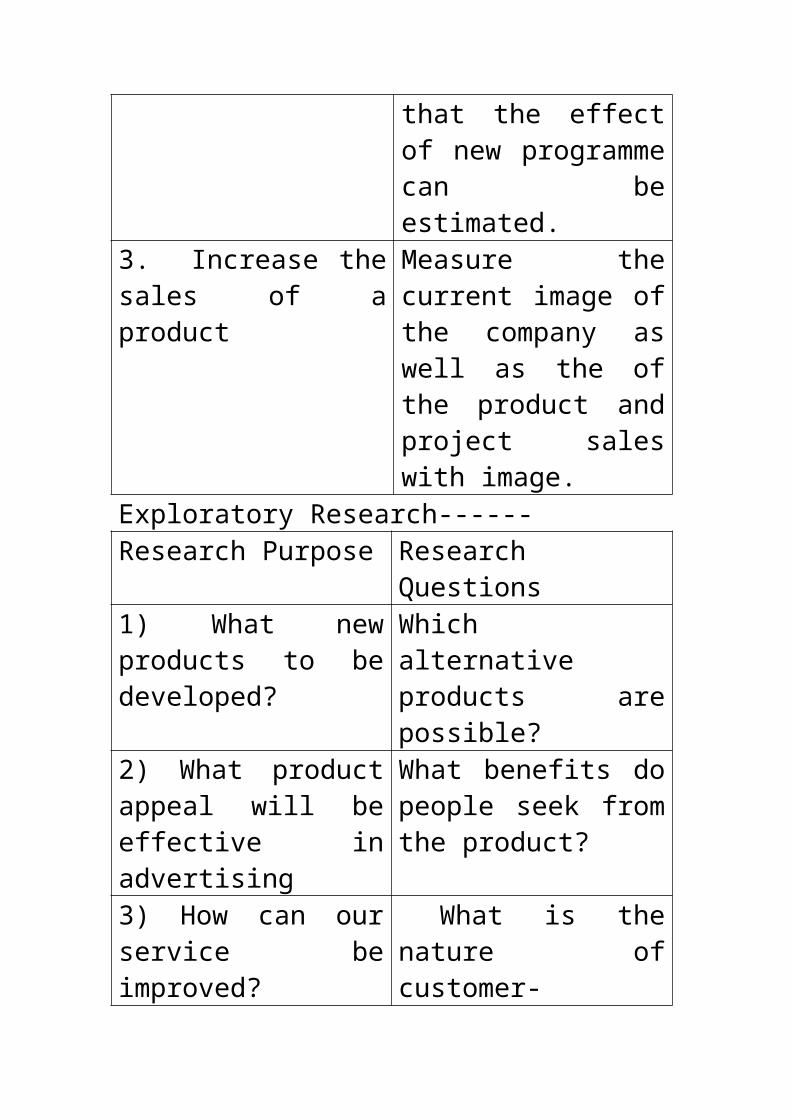
is using where it is targeting the younger generation too, through its advertisements.
Surf is popular with acquaintances of both the users and the non-users. In the acquaintances of users section Ariel follows (5/21) while in the alternative category Nirma (6/19) and Ariel (4/19) are preferred widely.
Recommendations for designing marketing strategy
Of the sub-brands, Surf Excel was the most recognized one, so the company ought to take some measures to make the consumer aware about other sub-brands.
If possible, pricing should be reviewed, with many consumers citing it as a negative factor.
Surf being viewed as a premium product could come up with a lower priced sub-brand for more rural market penetration to compete with Wheel, Nirma and so on.
More schemes should be introduced to attract non-users.

Advertising standards should be maintained, if possible improved, as advertisements have contributed immensely to the awareness level and usage of the product.