www.ischool.drexel.edu info 636 software engineering process i prof. glenn booker weeks 4-5 –...
TRANSCRIPT

www.ischool.drexel.edu
INFO 636 Software Engineering Process I
Prof. Glenn Booker
Weeks 4-5 – Estimating Software Size
1INFO636 Weeks 4-5
www.ischool.drexel.eduINFO636 Weeks 4-5 2
Why Plan?
• As emphasized earlier, we need a good estimate of the amount of work to be performed, in order to predict effort and time accurately (per Boehm)
• Estimation is one of the most challenging aspects of managing software development, hence our substantial focus on it here

www.ischool.drexel.eduINFO636 Weeks 4-5 3
Estimation Example
• Other fields have well established formulas for estimating work– Construction knows the cost per square foot
of various types of construction– More complex projects look at the linear
amount of walls, and the areas of various parts (walls, ceilings, etc.) to develop good estimates

www.ischool.drexel.eduINFO636 Weeks 4-5 4
Size Estimation Process
• The framework, or process, for planning a project was covered last lecture– Define system requirements– Product conceptual design– Estimate product size– Estimate resources and schedule– Develop the product– Refine basis for later estimates

www.ischool.drexel.eduINFO636 Weeks 4-5 5
Estimation Tools
• Most software estimation tools have been calibrated to use software size as an input, and produce effort and schedule as outputs– COCOMO, SLIM, PriceS, and McConnell’s
tables in Rapid Development– Often start at fairly large project sizes,
e.g. 10,000 LOC and up
www.ischool.drexel.eduINFO636 Weeks 4-5 6
Estimation Tools
• We need a basis for estimation which works for an individual (programmer)
• Most organizations use either no estimation methods, or use terribly unreliable ones– 100% error is far too common

www.ischool.drexel.eduINFO636 Weeks 4-5 7
Desired Estimation Goals
• Criteria for a good estimation method include:– Use structured and trainable methods– Should apply to both development and
maintenance– Should be able to handle all aspects
of development, not just code

www.ischool.drexel.eduINFO636 Weeks 4-5 8
Desired Estimation Goals
– It should be suitable for statistical analysis– It should be adaptable to future types of work– It should be possible to judge the accuracy of
your work (and hence refine the model)
• We’ll briefly cover four estimation methods, then explain the proxy-based PROBE approach

www.ischool.drexel.eduINFO636 Weeks 4-5 9
Estimation Methods
• Wideband-Delphi Method
• Fuzzy Logic Method
• Standard Component Method
• Function Point Method
• Proxy-based Estimating
www.ischool.drexel.eduINFO636 Weeks 4-5 10
Wideband-Delphi Method
• This method was developed by Rand Corporation
• It uses several people to estimate the same task, then applies a Delphi method to get a consensus estimate
• The process is:– Discuss the problem
www.ischool.drexel.eduINFO636 Weeks 4-5 11
Wideband-Delphi Method
– Get anonymous estimates, and hand them to a moderator
– Find the median estimate, and show everyone the set of estimates
– Discuss the results, to uncover different views of the project scope
• Repeat the process until estimates converge to within a predefined range

www.ischool.drexel.eduINFO636 Weeks 4-5 12
Fuzzy Logic Method
• This approach uses historic data to arrive at some meaningful estimates based on qualitative descriptions– Size categories such as Very Small, Small,
Medium, Large, and Very Large
• How data are divided into these categories depends on the type of data
www.ischool.drexel.eduINFO636 Weeks 4-5 13
Fuzzy Logic Method
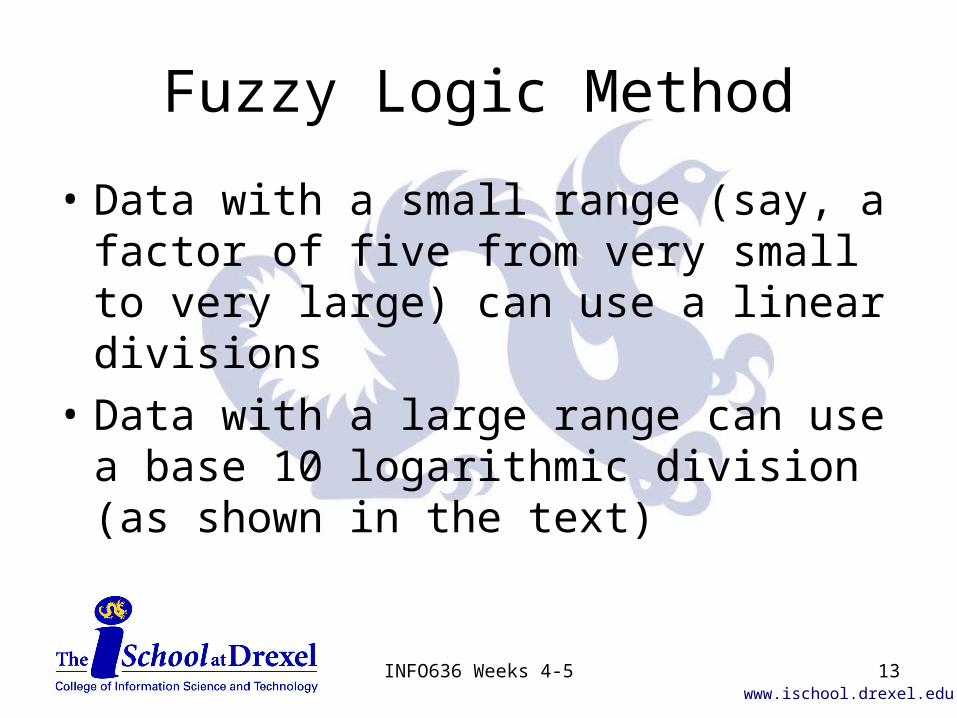
• Data with a small range (say, a factor of five from very small to very large) can use a linear divisions
• Data with a large range can use a base 10 logarithmic division (as shown in the text)

www.ischool.drexel.eduINFO636 Weeks 4-5 14
Fuzzy Logic Method
• Linear division breaks up sizes into evenly divided pieces
• Here’s an example for the N track– If your work to read the text involves chapters
from 23 to 75 pages long (I made those numbers up), then the range of sizes is 75-23=52 pages
– Divide that range into five pieces by dividing by four 52/4 = 13
www.ischool.drexel.eduINFO636 Weeks 4-5 15
Fuzzy Logic Method
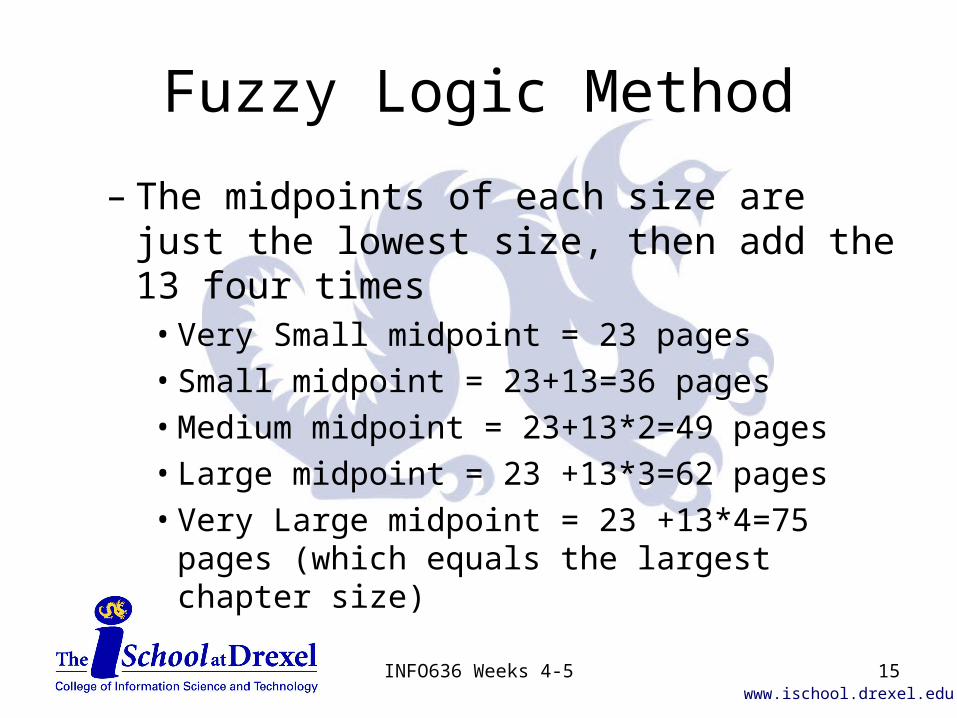
– The midpoints of each size are just the lowest size, then add the 13 four times
• Very Small midpoint = 23 pages• Small midpoint = 23+13=36 pages• Medium midpoint = 23+13*2=49 pages• Large midpoint = 23 +13*3=62 pages• Very Large midpoint = 23 +13*4=75 pages (which
equals the largest chapter size)

www.ischool.drexel.eduINFO636 Weeks 4-5 16
Fuzzy Logic Method
– Use half of 13, or 6.5, to find the ranges for each size
• Very Small range is up to 23+6.5=29.5 pages• Small range is 29.5 to 36+6.5=42.5 pages• Medium range is 42.5 to 49+6.5=55.5 pages• Large range is 55.5 to 62+6.5=68.5 pages• Very Large range is 68.5 pages and up
– Notice each category’s range is also 13 pages, since we have linear divisions

www.ischool.drexel.eduINFO636 Weeks 4-5 17
Fuzzy Logic Method
• The logarithmic version is messier, since we have to– Convert the sizes to their base-10 logarithms– Follow the linear approach using the
logarithms– Take everything to the power of 10 to convert
it back to the original units

www.ischool.drexel.eduINFO636 Weeks 4-5 18
Fuzzy Logic Method
– The example in the book has LOC ranging from 173 to 10,341 LOC
• The log10 of 173 is 2.238
• The log10 of 10,341 is 4.014
– The difference is 4.014 – 2.238 = 1.776– Divide the difference by four to get the interval
1.776/4=0.444– Mimic slide 15 to find the midpoints

www.ischool.drexel.eduINFO636 Weeks 4-5 19
Fuzzy Logic Method
– The midpoints of each size are just the lowest size, then add the 0.444 four times
• Very Small midpoint = 2.238• Small midpoint = 2.238 + 0.444 = 2.682• Medium midpoint = 2.238 + 0.444*2 = 3.126• Large midpoint = 2.238 + 0.444*3 = 3.570• Very Large midpoint = 2.238 + 0.444*4 = 4.014
(which equals the largest code size)
– Mimic slide 16 to find the ranges of each size category

www.ischool.drexel.eduINFO636 Weeks 4-5 20
Fuzzy Logic Method
– Use half of 0.444, or 0.222, to find the ranges for the first size (then just keep adding 0.444 to each range boundary)
• Very Small range is up to 2.238+0.222=2.460• Small range is 2.460 to 2.460+0.444=2.904• Medium range is 2.904 to 2.904+0.444=3.348• Large range is 3.348 to 3.348+0.444=3.792• Very Large range is 3.792 and up

www.ischool.drexel.eduINFO636 Weeks 4-5 21
Fuzzy Logic Method
– Now take 10 to the power of the logarithms to find the actual LOC
• Very Small range is up to 10^2.460=288 LOC• Small range is 288 to 10^2.904=802 LOC• Medium range is 802 to 10^3.348=2228 LOC• Large range is 2228 to 10^3.792=6194 LOC• Very Large range is 6194 LOC and up
– This is the basis for the poorly labeled table at the bottom of page 104 in the text

www.ischool.drexel.eduINFO636 Weeks 4-5 22
Fuzzy Logic Method
• An aside…Tables 5.2 in the text divide each of the five basic categories (Very Small, etc.) into five more “subranges”– This follows the same approach, just adding
more detail to each category– It’s unlikely you’ll have enough data to worry
about subranges

www.ischool.drexel.eduINFO636 Weeks 4-5 23
Standard Component Method
• The Standard Component Method, by Putnam, assumes you have a substantial database from which to make your estimates– Make a realistic estimate of how many
screens you think will be in your system– Estimate the lowest and highest possible
numbers of screens you could imagine will be in your system

www.ischool.drexel.eduINFO636 Weeks 4-5 24
Standard Component Method
– For actual estimation, usen = (lowest number + highest number + 4*realistic number)/6
– The idea is to try to account for possible error in your estimate
• Repeat this process for each type of component in your system
www.ischool.drexel.eduINFO636 Weeks 4-5 25
Function Point Method
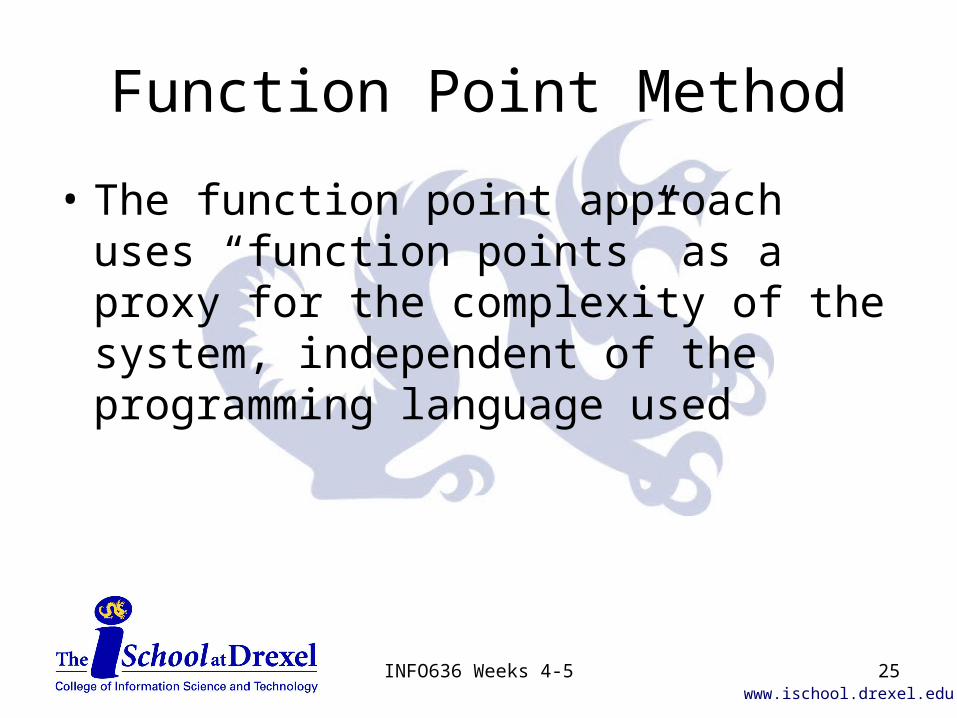
• The function point approach uses “function points” as a proxy for the complexity of the system, independent of the programming language used

www.ischool.drexel.eduINFO636 Weeks 4-5 26
Function Point Method
– Each input or output function, interface, file, and inquiry is judged on a fixed complexity scale of small to large (not shown in the Humphrey
text), and assigned some number of function points
– The total number of function points is adjusted for 14 “influence” factors, such as the developers’ expertise, business environment, etc.

www.ischool.drexel.eduINFO636 Weeks 4-5 27
Function Point Method
• While a great language-independent method for judging the complexity of a program, it isn’t as reliable for estimating development effort– See IFPUG for more details

www.ischool.drexel.eduINFO636 Weeks 4-5 28
Proxy-based Estimating
• We are trying to predict the final size of a software product
• Measuring or estimating that directly is tricky at best, so we use proxies to help get there – A proxy is an intermediate concept or
substitute for what we really want to predict
www.ischool.drexel.eduINFO636 Weeks 4-5 29
Proxy-based Estimating
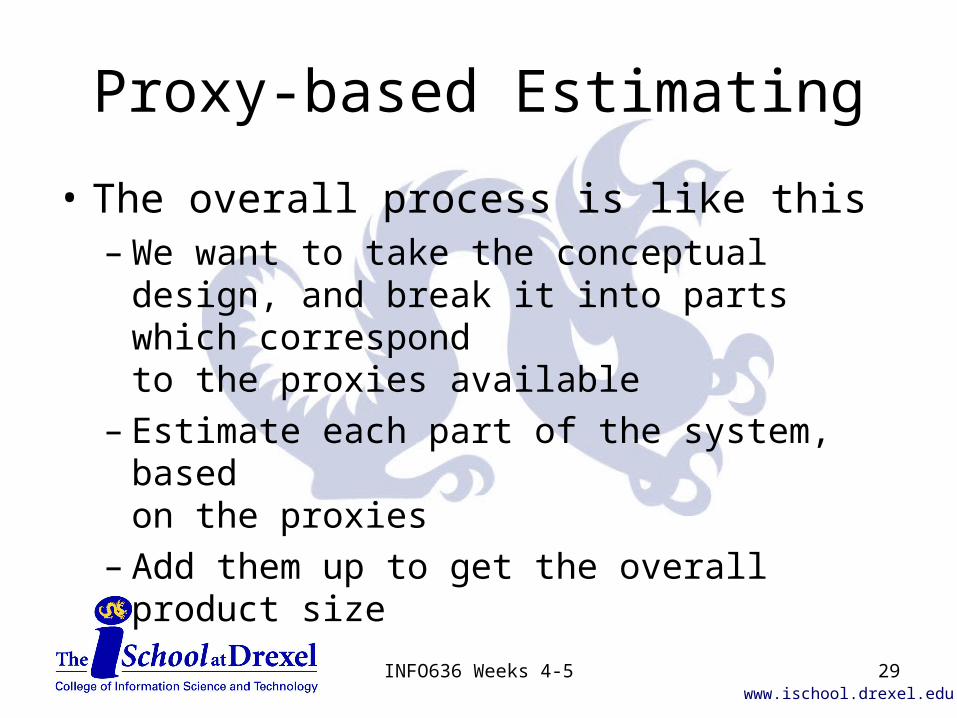
• The overall process is like this– We want to take the conceptual design, and
break it into parts which correspond to the proxies available
– Estimate each part of the system, based on the proxies
– Add them up to get the overall product size
www.ischool.drexel.eduINFO636 Weeks 4-5 30
Choosing a Proxy
• The proxy size should correspond to the development effort size
• Proxy content should be countable and easy to visualize
• Proxy must be customizable
• The proxy should be sensitive to the same factors which affect development
www.ischool.drexel.eduINFO636 Weeks 4-5 31
Possible Proxies
• In a manner similar to function points, any characteristic of the system could be proxies– Input screens, output reports, data files– Objects or classes
• The fuzzy logic and function point concepts are essentially blended to produce the PROBE approach

www.ischool.drexel.eduINFO636 Weeks 4-5 32
PROBE Method
• PROxy-Based Estimation (PROBE) uses objects as proxies– See also Appendix C, Tables C36 and C40
• First choose appropriate proxy categories (e.g. Table 5.7, p. 117)– For code, calculation, data, I/O, control, print,
etc. might be suitable proxies– Reading, discussion, homework,… (N track)
www.ischool.drexel.eduINFO636 Weeks 4-5 33
PROBE Method
• Choose reasonable size options for the proxies– For class, you might only have enough data
for three sizes instead of five
• Analyze your historic data to determine approximate sizes (LOC) for each proxy– For N track, the amount of effort needed
www.ischool.drexel.eduINFO636 Weeks 4-5 34
PROBE Method
• Now start using your method for a given assignment– Develop a conceptual design for the solution– Use your proxies to estimate the amount
of code or effort needed to develop them– The example on page 120 is the first use
of form C39 (p. 683)

www.ischool.drexel.eduINFO636 Weeks 4-5 35
A Course Note
• P track students will use the estimating pretty much as written in the text– Our forms are slightly different
• N track students will develop their own proxies to correspond to their weekly activities, and create a custom form N39 to follow a similar process

www.ischool.drexel.eduINFO636 Weeks 4-5 36
PROBE Method
• The BASE PROGRAM section of C39 is a summary of the expected changes to the preexisting code– Base Size (B) is the amount of code already
present– LOC Deleted (D) is how much existing
code you plan to remove– LOC Modified (M) is how much existing code
you expect to change

www.ischool.drexel.eduINFO636 Weeks 4-5 37
PROBE Method
• The PROJECTED LOC section contains:– Base Additions (BA) are planned additions to
existing code (new lines within existing modules)
– New Objects (NO) are new modules or classes which will need to be implemented
• Your proxy structure is used to describe the Type, Methods, and Relative Size of the changes to BA and NO

www.ischool.drexel.eduINFO636 Weeks 4-5 38
PROBE Method
• The REUSED OBJECTS (R) section of C39 is used to describe – Code you’ll reuse from another preexisting
source– Code you’ll create during this assignment
which will be reusable
• These tend to be rare during the course
www.ischool.drexel.eduINFO636 Weeks 4-5 39
PROBE Method
• Now comes the number crunching part– The Projected LOC (P) is the total amount of
new development for this assignment; P = BA + NO
– The terms 0 (hereafter beta0) and 1 (beta1) are linear regression parameters from your work history
– By now you have a history of planned LOC or effort, and actual
www.ischool.drexel.eduINFO636 Weeks 4-5 40
PROBE Method
• What are beta0 and beta1?• The classic equation for a line is
y = mx + b– ‘m’ is the slope, which corresponds
to beta1– ‘b’ is the y-intercept, which is beta0
• Here the ‘x’ axis is the planned LOC or effort, and the ‘y’ axis has actual values

www.ischool.drexel.eduINFO636 Weeks 4-5 41
PROBE Method
}Planned LOC (X)
Actual LOC (Y)
x
xx
x
x
x
Data points from weekly assignments
Linear regression
1Beta1 (slope)
Beta0 (y-intercept)
www.ischool.drexel.eduINFO636 Weeks 4-5 42
PROBE Method
• See “regression” handout for an example of calculating beta0 and beta1– Note that xi
2 means (xi2) not [(xi)]2
• When you use this, make sure the formulas are correct– ‘n’ changes each week as new data is created

www.ischool.drexel.eduINFO636 Weeks 4-5 43
PROBE Method
• Incidentally, if your estimates are always perfect, you’d have beta1 = 1, and beta0 = 0 (why?)
• Once you have beta0 and beta1, find:– New and Changed LOC (N) = beta0 +
beta1*(P + M)– It’s critical to note that later calculations
for prediction interval use ‘N’, not ‘P’

www.ischool.drexel.eduINFO636 Weeks 4-5 44
PROBE Method
• The expected size of the application after this project is– Total LOC (T) = N + B - D – M + R
• The Total New Reused is the sum of code flagged (with a *) in the New Objects section which are being reused– Don’t need to use this very often
www.ischool.drexel.eduINFO636 Weeks 4-5 45
PROBE Method
• Then we get to the Range calculation
• We have a refined estimate of the size of the system, but want to establish a prediction interval in which the real outcome is likely to fall– See the PSP_Calculation_Example.xls
spreadsheet

www.ischool.drexel.eduINFO636 Weeks 4-5 46
PROBE Method
• To find the Range, we start with a parameter from the ‘t’ distribution
• Called ‘t(/2, n-2)’ where /2 is the width of the prediction interval –
generally 70% or 90%– ‘n-2’ is the number of degrees of freedom;
again, ‘n’ is the number of data pairs– In Excel, use TINV(1 - /2, n - 2)
www.ischool.drexel.eduINFO636 Weeks 4-5 47
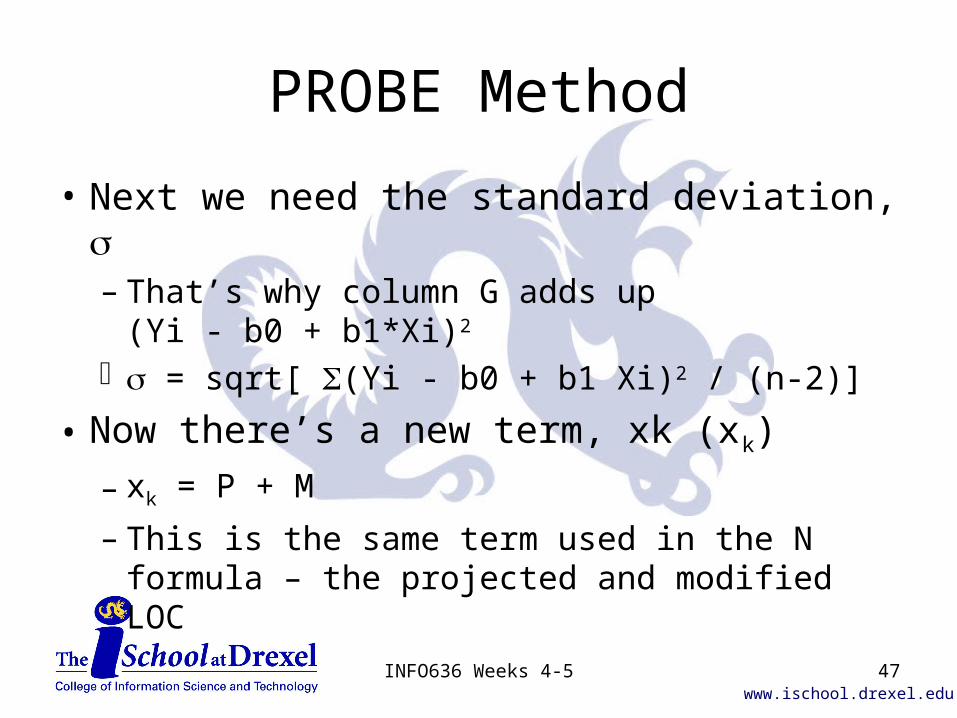
PROBE Method
• Next we need the standard deviation, – That’s why column G adds up
(Yi - b0 + b1*Xi)2
= sqrt[ (Yi - b0 + b1 Xi)2 / (n-2)]
• Now there’s a new term, xk (xk)
– xk = P + M
– This is the same term used in the N formula – the projected and modified LOC

www.ischool.drexel.eduINFO636 Weeks 4-5 48
PROBE Method
• Now use this to plug into formula 5.3 on page 124– I’m not going to copy it here – Notice in the spreadsheet the column H
calculation of (Xi - Xavg)**2which is also used to find the Range

www.ischool.drexel.eduINFO636 Weeks 4-5 49
PROBE Method
• Finally, find the Upper and Lower Prediction Intervals (UPI and LPI)– UPI = N + Range– LPI = N – Range
• The Prediction Interval Percent is either 70% or 90%, the value used to find ‘t’
www.ischool.drexel.eduINFO636 Weeks 4-5 50
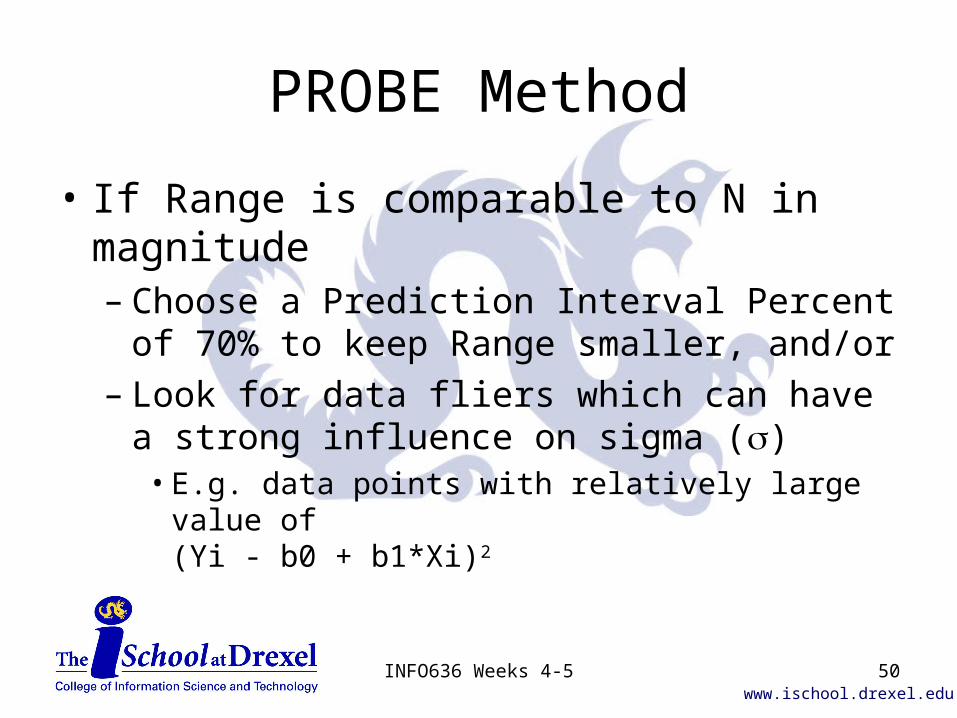
PROBE Method
• If Range is comparable to N in magnitude – Choose a Prediction Interval Percent of 70%
to keep Range smaller, and/or – Look for data fliers which can have a strong
influence on sigma ()• E.g. data points with relatively large value of
(Yi - b0 + b1*Xi)2
www.ischool.drexel.eduINFO636 Weeks 4-5 51
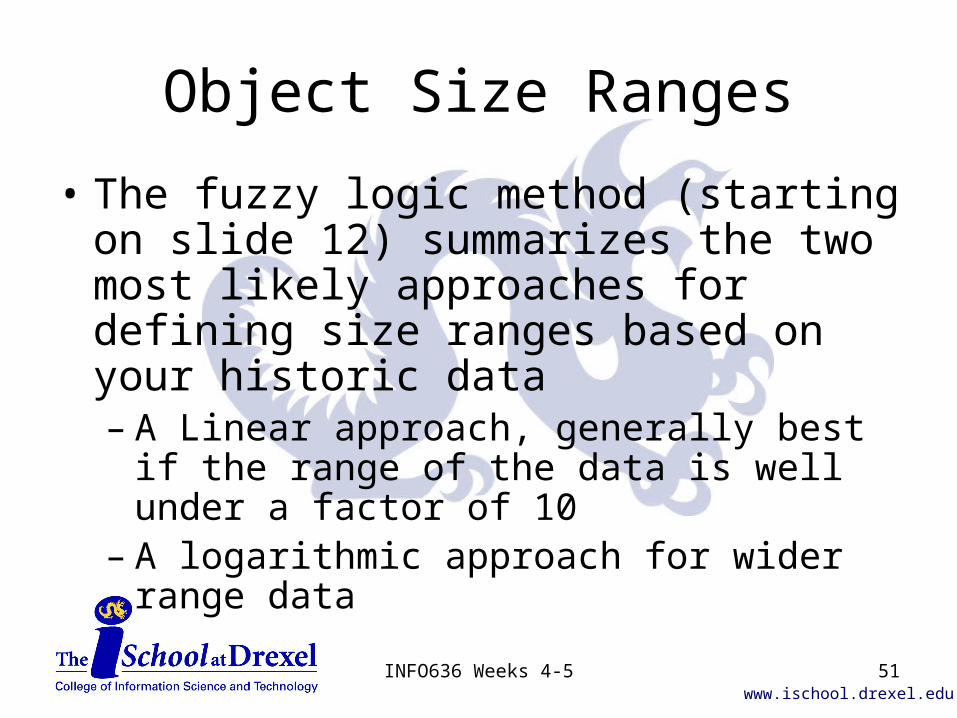
Object Size Ranges
• The fuzzy logic method (starting on slide 12) summarizes the two most likely approaches for defining size ranges based on your historic data– A Linear approach, generally best if the range
of the data is well under a factor of 10– A logarithmic approach for wider range data

www.ischool.drexel.eduINFO636 Weeks 4-5 52
Object Size Ranges
• If your work is following a true normal distribution, then your objects should have– 6.68% each in Very Small and Very Large
categories– 24.17% each in Small and Large categories– 38.30% in the Medium category
• It’s good to see if this holds

www.ischool.drexel.eduINFO636 Weeks 4-5 53
Object Size Ranges
• If your object size distribution is really skewed, you could– Reconsider the size categories– Look for better proxies– See if your design approach is leaning toward
very large or very small objects, or very inconsistent object sizes
www.ischool.drexel.eduINFO636 Weeks 4-5 54
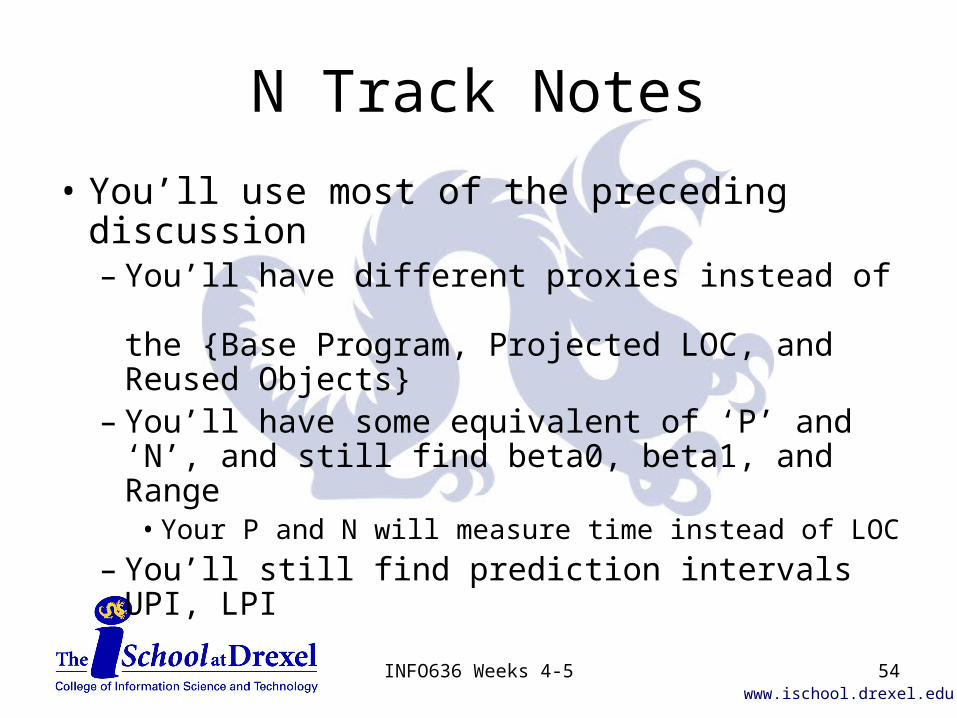
N Track Notes
• You’ll use most of the preceding discussion– You’ll have different proxies instead of
the {Base Program, Projected LOC, and Reused Objects}
– You’ll have some equivalent of ‘P’ and ‘N’, and still find beta0, beta1, and Range
• Your P and N will measure time instead of LOC
– You’ll still find prediction intervals UPI, LPI
www.ischool.drexel.eduINFO636 Weeks 4-5 55
Improving Estimation
• We tend to try to estimate many small things for a large task– The estimation errors tend to cancel each
other somewhat
• The PSP allows you to know what your estimation errors have been, and hence improve later estimates– Though that’s hard to see during the term

www.ischool.drexel.eduINFO636 Weeks 4-5 56
Improving Estimation
• As you follow this consistently, your values for beta0 and beta1 will tend to stabilize– Then you don’t have to keep recalculating
them!– If you get really weird beta0 and beta1, or
have no history yet, look at other options for refining your estimate, on page 679 (Table C35)

www.ischool.drexel.eduINFO636 Weeks 4-5 57
Improving Estimation
• On large projects, look for a consistent, and fairly low, level of abstraction– The conceptual design might need to be
refined to provide enough detail for a good estimate
– If a single object performs the work of many kinds of proxies, then it probably needs to be broken down

www.ischool.drexel.eduINFO636 Weeks 4-5 58
Improving Estimation
• Estimating products which have no precedent is really tough– Make sure the level of uncertainty is
clear to your customer
• Avoid overcompensating for your own history of errors– Make small changes in your approach
and try them for a while